Photobiology of Symbiodinium revisited: bio-physical and bio-optical signatures
17
REPORT Photobiology of Symbiodinium revisited: bio-physical and bio-optical signatures S. J. Hennige D. J. Suggett M. E. Warner K. E. McDougall D. J. Smith Received: 9 May 2008 / Accepted: 20 October 2008 / Published online: 16 November 2008 Ó Springer-Verlag 2008 Abstract Light is often the most abundant resource within the nutrient-poor waters surrounding coral reefs. Consequently, zooxanthellae (Symbiodinium spp.) must continually photoacclimate to optimise productivity and ensure coral success. In situ coral photobiology is becom- ing dominated by routine assessments using state-of-the-art non-invasive bio-optical or chlorophyll a fluorescence (bio- physical) techniques. Multiple genetic types of Symbiodi- nium are now known to exist; however, little focus has been given as to how these types differ in terms of char- acteristics that are observable using these techniques. Therefore, this investigation aimed to revisit and expand upon a pivotal study by Iglesias-Prieto and Trench (1994) by comparing the photoacclimation characteristics of dif- ferent Symbiodinium types based on their bio-physical (chlorophyll a fluorescence, reaction centre counts) and bio-optical (optical absorption, pigment concentrations) ‘signatures’. Signatures described here are unique to Sym- biodinium type and describe phenotypic responses to set conditions, and hence are not suitable to describe taxo- nomic structure of in hospite Symbiodinium communities. In this study, eight Symbiodinium types from clades and sub-clades (A–B, F) were grown under two PFDs (Photon Flux Density) and examined. The photoacclimation response by Symbiodinium was highly variable between algal types for all bio-physical and for many bio-optical measurements; however, a general preference to modifying reaction centre content over effective antennae-absorption was observed. Certain bio-optically derived patterns, such as light absorption, were independent of algal type and, when considered per photosystem, were matched by reaction centre stoichiometry. Only by better under- standing genotypic and phenotypic variability between Symbiodinium types can future studies account for the relative taxonomic and physiological contribution by Symbiodinium to coral acclimation. Keywords Symbiodinium Fluorescence Photosystem II Pigments Light absorption Introduction Symbiosis between the microalga Symbiodinium spp. and cnidarians enables an increase in productivity through a mutual exchange of growth-limiting nutrients (Falkowski et al. 1990). Photosynthesis by Symbiodinium produces organic matter that supplements host metabolism whilst inorganic nutrients excreted by the host in turn sustains photosynthesis (Muscatine 1990; Dubinsky and Berman- Frank 2001). Within nutrient-poor waters surrounding coral reefs, light is the most abundant resource available. Therefore, optimisation of photosynthesis by Symbiodini- um is crucial to the stability of this symbiosis and the ultimate success of corals. Given the importance of corals, both ecologically and economically (Moberg and Communicated by Environment Editor Prof. Rob van Woesik S. J. Hennige D. J. Suggett (&) D. J. Smith Coral Reef Research Unit, Department of Biological Sciences, University of Essex, Colchester, Essex CO4 3SQ, UK e-mail: [email protected] M. E. Warner College of Marine Studies, University of Delaware, 700 Pilottown Rd. Lewes, Delaware 19958, USA K. E. McDougall Environmental Research Institute, North Highland College, UHI Millennium Institute, Castle Street, Thurso, Caithness KW14 7JD, UK 123 Coral Reefs (2009) 28:179–195 DOI 10.1007/s00338-008-0444-x
Transcript of Photobiology of Symbiodinium revisited: bio-physical and bio-optical signatures

REPORT
Photobiology of Symbiodinium revisited: bio-physicaland bio-optical signatures
S. J. Hennige Æ D. J. Suggett Æ M. E. Warner ÆK. E. McDougall Æ D. J. Smith
Received: 9 May 2008 / Accepted: 20 October 2008 / Published online: 16 November 2008
� Springer-Verlag 2008
Abstract Light is often the most abundant resource
within the nutrient-poor waters surrounding coral reefs.
Consequently, zooxanthellae (Symbiodinium spp.) must
continually photoacclimate to optimise productivity and
ensure coral success. In situ coral photobiology is becom-
ing dominated by routine assessments using state-of-the-art
non-invasive bio-optical or chlorophyll a fluorescence (bio-
physical) techniques. Multiple genetic types of Symbiodi-
nium are now known to exist; however, little focus has
been given as to how these types differ in terms of char-
acteristics that are observable using these techniques.
Therefore, this investigation aimed to revisit and expand
upon a pivotal study by Iglesias-Prieto and Trench (1994)
by comparing the photoacclimation characteristics of dif-
ferent Symbiodinium types based on their bio-physical
(chlorophyll a fluorescence, reaction centre counts) and
bio-optical (optical absorption, pigment concentrations)
‘signatures’. Signatures described here are unique to Sym-
biodinium type and describe phenotypic responses to set
conditions, and hence are not suitable to describe taxo-
nomic structure of in hospite Symbiodinium communities.
In this study, eight Symbiodinium types from clades and
sub-clades (A–B, F) were grown under two PFDs (Photon
Flux Density) and examined. The photoacclimation
response by Symbiodinium was highly variable between
algal types for all bio-physical and for many bio-optical
measurements; however, a general preference to modifying
reaction centre content over effective antennae-absorption
was observed. Certain bio-optically derived patterns,
such as light absorption, were independent of algal type
and, when considered per photosystem, were matched
by reaction centre stoichiometry. Only by better under-
standing genotypic and phenotypic variability between
Symbiodinium types can future studies account for the
relative taxonomic and physiological contribution by
Symbiodinium to coral acclimation.
Keywords Symbiodinium � Fluorescence �Photosystem II � Pigments � Light absorption
Introduction
Symbiosis between the microalga Symbiodinium spp. and
cnidarians enables an increase in productivity through a
mutual exchange of growth-limiting nutrients (Falkowski
et al. 1990). Photosynthesis by Symbiodinium produces
organic matter that supplements host metabolism whilst
inorganic nutrients excreted by the host in turn sustains
photosynthesis (Muscatine 1990; Dubinsky and Berman-
Frank 2001). Within nutrient-poor waters surrounding
coral reefs, light is the most abundant resource available.
Therefore, optimisation of photosynthesis by Symbiodini-
um is crucial to the stability of this symbiosis and
the ultimate success of corals. Given the importance of
corals, both ecologically and economically (Moberg and
Communicated by Environment Editor Prof. Rob van Woesik
S. J. Hennige � D. J. Suggett (&) � D. J. Smith
Coral Reef Research Unit, Department of Biological Sciences,
University of Essex, Colchester, Essex CO4 3SQ, UK
e-mail: [email protected]
M. E. Warner
College of Marine Studies, University of Delaware,
700 Pilottown Rd. Lewes, Delaware 19958, USA
K. E. McDougall
Environmental Research Institute, North Highland College,
UHI Millennium Institute, Castle Street, Thurso,
Caithness KW14 7JD, UK
123
Coral Reefs (2009) 28:179–195
DOI 10.1007/s00338-008-0444-x
Folke 1999) much effort has been invested in attempting to
understand the photobiology of Symbiodinium both in ho-
spite in corals and in vitro (Iglesias-Prieto and Trench
1994, 1997; Gorbunov et al. 2001; Lesser 2004; Lesser and
Farrell 2004; Robison and Warner 2006). Consequently,
although this study is relevant for numerous cnidarian-
Symbiodinium studies, particular attention is drawn
towards the implications for coral–Symbiodinium research.
Conventional techniques for assessment of photobiology
confine many studies to the laboratory since measurements
require concentrations of material far in excess of that found
in nature. Symbiodinium spp. reside within the gastrodermis
of host corals and collection of the microalgae requires
destruction of the coral. To avoid such practices, researchers
have turned to unobtrusive optical-based approaches that
exploit (1) the absorption properties of whole corals (as
surface reflectance; Mazel 1997; Hochberg et al. 2006) or (2)
the fluorescence emission by photosystem II of Symbiodi-
nium (via active chlorophyll a fluorescence induction; Ralph
et al. 1999; Gorbunov et al. 2001). The latter is strictly a bio-
optical measurement but is often labelled as bio-physical
since it is based on the bio-physical processes that separate
light harvesting (absorption) from fluorescence (emission).
Florescence represents the efficiency of light transfer from
all light harvesting pigments to the core chlorophyll a mol-
ecule and the subsequent probability of excitons being
utilised for charge separation in the reaction centres or re-
emission as either heat or fluorescence through the antennae
bed (Falkowski and Raven 1997; Suggett et al. 2004).
Both bio-optical and bio-physical approaches are highly
attractive to coral research since measurements can be
made rapidly and conveniently in situ with the potential to
scale measurements up to remotely sensed platforms
(Kolber et al. 2005; Hochberg et al. 2006). Not surpris-
ingly, their application has grown, and continues to grow
rapidly, since the introduction of commercially available
diving-based spectrometers and induction fluorometers
10 years ago. However, despite this surge of interest, rel-
atively little research has been invested in ascertaining
whether photobiological (bio-optical and bio-physical)
signals are the same for all coral–Symbiodinium associa-
tions that exist in nature. Similarly, the basis for these
photobiological signals has received little attention. Con-
sequently, interpretation of these results when collected
across various environmental gradients remains highly
questionable, since the coral–Symbiodinium association
may change and the different Symbiodinium communities
(which are often unaccounted for) may have different
photobiological characteristics (Robison and Warner
2006). This paper specifically addresses the extent and
nature of the variability observed in these bio-optical and
bio-physical signals by focussing on photoacclimation,
which is relatively well studied in Symbiodinium.
Photoacclimation characteristics of Symbiodinium
Photoacclimation describes the phenotypic response of
algae to changes in the light environment (Falkowski and
LaRoche 1991) and occurs from alterations to a number of
components of the photosynthetic apparatus (Falkowski
and LaRoche 1991; MacIntyre et al. 2002). Light har-
vesting photosystems I (PSI) and II (PSII) each consist of
pigment–protein complexes coupled to reaction centre
(RC) complexes. Efficient transfer of light from the pig-
ment-proteins to the RCs is ensured through modification
of both the species and organisation of pigment (Falkowski
and Raven 1997; Suggett et al. 2007). However, excitation
pressure upon the photosystems can be further optimised
by altering the number of RC complexes in each photo-
system (Falkowski et al. 1981; Mauzerall and Greenbaum
1989). In both cases, the effective absorption of PSI (rPSI)
and PSII (rPSII) (the target ‘size’ for light interception
per unit RC, see Table 1) will change (Mauzerall and
Greenbaum 1989; Falkowski and Raven 1997; Suggett et al.
2007). Maximum photosynthesis, and hence productivity, is
dependent upon the efficiency of these mechanisms to
successfully capture and utilise light energy. Therefore,
photoacclimation can also induce alterations of cell size,
Rubisco content and total cellular carbon (Sukenik et al.
1987; Geider et al. 1998; MacIntyre et al. 2002).
Any one genotype of algae has an optimised environ-
mental range that results from evolutionary selective
pressure. However, algal communities in nature are rarely
composed of a single genotype (Medlin and Kaczmarska
2004) but instead represent a complex mix of species, each
of which is characterised by a specific phenotypic response
to environmental change (Suggett et al. 2007). Natural
assemblages of Symbiodinium are no exception. Nuclear
and chloroplast molecular markers have shown and con-
tinue to show that the genus Symbiodinium is characterised
by considerable genetic diversity, with the genus currently
split into eight major lineages or clades designated A
through H (Coffroth and Santos 2005). Evidence to date
suggests that reef forming corals contain a highly con-
served assemblage of symbionts which may contain more
than one Symbiodinium genetic type in some cases (Ulstrup
and van Oppen 2003; LaJeunesse et al. 2004a; Goulet
2006). Some flexibility to environmental change can be
ensured through ‘shuffling’ of the dominant zooxanthellae
type within the assemblage (Berkelmans and van Oppen
2006), which may yield discrete patterns of zonation for
Symbiodinium assemblages with depth (Iglesias-Prieto
et al. 2004; Warner et al. 2006) and across broad geo-
graphic scales within a single reef complex (Garren et al.
2006). However, the extent of Symbiodinium zonation
between corals and depths is also disputed, with some
studies finding little or no variability across a reef system
180 Coral Reefs (2009) 28:179–195
123

(Goulet 2006) with two of the most prevalent types
(Caribbean to Indo-Pacific), often types A and B (LaJeu-
nesse 2002; Baker 2003; Suggett et al. 2008).
Previous laboratory investigations have confirmed
photoadaptation amongst different Symbiodinium types
when grown under identical conditions (Chang et al. 1983;
Iglesias-Prieto and Trench 1994, 1997; Savage et al. 2002;
Rodriguez-Roman and Iglesias-Prieto 2005; Robison and
Warner 2006; Suggett et al. 2008). Most of these investi-
gations also demonstrated that a range of photoacclimatory
responses are observed at the ‘cladal’ level. Likewise, such
phenotypic plasticity to environmental change also appears
to extend to the intracladal level (Tchernov et al. 2004;
Robison and Warner 2006; Suggett et al. 2008). Of major
consequence is that optical-based measurements made in
situ across gradients of Symbiodinium genetic types may be
erroneously identified as acclimatory (phenotypically)
rather than natural adaptively (genetically) driven vari-
ability. Therefore, it is crucial that the taxonomic
variability of optical ‘signatures’ determined by the geno-
type of Symbiodinium present is characterised to accurately
interpret the response of coral photobiology to environ-
mental conditions, such as light availability, as either
genetic community changes (taxonomic) or phenotypic
responses.
The earlier work by Iglesias-Prieto and Trench (1994,
1997), which described photobiology for three Symbiodi-
nium types, was revisited with key additional techniques,
such as chlorophyll a fluorescence, which are highly rele-
vant to current in hospite Symbiodinium photoacclimation
studies. Bio-optical (optical absorption, pigment concen-
trations) and bio-physical (chlorophyll a fluorescence,
reaction centre counts) characteristics or ‘signatures’ for
eight Symbiodinium types from clades and sub-clades
Table 1 Table of terms, their definitions and their units
Terms Definition Units
Optical
E Excitation PFD of FIRe fluorometer lmol photons m-2 s-1
PFD Photon Flux Density lmol photons m-2 s-1
F730 Fluorescence excitation at 730 nm IU
F* Chlorophyll a-specific fluorescence excitation at 730 nm IU mg chl a-1
a(k) Optical absorption coefficient (k) m-1
a* (k) Chlorophyll a-specific optical absorption coefficient (k) m2 mg chl a-1
a*PSI (II) (k) Chlorophyll a-specific optical absorption coefficient (k) associated with PSI (II) m2 mg chl a-1
a* PSI (PSII) Effective a*PSII (I) (k) weighted to the spectra of the growth lamps m2 mg chl a-1
aTpig(k) Chlorophyll a-specific absorption spectra for all cellular pigments m2 mg chl a-1
aPSC Chlorophyll a-specific absorption spectra for all photosynthetic pigments weighted
to the excitation spectra of the FIRe fluorometer LEDs
m2 mg chl a-1
PSC Photosynthetic Carotenoids
PPC Photoprotectant Carotenoids
ai (k) In vivo weight-specific absorption coefficient m2 mg-1
ci Concentration of pigment i mg m-3
PI Packaging Index Dimensionless
Biophysical
PSI (II) Photosystem I (or II)
RCI (II) Reaction Centres associated with Photosystem I (or II)
Fo Minimum fluorescence Relative fluorescence
FmST (MT) Maximum fluorescence; Single Turnover or Multiple Turnover Relative fluorescence
Fv Variable fluorescence (Fm - Fo) Relative fluorescence
Fv/Fm Maximum photochemical quantum efficiency Dimensionless
Fo0 Minimum fluorescence under actinic light Relative fluorescence
F0 Fluorescence under actinic light Relative fluorescence
FmST0 (MT) Maximum fluorescence under actinic light; Single Turnover or Multiple Turnover Relative fluorescence
NPQ Non-photochemical quenching (Fm - Fm0)/Fm
0 Dimensionless
rPSII (I) Functional absorption cross section of PSII (I) A2 quanta-1
rPSII* Independent measure of absorption cross section of PSII (see Eq. 8) A2 quanta-1
rPSII0 Functional absorption cross section of PSII under ambient light A2 quanta-1
Coral Reefs (2009) 28:179–195 181
123

(A–B, F) grown under two PFDs (Photon Flux Density)
were examined to determine between-type variability.
These observations are discussed within the context of
(1) previous studies of Symbiodinium photoacclimation and
(2) how such adaptive variability may confound the inter-
pretation of photobiology when measured across gradients
of Symbiodinium types in nature. Ultimately, understanding
of this variability is crucial for future in hospite Symbiodi-
nium photoacclimation studies, which utilise methods
described here, since taxonomic shifts in the Symbiodinium
community may otherwise be misinterpreted as photoacc-
limation. Signatures described here are not definitive
identifiers of in hospite Symbiodinium types, but rather
demonstrate important functional similarities and dispari-
ties between algal types, crucial for future photoacclimation
studies.
Materials and methods
Growth, experimental conditions and sampling regime
Eight Symbiodinium strains designated by the internal tran-
scribed spacer 2 (ITS2) typing nomenclature (LaJeunesse
2001, 2002) as A1, A1.1, A2, A3, B1 (see Robison and
Warner 2006), B1*, B1** and F2 were grown as described
previously (Suggett et al. 2007, 2008). Briefly, cultures were
maintained in climate-controlled cabinets at 26�C on a 14:10
light: dark cycle at two photon flux densities (100 and
650 lmol photons m-2 s-1) as semi-continuous cultures in
2 l flasks of artificial seawater media ASP-8A (Provasoli
et al. 1957). Cultures were bubbled gently with air passed via
a carbon column to maintain constant pH (Suggett et al.
2008). Superscripts * and ** indicate types of B1 isolated
from a different hosts (Table 2) and were included to test
whether the same Symbiodinium type isolated from different
hosts would yield similar photobiology. Cells were moni-
tored by daily cells counts (Haemocytometer and Beckman
Coulter counter and size analyser) and minimum fluores-
cence, and harvested during exponential growth from
sequential generations. Samples were either used uncon-
centrated or concentrated gently by gravity filtration (see
Suggett et al. 2007).
Photosynthetic unit sizes
These are conventionally defined as the ratio of chlorophyll
a to either RCI or RCII (Suggett et al. 2007), and consid-
ered to be indicative of the concentration of functional
reaction centres (RCs), i.e. those that are capable of charge
separation and hence the release of an electron through the
electron transport chain (ETR) from absorbed photons.
Chlorophyll a (referred to as chl a in subsequent equations
and ratios) per RCII was determined from the product of
the Emerson & Arnold number, mol chl a (mol O2)-1, and
the minimum number of electron transfer steps required
to evolve 1 mol O2, an assumed constant of 0.25 mol O2
(mol RCII)-1, using an oxygen electrode and custom-made
LED array as described in Suggett et al. (2003, 2006).
Chlorophyll a per PSI was determined from redox changes
in P700 chlorophyll a as measured from a PAM 101
coupled with a Dual-Wavelength Emitter-Detector Unit
ED-P700DW (Suggett et al. 2007).
Optical light absorption and spectrofluorescence
A U-3000 spectrophotometer with / - 60 integrating
sphere (Hitachi) was used to determine sample optical
density as described in Suggett et al. (2007, 2008). For
spectrofluorometric measurements, DCMU was added to
the concentrated algal sample to yield a final concentration
of 30 mM to prevent oxidation of QA (quinine acceptor)
(see Suggett et al. 2004). Emission was measured at
730 nm with excitation at 1 nm intervals between 400 and
715 nm to yield a PSII-specific fluorescence excitation
spectrum (termed F730, Suggett et al. 2004, 2007). Sample
Table 2 Growth (l day-1) and chl a cell-1 (g cell-1 (Exp-13)) (±SE) for Symbiodinium types under LL (100 lmols photons m-2 s-1) and HL
(650 lmols photons m-2 s-1) including isolation origin of host species
Algal type Host Host origin Growth (l day-1) chl a cell-1 (g cell-1 (Exp-13))
LL HL LL HL
A1 Cassiopeia xamachana Florida 0.28 (0.03) 0.52 (0.05) 6.25 (0.70) 3.00 (0.82)
A1.1 Condylactis gigantea Jamaica 0.20 (0.04) 0.40 (0.05) 4.02 (0.02) 1.74 (0.36)
A2 Montastrea spp. Florida 0.22 (0.02) 0.46 (0.06) 6.56 (0.49) 1.13 (N/A)
A3 Tridacna maxima Palau 0.25 (0.03) 0.46 (0.04) 4.09 (0.62) 4.02 (0.55)
B1 Aiptasia pallida Bermuda 0.23 (0.03) 0.45 (0.03) 3.05 (0.09) 1.63 (0.88)
B1* Aiptasia puchella Hawaii 0.19 (0.03) 0.39 (0.04) 3.32 (0.65) 2.07 (0.29)
B1** Acropora spp. Aquarium (UK) 0.21 (0.02) 0.39 (0.03) 1.42 (0.19) 0.95 (0.10)
F2 Meandrina meandrites Jamaica 0.32 (0.04) 0.76 (0.06) 7.99 (0.61) 4.63 (1.15)
182 Coral Reefs (2009) 28:179–195
123
absorption (a, m-1) and emission at 730 nm (F730) were
normalised to chlorophyll a to yield a* (m2 mg chl a-1)
and F*(IU mg chl a-1). Chlorophyll a concentrations for
each sample concentrate were determined using a 4�C
methanol extraction measured spectrophotometrically,
since methanol is an effective extractor of chlorophyll
(Porra et al. 1989).
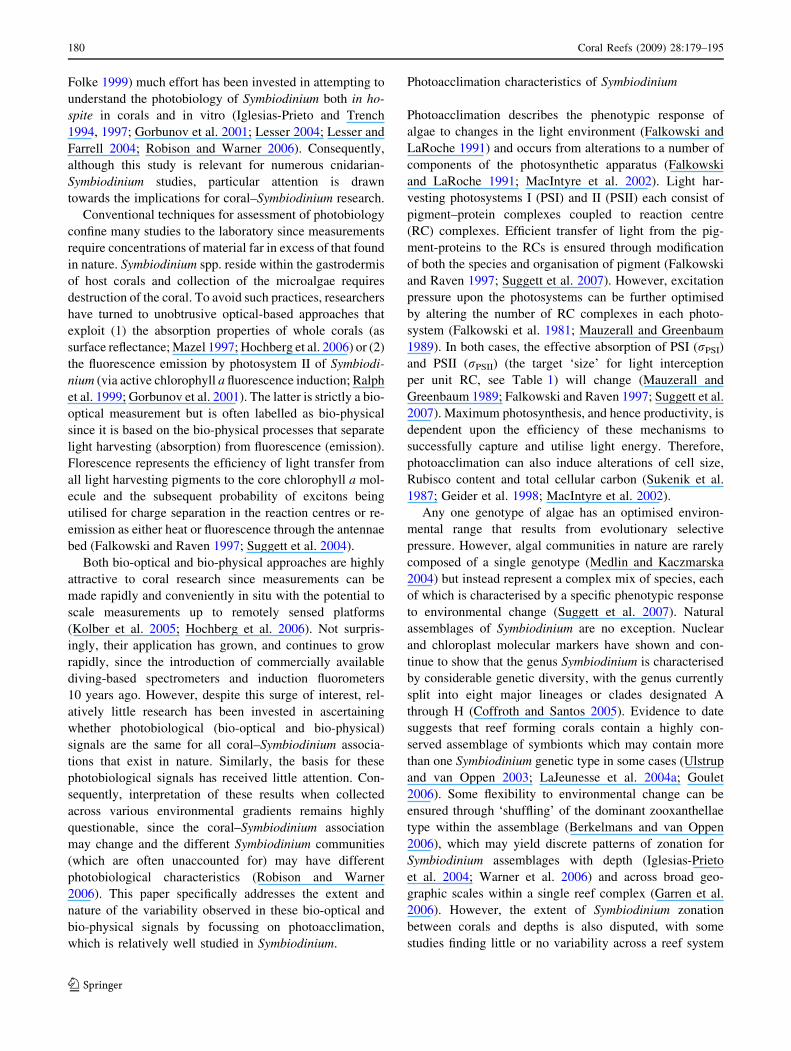
PSII fluorescence measurements
A Satlantic Inc. (Halifax, Canada) Fluorescence Induction
and Relaxation (FIRe) fluorometer was used to generate
single turnover (ST) and multiple turnover (MT) fluores-
cence transients (full fluorescence profiles over a pre-
determined time period (Fig. 1)) to characterise photosys-
tem II (PSII) photochemistry on unconcentrated algae as
described by Suggett et al. (2008). Briefly, the FIRe was
programmed to deliver acquisitions each comprising a 4-
step sequence analogous to the modified fast repetition rate
fluorescence technique of Kolber et al. (1998) (Fig. 1). The
4 steps included (1) a 100 ls ST excitation pulse, (2)
relaxation following the ST event from a weak modulated
light over 500 ms, (3) MT excitation from a 600 ms pulse
and (4) relaxation following the MT event over 1 s. Twenty
iterations of the 4-step sequence were averaged into a
single fluorescence transient to increase the signal-to-noise
ratio for each sample. Similarly, instrument gain was
modified so as to ensure that the MT fluorescence transient
was always ca. 70% of the saturating signal. FIRe sample
excitation was from high luminosity blue and green light
emitting diodes (450 nm and 500 nm peak emission,
respectively, with 30 nm bandwidth) with a combined
emission of ca. 0.03 mol photons m-2 s-1 (Suggett et al.
2008). Fluorescence emission was detected at 680 nm
(20 nm bandwidth) using a sensitive avalanche photodiode.
All FIRe measurements were performed in a climate-con-
trolled room that matched the temperature for growth
throughout.
Values of the minimum, maximum ST and maximum
MT fluorescence yields and the functional absorption cross
section of PSII (which describes the rise from minimum to
maximum fluorescence yields) were determined by fitting
the bio-physical (KPF) model of Kolber et al. (1998) to
each fluorescence transient using FIREPRO software pro-
vided by Satlantic Inc. Under dark-adapted conditions,
these parameters are termed Fo, FmST and Fm
MT (dimen-
sionless) and rPSII, respectively. Here, rPSII describes the
rise from Fo to FmST and is output in relative values. FIRe-
fluorescence transients were also collected under actinic
light exposure during light–response curves. These light–
response curves were performed on each sample, where
actinic PFDs between 5 and 500 lmols photons m-2 s-1
were delivered for periods of 4 mins using a calibrated
actinic light source (ALS, Satlantic Inc.) as detailed by
Suggett et al. (2008). Under actinic light, the analogous
fluorescence parameters are termed Fo0, Fm
ST0, FmMT0 and
rPSII0, respectively. To adjust values of effective absorption
to absolute values with units of A2 quanta-1, values here
were compared with those obtained from a calibrated FIRe
fluorometer (see Suggett et al. 2008). The maximum PSII
photochemical efficiency was determined as (Fm – Fo)/
FmST = Fv/Fm
ST or (Fm – Fo)/FmMT = Fv/Fm
MT following the
terminology of Kromkamp and Forster (2003). Non-photo-
chemical quenching, NPQ, was calculated as (FmST – Fm
ST0)/Fm
ST0, and informed of the quantum yield of non-photo-
chemical quenching (Gorbunov et al. 2001). Non-
linearities of the instrument response were determined for
each gain setting from an extract of chlorophyll a prior to
experimentation. Blanks were run on filtrates of each
sample. Both the instrument response and blank were
subtracted from the sample fluorescence transient at the
time of fitting the KPF model.
Pigments and packaging
Aliquots of dark-adapted samples from each culture
were collected and filtered through Whatman GF/F filters
and stored at -80�C (Suggett et al. 2003) for 4 months.
Filtrates were extracted in methanol with ultrasonifica-
tion (McDougall et al. 2006) and then centrifuged
to clarify. Subsequent HPLC analysis was performed
using an integrated Thermoseparations High-Performance
Liquid Chromatography (HPLC) system as described by
McDougall et al. (2006). Pigments were identified and
Time
Rel
ativ
e flu
ores
cenc
e yi
eld
(F/F
o)
1.0
1.5
2.0
2.5
Fo
FmST
FmMT
σ PS
II
(a) (b) (d)(c)
Fig. 1 Example of fluorescence induction trace using a FIRe
fluorometer. Fluorescence parameters of minimum fluorescence, Fo,
maximum fluorescence (single turnover) FmST, maximum fluorescence
multiple turnover FmMT, and effective cross-section absorption of PSII
(rPSII) are illustrated. Letters a–d refer to fluorescence induction
stages; (a) describes the rise in fluorescence following a 100 ls single
turnover (ST) event, (b) is the 500 ms relaxation stage following the
ST event, (c) is the fluorescence rise from a multiple turnover (MT)
flash over 600 ms and (d) is the relaxation stage following the MT
event over 1 s
Coral Reefs (2009) 28:179–195 183
123

quantified (mg m-3) via co-elution with pigment standards
for chlorophyll a, chlorophyll c2, peridinin, diadinoxanthin
(Dd), diatoxanthin (Dt) and b-carotene.
An absorption spectrum was reconstructed from the
HPLC pigment data according to Moore et al. (2005)
(Eq. 1), since reconstructed spectra provide absorption
where pigments are not packaged within the thylakoid
membranes; in contrast, optical absorption measured using
a spectrophotometer accounts for pigment packaging.
aTpig kð Þ ¼X
ai kð Þci ð1Þ
aTpig(k) accounts for the spectral absorption for all
pigments, ai (k) is the in vivo weight-specific absorption
coefficient and c is the concentration of each pigment
(i).Values for aTpig(k) were calculated using data for ai (k)
digitised from Levy et al. (2003), where chlorophyll a,
chlorophyll c2, peridinin, diadinoxanthin and diatoxanthin
were extracted from Symbiodinium spp. from Favia favus
and Plerogyra sinuosa. ai (k) for b-carotene was obtained
from Bidigare et al. (1990). Importantly, aTpig(k) does not
account for how pigments are packaged within the
thylakoid membranes; therefore, a pigment ‘Packaging
Index’ (PI) could be estimated from the ratio of absorption
determined optically (a*) and reconstructed from pigment
concentrations in vivo (aTpig)
PI ¼400700
Pa� kð Þ
400700
PaTpig kð Þ ð2Þ
Calculating PSII and PSI specific absorption
The wavelength-specific absorption cross section for PSII,
rPSII(k), was calculated according to Suggett et al. (2007),
whereby F* spectra were normalised according to the
corresponding value of rPSII measured by the FIRe at peak
excitation in the blue at 478 nm (Eq. 3)
rPSII kð Þ ¼ rPSIIð478Þ=F*(478)
� �� F* kð Þ ð3Þ
a*PSII (k) (m2 mg chl a-1) was then calculated using
wavelength-specific absorption as
a�PSII kð Þ ¼ rPSIIðkÞm2
mol RCII�mol RCII
mg chl a� 0:00675
� �� 1�Fv=FST
m
ð4Þ
where 1/Fv/FmST is used to account for the potential
absorption by non-photosynthetic pigments (Suggett
et al. 2007) and 0.00675 accounts for the conversion
of mol RCII mg chl a-1 to mol RCII mol chl a-1 and
rPSII from A2 quanta-1 to m2 mol RCII-1. a*PSI (k)
(m2 mg chl a-1) was calculated from the difference
between chlorophyll a-specific light absorption a* (k)
and a*PSII (k) (m2 mg chl a-1).
a� kð Þ ¼ a�PSII kð Þ þ a�PSI kð Þ ð5Þ
Chlorophyll a-specific absorption coefficients from 400 to
700 nm for both photosystems were then calculated by
weighting a*PSII (PSI) (k) to the spectrum of the lights used
for growth PFD as a*PSII (PSI) (m2 mg chl a-1) according to
Suggett et al. (2007), Eq. 6.
�a�PSIIðPSIÞ ¼P
a�PSIIðPSIÞ kð Þ � PFD kð ÞP
PFD kð Þ ð6Þ
The absorption coefficients for all photosynthetic
pigments, aPSC, were calculated by weighting the sum of
weight-specific absorption coefficients, (ai) to the FIRe LED
spectra and pigment concentrations (ci) for photosynthetic
pigments (Eq. 7). The product of aPSC, chl a: RCII and PI
was subsequently used to calculate an independent measure
of rPSII (rPSII*, Eq. 7) in m2 mol RCII-1, where 892500
accounts for the conversion of mol chl a: mol RCII to mg chl
a: mol RCII, 1/6023 for the conversion of m2 mol RCII-1 to
A quanta-1 and 1/2 for the assumption that absorption for
photosynthetic pigments is equal between photosystems.
rPSII� ¼P
ai kð Þ � ci kð Þ � EFIRe kð ÞPEFIRe kð Þ
� �� chl a
RCII� PI�
892500 � 1
6023� 12
ð7Þ
Statistical analysis
Heteroscadistic data and data deviating from a normal
distribution were transformed (log n ? 1, Zar 1996) prior
to statistical analyses. Analyses of variance (ANOVA)
were used to examine differences between multiple sample
means. One-way ANOVA was used followed by a Tukey
Post Hoc comparison. Pearson product-moment correla-
tions were used to analyse associations between variables
and linear regressions to predict pigment concentrations
from optical absorption.
Results
Growth
Algal type F2 exhibited the highest values for both the
growth rate (l day-1) and chl a cell-1 under LL growth
(Tables 2, 3). B1 algal types generally exhibited the lowest
l day-1 and chl a cell-1 under LL growth. Growth
increased and chl a cell-1 decreased between LL and HL
(Table 2) for all algal types by approximately a factor of 2.
A3 was an obvious exception, which exhibited a doubling
of growth with no corresponding decrease of chl a cell-1
with increased PFD.
184 Coral Reefs (2009) 28:179–195
123

Photosynthetic unit size and concentration
Values of photosynthetic unit ‘size’, chl a: RCII and chl a:
RCI were also highly variable with algal type (Table 4),
with statistical groupings not correlating with overall clade
type (Table 3). However, under LL, highest and lowest
values of both chl a: RCI and chl a: RCII were observed for
types F2 and A1, respectively. Under HL, most algal types
exhibited a decrease in chl a: RCII (mean across all types
ca. 20%); however, algal type A1.1. exhibited an increase
whilst type A2 exhibited no change in chl a: RCII. Changes
to chl a: RCI with increased growth PFD were also highly
variable between types, either increasing (A1.1), decreas-
ing (A2, B1, B1*, F2) or exhibiting little or no change (A1,
A3, B1**). Similarly, cellular quotas of both RCI and
RCIIs were highly variable between algal types, and under
HL, most types decreased cellular RC content. RCII cell-1
decreased by ca. 50% and RCI cell-1 by ca. 60%. F2 was
the only type to increase cellular RC content from LL to
HL. Consequently, RC stoichiometry of PSII to PSI (RCII:
RCI) did not vary in a consistent pattern for algal type or
growth PFD, even though mean values of chl a: RCI and
chl a: RCII across all algal types decreased by a similar
extent from LL to HL (ca. 20%) and the mean RC stoi-
chiometry was unchanged.
Pigment concentrations
Peridinin (per) followed by chloropyll c (chl c) were the
most abundant accessory pigments for all algal types
(compared to chlorophyll a) (Table 5). Since PI and cell
size influence absorption (Laurion et al. 2004; Moore et al.
2005), algal pigments were expressed relative to chloro-
phyll a to enable cross comparison between types.
Relatively little variability was observed (x% from the
mean) between algal types for any of the pigments under
LL; per: chl a (8.9 %), chl c: chl a (5.1 %), Dt ? Dd: chl a
(13.2 %), and b-carotene: chl a (7.8 %). Similarly, little
variability was observed under HL; per: chl a (15.1 %), chl
c: chl a (7.5 %), Dt ? Dd: chl a (12.5 %), and b-carotene:
chl a (11.4 %). However, significant variability was
observed in the de-epoxidation state (Dt/(Dd ? Dt)) of
algal types. Overall, no single pattern of variability was
evident amongst algal types for any pigments (Tables 3, 5).
The ratio of ‘photosynthetically active’ pigments (peridinin,
chlorophyll c) to chlorophyll a decreased whilst the ratio of
‘photoprotective’ pigments (diadinoxanthin, diatoxanthin,
b-carotene) increased between LL and HL growth condi-
tions. On average, across all clades, per: chl a and chl c: chl
a decreased by ca. 30% and 15% whilst Dt ? Dd: chl a and
b-carotene: chl a increased by ca. 35% from LL to HL. The
greatest increases of the de-epoxidation state with increased
growth PFD were observed for all types A and F2.Ta
ble
3S
tati
stic
alT
uk
eyg
rou
pin
gs
foll
ow
ing
AN
OV
As
of
all
Sym
bio
din
ium
typ
esfo
rm
easu
red
var
iab
les
un
der
LL
and
HL
Lo
wli
gh
tH
igh
lig
ht
Gro
wth
(ld
ay-
1)
F7,1
6=
4.6
2,
P\
0.0
05
(B1
*,
A1
.1,
B1
**
)(A
2,
B1
)(A
3)
(A1
,F
2)
F7,1
6=
4.6
2,
P\
0.0
05
(B1
*,
B1
**
)(A
1.1
)(B
1)
(A2
,A
3)
(A1
)(F
2)
chl
ace
ll-
1(g
cell
-1(e
xp
-13))
F7,1
6=
9.2
9,
P\
0.0
01
(B1
**
)(B
1,
B1
*,
A1
.1)
(A3
,A
1,
A2
)(F
2)
F7,1
4=
5.7
8,
P\
0.0
05
(B1
**
,A
2)
(B1
,A
1.1
,B
1*
,A
1,
A3
)(F
2)
chl
a:
RC
IIF
7,1
6=
3.9
3,
P\
0.0
5(A
1,
A1
.1)
(A2
,B
1*
*,
A3
,B
1*
,B
1)
(F2
)F
7,1
4=
4.1
2,
P\
0.0
5(F
2,
A1
,B
1)
(B1
**
,A
3,
A2
,B
1*
)(A
1.1
)
chl
a:
RC
IF
7,1
6=
38
.2,
P\
0.0
01
(A1
,A
1.1
,B
1,
A2
)(B
1*
*)
(A3
,B
1*
)(F
2)
F7,1
4=
6.1
6,
P\
0.0
05
(A2
,B
1,
A1
,A
1.1
)(B
1*
,B
1*
*)
(F2
,A
3)
RC
II:
RC
IF
7,1
6=
18
.7,
P\
0.0
01
(B1
)(B
1*
*,
A1
,A
1.1
,A
2)
(B1
*,
A3
)(F
2)
F7,1
4=
5.3
1,
P\
0.0
1(A
1.1
,B
1*
,A
2,
B1
)(A
1,
A3
,B
1*
*)
(F2
)
per
:ch
la
F7,1
6=
49
.2,
P\
0.0
01
(A1
.1)
(A1
,B
1*
*,
B1
*)
(B1
)(A
2,
A3
,F
2)
F7,1
4=
14
4,
P\
0.0
01
(A1
.1)
(B1
*,
B1
**
)(A
1,
B1
)(F
2)
(A2
,A
3)
chl
c:ch
la
F7,1
6=
40
.0,
P\
0.0
01
(A1
,A
1.1
,B
1)
(B1
**
,A
3,
B1
*,
A2
,F
2)
F7,1
4=
14
.5,
P\
0.0
01
(B1
*,
A1
.1,
B1
**
,A
1)
(B1
)(A
2,
F2
,A
3)
Dd
?D
t:ch
la
F7,1
6=
38
.67
,P
\0
.00
1(A
3,
F2
,A
2,
A1
,A
1.1
)(B
1)
(B1
*)
(B1
**
)F
7,1
4=
51
.3,
P\
0.0
01
(A1
,F
2,
A2
)(A
3)
(B1
*,
B1
,A
1.1
)(B
1*
*)
b-c
ar:
chl
aF
7,1
6=
7.3
4,
P\
0.0
01
(F2
)(A
2,
A3
,B
1,
B1
**
,B
1*
)(A
1)
(A1
.1)
F7,1
4=
19
.0,
P\
0.0
01
(A3
)(A
1,
A2
,F
2)
(A1
.1)
(B1
*,
B1
**
,B
1)
Dt/
(Dd
?D
t)F
7,1
6=
24
.7,
P\
0.0
01
(A1
,F
2)
(A2
,A
3,
B1
,A
1,1
)(B
1*
,B
1*
*)
F7,1
4=
37
.4,
P\
0.0
01
(B1
*,
F2
,B
1)
(B1
**
)(A
1,
A1
.1,
A3
)(A
2)
Fv/F
mST
F7,1
6=
59
.0,
P\
0.0
01
(B1
,B
1*
)(B
1*
*,
A1
.1,
A3
,F
2)
(A2
,A
1)
F7,1
6=
35
.8,
P\
0.0
01
(B1
)(B
1*
*,
B1
*,
A1
.1)
(A3
)(A
2,
F2
)(A
1)
rP
SII
F7,1
6=
15
.62
,P
\0
.00
1(F
2)
(A2
,A
1,
A1
.1)
(B1
,A
3)
(B1
*,
B1
**
)F
7,1
6=
3.8
1,
P\
0.0
5(A
1.1
,B
1*
)(B
1)
(F2
,A
1,
A2
)(A
3)
(B1
**
)
All
gro
up
sre
pre
sen
tst
atis
tica
lly
sim
ilar
typ
es,
incl
ud
ing
ov
erla
pp
ing
gro
up
s.G
rou
ps
and
ind
ivid
ual
typ
esar
eo
rder
edle
ftto
rig
ht
fro
mlo
wes
tto
hig
hes
td
ata
val
ues
Coral Reefs (2009) 28:179–195 185
123

Light absorption
Unfortunately, type F2 frequently formed aggregates, in
particular during the gravity filtration for concentrating
material thereby making all bio-optical measurements
problematic. Consequently, F2 data were omitted from the
bio-optical data sets.
Chlorophyll a-specific absorption, as determined from
both optical measurements and pigment reconstructions
(Eq. 1), was greatest in the blue–green region (450–525 nm)
Table 4 PSU size (chl a: RCII (I) (mol: mol)), cellular RC content (exp-19) and reaction centre stoichiometry (RCII: RCI, dimensionless)
(±SE) for all Symbiodinium types at LL and HL
Algal type chl a: RCII (mol: mol) chl a: RCI (mol: mol) RCII cell-1 RCI cell-1 RCII: RCI
Low light A1 392 (41.0) 775 (56.5) 17.9 9.13 1.96
A1.1 405 (9.73) 821 (61.6) 11.1 5.49 2.02
A2 453 (32.9) 1020 (41.8) 16.1 7.09 2.27
A3 513 (21.3) 1440 (60.0) 8.92 3.16 2.82
B1 590 (14.4) 983 (149) 5.79 3.47 1.67
B1* 557 (28.3) 1430 (60.0) 6.67 2.49 2.68
B1** 495 (144.8) 1010 (455) 31.9 16.4 1.94
F2 635 (48.7) 3536 (35.8) 14.1 2.51 5.62
Mean 505 1380 14.1 6.22 2.62
High light A1 323 (19.0) 854 (53.3) 10.4 3.94 2.64
A1.1 639 (35.2) 916 (4.40) 3.04 2.11 1.44
A2 454 (180) 650 (132) 6.95 3.78 1.84
A3 439 (50.4) 1390 (19.1) 10.2 3.51 2.91
B1 327 (51.8) 676 (182) 1.51 0.76 2.00
B1* 505 (20.8) 921 (63.4) 2.54 1.39 1.83
B1** 313 (63.0) 1124 (61.2) 2.97 0.79 3.78
F2 273 (20.3) 1274 (52.7) 18.9 4.01 4.71
Mean 409 976 7.06 2.53 2.64
Table 5 Pigment ratios (±SE) normalised to chlorophyll a for peridinin, chlorophyll c, diadinoxanthin ? diatoxanthin (Dd ? Dt), b-carotene
and Dt/(Dd ? Dt) for all Symbiodinium types at LL and HL
Algal type per: chl a chl c: chl a Dd ? Dt: chl a b-car: chl a Dt/(Dd ? Dt)
Low light A1 0.535 (0.010) 0.242 (0.003) 0.176 (0.011) 0.026 (0.001) 0.005 (0.000)
A1.1 0.418 (0.005) 0.250 (0.001) 0.188 (0.004) 0.028 (0.000) 0.019 (0.007)
A2 0.608 (0.003) 0.284 (0.001) 0.171 (0.009) 0.022 (0.001) 0.013 (0.002)
A3 0.621 (0.002) 0.279 (0.001) 0.165 (0.001) 0.022 (0.001) 0.013 (0.002)
B1 0.555 (0.006) 0.257 (0.002) 0.198 (0.003) 0.023 (0.000) 0.017 (0.002)
B1* 0.548 (0.013) 0.283 (0.002) 0.214 (0.006) 0.025 (0.000) 0.056 (0.004)
B1** 0.535 (0.021) 0.275 (0.004) 0.277 (0.004) 0.023 (0.001) 0.060 (0.006)
F2 0.658 (0.014) 0.289 (0.004) 0.166 (0.002) 0.021 (0.002) 0.005 (0.001)
Mean 0.560 0.270 0.194 0.024 0.024
High light A1 0.365 (0.011) 0.215 (0.002) 0.212 (0.003) 0.030 (0.002) 0.105 (0.010)
A1.1 0.265 (0.002) 0.207 (0.001) 0.287 (0.003) 0.034 (0.001) 0.120 (0.001)
A2 0.461 (n/a) 0.242 (n/a) 0.228 (n/a) 0.030 (n/a) 0.204 (n/a)
A3 0.470 (0.008) 0.255 (0.002) 0.260 (0.002) 0.026 (0.001) 0.136 (0.003)
B1 0.369 (0.007) 0.222 (0.011) 0.286 (0.003) 0.039 (0.001) 0.065 (0.008)
B1* 0.312 (0.001) 0.202 (0.002) 0.275 (0.004) 0.036 (0.001) 0.055 (0.001)
B1** 0.318 (0.003) 0.210 (0.003) 0.330 (0.007) 0.037 (0.001) 0.079 (0.001)
F2 0.406 (0.003) 0.245 (0.004) 0.213 (0.009) 0.030 (0.001) 0.058 (0.001)
Mean 0.365 0.215 0.212 0.030 0.105
186 Coral Reefs (2009) 28:179–195
123

(e.g. Fig. 2). Similarly, estimates of packaging using the PI
(Eq. 2) were highest (=PI lowest) at these wavelengths.
Packaging was lowest and highest for algal types B1 and A2,
respectively, and both the absorption coefficients and values
of PI typically increased from LL to HL by ca. 10% for most
algal types (Table 6). Notable exceptions to this general
trend were B1 types which exhibited minimal packaging at
either growth PFD.
Chlorophyll a-specific absorption coefficients at wave-
lengths of peak absorption (peridinin, k = 474 nm;
chlorophyll c, k = 446 nm; chlorophyll a k = 430 and
662 nm; diadinoxanthin, k = 448 nm; diatoxanthin, k =
454 nm) were compared between those measured optically
(a) and those reconstructed from pigment concentrations
(aTpig). Both coefficients were significantly correlated for
all pigment types (Table 7) suggesting that absorption
variability (Table 6) between types and growth PFD was
determined by variability of pigment content (Table 5).
Photosystem-specific absorption
Chlorophyll a-specific absorption (a*) was partitioned into
a* specific to PSI and PSII (Eqs. 4, 5). Typically, a*PSII
comprised ca. 50% and 75% of the total absorption (a*) at
the red chlorophyll a peak, ca. 680 nm, and in the blue
green region, 400–500 nm, respectively (Fig. 3b). The ratio
of a*PSII(k) to a*PSI(k) (weighted to the spectral quality of
light used for growth, a*PSII: a*PSI) was highest for type A3
and lowest for type A2 under LL growth (Table 6). All
values remained above 1 suggesting preferential absorption
by PSII throughout. A decrease of a*PSII: a*PSI was
observed for A1, A2 and B1* types between LL and HL by
Wavelength (nm)
450 500 550 600 650 700
Wavelength (nm)
400 450 500 550 600 650 700
a* (
m2 m
g ch
l a-1
)
0.00
0.01
0.02
0.03
0.04
0.05
0.06B1**B1*B1A1.1A3A1A2
(a) (b)Fig. 2 Optical absorption
normalised to chlorophyll a, a*
(m2 mg chl a -1), from 400 to
715 nm for all Symbiodiniumtypes except F2 under (a) LL
and (b) HL
Table 6 Packaging index (PI),
growth-spectra weighted
photosystem-specific absorption
coefficient stoichiometry
(a*PSII: a*PSI), absorption
coefficients from 400 to 700 nm
(a*(400–700)) and absorption per
cell a*(400–700) cell-1 (m2 cell-1
(exp-12)) (±SE) for all
Symbiodinium types at LL and
HL
Algal type Packaging index a*PSII: a*PSI a*(400–700)
m2 mg chl a-1a*(400–700) cell-1
(m2 cell-1 (exp-12))
Low light A1 0.75 1.967 0.0084 (0.0002) 5.30 (0.85)
A1.1 0.9 1.819 0.0092 (0.0005) 5.80 (2.52)
A2 0.63 1.476 0.0081 (0.0002) 7.08 (1.96)
A3 0.75 2.933 0.0092 (0.0001) 3.79 (0.61)
B1 0.98 1.497 0.0116 (0.0001) 3.46 (0.21)
B1* 1 2.043 0.0116 (0.0001) 3.82 (6.58)
B1** 1 2.153 0.0133 (0.0006) 1.83 (0.07)
F2 N/A N/A 0.0071 (0.0002) 3.62 (2.60)
Mean 0.859 1.984 0.0098 4.34
High light A1 1 1.157 0.0097 (0.0001) 2.94 (0.84)
A1.1 1 0.87 0.0113 (0.0001) 1.98 (0.44)
A2 0.7 0.86 0.0107 (0.0024) 1.91 (n/a)
A3 0.85 2.066 0.0092 (0.0003) 3.65 (0.30)
B1 1 2.110 0.0162 (0.0001) 4.33 (0.12)
B1* 1 1.016 0.0144 (0.0014) 1.65 (0.64)
B1** 1 2.749 0.0167 (0.0001) 1.38 (0.22)
F2 N/A N/A 0.0088 (0.0002) 4.03 (0.95)
Mean 0.936 1.546 0.0121 2.73
Coral Reefs (2009) 28:179–195 187
123

up to 50%. B1 and B1** were the only types that increased
a*PSII: a*PSI between light conditions. For types A1.1 and
A2, values of a*PSII: a*PSI decreased below a value of 1
suggesting preferential absorption to PSI at HL. These
changes of absorption between PSII and PSI were closely
matched by the simultaneous changes of RCII: RCI
(Fig. 4a), so algal types and growth conditions which
favoured more RCII than RCI content exhibited a greater
capacity for absorption by PSII.
The product of chlorophyll a-specific absorption (m2 mg
chl a-1) and the inverse of the PSU size (RC mol chl a-1)
was subsequently used to calculate the effective absorption
per RC (m2 mol RC-1) for PSI and PSII (Fig. 4b). Here,
changes in LL cultures were closely proportionate to 1:1
line, suggesting a balance of maintaining light harvesting
capacity per unit reaction centre between photosystems
throughout. However, at HL this balance decreased, with a
bias towards increased absorption per RCI. As demon-
strated in Fig. 4a, algal types with more RCII than RCI
content had a greater capacity for PSII absorption. To
further demonstrate this at the cellular level, PSII and PSI
absorption per cell was calculated from the product of
absorption per RC (m2 mol RCII-1) and RC per cell (mol
RCII cell-1, Fig. 4c). Clearly, absorption by PSII was
consistently higher than absorption by PSI at LL but not at
HL across these Symbiodinium types. At HL, most algal
types had higher absorption per cell by RCI thereby indi-
cating greater excitation of PSI under HL. The only two
exceptions were types A2 and A3 which had preferential
absorption cell-1 by PSII under HL (Fig. 4c).
Dark-adapted physiology
Measurements of Fv/FmST and rPSII were used to charac-
terise physiological state and to calculate the proportion of
absorption directed to PSII and PSI (Eq. 4). Under steady
Table 7 Regression equations for a (optical (m-1)) for pigments
characterised by Levy et al. (2003)a. P (m-1) denotes the predictor
(concentration of pigment (mg m-3) � pigment peak absorption
coefficient (m2 mg-1) � 50, to account for dilution factors between
variables)
Pigment Regression equation Test results
Chl ared 3.70 ? (0.44 * P) (96.8) P \ 0.001, F1,11 = 328
Chl ablue 24.9 ? (0.91 * P) (92.5) P \ 0.001, F1,11 = 137
Chl c 26.8 ? (2.54 * P) (86.8) P \ 0.001, F1,11 = 72.5
Diadinoxanthin 43.8 ? (1.41 * P) (72.0) P \ 0.001, F1,11 = 28.3
Diatoxanthin 72.9 ? (12.9 * P) (37.4) P = 0.026, F1,11 = 6.57
Peridinin 33.7 ? (0.64 * P) (78.8) P \ 0.001, F1,11 = 40.9
b-carotene 13.2 ? (1.32 * P) (89.9) a P \ 0.001, F1,11 = 98.1
chl ared denotes chlorophyll peak absorption in the red (662 nm)
region and chl ablue in the blue region (ca. 430 nm). r2 values are
superscripted in parentheses. ab-carotene peak absorption coefficients
were taken from Bigidare et al. (1990)
Wavelength (nm)
a * (
m2 m
g ch
l a-1
)
0.00
0.01
0.02
0.03
0.04
0.05
0.06
a* opticala*PSII optical
a* HPLC
Wavelength (nm)
Perc
enta
ge
0
20
40
60
80
100
Pack
agin
g In
dex
0.0
0.2
0.4
0.6
0.8
1.0
a*PSII % of a*
Packaging Index
(a) (b)
400 450 500 550 600 650 700 400 450 500 550 600 650 700
Fig. 3 a Optical and HPLC
reconstructed a* and aTpig*
(m2 mg chl a -1) from 400 to
715 nm. a*PSII of a*optical
shown as a dashed line. b a*PSII
expressed as a percentage total
of a*optical and packaging
index (PI) calculated from
pigment concentrations
*PS
I · R
CI
(m2 m
ol R
CI-1
) *
106
RCII: RCI0 1 2 3 4 5
0
1
2
3
4
5
LLHL
(PSII) m2 cell-1*10-120 2 4 6 8
(PSI
) m
2 cel
l-1*1
0-12
0
2
4
6
8
0 2 4 6 80
2
4
6
8
(a) (b) (c)
*PS
II:
*PS
I
* PSII · RCII (m2 mol RCII-1) * 106
Fig. 4 a Mean ratio of a*PSII: a*PSI against RCII: RCI. Average S.E.
LL 9%, HL 18%. b The product of chlorophyll a-specific absorption
(m2 mg chl a-1) and the inverse of the PSU size (RC mol chl a-1) for
PSI and PSII to give effective absorption per RC (m2 mol
RC-1(Exp 6)) with a 1:1 line included. c Results from (b) normalised
to RC cell-1 to give RC absorption per cell (m2 cell-1 (Exp -12))
188 Coral Reefs (2009) 28:179–195
123

state growth, values for both Fv/FmST and rPSII were highly
variable between algal type and growth PFD (Table 8). Fv/
FmST remained highest and lowest for types A1 and B1 at
both growth PFDs. Mean values for Fv/FmST and rPSII were
ca. 25% and 5% lower under HL than LL, respectively, but
magnitude of change was type-dependent and the statistical
groupings of both parameters were not identical under both
growth irradiances (Table 3). When Fv/FmST and growth
rates were compared, two general clusters (LL and HL)
existed from trends of increased Fv/FmST and decreased
growth under LL conditions, consistent with previous algal
studies (Robison and Warner 2006). However, at each
growth PFD, changes in Fv/FmST were independent of the
corresponding changes of growth rate between algal types
(Fig. 5a). This supports that variability of Fv/FmST was dri-
ven by adaptive differences and not by differences in
nutrient availability between cultures, since trends
observed between algal types at either growth PFD should
be matched when compared across both growth PFDs.
Similarly, Fv/FmST, which is indicative of RCII activity, did
not negatively correlate with changes in rPSII (Pearson
correlation = 0.001, P = 0.998), a pattern that would be
expected in response to nutrient limitation (Kolber et al.
1988) (Fig. 5b). Measurements of Fv/Fm derived from the
single turnover induction measurements were compared to
Fv/Fm derived from the multiple turnover induction (also
measured by the FIRe (Fig. 1)). Values of Fv/FmMT were
very strongly correlated with those of Fv/FmST (Pearson
correlation = 0.962, P \ 0.001), but were consistently
higher by ca. 15% (Fig. 5c).
Values of rPSII are determined by the concentration,
type and intracellular arrangement of pigments, as well as
RCII concentration (Suggett et al. 2004). An independent
measure of rPSII was calculated using Eq. 7 as rPSII*.
When compared with rPSII, all algal types and growth
conditions yielded values of rPSII* that accounted for ca.
53% of the variability expressed in rPSII (Fig. 5d). In
general, HL and LL data were clustered but some overlap
was observed.
Physiology under the growth irradiance
NPQ was determined from fluorescence yields measured
during the actinic light–response curve at the PFD corre-
sponding to that used for growth. All PFDs from the light-
response curve were spectrally corrected to growth cabinet
spectra (Suggett et al. 2008). At LL, all algal types had
little NPQ, whereas at HL, NPQ was variable between
types. Changes in NPQ did not correlate with changes in
rPSII consistently between low and high light (Fig. 6a).
Values of rPSII were also compared with the de-epoxida-
tion state of xanthophyll pigments (Fig. 6b), where an
increase in Dt/(Dd ? Dt) (and hence increased Dt relative
to Dd) equated to an increase in non-photochemical
quenching, as more diadinoxanthin had been de-epoxidated
to diatoxanthin. Similar clustering of LL and HL algal
types was observed when rPSII was compared to NPQ and
to Dt/(Dd ? Dt).
In part, the lack of co-variability between rPSII and the
de-epoxidation state of xanthophyll pigments may reflect
that dark-adapted measures of rPSII may not account for
additional rapid mechanisms that act to quench PFD.
Therefore, values of rPSII at PFDs which corresponded to
the algal growth irradiance (rPSII0) were normalised
against dark-adapted values, as rPSII0/rPSII. This provides
a specific measure of antennae-bed non-photochemical
quenching (Gorbunov et al. 2001, Suggett et al. 2007). In
this case, two clusters were formed dependent on growth
irradiance; LL algal types had low antennae-bed
quenching (high rPSII0/rPSII) and low NPQ/de-epoxidation
state of xanthophyll pigments, whereas HL types had high
antennae-bed quenching (low rPSII0/rPSII) and increased
NPQ or Dd de-epoxidation. HL algal types exhibited
substantial antennae-bed quenching variability (Fig. 6b,
c), but this variability significantly correlated with the de-
epoxidation of xanthophyll pigments for both growth
irradiances (Pearson’s correlation = -0.594, P \ 0.05)
suggesting that increased antennae-bed quenching likely
occurred under high growth PFD, and was directly
determined by the potential of xanthophyll cycling via de-
epoxidation.
Discussion
Symbiodinium photoacclimation strategy
Substantial variability was observed between algal type
and growth PFD for almost every bio-optical and
Table 8 Maximum Single Turnover PSII photochemical efficiency
(Fv/FmST) (±SE) and effective cross-section absorption of PSII (r PSII)
for all Symbiodinium types at LL and HL
Algal type Low light High light
Fv/FmST r PSII Fv/Fm
ST r PSII
A1 0.54 (0.03) 410 (10.0) 0.42 (0.02) 405 (7.88)
A1.1 0.46 (0.02) 411 (13.3) 0.32 (0.03) 378 (5.69)
A2 0.53 (0.02) 406 (10.2) 0.38 (0.02) 400 (6.9)
A3 0.46 (0.03) 463 (0.67) 0.35 (0.02) 434 (21.4)
B1 0.33 (0.02) 450 (8.51) 0.26 (0.02) 372 (18.0)
B1* 0.39 (0.02) 490 (13.3) 0.32 (0.01) 378 (2.03)
B1** 0.44 (0.03) 511 (30.8) 0.31 (0.02) 423 (7.75)
F2 0.48 (0.02) 258 (33.2) 0.37 (0.02) 397 (6.67)
Mean 0.45 425 0.34 403
Coral Reefs (2009) 28:179–195 189
123

bio-physical measurement suggesting adaptive differences
for regulating light harvesting machinery. Several photo-
acclimation strategies inherent to light harvesting are
known to exist for microalgae (Falkowski and Owens
1980; Falkowski and Raven 1997; Suggett et al. 2007):
cells can preferentially favour a change either of compo-
nents comprising the light harvesting antennae (PSU size)
or of the reaction centre pool size (PSU content) available
for processing harvested light (Falkowski and Owens 1980;
Six et al. 2008). The ‘choice’ of strategy varies for different
microalgal species (summarised in Suggett et al. 2007) but
is thought to reflect nutrient and light availability (Moore
et al. 2006; Six et al. 2008). Ultimately, the two predom-
inant strategies lead to significant changes in the antennae
size or RCII content, respectively, and so have recently
been termed r-versus n-type acclimation (Iglesias-Prieto
and Trench 1994; Suggett et al. 2007; Six et al. 2008).
Symbiodinium spp. were previously shown to modify their
RCs in response to a change in light environment (Iglesias-
Prieto and Trench 1994), but the magnitude of RC change
and the primary photosystem modified varied with Sym-
biodinium type. This same variability of ‘strategy’ applied
here both within algal types (types A) and for the same
algal type at the intracladal level (e.g. B1) (Table 3).
Predominance of the ‘‘n-type’’ strategy amongst
Symbiodinium would suggest the role of a generalist algal
strategy for algae which are subject to varying light
intensities and are not nutrient limited (Six et al. 2008).
Modifying RC concentrations over antennae size is bene-
ficial under conditions liable to cause photoinhibition, such
as high light (as experienced on reef flats by corals), by
enabling a ‘compensatory effect’ within cells to increase
electron turnover rates in non-photoinhibited RCs to
maintain maximum photosynthetic rate (Behrenfeld et al.
1998; Kana et al. 2002). However, some types investigated
here (B1 types and the F2 isolate) also exhibited a r-type
acclimation strategy (compared to other types, ca 15–30%
change in rPSII between growth PFDs), in addition to an
n-type strategy. Of course, there might be an advantage to
Symbiodinium types that are able to utilise both strategies,
that is to maximise photoacclimatory ability under variable
light conditions (n-type) and to potentially lower energetic
costs (r-type) under more stable light regimes (Six et al.
2008). Such differences in strategy may provide some
adaptive reasoning for niche separation amongst Symbi-
odinium types, which has been demonstrated to occur
(Futuyma and Moreno 1988; Iglesias-Prieto and Trench
1997; LaJeunesse 2002; LaJeunesse et al. 2004a; Sampayo
Growth (µ day−1)
0.1 0.2 0.3 0.4 0.5 0.6
0.2 0.3 0.4 0.5 0.6
Fv/F
mS
T
0.2
0.3
0.4
0.5
0.6LLHL
Fv /FmMT
Fv/F
mS
T
0.2
0.3
0.4
0.5
0.6
σPSII
σ PS
II*
200
400
600
800
σPSII
350 400 450 500 550
350 400 450 500 550F
v/F
mS
T
0.2
0.3
0.4
0.5
0.6
(b)(a)
(d)(c)
Fig. 5 (a) A comparison
between Fv/FmST and growth
under LL and HL, (b) rPSII
against Fv/FmST (c) a comparison
of Fv/Fm measured using ST and
MT techniques from the FIRe
fluorometer and (d) rPSII
measured fluorometrically
against an independent
assessment of the effective
cross-section absorption, rPSII*
190 Coral Reefs (2009) 28:179–195
123

et al. 2007). However, in order to assess advantages and
disadvantages of both acclimation strategies fully, other
factors such as Symbiodinium cell size and cost-benefit
analysis specific to the host-Symbiodinium symbiosis need
to be considered.
Of key importance from the results was the observation
for preferential absorption of cellular RCII over RCI at LL,
but preferential absorption of RCI at HL. Previous data
have shown that genetic variants of Emiliania huxleyii
balance absorption between photosystems despite differ-
ences in acclimation ‘strategy’ (Suggett et al. 2007).
However, most Symbiodinium types here clearly differ
between growth PFD; the observed preferential absorption
of PSI cell-1 under HL conditions (Fig. 4c) may be a form
of photoprotection, by increasing cyclic electron transport
around PSI (Warner and Berry-Lowe 2006), as cyclic
electron transport around PSI may be important in devel-
oping non-photochemical quenching (NPQ) (Munekaga
et al. 2004). This is complemented by recent evidence that
in some Symbiodinium there is a link between light har-
vesting complex dissociation from PSII and increased
cyclic electron transport around PSI under bleaching
conditions (Reynolds et al. 2008).
Antennae bed variability
The data clearly demonstrated that reaction centre stoichi-
ometry co-varied with light absorption stoichiometry. RCII
content was one of the major factors that regulated the
antennae size in many algae (Iglesias-Prieto and Trench
1994) and consequently also likely accounted for much of
the variability of rPSII (Fig. 5d). However, only ca. 50% of
rPSII variability was accounted for by the independent
measure of rPSII, rPSII* (Fig. 5d). The use of Eq. 7 to derive
rPSII* is limited by the assumption that aPSC is equal between
photosystems. This is not the case for many Symbiodinium
types and consequently rPSII can be overestimated because
of the assumption that aPSC is split equally between photo-
systems (Eq. 7). However, this may not be the case for all
Symbiodinium types (Reynolds et al. 2008). Pigment type
and packaging also act to drive variability of the antennae
size. Whilst these pigment-driven modifications to the
antennae bed size may not be as important for photoaccli-
mation in Symbiodinium as RC content, changes to the
pigment profile and packaging were still observed across
algal types. When rPSII was compared to both NPQ and the
de-epoxidation of xanthophyll pigments, two general
0.00 0.05 0.10 0.15 0.20 0.25400
500
600
700
800
900
1000
1100
0 1 2 3 4
σ PSII
(gro
wth
)
400
500
600
700
800
900
1000
1100
NPQ (Fm -Fm' / Fm')
0 1 2 3 4
σ PSII '(
grow
th)
/ σPS
II
0.4
0.6
0.8
1.0
Low LightHigh Light
Dt / (Dd + Dt)
0.00 0.05 0.10 0.15 0.20 0.25
0.4
0.6
0.8
1.0
(a) (b)
(c) (d)
Fig. 6 NPQ calculated at
growth irradiance and the de-
epoxidation state of xanthophyll
pigments compared to rPSII,
weighted to low and high light
growth spectra (panels a and b,
respectively), and antennae-bed
quenching (rPSII0/rPSII)
measured at growth irradiance
(c and d)
Coral Reefs (2009) 28:179–195 191
123

clusters according to algal growth PFD were observed
(Fig. 6a, b), where low light had lower non-photochemical
quenching (according to both NPQ and Dt/(Dd ? Dt) than at
HL. However, the variability expressed in the de-epoxida-
tion of xanthophyll pigments between algal types was not
matched by rPSII variability (Fig. 6b), which again illus-
trates how antennae size is driven by multiple factors so that
rPSII values may not necessarily correlate with any one
driving factor, such as the proportion of photoprotective
pigments or even PSU size. When rPSII was used to calculate
antennae-bed quenching, rPSII0/rPSII (Gorbunov et al. 2001),
the de-epoxidation state of xanthophyll pigments (and NPQ)
was generally matched by rPSII0/rPSII, meaning that anten-
nae-bed quenching, and its modification under different
growth irradiances, needs to be considered when using rPSII
to infer changes in PSU efficiencies. The change in photo-
synthetic and non-photosynthetic pigments per chlorophyll a
between growth PFDs was also consistent with previous
microalgae observations (Harris et al. 2005; Suggett et al.
2007), where the decrease in photosynthetic pigments (PSC)
relative to photoprotectant pigments (PPC) acts to reduce
excitation energy cascading to the RCs, ultimately pre-
venting photodamage at high light.
All types also followed the general trend of decreased
packaging (increased PI) under high light, consistent with
other Symbiodinium and microalgae studies where a
decline in chlorophyll a and photosynthetic accessory
pigments (from increased irradiance) can ultimately reduce
packaging (Harris et al. 2005; Robison and Warner 2006;
Suggett et al. 2007). Low packaging is also associated with
smaller microalgal cells (Laurion et al. 2004) but Symbi-
odinium cell size remained relatively constant (ca. 4.5 lm
diameter). Given that Symbiodinium absorption increased
between LL and HL, cell size showed little variability and
that packaging was relatively low for most types (at both
light levels) data here suggests that the contribution of
spectrally averaged packaging between types to light
absorption was low, but dependent on algal type.
One of the key results was in demonstrating that the
variability of pigment concentration could largely account
for the variability of optical absorption and was indepen-
dent of algal type or environmental growth conditions
(Tables 5, 6, 7). Data here are consistent with previous
studies, which examined absorption or reflectance in rela-
tion to pigment content across a wide variety of corals
(Hochberg et al. 2006; Apprill et al. 2007). Differences
observed between pigments with regard to their relation-
ship with absorption may be explained by different
packaging between pigments (Harris et al. 2005; Robison
and Warner 2006), hence data here confirm that zooxan-
thellae absorption can be confidently ‘reconstructed’ from
pigment concentrations alone without the need for knowl-
edge of Symbiodinium taxonomic composition.
PSII fluorescence
As with previous investigations that have grown Symbi-
odinium isolates under nutrient replete conditions,
measurements of Fv/Fm in this study varied widely between
types (Tchernov et al. 2004; Robison and Warner 2006).
Differences in media type may account for discrepancies
between data for algal types here and for Tchernov et al.
(2004) (Rodriguez-Roman and Iglesias-Prieto 2005).
Importantly, taxonomic regulation of Fv/Fm reduces the
confidence with which this parameter can be used as a
gauge of environmental response without having full
knowledge of the in hospite community structure of Sym-
biodinium. Since Fv/Fm of in hospite Symbiodinium changes
over light gradients driven by depth and turbidity (Hennige
et al. 2008), it is crucial to account for Symbiodinium
community structure when assessing photoacclimation over
environmental gradients using genetic techniques.
In cultured Symbiodinium studies, variability in Fv/Fm
consistent with observations here were reported in A1,
A1.1, B1 and F2 by Robison and Warner (2006). These
authors measured Fv/Fm using an MT protocol (Fv/FmMT),
and thus yielded values that were typically ca. 15–25%
higher than measures of Fv/FmST in this study, a trend con-
sistent in the comparison of FIRe-based measures of Fv/FmST
and Fv/FmMT. This relationship between Fv/Fm measured
using ST or MT protocols provides a clear demonstration
that Fv/Fm can be readily inter-converted between proto-
cols. However, similar comparisons are still warranted for
comparing Fv/Fm generated from different commercially
available instruments, such as the Diving PAM and FRR.
Environmental versus taxonomic variability
Where variability exists between algal types, the question
is whether genetic variability is larger than that observed
between environmental conditions. This is particularly
important when studying photobiology of corals under
different environmental conditions, such as light environ-
ment, as the algal community may not be constant
(LaJeunesse and Trench 2000; LaJeunesse et al. 2004b; van
Oppen et al. 2005; Warner et al. 2006).
Bio-optical descriptions of microalgal photobiology are
well documented, in particular, for pigmentation and
absorption (Dubinsky et al. 1986; Berner et al. 1989;
MacIntyre et al. 2002). Various studies have previously
determined pigment ratios and optical absorption spectra
for Symbiodinium both in hospite (Enriquez et al. 2005;
Stambler and Dubinsky 2005) and grown in culture
(Dustan 1979; Falkowski et al. 1990; Iglesias-Prieto et al.
1991). However, these reports are hard to compare since
growth conditions such as light and nutrition, which are
known to modify optical characteristics (Dubinsky et al.
192 Coral Reefs (2009) 28:179–195
123

1990; Apprill et al. 2007), vary substantially both between
in hospite studies and between in hospite and cultured
studies.
As a group, changes in bio-optical properties (for exam-
ple pigment concentrations (Table 3)) were usually greater
in response to environmental change (LL and HL) than
variability expressed between Symbiodinium types. All
Symbiodinium types have a taxonomic contribution to their
bio-optical signature but modification between different
light environments acts to ‘dial out’ this variability. Clearly,
some parameters (such as a*) can be used with confidence to
assess acclimation of Symbiodinium types in in situ studies,
regardless of whether the genetic signal of the assemblage
changes. In clear contrast to the bio-optical signatures,
variability in bio-physical signatures between Symbiodini-
um types was often equal to or greater than change between
growth conditions. This of course creates difficulty in using
bio-physical signatures, for example Fv/Fm and rPSII, to
identify acclimation in Symbiodinium assemblages between
growth PFDs without identifying the genetic type.
It is notable that B1 Symbiodinium is considered a
‘‘generalist’’ symbiont on many Caribbean reefs, residing
in several different host taxa across a wide light/depth
range while there tends to be a predominance in clade A
Symbiodinium distribution towards shallow water locations
(LaJeunesse 2002; Warner et al. 2006). With regard to
host-Symbiodinium specificity, Symbiodinium genetic var-
iability may thus reflect how different coral species may
ultimately provide a unique environment for their associ-
ated Symbiodinium through modification of pigmentation
(Apprill et al. 2007), light scatter by the skeleton (Enriquez
et al. 2005) and through resources available to the algae
(Falkowski et al. 1993; Rodriguez-Roman and Iglesias-
Prieto 2005). At present, the understanding of coral–Sym-
biodinium specificity and the benefits to a host of being
adapted to harbour certain algal types that will inevitably
exhibit different photobiology is poor (Lesser and Farrell
2004; Suggett et al. 2008). A systematic set of experiments
including cultured and in hospite Symbiodinium types
would be needed to address this.
In summary, substantial taxonomic variability was
demonstrated to underlie the photobiological characteris-
tics of Symbiodinium. In spite of this variability, general
features are maintained across Symbiodinium as a species,
in particular, greater change of RC content over size for
acclimating to different light conditions. However, the
underlying reasons for this ‘choice’ of strategy are not
clear. Although signatures reported here cannot be used to
assess in hospite Symbiodinium community composition,
the demonstrated adaptive variability between types high-
lights the potential of using chlorophyll a fluorescence, in
conjunction with genetic identification (ITS2), to assay the
phenotypic and taxonomic responses of in hospite
Symbiodinium populations to environmental changes.
Coupled with host-algae specificity and the role of the host
to modify the light environment, it is not surprising that
certain coral species are more suited to certain environ-
ments than others. Future eco-physiological studies will
have to consider all these aspects to draw meaningful
ecological conclusions, but by using a combined bio-
physical and bio-optical approach, coupled with knowledge
of Symbiodinium taxonomic composition, future studies
will have powerful tools to assess bio-physical and bio-
optical responses, to ultimately determine the contribution
of Symbiodinium types to coral photoacclimation.
Acknowledgements The authors wish to thank Phil Davey and
Maxim Gorbunov for technical support of the growth facilities and
FIRe, respectively. This manuscript was greatly improved by com-
ments from two anonymous reviewers and Robert van Woesik. This
work was funded through a National Environmental Research Council
postdoctoral fellowship to DJS, a NERC studentship to SJH, High-
lands and Islands Enterprise (The Scottish Funding Council) and
European Regional Development Funding to KEM, and a National
Science Foundation grant (IOB 544765) to MEW.
References
Apprill AM, Bidigare RR, Gates RD (2007) Visibly healthy corals
exhibit variable pigment concentrations and symbiont pheno-
types. Coral Reefs 26:387–397
Baker AC (2003) Flexibility and specificity in coral-algal symbiosis:
diversity, ecology and biogeography of Symbiodinium. Annual
Review of Ecology Evolution and Systematics 34:661–689
Behrenfeld MJ, Prasil O, Kolber ZS, Babin M, Falkowski PG (1998)
Compensatory changes in Photosystem II electron turnover rates
protect photosynthesis from photoinhibition. Photosynth Res
58:259–268
Berkelmans R, van Oppen MJH (2006) The role of zooxanthellae in
the thermal tolerance of corals: a ‘nugget of hope’ for coral reefs
in an era of climate change. Proc R Soc Lond B Biol Sci
273:2305–2312
Berner T, Dubinsky Z, Wyman K, Falkowski PG (1989) Photoadap-
tation and the package effect in Dunaliella-Tertiolecta(Chlorophyceae). J Phycol 25:70–78
Bidigare RR, Ondrusek ME, Morrow JH, Kiefer DA (1990) In vivo
absorption properties of algal pigments. In: Spinrad RW (ed)
Ocean Optics X (Proceedings Volume 1302). SPIE, Bellingham,
pp 290–302
Chang SS, Prezelin BB, Trench RK (1983) Mechanisms of photo-
adaptation in three strains of the symbiotic dinoflagellate
Symbiodinium microadriaticum. Mar Biol 76:219–229
Coffroth MA, Santos SR (2005) Genetic diversity of symbiotic
dinoflagellates in the genus Symbiodinium. Protist 156:19–34
Dubinsky Z, Berman-Frank I (2001) Uncoupling primary production
from population growth in photosynthesizing organisms in
aquatic ecosystems. Aquat Sci 63:4–17
Dubinsky Z, Falkowski PG, Wyman K (1986) Light harvesting
and utilization by phytoplankton. Plant Cell Physiol 27:1335–
1349
Dubinsky Z, Stambler N, Benzion M, McCloskey LR, Muscatine L,
Falkowski PG (1990) The effect of external nutrient resources on
the optical-properties and photosynthetic efficiency of Stylopho-ra-Pistillata. Proc R Soc Lond, B 239:231–246
Coral Reefs (2009) 28:179–195 193
123

Dustan P (1979) Distribution of zooxanthellae and photosynthetic
chloroplast pigments of the reef-building coral Montastrea-Annularis Ellis and Solander in relation to depth on a West-
Indian coral-reef. Bull Mar Sci 29:79–95
Enriquez S, Mendez ER, Iglesias-Prieto R (2005) Multiple scattering
on coral skeletons enhances light absorption by symbiotic algae.
Limnol Oceanogr 50:1025–1032
Falkowski PG, LaRoche J (1991) Acclimation to spectral irradiance
in algae. J Phycol 27:8–14
Falkowski PG, Owens TG (1980) Light-shade adaptation; two
strategies in marine-phytoplankton. Plant Physiol 66:592–595
Falkowski PG, Raven JA (1997) Aquatic photosynthesis. Blackwell
Science, Oxford
Falkowski PG, Owens TG, Ley AC, Mauzerall DC (1981) Effects
of growth irradiance levels on the ratio of reaction centers
in 2 species of marine-phytoplankton. Plant Physiol 68:969–
973
Falkowski PG, Jokiel PL, Kinzie RA III (1990) Irradiance and corals.
In: Dubinsky Z (ed) Coral reefs ecosystems of the world.
Elsevier Science Publication, Amsterdam, pp 89–107
Falkowski PG, Dubinsky Z, Muscatine L, McCloskey L (1993)
Population-control in symbiotic corals. Bioscience 43:606–611
Futuyma DJ, Moreno G (1988) The evolution of ecological special-
ization. Annu Rev Ecol Syst 19:207–233
Garren M, Walsh SM, Caccone A, Knowlton N (2006) Patterns of
association between Symbiodinium and members of the Mon-tastraea annularis species complex on spatial scales ranging
from within colonies to between geographic regions. Coral Reefs
25:503–512
Geider RJ, MacIntyre HL, Kana TM (1998) A dynamic regulatory
model of phytoplanktonic acclimation to light, nutrients, and
temperature. Limnol Oceanogr 43:679–694
Gorbunov MY, Kolber ZS, Lesser MP, Falkowski PG (2001)
Photosynthesis and photoprotection in symbiotic corals. Limnol
Oceanogr 46:75–85
Goulet TL (2006) Most corals may not change their symbionts. Mar
Ecol Prog Ser 321:1–7
Harris GN, Scanlan DJ, Geider RJ (2005) Acclimation of Emilianiahuxleyi (Prymnesiophyceae) to photon flux density. J Phycol
41:851–862
Hennige SJ, Smith DJ, Perkins R, Consalvey M, Paterson DM,
Suggett DJ (2008) Photoacclimation, growth and distribution of
massive coral species in clear and turbid waters. Mar Ecol Prog
Ser 369:77–88
Hochberg EJ, Apprill AM, Atkinson MJ, Bidigare RR (2006) Bio-
optical modeling of photosynthetic pigments in corals. Coral
Reefs 25:99–109
Iglesias-Prieto R, Trench RK (1994) Acclimation and adaptation to
irradiance in symbiotic dinoflagellates. 1. Responses of the
photosynthetic unit to changes in photon flux-density. Mar Ecol
Prog Ser 113:163–175
Iglesias-Prieto R, Trench RK (1997) Acclimation and adaptation to
irradiance in symbiotic dinoflagellates. II. Response of chloro-
phyll-protein complexes to different photon-flux densities. Mar
Biol 130:23–33
Iglesias-Prieto R, Govind NS, Trench RK (1991) Apoprotein
composition and spectroscopic characterization of the water-
soluble peridinin chlorophyll alpha-proteins from 3 symbiotic
dinoflagellates. Proc R Soc Lond, B 246:275–283
Iglesias-Prieto R, Beltran VH, LaJeunesse TC, Reyes-Bonilla H,
Thome PE (2004) Different algal symbionts explain the vertical
distribution of dominant reef corals in the eastern Pacific. Proc R
Soc Lond, B 271:1757–1763
Kana R, Lazar D, Prasil O, Naus J (2002) Experimental and
theoretical studies on the excess capacity of photosystem II.
Photosynth Res 72:271–284
Kolber Z, Zehr J, Falkowski P (1988) Effects of growth irradiance and
nitrogen limitation on photosynthetic energy-conversion in
photosystem-II. Plant Physiol 88:923–929
Kolber ZS, Prasil O, Falkowski PG (1998) Measurements of variable
chlorophyll fluorescence using fast repetition rate techniques:
defining methodology and experimental protocols. Biochim
Biophys Acta Bioenerg 1367:88–106
Kolber Z, Klimov D, Ananyev G, Rascher U, Berry J, Osmond B
(2005) Measuring photosynthetic parameters at a distance: laser
induced fluorescence transient (LIFT) method for remote
measurements of photosynthesis in terrestrial vegetation. Photo-
synth Res 84:121–129
Kromkamp JC, Forster RM (2003) The use of variable fluorescence
measurements in aquatic ecosystems: differences between
multiple and single turnover measuring protocols and suggested
terminology. Eur J Phycol 38:103–112
LaJeunesse TC (2001) Investigating the biodiversity, ecology, and
phylogeny of endosymbiotic dinoflagellates in the genus Sym-biodinium using the ITS region: In search of a ‘‘species’’ level
marker. J Phycol 37:866–880
LaJeunesse TC (2002) Diversity and community structure of symbi-
otic dinoflagellates from Caribbean coral reefs. Mar Biol
141:387–400
LaJeunesse TC, Trench RK (2000) Biogeography of two species of
Symbiodinium (Freudenthal) inhabiting the intertidal sea anem-
one Anthopleura elegantissima (Brandt). Biol Bull 199:126–134
LaJeunesse TC, Thornhill DJ, Cox EF, Stanton FG, Fitt WK, Schmidt
GW (2004a) High diversity and host specificity observed among
symbiotic dinoflagellates in reef coral communities from Hawaii.
Coral Reefs 23:596–603
LaJeunesse TC, Bhagooli R, Hidaka M, DeVantier L, Done T,
Schmidt GW, Fitt WK, Hoegh-Guldberg O (2004b) Closely
related Symbiodinium spp. differ in relative dominance in coral
reef host communities across environmental, latitudinal and
biogeographic gradients. Mar Ecol Prog Ser 284:147–161
Laurion I, Blouin F, Roy S (2004) Packaging of mycosporine-like
amino acids in dinoflagellates. Mar Ecol Prog Ser 279:297–303
Lesser MP (2004) Experimental biology of coral reef ecosystems. J
Exp Mar Biol Ecol 300:217–252
Lesser MP, Farrell JH (2004) Exposure to solar radiation increases
damage to both host tissues and algal symbionts of corals during
thermal stress. Coral Reefs 23:367–377
Levy O, Dubinsky Z, Achituv Y (2003) Photobehavior of stony
corals: responses to light spectra and intensity. J Exp Biol
206:4041–4049
MacIntyre HL, Kana TM, Anning T, Geider RJ (2002) Photoaccli-
mation of photosynthesis irradiance response curves and
photosynthetic pigments in microalgae and cyanobacteria. J
Phycol 38:17–38
Mauzerall D, Greenbaum NL (1989) The absolute size of a
photosynthetic unit. Biochim Biophys Acta 974:119–140
Mazel CH (1997) Diver-operated instrument for in situ measurement
of spectral fluorescence and reflectance of benthic marine
organisms and substrates. Opt Eng 36:2612–2617
McDougall KE, Gibb SW, Boyd KG, Brown BE (2006) ‘Chlorophyll-
like’ compounds as novel biomarkers of stress in corals. Mar
Ecol Prog Ser 325:137–144
Medlin LK, Kaczmarska I (2004) Evolution of the diatoms: V.
Morphological and cytological support for the major clades and
a taxonomic revision. Phycologia 43:245–270
Moberg F, Folke C (1999) Ecological goods and services of coral reef
ecosystems. Ecol Econ 29:215–233
Moore CM, Lucas MI, Sanders R, Davidson R (2005) Basin-scale
variability of phytoplankton bio-optical characteristics in rela-
tion to bloom state and community structure in the Northeast
Atlantic. Deep-Sea Res Part I 52:401–419
194 Coral Reefs (2009) 28:179–195
123
Moore CM, Suggett DJ, Hickman AE, Kim YN, Tweddle JF, Sharples
J, Geider RJ, Holligan PM (2006) Phytoplankton photoacclima-
tion and photoadaptation in response to environmental gradients
in a shelf sea. Limnol Oceanogr 51:936–949
Munekaga Y, Hashimoto M, Miyaka C, Tomizawa KI, Endo T,
Tasaka M, Shikanai T (2004) Cyclic electron flow around
photosystem I is essential for photosynthesis. Nature 429:
579–582
Muscatine L (ed) (1990) The role of symbiotic algae in carbon and
energy flux in reef corals. Elsevier Science Publishing Company,
Amsterdam
Porra RJ, Thompson WA, Kriedemann PE (1989) Determination of
accurate extinction coefficients and simultaneous-equations for
assaying chlorophyll-a and chlorophyll-b extracted with 4
different solvents - verification of the concentration of chloro-
phyll standards by atomic-absorption spectroscopy. Biochim
Biophys Acta 975:384–394
Provasoli L, McLaughlin JJA, Droop MR (1957) The development of
artificial media for marine algae. Arch Mikrobiol 25:392–428
Ralph PJ, Gademann R, Larkum AWD, Schreiber U (1999) In situ
underwater measurements of photosynthetic activity of coral
zooxanthellae and other reef-dwelling dinoflagellate endos-
ymbionts. Mar Ecol Prog Ser 180:139–147
Reynolds JM, Bruns BU, Fitt W, Schmidt GW (2008) Enhanced
photoprotection pathways in symbiotic dinoflagellates of shal-
low-water corals and other cnidarians. Proc Natl Acad Sci USA
105:13674–13678
Robison JD, Warner ME (2006) Differential impacts of photoaccli-
mation and thermal stress on the photobiology of four different
phylotypes of Symbiodinium (Pyrrhophyta). J Phycol 42:568–
579
Rodriguez-Roman A, Iglesias-Prieto R (2005) Regulation of photo-
chemical activity in cultured symbiotic dinoflagellates under
nitrate limitation and deprivation. Mar Biol 146:1063–1073
Sampayo EM, Franceschinis L, Hoegh-Guldberg O, Dove S (2007)
Niche partitioning of closely related symbiotic dinoflagellates.
Mol Ecol 16:3721–3733
Savage AM, Trapido-Rosenthal H, Douglas AE (2002) On the
functional significance of molecular variation in Symbiodinium,
the symbiotic algae of Cnidaria: photosynthetic response to
irradiance. Mar Ecol Prog Ser 244:27–37
Six C, Finkel ZV, Rodriguez F, Marie D, Partensky F, Campbell DA
(2008) Contrasting photoacclimation costs in ecotypes of the
marine eukaryotic picoplankter Ostreococcus. Limnol Oceanogr
53:255–265
Stambler N, Dubinsky Z (2005) Corals as light collectors: an
integrating sphere approach. Coral Reefs 24:1–9
Suggett DJ, Oxborough K, Baker NR, MacIntyre HL, Kana TM,
Geider RJ (2003) Fast repetition rate and pulse amplitude mod-
ulation chlorophyll a fluorescence measurements for assessment
of photosynthetic electron transport in marine phytoplankton.
Eur J Phycol 38:371–384
Suggett DJ, MacIntyre HL, Geider RJ (2004) Evaluation of biophys-
ical and optical determinations of light absorption by
photosystem II in phytoplankton. Limnol Oceanogr 2:316–332
Suggett DJ, Moore CM, Maranon E, Omachi C, Varela RA, Aiken J,
Holligan PM (2006) Photosynthetic electron turnover in the
tropical and subtropical Atlantic Ocean. Deep-Sea Res Part II
53:1573–1592
Suggett DJ, Le Floc’H E, Harris GN, Leonardos N, Geider RJ (2007)
Different strategies of photoacclimation by two strains of
Emiliania huxleyi (Haptophyta). J Phycol 43:1209–1222
Suggett DJ, Warner ME, Smith DJ, Davey P, Hennige SJ, Baker NR
(2008) Photosynthesis and production of hydrogen peroxide by
Symbiodinium (Pyrrhopyta) phylotypes with different thermal
tolerances. J Phycol 44:948–956
Sukenik A, Bennett J, Falkowski P (1987) Light-saturated photosyn-
thesis - limitation by electron-transport or carbon fixation.
Biochim Biophys Acta 891:205–215
Tchernov D, Gorbunov MY, de Vargas C, Yadav SN, Milligan AJ,
Haggblom M, Falkowski PG (2004) Membrane lipids of
symbiotic algae are diagnostic of sensitivity to thermal bleaching
in corals. Proc Natl Acad Sci USA 101:13531–13535
Ulstrup KE, van Oppen MJH (2003) Geographic and habitat
partitioning of genetically distinct zooxanthellae (Symbiodinium)
in Acropora corals of the Great Barrier Reef. Mol Ecol 12:3477–
3484
van Oppen MJH, Mieog JC, Sanchez CA, Fabricius KE (2005)
Diversity of algal endosymbionts (zooxanthellae) in octocorals:
the roles of geography and host relationships. Mol Ecol
14:2403–2417
Warner ME, Berry-Lowe S (2006) Differential xanthophyll cycling
and photochemical activity in symbiotic dinoflagellates in
multiple locations of three species of Caribbean coral. J Exp
Mar Biol Ecol 339:86–95
Warner ME, LaJeunesse TC, Robison JD, Thur RM (2006) The
ecological distribution and comparative photobiology of symbi-
otic dinoflagellates from reef corals in Belize: Potential
implications for coral bleaching. Limnol Oceanogr 51:1887–
1897
Zar JH (1996) Biostatistical analysis, 3rd edn. Prentice-Hall Inc, N.J
Coral Reefs (2009) 28:179–195 195
123