Fortification of curry powder with NaFe(1 11)EDTA in an iron ...
8
162 Am J Clin Nuir l989;49:162-9. Printed in USA. © 1989 American Society for Clinical Nutrition Fortification of curry powder with NaFe(1 1 1 )EDTA in an iron-deficient population: report of a controlled iron-fortification ,2 Daynia E Ballot, A Patrick MacPhail, Thomas H Bothwell, Mary Gillooly, and Fatima G Mayet ABSTRACT A targeted, double-blind controlled iron fortification trial using Fe(1 1 1)- EDTA in masala (curry powder) was directed towards an Fe-deficient Indian population for 2 y. The Fe status ofthe fortified group improved more than that of control subjects. Improve- ment reached significance over control subjects for females in hemoglobin (p = 0.0005), fern- tin (p = 0.0002), and body Fe stores (p = 0.001) and for males in ferritin (p = 0.04). The prevalence of Fe-deficiency anemia (IDA) decreased from 22 to 5% in fortified females. Pre- menopausal women, multipara women, and women with prolonged menstruation or initial IDA benefitted most from fortification. The mean increase in body Fe stores in females with initial IDA was 9.0 ± 1.3 mmol, representing an increased absorption of 12 imol/d. Fortified subjects with normal Fe status did not accumulate excessive body Fe and there was no alter- ation in serum Zn concentrations. Targeted fortification is a safe and effective means of corn- batting Fe deficiency. Am J Clin Nutr l989;49: 162-9. KEY WORDS Iron fortification, Fe(1 1 1)EDTA, iron nutrition, controlled trial Introduction Iron deficiency is a major nutritional problem affect- ing 500-600 million people throughout the world (1). The major causative factor is the poor availability of di- etary Fe in the largely cereal-based diets that are the sta- ple foodstuffs in many developing countries (2). Strate- gies for combatting Fe deficiency depend on its etiology and severity (3). These include the identification and treatment ofindividual patients, the control of parasites, improved sanitation, Fe supplementation, and Fe forti- fication (4). Of these strategies fortification of a basic foodstuff is the cheapest to initiate and maintain, is the most effective means of reaching the largest number of people, and is the best long-term approach to the correc- tion of Fe deficiency (4-6). In addition it is possible to target fortification to high-risk groups by selecting vehi- des that are consumed almost exclusively by a particular segment ofthe population (7). In the present study a fortification trial was conducted under field conditions using masala (curry powder) forti- fled with NaFe( 1 1 1)EDTA in a South African popula- tion of Indian descent that was shown to have a high prevalence ofFe deficiency (8). Subjects and methods Subjects Two hundred and sixty-four families, comprising 984 mdi- viduals from a subeconomic housing area in Chatsworth, near Durban, took part in the study. Participants were required to use only the masala supplied and to give an annual 15-mL blood sample. Demographic data ofrelevance to Fe status were collected at the start of the study. Children aged < 10 y were excluded because it was felt that there might be problems in obtaining repeated blood samples from them. Forty-five mdi- viduals with a hemoglobin (Hb) of 90 g/L were referred for investigation and treatment and excluded from the study. The initial survey of Fe status and relevant demographic data were documented separately (8). Sample size The size ofthe initial sample was determined on the supposi- tion that a rise in the mean Hb concentration of5 g/L (d) could be considered biologically significant. This corresponds to a net gain of 1 mmol Fe in a 55-kg woman. Assuming a SD of 13 g/L, a confidence coefficient of9S% (Za = 1.96), and a proba- bility of 90% that the expected difference can be detected (Z3 = 1.282), the sample size (n) can be calculated by (9) I From the Joint University/MRC Iron and Red Cell Metabolism Unit, Department ofMedicine, University ofthe Witwatersrand Medi- cal School, Johannesburg and the Department ofMedicine, University ofNatal, Durban, South Africa. 2 Address reprint requests to TH Bothwell, Department of Medi- cine, University of the Witwatersrand, Medical School, York Road, Parktown 2 193, South Africa. Received October 20, 1987. Accepted for publication January 27, 1987. at PENNSYLVANIA STATE UNIV PATERNO LIBRARY on May 12, 2016 ajcn.nutrition.org Downloaded from
-
Upload
khangminh22 -
Category
Documents
-
view
0 -
download
0
Transcript of Fortification of curry powder with NaFe(1 11)EDTA in an iron ...

162 Am J Clin Nuir l989;49:162-9. Printed in USA. © 1989 American Society for Clinical Nutrition
Fortification of curry powder with NaFe(1 1 1 )EDTA in aniron-deficient population: report of a controllediron-fortification �,2
Daynia E Ballot, A Patrick MacPhail, Thomas H Bothwell, Mary Gillooly, and Fatima G Mayet
ABSTRACT A targeted, double-blind controlled iron fortification trial using Fe(1 1 1)-EDTA in masala (curry powder) was directed towards an Fe-deficient Indian population for 2
y. The Fe status ofthe fortified group improved more than that of control subjects. Improve-ment reached significance over control subjects for females in hemoglobin (p = 0.0005), fern-
tin (p = 0.0002), and body Fe stores (p = 0.001) and for males in ferritin (p = 0.04). Theprevalence of Fe-deficiency anemia (IDA) decreased from 22 to 5% in fortified females. Pre-menopausal women, multipara women, and women with prolonged menstruation or initialIDA benefitted most from fortification. The mean increase in body Fe stores in females withinitial IDA was 9.0 ± 1.3 mmol, representing an increased absorption of 12 �imol/d. Fortified
subjects with normal Fe status did not accumulate excessive body Fe and there was no alter-ation in serum Zn concentrations. Targeted fortification is a safe and effective means of corn-
batting Fe deficiency. Am J Clin Nutr l989;49: 162-9.
KEY WORDS Iron fortification, Fe(1 1 1)EDTA, iron nutrition, controlled trial
Introduction
Iron deficiency is a major nutritional problem affect-ing 500-600 million people throughout the world (1).The major causative factor is the poor availability of di-etary Fe in the largely cereal-based diets that are the sta-ple foodstuffs in many developing countries (2). Strate-gies for combatting Fe deficiency depend on its etiologyand severity (3). These include the identification andtreatment ofindividual patients, the control of parasites,improved sanitation, Fe supplementation, and Fe forti-fication (4). Of these strategies fortification of a basicfoodstuff is the cheapest to initiate and maintain, is themost effective means of reaching the largest number ofpeople, and is the best long-term approach to the correc-tion of Fe deficiency (4-6). In addition it is possible to
target fortification to high-risk groups by selecting vehi-des that are consumed almost exclusively by a particularsegment ofthe population (7).
In the present study a fortification trial was conductedunder field conditions using masala (curry powder) forti-fled with NaFe( 1 1 1)EDTA in a South African popula-tion of Indian descent that was shown to have a highprevalence ofFe deficiency (8).
Subjects and methods
Subjects
Two hundred and sixty-four families, comprising 984 mdi-viduals from a subeconomic housing area in Chatsworth, near
Durban, took part in the study. Participants were required touse only the masala supplied and to give an annual 15-mLblood sample. Demographic data ofrelevance to Fe status werecollected at the start of the study. Children aged < 10 y wereexcluded because it was felt that there might be problems inobtaining repeated blood samples from them. Forty-five mdi-viduals with a hemoglobin (Hb) of � 90 g/L were referred forinvestigation and treatment and excluded from the study. Theinitial survey of Fe status and relevant demographic data weredocumented separately (8).
Sample size
The size ofthe initial sample was determined on the supposi-tion that a rise in the mean Hb concentration of5 g/L (d) couldbe considered biologically significant. This corresponds to a netgain of 1 mmol Fe in a 55-kg woman. Assuming a SD of 13g/L, a confidence coefficient of9S% (Za = 1.96), and a proba-bility of 90% that the expected difference can be detected (Z�3= 1.282), the sample size (n) can be calculated by (9)
I From the Joint University/MRC Iron and Red Cell Metabolism
Unit, Department ofMedicine, University ofthe Witwatersrand Medi-cal School, Johannesburg and the Department ofMedicine, University
ofNatal, Durban, South Africa.2 Address reprint requests to TH Bothwell, Department of Medi-
cine, University of the Witwatersrand, Medical School, York Road,Parktown 2 193, South Africa.
Received October 20, 1987.Accepted for publication January 27, 1987.
at PE
NN
SY
LVA
NIA
ST
AT
E U
NIV
PA
TE
RN
O LIB
RA
RY
on May 12, 2016
ajcn.nutrition.orgD
ownloaded from
IRON-EDTA-FORTIFICATION TRIAL 163
- 2SD2 (Za + Z$)2n d2
This gives a sample size of 142 in each group and sex with atotal sample size of568. Because a decline in numbers becauseof death, migration, and division into further subgroups was
anticipated, recruiting was continued until the total sample was
,...#70% larger (984 individuals).
Study design
The 264 families were divided by use of computer-generatedrandom numbers into fortified (135 families) and control (129families) groups. Both groups were taken from the same areato minimize possible variations in Fe status because of geo-graphical location. The study was conducted as a double-blindprocedure, the fortified and unfortified rnasala being identifiedby means ofa numbered code.
Choice offood vehicle
Masala, or curry powder, a mixture of spices used to flavorfoods, was chosen because it fulfils many of the criteria of asuitable food vehicle (4). These include central production anddistribution, good masking properties, and a manufacturingprocess that facilitates the addition of a fortifier. In addition,masala was shown to enhance Fe absorption modestly (10). Insouthern Africa masala has the added advantage ofbeing con-sumed in large amounts by people of Indian descent in whomthe prevalence of Fe deficiency was shown to be high (4, 11,12). In contrast, it is not used by the Black population, in whichiron overload is prevalent (13). It thus provides a means of tar-geting Fe fortification to the section of the population that ismost Fe deficient. In a pilotsurvey conducted in this commu-nity before the start of the trial, the average consumption ofmasala was found to be 5.5 g per person per day with > 85%being supplied by one rnanufacturer(10).
Choice offortifying agent
NaFe(l 1 1)EDTA, which was chosen as the fortifying agent,was added at a level of 10 mg/g masala, correspondingto a levelof2S �mol Fe/g masala. The fortified masala was found to bestable and palatable and the fortifier remained evenly distrib-uted throughout the powder on storage. Previous work (14)showed that Fe absorption from NaFe( 1 1 1)EDTA-fortifiedfoods is significantly better than that from other fortifiers andthat color changes in fortified food are less obvious. Prelimi-
� nary radioactive-Fe absorption studies in females from thesame population group showed that the mean absorption fromNaFe(1 1 1)EDTA-fortified curry powder was �- 10%, whichwas almost twice that of ferrous sulfate when each was fed to-gether with a traditional vegetable meal (10). Calculationsbased on these radioactive-Fe absorption figures, the level offortification (25 �mol/d), and the estimated per capita con-sumption of masala (5.5 g/d) suggested that an increase inavailable Fe of 14 �mol/d could be anticipated in Fe-de-pleted females. The content of EDTA in the unfortified dietwas not measured. However a nutritional survey conducted atthe start of the study showed a very low consumption of pre-served and canned foods that may be expected to containEDTA.
Distribution of masala
Sufficient masala was purchased from a local supplier (Os-mond Bros, Taj Mahal Spices, Rossburgh, Durban)to meet themonthly requirements ofboth groups. It was divided into two
batches and NaFe( 1 1 1)EDTA was mixed into one batch at a
(1) separate location. The fortified masala was distinguished from
the unfortified by means of a numbered code. Both batcheswere then returned to the supplier where they were packagedin the usual manner. The packages of masala were distributed
to the study participants free ofcharge on a monthly basis andcareful regular checks were made to ensure that each familyreceived the correct batch of masala. To monitor errors in dis-tribution, random samples (0.5 mL) ofmasala were taken fromboth the manufacturer and individual households at regular in-tervals and checked for their Fe content. Samples were mixedin Fe-free water to which 100 �L thioglycollic acid and 300�tL ammonia were added. Masala containing NaFe(l 1 1)EDTAturned dark brown. Eight of the fortified families and four ofthe unfortified families were found in single episodes to be us-ing the incorrect form of masala. Exclusion of these familiesfrom the final analysis did not alter the results.
Blood sampling
Venous blood samples (10 mL clotted and 5 mL withEDTA) were taken annually from each subject for the determi-nation of the percentage saturation of transferrin, serum fern-tin, and Hb concentrations. The method of blood collectionwas standardized as far as possible with the venesection usuallybeing performed in the late afternoon with the subject seated.After 2 y of fortification, blood was taken from two randomsamples of3O subjects each who were selected from the fortifiedand unfortified groups. This was done to determine whetherthere was any difference in the plasma zinc levels between thetwo groups. Zn-free containers were used and care was takento avoid hemolysis ( 15). Zn levels on plasma samples were ana-lyzed with an atomic absorption spectrophotometer (15, 16).Other estimations were carried out as described previously (8).
Standardization
Although it would have been desirable to have analyzed allblood samples simultaneously, the sample size and duration ofthe study made this impractical. Instead steps were taken toensure comparable results with standardized laboratory meth-ods. In the enzyme-linked immunosorbent assay(ELISA) fern-tin assay a standard curve and three control sera, correspond-ing to high, medium, and low ferritin levels, were assayed witheach plate. Similar controls were used for the serum Fe estima-tions. In addition the approximation of the ELISA standardcurve to a straight line was determined statistically after eachassay and standard curves with a correlation coefficient of< 0.999 were discarded. The values ofthe control sera for bothserum Fe and ferntin were expected to fall within two SDs oftheir mean values as determined on 20 consecutive samples
before the study. If significant variation was noted in the con-trols, the assay was repeated. As a further check 20 specimensanalyzed at the start ofthe study and then stored at -20 #{176}Cwerereanalyzed at the end of the study. There was no significantdifference between the values obtained at the different times (1
= 0.6, p > 0.5). Hb estimations were performed on a ZFCoulter counter (Coulter Electronics SA [Pty] Ltd. HalfwayHouse, SA), which was calibrated daily according to the manu-facturer’s specifications with the provided control samples.Thereafter the instrument was checked using pooled blood twoto four times daily. The laboratory participated in the OrthoQuality Assurance Program (Ortho Diagnostic Systems,Beerse, Belgium) and test results were always within 1 SD ofthe international mean.
at PE
NN
SY
LVA
NIA
ST
AT
E U
NIV
PA
TE
RN
O LIB
RA
RY
on May 12, 2016
ajcn.nutrition.orgD
ownloaded from
164 BALLOT ETAL
Calculations and statistical analysis
Individual Fe status (viz normal, depleted Fe stores [DISJ,Fe-deficient erythropoiesis [IDE], Fe-deficiency anemia [IDA],and other anemias [OA]) was determined from the values ofpercent saturation, Hb, and serum ferritin concentrations mea-sured at the beginning ofthe study and at the end ofeach yearof fortification according to criteria previously described (8).This classification was used to derive a value for individual
body Fe stores (mmol) according to a modification (8) of themethod ofCook et al (17).
Demographic and hematological data were stored on com-puter and analysis was carried out with Statistical Analysis Sys-tem software ( 18, 19). Results were expressed as means andSDs or SEMs except for the serum ferritin concentrations,which were found to be markedly positively skewed. Logarith-mic transformations normalized the distribution and ferritinresults were therefore reported as the geometric mean and ei-
ther one SD or one SEM range ( 19). Because there are knownand established differences between the Fe status of males andfemales, the sexes were analyzed separately. Changes in themeasurements of Fe status from the initial values through 2 yoffortification were compared in the two groups either by usingthe SAS General Linear Model procedure for repeated mea-sures ( 18, 19) or by Student’s t tests on the mean differencesbetween the initial and subsequent Fe measurements. Whereanalysis ofvariance was employed, post hoc comparisons wereperformed using the Student’s t test with the Bonferroni correc-tion (18). Because the alternate hypothesis in all comparisonswas that the mean of measurements in the fortified group wasgreater than that in the control group, one-tailed probabilitieswere reported.
Ethicalconsiderations
Prior to commencement, the study outline was approved bythe Human Ethics Committee ofthe University ofthe Witwa-tersrand. All subjects in the study were volunteers who agreedto participate after the nature of the investigation had been
fully explained to them by an Indian nurse. Subjects with se-vere anemia (Hb < 90 gIL) and those showing other evidence
of disease (eg, an abnormal leucocyte count) were referred fortreatment and excluded from the analysis of results.
Results
The fortified and unfortified groups were matched forage, parity, duration of menstruation, income, alcoholconsumption, and initial Fe status. After 2 y of fortifica-tion, 672 subjects remained in the study. A total of 267subjects dropped out ofthe study: 129 moved away fromthe area, 1 15 refused to participate further, and 23 died.
There were no significant differences in the number orcategory of dropouts between the fortified and unforti-fled groups.
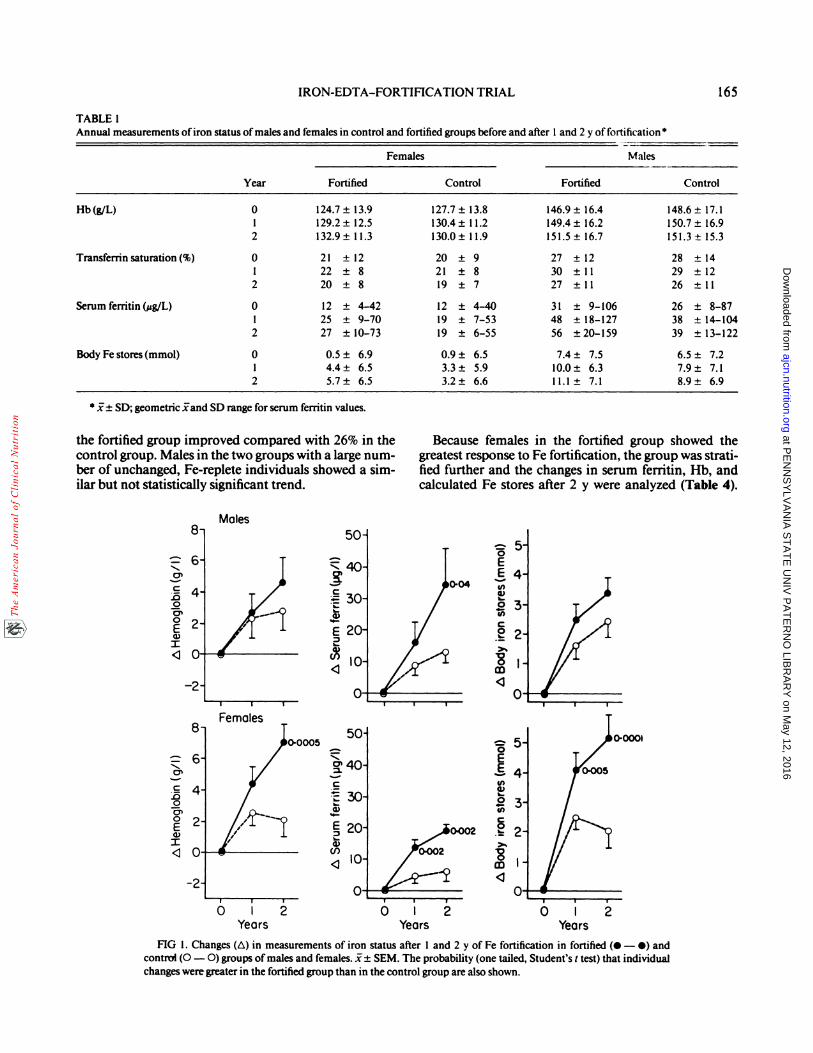
The means (±SDs) ofmeasurements taken at the startofthe study and after 1 and 2 y in males and females ofcontrol and fortified groups are shown in Table 1 . In allgroups there was an improvement with time in all mea-surements of Fe status except the transferrin saturation.The improvement was greatest between the initial base-line values and the end ofthe first year ofthe study. How-ever, only the fortified groups continued to show im-provement during the subsequent year ofthe study. This
is illustrated in Figure 1, which shows the mean changein Hb, serum ferritin, and calculated body Fe stores atthe end of each year of fortification in both males and
females of the fortified and control families. The im-provement in Hb reached significance over the startingvalues only in the female fortified group (year 2, p
= 0.0005). In males the improvement in serum ferritinover base-line values in the fortified group achieved sig-nificance over the control group only after 2 y of fortifi-
cation (p = 0.04). These changes were further illustratedby the mean change in body Fe stores (a composite ofthe Hb, serum ferritin, and transfernn saturation), whichshowed a progressive improvement in the fortified groupas compared with the control group (females after 1 y 1.7mmol, after 2 y 3.0 mmol; males after 1 y 0.9 mmol, after2 y 1 mmol). When the males were divided into adultsand those aged < 18 y at the start of the study, it wasapparent that the rise in serum ferntin was only signifi-cant in the fortified younger group (t = 2. 1, p = 0.02).Similarly the improvement in calculated body Fe storeswas significantly greater in this age group than in the con-trol group (fortified, 4.6 ± 0.9 mmol (SEM); control, 2.2± 0.9 mmol; I = 2.0, p = 0.025). In contrast, there wasno significant difference in the adult groups(fortified, 2.9± 0.7 mmol; control, 2.6 ± 0.6 mmol; t = 0.3, p > 0.7).
An analysis ofvariance for repeated measures demon-strated a significant improvement with time in the Hb,serum ferritin, and body Fe stores in both males and fe-males. However in females there was significant interac-tion between groups and the annual measurements ofHb, serum ferritin, and body Fe stores (F = 5.6, 10.0,
and 9.0, respectively; p < 0.01), which suggested that theFe status of the fortified group was significantly betterthan that of the control group. Further analysis of thefemales was performed to assess at what stage the im-provement ofthe fortified over the control group reachedstatistical significance. There was a significant improve-ment in the hemoglobin after 1 y (F = 20.8, p < 0.0001)but the two groups were not significantly different (F= 1 .3, p > 0. 1). However, after 2 y of fortification theimprovement in the fortified group was maintained anda significant difference between the groups was apparent(F = 10. 1, p < 0.01). For serum ferritin the groups weresignificantly different after 1 y offortiflcation (F = 8.9, p< 0.01) and the difference was maintained after 2 y (F= 1 3.8, p < 0.001). The combined effect ofthese changeswas apparent in the calculated estimate ofbody Fe stores,which showed a significant difference between the groupsafter 1 y (F = 5.0, p < 0.03) that was maintained after 2y (F = 14.4, p < 0.001).
Changes in the prevalence ofthe different categories ofFe status between the start and conclusion of the studyare shown in Table 2. The prevalences were significantlydifferent in the fortified groups in both sexes with thechange in the prevalence of IDA among females beingthe most striking. Because these categories are a semi-
quantitative estimate ofFe status, individual changes be-tween categories can be construed as improvement or de-terioration (Table 3). In such terms 41% of females in
at PE
NN
SY
LVA
NIA
ST
AT
E U
NIV
PA
TE
RN
O LIB
RA
RY
on May 12, 2016
ajcn.nutrition.orgD
ownloaded from
Males
Years Years0 I
Years
IRON-EDTA-FORTIFICATION TRIAL 165
TABLE 1Annual measurements ofiron status of males and females in control and fortified groups before and after 1 and 2 y of fortification �
Year
Fern ales Ma les
Fortified Control Fortified Control
Hb(g/L) 0
12
124.7±13.9
129.2 ± 12.5
132.9±11.3
127.7±13.8
130.4 ± 1 1.2
130.0±11.9
146.9±16.4
149.4 ± 16.2151.5±16.7
148.6± 17.1
150.7 ± 16.9
151.3±15.3
Transferrin saturation (%) 01
2
2 1 ± 1222 ± 8
20 ± 8
20 ± 921 ± 8
19 ± 7
27 ± 1230 ±11
27 ±11
28 ± 14
29 ±12
26 ±11
Serum ferritin (�g/L) 01
2
12 ± 4-4225 ± 9-70
27 ± 10-73
12 ± 4-4019 ± 7-53
19 ± 6-55
3 1 ± 9-10648 ± 18-127
56 ± 20-159
26 ± 8-87
38 ± 14-104
39 ± 13-122
Body Fe stores(mmol) 012
0.5 ± 6.94.4± 6.55.7 ± 6.5
0.9 ± 6.53.3± 5.93.2 ± 6.6
7.4 ± 7.5
10.0± 6.31 1. 1 ± 7. 1
6.5 ± 7.2
7.9± 7.18.9 ± 6.9
* 1± SD; geometric land SD range for serum ferritin values.
the fortified group improved compared with 26% in thecontrol group. Males in the two groups with a large num-ber of unchanged, Fe-replete individuals showed a sim-ilar but not statistically significant trend.
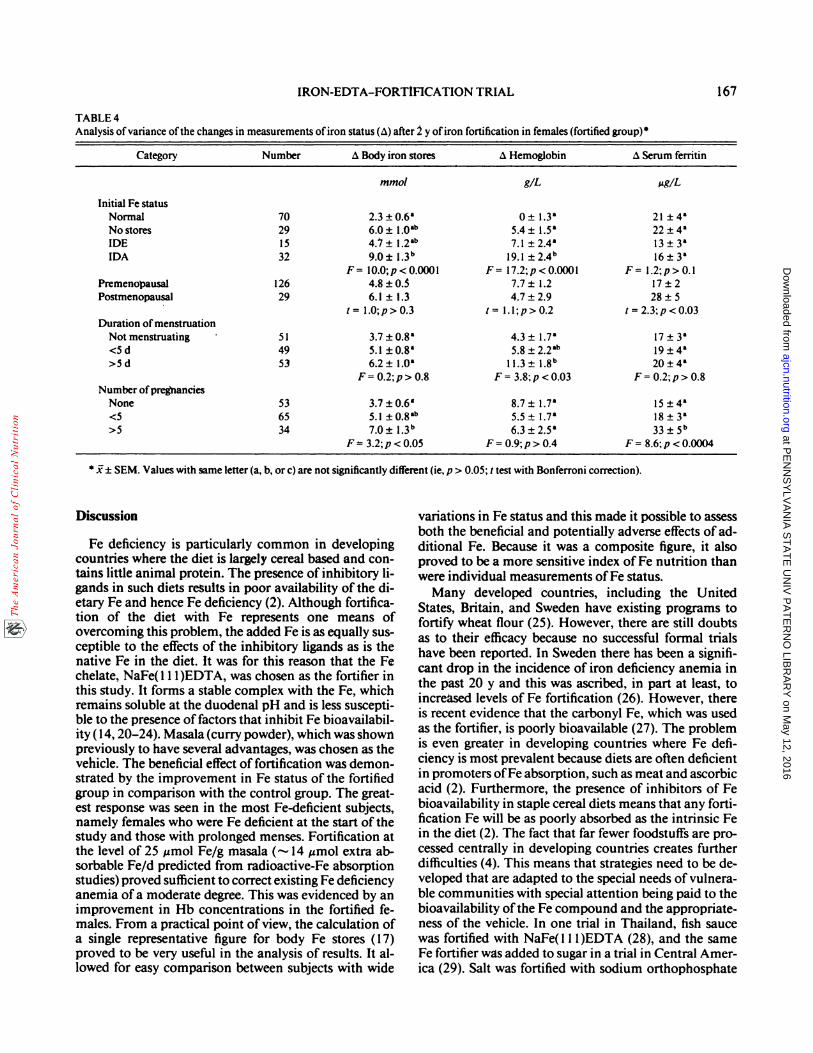
Because females in the fortified group showed thegreatest response to Fe fortification, the group was strati-fled further and the changes in serum ferritin, Hb, andcalculated Fe stores after 2 y were analyzed (Table 4).
Os
C
.00
Os0E
I
‘I
Os
C
.000’0EG)
I
FIG 1. Changes (Lx) in measurements of iron status after 1 and 2 y of Fe fortification in fortified (#{149}- O) andcontrni (0 - 0) groups ofmales and females. i± SEM. The probability (one tailed, Student’s t test) that individualchanges weregreater in the fortified group than in the control group are also shown.
at PE
NN
SY
LVA
NIA
ST
AT
E U
NIV
PA
TE
RN
O LIB
RA
RY
on May 12, 2016
ajcn.nutrition.orgD
ownloaded from

166 BALLOT ET AL
TABLE 2Prevalence (%) ofiron deficiency at the start (year 0) and after 2 y of fortification
Significance
Group Number Year Normal DIS IDE IDA x2 p
FemalesControl 161 0 49.1 16.2 17.4 17.4
2 62.9 1 1.2 12.6 13.3 � >0.1
Fortified 164 0 48.8 20.1 9.1 22.02 78.4 6.8 9.9 4.9 39.5 <0.001
Males
Control I 39 0 74. 1 14.4 1 1 .5 �2 85.4 7.3 7.3� 5.6 >0.06
Fortified 134 0 74.6 1 1.9 13.42 93.1 3.1 3.8* 16.7 <0.001
a Categories combined because > 20% expected cell frequencies <5.
Significant changes in Hb were noted in those who en- cantly greater than in nondrinkers, an analysis of covari-tered the trial with Fe deficiency (especially IDA) and ance with age and initial body Fe stores as covariates wasin those with a history of prolonged menses. Changes in performed. In the control group there was no significantserum ferritin were significant in multipara and post- difference in the adjusted mean change between drinkersmenopausal women. Significant improvement in the se- and nondrinkers (2. 1 and 3. 1 mmol, respectively). How-rum ferritin was also seen in older women (> 40 y) ever, in the fortified group there was a more than twofoldwhereas those < 20 y improved least (not shown in Table increase in body Fe stores in drinkers as compared with
4). A similar analysis of females in the control group re- nondrinkers (4.9 and 1.8 mmol, respectively; F = 5.05,
vealed that improvement was mostly seen in postmeno- p < 0.03). Similarly the adjusted mean change in body
pausal women. The mean change in body Fe stores was Fe stores in drinkers belonging to the fortified group was5. 1 mmol compared with only 1 .5 mmol in premeno- significantly greater than those in the control group of
pausal females (F = 4.7, p < 0.03). The number ofpreg- drinkers (F = 7.2, p < 0.01) whereas no such differencenancies and the duration of menses had no significant was seen in nondrinkers (F = 0.7, p > 0.4). Further in-effects. As in the fortified group the greatest improve- sight into the possible hazard of Fe overload developingment in Fe status occurred in women who were Fe defi- in Fe-fortified drinkers was obtained by analyzing whatcient at the start ofthe trial. The mean change in body Fe happened to adult males who entered the study with nor-stores in control-group women entering the study with mal Fe status. There was no significant difference in theanemia was 7. 1 mmol (change in Hb, 14.6 gIL) whereas mean change in body Fe stores between the controlwomen entering the trial with normal Fe status showed group (1 .8 ± 0.5 mmol) and the fortified group (1.8 ± 0.6a decline in body Fe stores (0.4 mmol). mmol; t = 0.07, p > 0.9).
Two groups of adult males were analyzed further to Serum Zn concentrations were measured in 30 mdi-explore the possibility that Fe overload might develop viduals from each group after 2 y of fortification (13during Fe fortification. In this context special attention males and 17 females). The mean Zn level ofthe fortifiedwas paid to changes in body Fe stores in males who con- group was 15.8 ± 2.6 �mol/L whereas that ofthe unforti-sumed alcohol regularly. Because the calculated initial fled group was 15.7 ± 4. 1 �imol/L. These results were notbody Fe stores and ages of these subjects were signifi- significantly different (p > 0.1).
TABLE 3
Change in iron status after 2 y of fortification
Number Improved Deteriorated Unchanged x2 p
%
Females
Control 127 26.0 15.8 58.2 12 1 0002Fortified 139 41.0 5.0 54.0 �
MalesControl 124 19.4 6.5 74.2
Fortified I 15 21.7 4.4 73.9 0.6 <0.7
at PE
NN
SY
LVA
NIA
ST
AT
E U
NIV
PA
TE
RN
O LIB
RA
RY
on May 12, 2016
ajcn.nutrition.orgD
ownloaded from
IRON-EDTA-FORTIFICATION TRIAL 167
TABLE 4Analysis ofvariance ofthe changes in measurements ofiron status (�) after 2 y ofiron fortification in females (fortified group)
Category Number Body iron stores Hemoglobin Serum ferritin
mmol gIL �g/L
Initial Fe statusNormal 70 2.3±0.6’ 0± l.3a 21 �4&
No stores 29 6.0 ± 1 0�L� 5.4 ± 1 5& 22 ± 4�IDE 15 4.7±l.2�” 7.l±2.4a l3±3a
IDA 32 9.O±l.3�’F= l0.0;p<0.000l
191�24b
F= ll.2;p<0.000l
16±3’
F= l.2;p>0.lPremenopausal 126 4.8 ±03 7.7 ± 1.2 17 ± 2
Postmenopausal 29 6.1±1.3 4.7±2.9 28±5. 1= l.0;p>0.3 1= 1.1;p>O.2 t=2.3;p<0.03
Duration of menstruationNot menstruating � 51 3.7 ± 0.8’ 4.3 ± 1.7’ 17 ± 3’
<Sd 49 5.1±0.8’ 5.8±2.2al� 19±4’>Sd 53 6.2±1.0’
F = 0.2; p > 0.8l1.3±l.8I�
F = 3.8; p < 0.0320±4’
F = 0.2; p > 0.8Number of pregnancies
None 53 3.7±0.6’ 8.7±1.7’ 15±4’<5 65 51�08ab 5.5±1.7’ 18±3’>5 34 70�13b
F � 3.2; p < 0.056.3±2.5’
F = 0.9; p > 0.433�5b
F = 8.6; p < 0.0004
a � SEM. Values with same leuer(a, b, or c) are not significantly different (ie, p > 0.05; t test with Bonferroni correction).
Discussion
Fe deficiency is particularly common in developingcountries where the diet is largely cereal based and con-thins little animal protein. The presence of inhibitory li-gands in such diets results in poor availability of the di-
etary Fe and hence Fe deficiency (2). Although fortifica-tion of the diet with Fe represents one means ofovercoming this problem, the added Fe is as equally sus-ceptible to the effects of the inhibitory ligands as is thenative Fe in the diet. It was for this reason that the Fe
chelate, NaFe(1 1 1)EDTA, was chosen as the fortifier inthis study. It forms a stable complex with the Fe, whichremains soluble at the duodenal pH and is less suscepti-ble to the presence offactors that inhibit Fe bioavailabil-ity (14, 20-24). Masala (curry powder), which was shownpreviously to have several advantages, was chosen as thevehicle. The beneficial effect of fortification was demon-
strated by the improvement in Fe status of the fortifiedgroup in comparison with the control group. The great-est response was seen in the most Fe-deficient subjects,namely females who were Fe deficient at the start of thestudy and those with prolonged menses. Fortification at
the level of 25 �mol Fe/g masala (-�-- 14 �umol extra ab-sorbable Fe/d predicted from radioactive-Fe absorptionstudies) proved sufficient to correct existing Fe deficiency
anemia of a moderate degree. This was evidenced by animprovement in Hb concentrations in the fortified fe-males. From a practical point of view, the calculation ofa single representative figure for body Fe stores (17)proved to be very useful in the analysis of results. It al-lowed for easy comparison between subjects with wide
variations in Fe status and this made it possible to assess
both the beneficial and potentially adverse effects of ad-ditional Fe. Because it was a composite figure, it alsoproved to be a more sensitive index ofFe nutrition thanwere individual measurements ofFe status.
Many developed countries, including the UnitedStates, Britain, and Sweden have existing programs tofortify wheat flour (25). However, there are still doubtsas to their efficacy because no successful formal trialshave been reported. In Sweden there has been a signifi-cant drop in the incidence of iron deficiency anemia inthe past 20 y and this was ascribed, in part at least, toincre�ised levels of Fe fortification (26). However, there
is recent evidence that the carbonyl Fe, which was used
as the fortifier, is poorly bioavailable (27). The problem
is even greater in developing countries where Fe defi-
ciency is most prevalent because diets are often deficient
in promoters ofFe absorption, such as meat and ascorbic
acid (2). Furthermore, the presence of inhibitors of Febioavailability in staple cereal diets means that any forti-
flcation Fe will be as poorly absorbed as the intrinsic Fein the diet (2). The fact that far fewer foodstuffs are pro-
cessed centrally in developing countries creates further
difficulties (4). This means that strategies need to be de-veloped that are adapted to the special needs of vulnera-
ble communities with special attention being paid to the
bioavailabiity ofthe Fe compound and the appropriate-ness of the vehicle. In one trial in Thailand, fish sauce
was fortified with NaFe( 1 1 1)EDTA (28), and the sameFe fortifier was added to sugar in a trial in Central Amer-ica (29). Salt was fortified with sodium orthophosphate
at PE
NN
SY
LVA
NIA
ST
AT
E U
NIV
PA
TE
RN
O LIB
RA
RY
on May 12, 2016
ajcn.nutrition.orgD
ownloaded from

168 BALLOT ET AL
and sodium acid sulphate in a third trial in India (30).All three studies reported improvements in Fe nutrition,with the most marked effects being claimed in the Indianstudy, which was carried out in an extremely Fe-deficientgroup (30). The reported mean rise in Hb of “-20 g/Lover a 6-mo period in the Calcutta group would corre-
spond to additional daily absorption of ‘-26 jzmol. Incomparison there was an increase of 19 g/L over 2 y in
the Hb concentrations of the most Fe-deficient subjectsin the present study, corresponding to an additional Feabsorption of ‘� 7 �mol/d. However, when the increase
in Fe stores in this group was considered (Table 4), the
daily Fe absorption was calculated to be 12 �mol. Thiscomes close to the increase in iron absorption of ‘� 14�tmol/d that was anticipated at the start ofthe study. The
fortified female group as a whole showed an average in-crease in Fe stores of3 mmol in 2 y, corresponding to anadditional 4 �mol Fe/d absorbed.
It was ofinterest that the Fe status ofthe control groupalso improved to some degree during the period of obser-vation. This finding emphasizes the need to compare theeffects of Fe fortification with a carefully matched con-trol group in a trial of this type. The reason for the im-provement in the unfortified group in the present studyis not clear but may have been the result of several fac-tors. Part of it could have been attributable to an im-provement with age; the increase in the serum ferritinoccurred mainly in the postmenopausal group. Anotherreason for the improvement in the control group mayhave been related to the sudden emphasis on Fe nutri-tion. During the same period there was also some im-provement in economic conditions and in medical 5cr-vices in the area. The positive changes in Fe nutritionwere not maintained and during the course ofthe studythe mean calculated Fe stores in replete females actuallydeclined by 0.4 mmol.
A major consideration in the implementation of anFe-fortification program is its safety. At particular risk
would be those subjects with a propensity to accumulateexcessive amounts of Fe (3 1). Neither the HLA-linkedFe-loading gene responsible for idiopathic hemochro-matosis nor the thalassemic genes occur with any fre-quency in the population that was being studied. How-ever, there were a number of alcohol abusers, a propor-tion ofwhom might be expected to accumulate excessiveFe (32). For the whole male fortified group the averagecalculated increase in absorption was very modest andthere was no suggestion that Fe-replete males were at anyrisk. However, there was some evidence that Fe storesincreased significantly in alcohol abusers who receivedthe fortified masala. It is known that alcohol can cause arise in the serum ferritin concentration that reflects liverdamage rather than the size of the Fe stores (33). Thiswas not felt to be the explanation for the present findingsbecause the control group did not show a matching riseduring the period ofthe study. Although the significanceofthe rise in Fe stores in alcohol abusers is not clear, suchsubjects appear to be at much greater risk from alcoholthan from Fe fortification.
A further consideration relating to safety was the effectofthe prolonged ingestion ofNaFe(l 1 1)EDTA on trace-metal metabolism. NaFe(l 1 1)EDTA is not currently li-cenced as a food additive but NaEDTA is widely em-ployed as an antioxidant with the maximum recom-mended daily intake being 2.5 mg/kg (34). BecauseEDTA might affect levels of several divalent cations (14,16, 27), serum Zn concentrations were measured in ran-
dom samples ofthe fortified and unfortified groups at theend of the study. There were no differences, which is inagreement with the findings ofother workers (16).
Although the available evidence suggests that Na-Fe(l 1 1)EDTA offers several advantages as an Fe fortifier,it is relatively expensive (35 US $/kg). At this price, forti-
fication in the concentrations used here would add 15%to the cost ofmasala. It is possible that NaFe(l 1 1)EDTAof lesser purity would be equally suitable. Na-Fe(l 1 1)EDTA of> 97% purity is used in the agriculturalindustry as an Fe supplement and is available at less thanhalfthe cost ofthe chelate used in this study. #{163}3
We acknowledge the assistance of Peter Fridjhon, Department of
Statistics, University ofthe Witwatersrand.
References
1. DeMaeyerC, Adiels-Tegman M. The prevalance ofanaemia in theworld. World Health Stat Q l985;38:302-16.
2. Charlton RW, Bothwell TH. Iron absorption. Annu Rev Med1983; 34:55-68.
3. Baker SJ, De Maeyer EM. Nutritional anemia: its understandingand control with reference to the work of the World HealthOrganization. Am J Clin Nutr 1979;32:368-41 7.
4. International Nutritional Anemia Consultative Group (INACG).Guidelines for the eradication of iron deficiency anemia. NewYork: Nutrition Foundation, 1977.
5. Latharn MC. Strategies for the control of malnutrition and theinfluence ofthe nutritional sciences. Food Nutr 1984; 10:5-3 1.
6. Cook JD, Reusser M. Iron fortification: an update. Am J Clin Nutrl983;38:648-59.
7. International Anemia Consultative Group (INACG). Irondeficiency in women. New York: Nutrition Foundation, 1981.
8. Ballot DE, MacPhail AP, Bothwell TH, et al. Fortification of currypowder with NaFe(l 1 1)EDTA in iron deficient population: Initialsurvey ofiron nutrition. Am J Clin Nutr l989;49: 156-61.
9. International Nutritional Anemia Consultative Group (INACG).The design and analysis ofiron supplementation trials. New York:Nutrition Foundation, 1984.
10. Lamparelli RD, MacPhail AP, Bothwell TH, et al. Curry powderas a vehicle for iron fortification: effects on iron absorption. Am J
Clin Nutr 1987;46:335-40.1 1. Mayet FGH. The prevalence ofanaemia and iron deficiency in the
Indian community in Natal. S Afr Med J l976;50: 1889-92.
12. MacPhail AP, Bothwell TH, Torrance JD, et al. Iron nutrition inIndian women at different ages. S Afr Med J 198 l;59:939-42.
13. MacPhail AP, Simon MO, Torrance JD, et al. Changing panerns
ofdietary iron overload in black South Africans. Am J Clin Nutr
1979;32: 1272-8.
14. MacPhail AP, Charlton R, Bothwell TH, Bezwoda W.Experimental fortificants. In: Clydesdale FM, Wiener KL, eds.
Iron fortification offoods. New York: Academic Press, 1985.15. Sinha SW, Gabrielli ER. Serum copper and zinc levels in various
pathologic conditions. Am J Din Pathol l970;54:570-7.
at PE
NN
SY
LVA
NIA
ST
AT
E U
NIV
PA
TE
RN
O LIB
RA
RY
on May 12, 2016
ajcn.nutrition.orgD
ownloaded from
IRON-EDTA-FORTIFICATION TRIAL 169
16. Solomons NW, Jacob RA, Pineda 0, Viteri FE. Studies on the
bioavailability ofzinc in man: effects ofthe Guatemalan rural dietand ofthe iron fortifyingagent NaFe( I I 1)EDTA. J Nutr 1979; 109:15 19-28.
17. Cook JD, Skikne BG, Lynch SK, Reusser MG. Estimates of ironsufficiency in the US population. Blood 1986;68:726-3l.
18. Statistical Analysis Systems Institute. SAS user’s guide: statistics.
5th ed. Cary, NC: SAS Institute mc, 1985.
19. Cody RP, Smith JK. Applied statistics and the SAS programming
language. New York: Elsevier Science Publishing Co, 1985.
20. Layrisse M, Martines-Torres C. Fe( 1 1 1)EDTA complex as iron
fortification. Am J Gin Nutr 1977;30: 1166-74.
21. Viteri FE, Garcia-Ibanez R, Torun B. Sodium iron NaFeEDTA
as an iron fortification compound in Central America: absorption
studies. AmJ Clin Nutr 1978;3l:961-7l.
22. Martinez-Torres C, Romano EL, Renzi M, Laynsse M.Fe(l ll)EDTA complex as an iron fortification: further studies.Am J Clin Nutr l979;32:809-16.
23. MacPhail AP, Bothwell TH, Torrance JD, et al. Factors affectingthe absorption of iron from Fe(1 I 1)EDTA. Br J Nutr 198 l;45:
215-27.
24. Candela E, Camacho MK, Martinez-Torres C, et al. Ironabsorption by humans and swine from Fe(1 1 1)EDTA. Further
studies. J Nutr 1984; 114:12-9.
25. Rao N. Physiology of iron absorption and supplementation. BrMedBull 198l;3l:25-30.
26. Hallberg L. Iron nutrition and food iron fortification. SeminHernatol 1982; 19:1:31-41.
27. Hallberg L, Brune M, Rossander L. Low bioavailability of carbonyliron in man: studies on iron fortification ofwheat flour. Am J GinNutr l986;93:59-67.
28. Garby L, Areekul S. Iron supplementation ofThai fish sauce. AnnTrop Med Parasitol l974;68:467-76.
29. Viteri FE, Alvarez DP, Torun B. Prevention ofiron deficiency bymeans of iron fortification of sugar. In: Underwood B, ed.Nutrition Intervention Strategies in National Development. NewYork: Academic Press, 1983:287-3 14.
30. The Working Group on Fortification of Salt with Iron. Use ofcommon salt fortified with iron in the control and prevention ofanemia in a collaborative study. Am J Clin Nutr l982;35:l442-57.
31. Bothwell TH, Derman DP, Bezwoda WR, et al. Can ironfortification cause damage to genetic susceptibles (idiopathichaemochromatosis and thalassaemia major)? Hum Genet [SupplJ1978; 1:13 1-7.
32. Charlton RW, Jacobs P, Seftel H, Bothwell TH. Effect of alcoholon iron absorption. Br Med J l964;2:l427-9.
33. Meyer TE, Kassianides C, Bothwell TH, Green A. Effects of heavyalcohol consumption on serum ferritin concentrations. S Afr MedJ l984;66:573-5.
34. World Health Organization. Toxicological evaluation of somefood additives including anticaking agents, antimicrobials,antioxidants, emulsifiers and thickening agents. Geneva: WHO,1974. (WHO Food Additive Series #5.)
at PE
NN
SY
LVA
NIA
ST
AT
E U
NIV
PA
TE
RN
O LIB
RA
RY
on May 12, 2016
ajcn.nutrition.orgD
ownloaded from