Current perspective of the renewable energy development in Malaysia
8
Renewable and Sustainable Energy Reviews 15 (2011) 897–904 Contents lists available at ScienceDirect Renewable and Sustainable Energy Reviews journal homepage: www.elsevier.com/locate/rser Current perspective of the renewable energy development in Malaysia Salsabila Ahmad a,c,∗ , Mohd Zainal Abidin Ab Kadir b , Suhaidi Shafie a a Department of Electrical & Electronics Engineering, Faculty of Engineering, Universiti Putra Malaysia, 43400 Serdang, Selangor, Malaysia b Alternative and Renewable Energy Laboratory, Institute of Advanced Technology, Universiti Putra Malaysia, 43400 Serdang, Selangor, Malaysia c Department of Electrical System Engineering, Universiti Malaysia Perlis, 02000 Kuala Perlis, Perlis, Malaysia article info Article history: Received 17 October 2010 Accepted 4 November 2010 Keywords: Renewable energy Energy demand Energy policy Fit-in Tariff abstract It is estimated that oil reserves will not last very much longer; thus, a switch to alternative energy solutions is crucial. The Malaysian government has already prepared to face the situation decades before. Many policies have been implemented, as well as programmes and initiative. Now, Malaysia is waiting for the ultimate solutions, the Malaysian Fit-in Tariff (FiT), which is scheduled to be implemented second quarter of 2011. This paper presents the main sources of alternative renewable energy in Malaysia and its potential as well as the main reasons Malaysia is turning to alternative energy solutions; to fully utilize its renewable energy (RE) resources, fulfill the energy demand in the future and to reduce carbon emissions. This paper also discusses the steps taken by the government in preparation for FiT and overcoming the barriers in RE development. © 2010 Elsevier Ltd. All rights reserved. Contents 1. Introduction ......................................................................................................................................... 897 2. Renewable energies availability and potential in Malaysia ........................................................................................ 898 2.1. Solar .......................................................................................................................................... 898 2.2. Biomass and biogas .......................................................................................................................... 898 2.3. Mini-Hydro .................................................................................................................................. 899 2.4. Biogas and municipal solid waste ........................................................................................................... 899 3. Energy demand in Malaysia ......................................................................................................................... 900 4. Malaysia’s carbon emissions ........................................................................................................................ 900 5. Sequence of Malaysia’s actions towards Greener Energy Solutions ................................................................................ 901 5.1. Key barrier in renewable energy in Malaysia ............................................................................................... 901 5.1.1. Possible key barrier in Malaysia ................................................................................................... 901 5.1.2. Removing key barrier .............................................................................................................. 901 5.1.3. Current situation in Malaysian RE scenario ....................................................................................... 902 6. Conclusion ........................................................................................................................................... 903 References ........................................................................................................................................... 903 1. Introduction Without support from certain act, renewable energies (RE) will never be price-competitive. It is often labeled as expensive, mostly because conventional energy is heavily subsidized. In Malaysia, subsidization for fuel is larger than the subsidy for education [1]. Globally, it is estimated that more than US$200 million is spent in ∗ Corresponding author at: Department of Electrical & Electronics Engineer- ing, Faculty of Engineering, Universiti Putra Malaysia, 43400 Serdang, Selangor, Malaysia. E-mail address: [email protected] (S. Ahmad). the subsidization of conventional energy. In many countries, the subsidized fuel and electricity cancel out the advantages of the low operating cost of Renewable Energy Technologies (RETs). This is one of the key barrier in Renewable Energy Technology efforts besides several other barriers, such as, monopolistic and oligopolis- tic energy markets, low motivation in financing RET, weak political supports, lack of technical and institutional capacity and financial means and lack of awareness of potential and benefits of RET. Besides the barrier in the dissemination of RET, there are several other disadvantages associated with the RET. Solar technology, for example is often stereotyped as not technically feasible for electric- ity generation due to its high cost since photovoltaic technology started with USD1500/W and with only 2% efficiency [2]. Thus, 1364-0321/$ – see front matter © 2010 Elsevier Ltd. All rights reserved. doi:10.1016/j.rser.2010.11.009
-
Upload
independent -
Category
Documents
-
view
2 -
download
0
Transcript of Current perspective of the renewable energy development in Malaysia
C
Sa
b
c
a
ARA
KREEF
C
1
nbsG
iM
1d
Renewable and Sustainable Energy Reviews 15 (2011) 897–904
Contents lists available at ScienceDirect
Renewable and Sustainable Energy Reviews
journa l homepage: www.e lsev ier .com/ locate / rser
urrent perspective of the renewable energy development in Malaysia
alsabila Ahmada,c,∗, Mohd Zainal Abidin Ab Kadirb, Suhaidi Shafiea
Department of Electrical & Electronics Engineering, Faculty of Engineering, Universiti Putra Malaysia, 43400 Serdang, Selangor, MalaysiaAlternative and Renewable Energy Laboratory, Institute of Advanced Technology, Universiti Putra Malaysia, 43400 Serdang, Selangor, MalaysiaDepartment of Electrical System Engineering, Universiti Malaysia Perlis, 02000 Kuala Perlis, Perlis, Malaysia
r t i c l e i n f o
rticle history:eceived 17 October 2010ccepted 4 November 2010
a b s t r a c t
It is estimated that oil reserves will not last very much longer; thus, a switch to alternative energysolutions is crucial. The Malaysian government has already prepared to face the situation decades before.
eywords:enewable energynergy demandnergy policy
Many policies have been implemented, as well as programmes and initiative. Now, Malaysia is waitingfor the ultimate solutions, the Malaysian Fit-in Tariff (FiT), which is scheduled to be implemented secondquarter of 2011. This paper presents the main sources of alternative renewable energy in Malaysia and itspotential as well as the main reasons Malaysia is turning to alternative energy solutions; to fully utilize itsrenewable energy (RE) resources, fulfill the energy demand in the future and to reduce carbon emissions.This paper also discusses the steps taken by the government in preparation for FiT and overcoming the
it-in Tariffbarriers in RE development.© 2010 Elsevier Ltd. All rights reserved.
ontents
1. Introduction . . . . . . . . . . . . . . . . . . . . . . . . . . . . . . . . . . . . . . . . . . . . . . . . . . . . . . . . . . . . . . . . . . . . . . . . . . . . . . . . . . . . . . . . . . . . . . . . . . . . . . . . . . . . . . . . . . . . . . . . . . . . . . . . . . . . . . . . . 8972. Renewable energies availability and potential in Malaysia . . . . . . . . . . . . . . . . . . . . . . . . . . . . . . . . . . . . . . . . . . . . . . . . . . . . . . . . . . . . . . . . . . . . . . . . . . . . . . . . . . . . . . . . 898
2.1. Solar . . . . . . . . . . . . . . . . . . . . . . . . . . . . . . . . . . . . . . . . . . . . . . . . . . . . . . . . . . . . . . . . . . . . . . . . . . . . . . . . . . . . . . . . . . . . . . . . . . . . . . . . . . . . . . . . . . . . . . . . . . . . . . . . . . . . . . . . . . 8982.2. Biomass and biogas . . . . . . . . . . . . . . . . . . . . . . . . . . . . . . . . . . . . . . . . . . . . . . . . . . . . . . . . . . . . . . . . . . . . . . . . . . . . . . . . . . . . . . . . . . . . . . . . . . . . . . . . . . . . . . . . . . . . . . . . . . 8982.3. Mini-Hydro . . . . . . . . . . . . . . . . . . . . . . . . . . . . . . . . . . . . . . . . . . . . . . . . . . . . . . . . . . . . . . . . . . . . . . . . . . . . . . . . . . . . . . . . . . . . . . . . . . . . . . . . . . . . . . . . . . . . . . . . . . . . . . . . . . 8992.4. Biogas and municipal solid waste . . . . . . . . . . . . . . . . . . . . . . . . . . . . . . . . . . . . . . . . . . . . . . . . . . . . . . . . . . . . . . . . . . . . . . . . . . . . . . . . . . . . . . . . . . . . . . . . . . . . . . . . . . . 899
3. Energy demand in Malaysia . . . . . . . . . . . . . . . . . . . . . . . . . . . . . . . . . . . . . . . . . . . . . . . . . . . . . . . . . . . . . . . . . . . . . . . . . . . . . . . . . . . . . . . . . . . . . . . . . . . . . . . . . . . . . . . . . . . . . . . . . 9004. Malaysia’s carbon emissions . . . . . . . . . . . . . . . . . . . . . . . . . . . . . . . . . . . . . . . . . . . . . . . . . . . . . . . . . . . . . . . . . . . . . . . . . . . . . . . . . . . . . . . . . . . . . . . . . . . . . . . . . . . . . . . . . . . . . . . . 9005. Sequence of Malaysia’s actions towards Greener Energy Solutions . . . . . . . . . . . . . . . . . . . . . . . . . . . . . . . . . . . . . . . . . . . . . . . . . . . . . . . . . . . . . . . . . . . . . . . . . . . . . . . . 901
5.1. Key barrier in renewable energy in Malaysia . . . . . . . . . . . . . . . . . . . . . . . . . . . . . . . . . . . . . . . . . . . . . . . . . . . . . . . . . . . . . . . . . . . . . . . . . . . . . . . . . . . . . . . . . . . . . . . 9015.1.1. Possible key barrier in Malaysia . . . . . . . . . . . . . . . . . . . . . . . . . . . . . . . . . . . . . . . . . . . . . . . . . . . . . . . . . . . . . . . . . . . . . . . . . . . . . . . . . . . . . . . . . . . . . . . . . . . 9015.1.2. Removing key barrier . . . . . . . . . . . . . . . . . . . . . . . . . . . . . . . . . . . . . . . . . . . . . . . . . . . . . . . . . . . . . . . . . . . . . . . . . . . . . . . . . . . . . . . . . . . . . . . . . . . . . . . . . . . . . . 9015.1.3. Current situation in Malaysian RE scenario . . . . . . . . . . . . . . . . . . . . . . . . . . . . . . . . . . . . . . . . . . . . . . . . . . . . . . . . . . . . . . . . . . . . . . . . . . . . . . . . . . . . . . . 902
6. Conclusion . . . . . . . . . . . . . . . . . . . . . . . . . . . . . . . . . . . . . . . . . . . . . . . . . . . . . . . . . . . . . . . . . . . . . . . . . . . . . . . . . . . . . . . . . . . . . . . . . . . . . . . . . . . . . . . . . . . . . . . . . . . . . . . . . . . . . . . . . . . 903References . . . . . . . . . . . . . . . . . . . . . . . . . . . . . . . . . . . . . . . . . . . . . . . . . . . . . . . . . . . . . . . . . . . . . . . . . . . . . . . . . . . . . . . . . . . . . . . . . . . . . . . . . . . . . . . . . . . . . . . . . . . . . . . . . . . . . . . . . . . 903
. Introduction
Without support from certain act, renewable energies (RE) will
the subsidization of conventional energy. In many countries, thesubsidized fuel and electricity cancel out the advantages of thelow operating cost of Renewable Energy Technologies (RETs). This
ever be price-competitive. It is often labeled as expensive, mostlyecause conventional energy is heavily subsidized. In Malaysia,ubsidization for fuel is larger than the subsidy for education [1].lobally, it is estimated that more than US$200 million is spent in
∗ Corresponding author at: Department of Electrical & Electronics Engineer-ng, Faculty of Engineering, Universiti Putra Malaysia, 43400 Serdang, Selangor,
alaysia.E-mail address: [email protected] (S. Ahmad).
364-0321/$ – see front matter © 2010 Elsevier Ltd. All rights reserved.oi:10.1016/j.rser.2010.11.009
is one of the key barrier in Renewable Energy Technology effortsbesides several other barriers, such as, monopolistic and oligopolis-tic energy markets, low motivation in financing RET, weak politicalsupports, lack of technical and institutional capacity and financialmeans and lack of awareness of potential and benefits of RET.
Besides the barrier in the dissemination of RET, there are severalother disadvantages associated with the RET. Solar technology, forexample is often stereotyped as not technically feasible for electric-ity generation due to its high cost since photovoltaic technologystarted with USD1500/W and with only 2% efficiency [2]. Thus,

898 S. Ahmad et al. / Renewable and Sustainable Energy Reviews 15 (2011) 897–904
FG
mowpiichc
rofrmmgttlsRgtaeiT2eahvtaoF
dsaCaie
of biomass residues come from oil palm industry, as shown in Fig. 4.
ig. 1. Contribution of PV in electricity generation from renewable energies inermany [8].
any were too dependent on fossil fuel, but until July 2008 whenil prices reached its highest at nearly USD150.00/barrel, peopleere forced to find alternative energy solution [3]. Currently, solarhotovoltaic has reached efficiency of more than 40% and the cost
s no longer expensive, but is as cheap as USD1/W for thin-film ands predicted to reduce even more [4]. Moreover, towards 2050, theost of electricity generation from PV will be lower than coal andydroelectric, while all renewable sources (except geothermal) willost lower than USD0.12/kWh [5].
Now, renewable energy has been put in the limelight andesearchers have increased their efforts in upgrading the efficiencyf alternative power sources thus limiting the dependency onossil fuels. Besides the cost factor, more and more people haveealized that fossil fuels have a negative impact on the world’s cli-ate through the Greenhouse Gases (GHG) emissions. Among theost popular RE resources are; hydroelectric, wind, solar, biomass,
eothermal and ocean energy and from these list, wind energy ishe major producer. Although solar is available in every part ofhe world, it is still in the beginning for full utilization. Nonethe-ess, in some parts of the world, particularly in Europe and Japan,olar photovoltaic (PV) industry has become increasingly intense.E could be generating electricity around the world and meet thelobal demand if a major shift in energy policy is made, such ashat in Germany and Japan [6]. Particularly in Germany, the Renew-ble Energy Sources Act (EEG) implemented has demonstrated theffectiveness of joint industrial and political commitment throughts most dominant and effective instruments, the fixed Feed-inariff (FiT). As evidence, since the act has been in force in April000, Germany has already achieved its target to generate 12.5%lectricity from RE by 2010 in 2007, to a figure above 13%. In PVlone, contribution for electricity generation in the beginning yearas showed an increase of more than 5% – more than the 1999alue – to 64 GWh. The following year, the value almost doubledo 116 GWh and the trend continued until 2006 with total gener-ted electricity from PV of 2.2 kWh. Fig. 1 shows the contributionf electricity generated from renewable energies in Germany sinceiT was implemented [7].
Meanwhile, the European Union (EU) countries had also intro-uced electricity FiT based on Germany’s example and have gaineduccess. In the Asia region, on the other hand, new enthusiasts suchs China and India have indicated new and promising beginnings.
hina, for example, has steadily increased support for the Renew-ble Energy Research and Development since the 1990s. Moreover,n 2006, China had planned to increase the share of electricity gen-ration from renewables to 30% by 2020. Significantly, the countryFig. 2. Yearly variations of the solar constant [11].
has introduced a regulation based on the Renewable Energy SourcesAct (EEG)-model in Germany to promote renewable energy in 2006and has announced to raise more than 50 billion Euros for theexpansion of renewables. India, in the meanwhile, has initiateda separate ministry to promote RE through various programmes,government incentives and policies including remunerative feed-intariffs [8]. Nowadays, almost in every part of the world, renewableenergy initiatives are taking place, and to be effective, a number ofkey political actions are required; put into practice the best sup-port schemes, remove several barriers related and enforce legalenforceable mechanisms such as feed-in tariffs [9].
2. Renewable energies availability and potential in Malaysia
2.1. Solar
Solar energy represents an abundant resource, which theoreti-cally could supply the world’s energy demand. Currently, the Sunradiates energy at 3.9 × 1026 W, but energy received at the outeratmosphere of Earth is 1368 W/m−2. This value varies in ±1.7% dueto changes in the Earth–Sun distance as in Fig. 2 [10,11]. The max-imum radiation is received during a sunny day, where 90% of theextraterrestrial radiation become direct radiation while the rest arebeing deflected as diffuse radiation, while conversely, on a cloudyday, nearly all of the solar radiation is diffused as demonstratedin Fig. 3 [12]. A tropical country such as Malaysia is generally hotall year around and experiences its rainy season during the end ofthe year. With an average of 12 h of sunshine daily, the averagesolar energy received is between 1400 and 1900 kWh/m2 annually.When using the solar dish for instance, there are some parame-ters that can be considered for maximizing the solar fraction [13].Although Malaysia has high potential in solar electricity genera-tion, the present initiatives and efforts are lower than the country’sactual potential. Currently, the solar status in Malaysia is 1 MW, andits estimated potential can reach more than 6500 MW [14].
2.2. Biomass and biogas
In 2006, Malaysia was the second largest oil palm producer inthe world, with a total of 15.88 million tonnes, an amount less 1%from the total world’s supply behind Indonesia. Since the oil palmindustry is huge, with 67% of agricultural land covered with oil palmtree, biomass from oil palm contributes the most. Currently, 85.5%
Sources of biomass varies from empty fruit bunches, fibers, shells,palm trunks which each contains different levels of energy and thepotential amount as demonstrated in Table 1. Oil palm has a verygood potential in producing alternative energy due to its calorific

S. Ahmad et al. / Renewable and Sustainable
Fig. 3. Component of irradiation [12].
caopBc
2200 kcal/kg is 640 kW/day. In 2009, approximately, 21,000 tonnes
TO
Fig. 4. Biomass contributions from various industries in Malaysia [14].
ontains. With 50% efficiency, biomass from oil palm can gener-
te 8 Mtoe of energy, and can save RM 7.5 billion per year of crudeil. In 2007, for each hectare of 4.3 million hectares of oil palmlantations, about 50–70 tonnes of biomass residues are generated.esides oil palm, other agricultural waste such as bagasse, sugar-ane, rice husks and wood waste residues also contribute to theable 1il palm biomass collected and energy potential in 2005 based on component.
Biomass component Quantity available (million tonnes)
Empty fruit brunches (EFB) 17.00Fiber 9.6Shell 5.92Fonds and trunks 21.1Palm kernel 2.11Total 55.73
Energy Reviews 15 (2011) 897–904 899
total biomass residues [15–17]. As of July 2009, a total of 39 MWis under construction and it is estimated potential is 1340 MW by2030 [14].
2.3. Mini-Hydro
With a total 330,000 km2 of land area, Malaysia is covered with42% of highlands area, namely some, Titiwangsa, Tahan, KapuasHulu, Crocker and Brassey. Blessed with abundant streams andrivers flowing from highland areas, Malaysia has numerous sitesof hydro power potential. Currently, Malaysia has utilized thesepotential in the range of large and mini hydropower. In 2009,there are 12 large-scale hydropower stations and 50 mini scalehydropower stations available. In total, Malaysia has hydropowerelectricity generating capacity of about 18,500 MW in Malaysia. InJuly 2009, a total of 30.3 MW of mini-hydro is under constructionand the expected potential by 2020 is 490 MW. Besides mini-hydro,micro hydro with a capacity ranges from 5 kW to 100 kW also hasa good potential in electricity generation and not yet fully utilizedin Malaysia [14,18].
2.4. Biogas and municipal solid waste
In Malaysia, biogas is commonly produced under anaerobic con-ditions using waste management facilities. Main sources includemunicipal landfills, Palm Oil Mill Effluent (POME) anaerobic ponds,industrial anaerobic ponds and agricultural anaerobic ponds. Theenergy content of biogas is mainly dependant on the methane con-tent. Based on a study on the Clean Development Mechanism (CDM)potential in the waste sectors, it was found that the most potentialis where anaerobic degradation takes place within the municipallandfills and POME ponds. The potential sizes of recovery and its rel-ative power and heat potential for feasible projects are presentedbelow in Table 2. In July 2009, a total of 4.45 MW is under construc-tion and potential of biogas by 2028 is 410 MW [14,19].
Composition of solid waste in Malaysia can be divided into sev-eral groups: commercial, domestic, industrial, construction andmunicipal. Among these, domestic solid waste contributes themost, comprising almost half of the total waste. The average ofMSW generated per person per day is 0.5–0.8 kg, but in major citiesthe value increases to around 1 kg per person per day. Mostly, thelandfill method is being employed for disposing waste material,but in major cities, incineration is taking place. As the populationincreases, Malaysia will experience a growing production of MSW,thus creating bigger environmental problems to Malaysia. Based ona research, MSW from Kuala Lumpur alone contains 57% of organiccontent, thus the potential value of energy generation is higher. Thecalorific value of Malaysian MSW ranges from 1500 to 2600 kcal/kgand the energy potential from an incineration plant operating basedon 1500 tonnes of MSW/day with an average calorific value of
of solid waste is produced daily. It is projected, by 2020; the Munic-ipal Solid Waste will reach more than 9 million tonnes per year[20–22]. In August 2009, the status of solid waste power generationis 5.5 MW and by 2022, the potential is 360 MW [14] (Fig. 5).
Calorific value (kJ/kg) Potential energy generated(Mtoe)
18838 7.6519068 4.3721108 2.84
– –18900 0.95
– 15.81
900 S. Ahmad et al. / Renewable and Sustainable Energy Reviews 15 (2011) 897–904
Table 2Power and heat potential from CDM projects waste sectors.
Waste sectors (mT/yr) Methane recovery potential (mT/yr) Total technical power potential (MW) Feasible totala installed capacity (MW)
MSW landfill 176,000 173 45Palm Oil Processingb (POME) 245,000 330 160Swine farmingc 35,500 46 23Other industriesd (wastewater) 8000 35 7Sewage Negligible Negligible Negligible
a Total installed capacity is derived based on the power plant operation of 80% capacity factor i.e. 7008 h per year. Feasible projects based on ROE higher than 15% andattractive with CDM financing.
b For POME, gas engine cogen which produces power and heat is the technology based. The power efficiency of gas engine cogen is assumed at 30% where else thermalefficiency at 50%.
c When heat is not necessary, power generation only by gas engine is base where the pd Power/heat generation is calculated based on the heating value of methane (55.4 GJ/ton
conversion factor (0.278).
F2
3
yagmeei
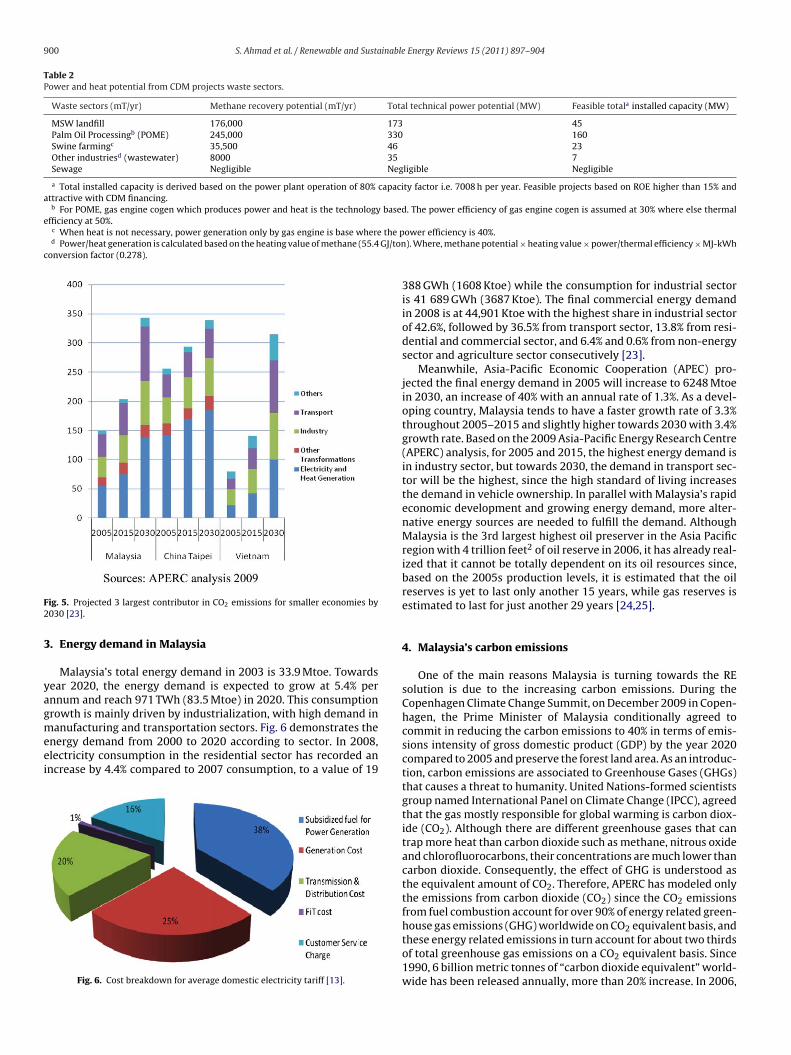
ig. 5. Projected 3 largest contributor in CO2 emissions for smaller economies by030 [23].
. Energy demand in Malaysia
Malaysia’s total energy demand in 2003 is 33.9 Mtoe. Towardsear 2020, the energy demand is expected to grow at 5.4% pernnum and reach 971 TWh (83.5 Mtoe) in 2020. This consumption
rowth is mainly driven by industrialization, with high demand inanufacturing and transportation sectors. Fig. 6 demonstrates thenergy demand from 2000 to 2020 according to sector. In 2008,lectricity consumption in the residential sector has recorded anncrease by 4.4% compared to 2007 consumption, to a value of 19
Fig. 6. Cost breakdown for average domestic electricity tariff [13].
ower efficiency is 40%.). Where, methane potential × heating value × power/thermal efficiency × MJ-kWh
388 GWh (1608 Ktoe) while the consumption for industrial sectoris 41 689 GWh (3687 Ktoe). The final commercial energy demandin 2008 is at 44,901 Ktoe with the highest share in industrial sectorof 42.6%, followed by 36.5% from transport sector, 13.8% from resi-dential and commercial sector, and 6.4% and 0.6% from non-energysector and agriculture sector consecutively [23].
Meanwhile, Asia-Pacific Economic Cooperation (APEC) pro-jected the final energy demand in 2005 will increase to 6248 Mtoein 2030, an increase of 40% with an annual rate of 1.3%. As a devel-oping country, Malaysia tends to have a faster growth rate of 3.3%throughout 2005–2015 and slightly higher towards 2030 with 3.4%growth rate. Based on the 2009 Asia-Pacific Energy Research Centre(APERC) analysis, for 2005 and 2015, the highest energy demand isin industry sector, but towards 2030, the demand in transport sec-tor will be the highest, since the high standard of living increasesthe demand in vehicle ownership. In parallel with Malaysia’s rapideconomic development and growing energy demand, more alter-native energy sources are needed to fulfill the demand. AlthoughMalaysia is the 3rd largest highest oil preserver in the Asia Pacificregion with 4 trillion feet2 of oil reserve in 2006, it has already real-ized that it cannot be totally dependent on its oil resources since,based on the 2005s production levels, it is estimated that the oilreserves is yet to last only another 15 years, while gas reserves isestimated to last for just another 29 years [24,25].
4. Malaysia’s carbon emissions
One of the main reasons Malaysia is turning towards the REsolution is due to the increasing carbon emissions. During theCopenhagen Climate Change Summit, on December 2009 in Copen-hagen, the Prime Minister of Malaysia conditionally agreed tocommit in reducing the carbon emissions to 40% in terms of emis-sions intensity of gross domestic product (GDP) by the year 2020compared to 2005 and preserve the forest land area. As an introduc-tion, carbon emissions are associated to Greenhouse Gases (GHGs)that causes a threat to humanity. United Nations-formed scientistsgroup named International Panel on Climate Change (IPCC), agreedthat the gas mostly responsible for global warming is carbon diox-ide (CO2). Although there are different greenhouse gases that cantrap more heat than carbon dioxide such as methane, nitrous oxideand chlorofluorocarbons, their concentrations are much lower thancarbon dioxide. Consequently, the effect of GHG is understood asthe equivalent amount of CO2. Therefore, APERC has modeled onlythe emissions from carbon dioxide (CO2) since the CO2 emissionsfrom fuel combustion account for over 90% of energy related green-
house gas emissions (GHG) worldwide on CO2 equivalent basis, andthese energy related emissions in turn account for about two thirdsof total greenhouse gas emissions on a CO2 equivalent basis. Since1990, 6 billion metric tonnes of “carbon dioxide equivalent” world-wide has been released annually, more than 20% increase. In 2006,
inable
im[gihtiTs
5S
mtodictftttanrppfmt[
rbeactttongteo2R
upoPcPcgwdDv
S. Ahmad et al. / Renewable and Susta
n the South-east Asian region, Malaysia falls in third place with 187illion tonnes of carbon emissions, behind Indonesia and Thailand
27]. And in the APEC region alone, fuel combustion is projected torow around 40% towards 2030 from a value of 16.6 billion tonesn 2005 to 23.2 billion tones in 2030 and out of this number almostalf of the shares come from Electricity and Heat Generation sec-or. From this value, for smaller-economies country, Malaysia fallsnto the second largest contributor for CO2 emissions after Taipei,aiwan for 2005 and 2015, but is projected to lead in 2030 withlightly higher amount than Taipei as in Fig. 5 [24–27].
. Sequence of Malaysia’s actions towards Greener Energyolutions
Although only lately Malaysia is seen to be aggressively pro-oting RE as a source of energy, it has already realized the need
o diversify energy resources since the 1970s, during the worldil crisis, when it reveals the vulnerability of energy supply andemonstrated the world’s overdependence on oil as a fuel. Thus,
n that era, the development of energy-related legislation and poli-ies were prepared to address energy requirements. As a result,he National Energy Policy was introduced in 1979 to tackle theuture energy sector developments. The essence in the implemen-ation of this policy includes guiding the future development inhe supply, utilization and environmental energy sector. Amonghe objectives are: (1) to ensure the provision of adequate, secure,nd cost-effective energy supplies through developing indige-ous energy resources both non-renewable and renewable energyesources using the least cost options and diversification of sup-ly sources both from within and outside the country, (2) toromote the efficient utilization of energy and to discourage waste-ul and non-productive patterns of energy consumption, (3) to
inimize the negative impacts of energy production, transporta-ion, conversion, utilization and consumption on the environment27–29].
Since then, from time to time, energy legislation was beingeviewed. Yet, only in 1999, renewable energy was made visi-le through the addition of non-hydro RE resource to its fourxisting fuel sources for electric power generation; oil, gas, coalnd hydro. This new strategy was called the Five-Fuel Diversifi-ation Strategy and it was implemented in the 8th Malaysia Plan,hroughout 2001–2005. The focus of this plan is to promote sus-ainable development whereby under chapter 11 – Energy, it aimso provide reliable, secure, high quality and cost-effective supplyf energy with efficient utilization of energy and RE as a new alter-ative source. It also includes incentive mechanisms to promotereater utilization of RE resources including giving 70% less statu-ory income, and dismissed import duty and tax of machinery andquipment. Under this plan, Malaysia has targeted to generate 5%f the country’s electricity from RE source but unfortunately, by005, the country only achieved approximately 0.3% of its targetedE electricity generation [30].
Subsequently, in the 9th Malaysia Plan for 2006–2010, greatertilization of renewable energy is promoted, and a more integratedlanning approach was set to enhance the sustainable developmentf energy sector [31]. Under the Small Renewable Energy Powerrogramme (SREP), 2 successful projects with a combined gridonnected capacity of 12 MW were implemented. One located inuchong, Selangor with a 2 MW installed capacity fueled by biogasaptured from the landfill area and another in Kunak, Sabah with
eneration capacity of 14 MW fuelled by oil palm residues. Bothere commissioned in 2004 [32]. Moreover, a detailed plan for theevelopment of solar, hydrogen and fuel cells was also formulated.uring this plan period, the Malaysia Building Integrated Photo-oltaic Technology Application Project (MBIPV) was also launchedEnergy Reviews 15 (2011) 897–904 901
to promote a wider application of photovoltaic technology in build-ings.
Recently, the Malaysian Ministry of Energy, Water and Commu-nication (KTAK) was re-established as a result of the stern efforts inthe promotion of efficient use of energy and RE as energy sources. Anew function was added to the ministry, during the cabinet reshuf-fle, and the ministry is now known as Ministry of Energy, GreenTechnology and Water (KeTTHA). The new missions of KeTTHA are(1) to formulate policies and establish effective legal and regulatoryframework; (2) to set the direction for the energy industry, greentechnology and water industry in line with national developmentobjectives; and (3) to develop an efficient management system andeffective monitoring mechanism. Based on KeTTHA’s definition,Green Technology products, equipment or systems must complyto certain criteria such that (1) it minimizes the degradation of theenvironment, (2) it has zero or low green house gas (GHG) emission,(3) it is safe for use and promotes healthy and improved environ-ment for all forms of life, (4) it conserves the use of energy and nat-ural resources and (5) it promotes the use of renewable resources.This ministry also has set the 4 mainstay of its Green TechnologyPolicies which includes issues in Energy, Environment, Economyand Social. The description of each issue is clearly stated, which are,respectively, to seek and attain energy independence and promoteefficient utilization, conserve and minimize the impact on the envi-ronment, enhance the national economic development through theuse of technology and improve the quality of life for all. The stepstaken show the readiness of Malaysia in managing global issueson energy generation and the effect on the environment. The cli-max to these sequences of event, the National Green TechnologyPolicy was launched on July 24th 2009. This policy contains 5 strate-gic thrusts, namely, (1) strengthen the Institutional Framework,(2) provide conducive environment for Green Technology Devel-opment, (3) intensify Human Capital Development, (4) intensifyGreen Technology Research and Innovations and (5) promotion andPublic Awareness. This policy also includes long term goals, and itcovers until the 12th Malaysia Plan (2021–2025) [29,30].
5.1. Key barrier in renewable energy in Malaysia
5.1.1. Possible key barrier in MalaysiaMalaysian government had ratified the Kyoto Protocol in
September 2002, under the third mechanism, the Clean Devel-opment Mechanism (CDM). The first Malaysian project to beregistered at the UNFCC as a CDM project was the Biomass EnergyPlant in Lumut (capacity of 1600 MW) while the first large scaleCDM was a project in Jana Manjung (capacity of 2100 MW) usingbiomass and coal. However, the initiative made appears to beunsuccessful, when the target of 5% contribution for 2010 fromrenewable energy from the energy mix is far from being achieved,with only 1.8% contribution [33,34].
In order to promote Renewable Energy generally, the CleanDevelopment Mechanism (CDM) must have a stronger impact. Todo this, significant efforts must be made to remove barriers in thedissemination of renewable energy technology. Among the mostpopular barrier is the fuel subsidy in which Malaysia provides enor-mous subsidy that result in a cheap electric price from the nationalgrid. Besides, RET is hindered by shortage of huge investment andmanpower due to lack of interest from commercial investors with-out any security given by any act and policy. In addition, the lackof technical know-how from the relevant agencies has led to poor-quality products and given renewable energy applications a bad
reputation [35].5.1.2. Removing key barrierIn principle, there are 2 approaches in addressing the economic
performance of RET by bringing down the costs of RET and their

902 S. Ahmad et al. / Renewable and Sustainable Energy Reviews 15 (2011) 897–904
Table 3Electricity demand and supply.
2001 2002 2003 2004 2005 2006 2007 2008 2009 2010
Peak demand (MW) 11,055 11,833 12,504 13,848 13,809 14,375 15,172 15,540 15,943 16,332
S TenagB
rRoicTts
fusyanfiteNshbtRoiointetissltpscpc
if approved, the program will be launched at earliest by second
TF
Installed capacity (MW) 14,761 15,483 18,562 19,423Reserve margin (%) 33.5 30.8 48.4 40.3
ources: Economic Planning Unit, Ministry of Energy, Green Technology and Water,erhad.
elated energy services and abolishing market distortions againstET such as direct subsidies of fossil fuel or lacking internalizationf external costs. In evidence, the first approach can be done bymplementing policies that can successfully encourage technologi-al development and cost savings by creating enabling frameworks.he second approach, is described as ‘leveling the playing field’ sohat RET and conventional energy technologies can compete at theame level [35] (Table 3).
Benjamin K. Sovacool through his interviews of participantsrom consumers and consumer advocates, members from electrictilities, independent power provider and regulatory agencies attate and federal level from 93 institutions of 13 countries over a 3ear period, found that the four most favorable policy mechanismre: eliminating subsidies, pricing electricity accurately, creating aational feed-in tariff, and implementing a national systems bene-t fund as in Table 4. He suggested for mature energy technologies,he subsidies are best eliminated by immediately repealing it. How-ver, the Federal Ministry of Environment, Nature Conservation anduclear Safety suggest that by implementing gradual reductions in
ubsidies over a period of time it will avoid social unrest besideselping the population to accept it better in a transparent mannery highlighting its long term necessity and advantages. The advan-ages of subsidy policies redesign is to ensure the dissemination ofET and help ease the burden on public budgets due to the upkeepf rising prices of fossil fuels because of the shortage and grow-ng world demand. In addition, it is essential to strengthen the rolef independent power producers (IPPs), by giving priority to thenterests of renewable-energy based IPPs due to the decentralizedature of RE that needs a higher number of operators’ implemen-ation which has been a key driver in the growth of Germany’slectricity sector and China’s RE law. Besides removing the barriershat negatively impact RET, it is also essential to introduce support-ve policies that can positively push them into the market. Otherupportive measures include establishing quality manufacturingtandards for renewable energy equipment, establishing dedicatedoan facilities with low interest rates to finance for RET, loweringaxes and customs duties on RET equipment, giving practical sup-ort to those who implement renewable energy technology and
ignificantly raising public awareness of renewable energy throughampaigns on all media, and building technical capacity. These sup-ortive measures can help the intersection of the cost of RET withonventional energy by 2030, taking into account the external costable 4our most preferred energy efficiency and renewable power policy mechanism.
Impediment Policy
Political support for RE has beeninconsistent and unfair
Eliminate subsidies
Consumers do not receive accurateprice signals for electricity
Create accurate electricity prices
Utilities and businesses generally willnot invest in renewable power
Make renewable energy mandat
The public is uninformed about energyefficiency and renewable energy
Inform the public and protect the
19,380 20,125 21,559 21,637 24,015 24,18740.3 40.0 42.1 39.2 50.6 48.1
a Nasional Berhad, Sabah Electricity Sdn. Bhd. and Sarawak Electricity Corporation
of conventional energy technologies, falling RET prices and the ris-ing prices of fuel [35–37] (Table 5).
5.1.3. Current situation in Malaysian RE scenarioMalaysian Government has taken continuous effort in the devel-
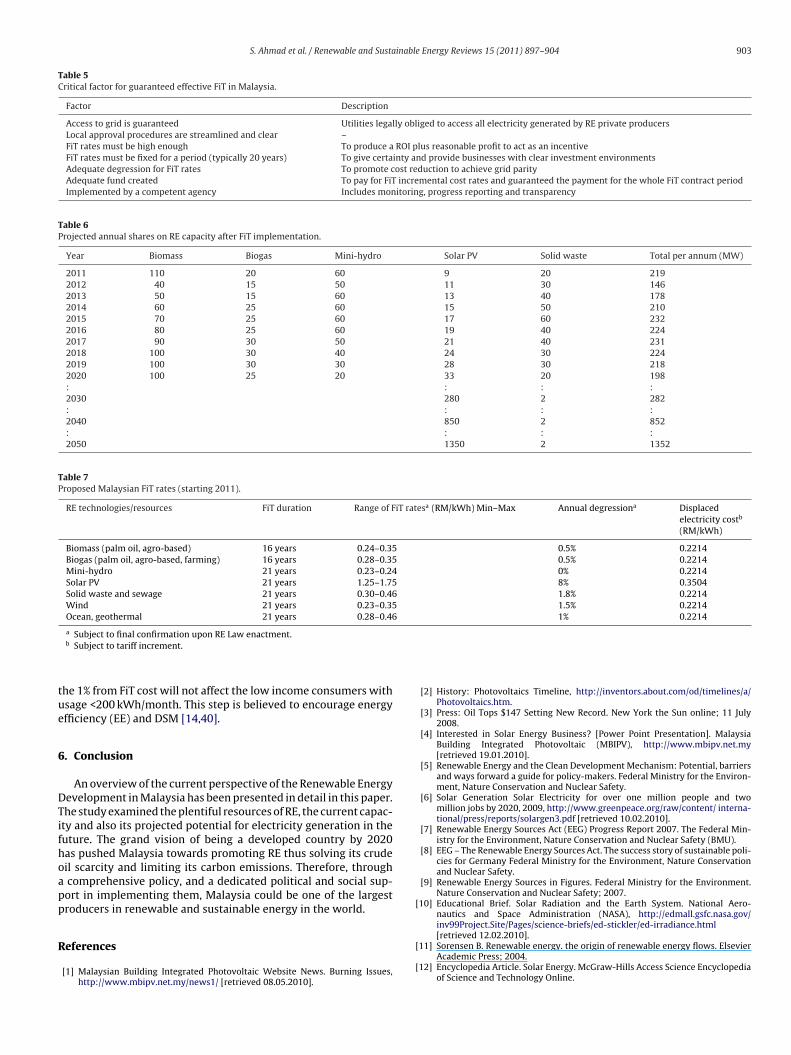
opment of RE through various support and promotion programmessuch as Malaysian Industrial Energy Efficiency ImprovementProject (MIEEIP), Small Renewable Energy Power Programme(SREPP), Building Energy Efficiency Programme (BEEP), GreenBuilding Index (GBI) and Malaysia Building Integrated PhotovoltaicTechnology Application (MBIPV) and Biomass Grid-ConnectedPower Generation and Co-Generation (Biogen) [38]. These effortshave provided a good platform for the growth of renewable ener-gies in Malaysia. By 31st December 2009, the RE of grid capacityalready reached 440 MW while RE capacity connected to powerutility grid is 55.5 MW. Recently, the Malaysian cabinet approvedthe RE act and Act for FiT Implementing Agency on 2nd April 2010,followed by the formal announcement of the National RS Policy andAction Plan under the 10th Malaysia Plan on 10th June 2010 [39].The plan was to implement FiT based on the ‘polluters pay con-cept’ where consumers with high electricity bills will have to paymore for their carbon emissions. The so-called ‘Renewed’ Renew-able Energy Initiative will be implemented in the 10th MalaysiaPlan (2011–2015) and beyond where the policy statement of theNational RE Policy is enhancing the utilization of indigenous renew-able energy resources to contribute towards national electricitysupply security and sustainable socio-economic development. Theobjectives are (1) to increase RE contribution in the national powergeneration mix, (2) to facilitate the growth of the RE industry; (3)to ensure reasonable RE generation costs, (4) to conserve the envi-ronment for future generation; and (5) to enhance awareness onthe role and importance of RE [14,39].
The goal is to increase electricity supply from RE to 5.5% of theenergy mix by 2015. The expected annual share on RE capacityannually is shown in Table 6. Soon, the Renewable Energy Act andthe Act for a Feed-in Tariff will be debated in October 2010, and
quarter of 2011 and will be managed by the Sustainable EnergyDevelopment Authority (SEDA). The source of funds for FiT is shownas in Fig. 6 and the proposed Fit rates are as shown in Table 7. Forevery RM100 per month paid, RM1 will go to the funding of FiT and
Details
Immediately repeal federal government subsidies formature energy technologiesAbolish electricity rate caps, eliminate declining block ratepricing, reflect time of use in electricity rates, andinternalize external costs
ory Create a national feed-in tariff (FIT) and guaranteerenewable power generators access the grid
poor Establish a national systems benefit charge (SBC) togenerate revenue to distribute information and educatethe public, provide low-income assistance andweatherization, and fund energy efficiency and demandsite management (DSM) programmes
S. Ahmad et al. / Renewable and Sustainable Energy Reviews 15 (2011) 897–904 903
Table 5Critical factor for guaranteed effective FiT in Malaysia.
Factor Description
Access to grid is guaranteed Utilities legally obliged to access all electricity generated by RE private producersLocal approval procedures are streamlined and clear –FiT rates must be high enough To produce a ROI plus reasonable profit to act as an incentiveFiT rates must be fixed for a period (typically 20 years) To give certainty and provide businesses with clear investment environmentsAdequate degression for FiT rates To promote cost reduction to achieve grid parityAdequate fund created To pay for FiT incremental cost rates and guaranteed the payment for the whole FiT contract periodImplemented by a competent agency Includes monitoring, progress reporting and transparency
Table 6Projected annual shares on RE capacity after FiT implementation.
Year Biomass Biogas Mini-hydro Solar PV Solid waste Total per annum (MW)
2011 110 20 60 9 20 2192012 40 15 50 11 30 1462013 50 15 60 13 40 1782014 60 25 60 15 50 2102015 70 25 60 17 60 2322016 80 25 60 19 40 2242017 90 30 50 21 40 2312018 100 30 40 24 30 2242019 100 30 30 28 30 2182020 100 25 20 33 20 198: : : :2030 280 2 282: : : :2040 850 2 852: : : :2050 1350 2 1352
Table 7Proposed Malaysian FiT rates (starting 2011).
RE technologies/resources FiT duration Range of FiT ratesa (RM/kWh) Min–Max Annual degressiona Displacedelectricity costb
(RM/kWh)
Biomass (palm oil, agro-based) 16 years 0.24–0.35 0.5% 0.2214Biogas (palm oil, agro-based, farming) 16 years 0.28–0.35 0.5% 0.2214Mini-hydro 21 years 0.23–0.24 0% 0.2214Solar PV 21 years 1.25–1.75 8% 0.3504Solid waste and sewage 21 years 0.30–0.46 1.8% 0.2214Wind 21 years 0.23–0.35 1.5% 0.2214Ocean, geothermal 21 years 0.28–0.46 1% 0.2214
tue
6
DTifhoapp
R
[
a Subject to final confirmation upon RE Law enactment.b Subject to tariff increment.
he 1% from FiT cost will not affect the low income consumers withsage <200 kWh/month. This step is believed to encourage energyfficiency (EE) and DSM [14,40].
. Conclusion
An overview of the current perspective of the Renewable Energyevelopment in Malaysia has been presented in detail in this paper.he study examined the plentiful resources of RE, the current capac-ty and also its projected potential for electricity generation in theuture. The grand vision of being a developed country by 2020as pushed Malaysia towards promoting RE thus solving its crudeil scarcity and limiting its carbon emissions. Therefore, throughcomprehensive policy, and a dedicated political and social sup-ort in implementing them, Malaysia could be one of the largestroducers in renewable and sustainable energy in the world.
eferences
[1] Malaysian Building Integrated Photovoltaic Website News. Burning Issues,http://www.mbipv.net.my/news1/ [retrieved 08.05.2010].
[
[
[2] History: Photovoltaics Timeline, http://inventors.about.com/od/timelines/a/Photovoltaics.htm.
[3] Press: Oil Tops $147 Setting New Record. New York the Sun online; 11 July2008.
[4] Interested in Solar Energy Business? [Power Point Presentation]. MalaysiaBuilding Integrated Photovoltaic (MBIPV), http://www.mbipv.net.my[retrieved 19.01.2010].
[5] Renewable Energy and the Clean Development Mechanism: Potential, barriersand ways forward a guide for policy-makers. Federal Ministry for the Environ-ment, Nature Conservation and Nuclear Safety.
[6] Solar Generation Solar Electricity for over one million people and twomillion jobs by 2020, 2009, http://www.greenpeace.org/raw/content/ interna-tional/press/reports/solargen3.pdf [retrieved 10.02.2010].
[7] Renewable Energy Sources Act (EEG) Progress Report 2007. The Federal Min-istry for the Environment, Nature Conservation and Nuclear Safety (BMU).
[8] EEG – The Renewable Energy Sources Act. The success story of sustainable poli-cies for Germany Federal Ministry for the Environment, Nature Conservationand Nuclear Safety.
[9] Renewable Energy Sources in Figures. Federal Ministry for the Environment.Nature Conservation and Nuclear Safety; 2007.
10] Educational Brief. Solar Radiation and the Earth System. National Aero-nautics and Space Administration (NASA), http://edmall.gsfc.nasa.gov/
inv99Project.Site/Pages/science-briefs/ed-stickler/ed-irradiance.html[retrieved 12.02.2010].11] Sorensen B. Renewable energy. the origin of renewable energy flows. ElsevierAcademic Press; 2004.
12] Encyclopedia Article. Solar Energy. McGraw-Hills Access Science Encyclopediaof Science and Technology Online.
9 inable
[
[
[
[[
[
[
[
[
[
[
[
[
[
[
[
[[
[
[
[
[
[
[
[
[
Sustainable Energy Reviews 2010;14:2916–25.[39] Haris AH. Industry Briefing on Feed-in Tariff Procedures [Power Point Slides],
04 S. Ahmad et al. / Renewable and Susta
13] Kadir MZAA, Rafeeu Y. A review on factors for maximizing solar fraction underwet climate environment in Malaysia. Renewable and Sustainable EnergyReviews 2010;14:2243–8.
14] Haris AH. Introduction and The Malaysian Feed-in Tariff Scenario (presen-tation material) Malakoff Community Partnerships: Energy Expert Series,http://www.mbipv.net.my; 2010 [retrieved 08.05.2010].
15] Shuit SH, Tan KT, Lee KT, Kamaruddin AH. Oil palm biomass as a sustainableenergy source: a Malaysian case study. Energy 2009;34:1225–35.
16] Press: Malaysia must tap oil palm biomass potential. The Star Online; 2010.17] WanAsma I, Mahanim S, Zulkafli H, Othman S, Mori Y. Malaysian oil palm
biomass. In: Regional Workshop on UNEP/DTIE/IETC in Collaboration with GEC,March. 2010.
18] Raman N, Hussein I, Palanisamy K. Micro hydro potential in West Malaysia. In:3rd International Conference on Energy and Environment. 2009.
19] Evald A. Renewable Energy Resources. Energy Information Bureau. MalaysiaEnergy Centre (PTM), http://eib.org.my/index.php?page=article&id=2[retrieved 08.03.2010].
20] Kathirvale S, Yunus MNM, Sopian K, Samsuddin AH. Energy potential frommunicipal solid waste in Malaysia. Renewable Energy 2004;29:559–67.
21] Saeed MO, Hassan MN, Mujeebu MA. Assessment of municipal solid waste gen-eration and recyclable materials potential in Kuala Lumpur, Malaysia. WasteManagement 2009;29:2209–13.
22] Hashim M. Present status and problems of biomass energy utilization inMalaysia (presentation material). In: APECATC Workshop on Biomass Utiliza-tion. 2005.
23] Energy Outlook of Malaysia. Energy Information Bureau, Malaysia EnergyCentre (PTM), http://eib.org.my/index.php?page=article&id=2 [retrieved08.03.2010].
24] APEC Energy Demand and Supply Outlook. 4th ed. APERC Asia Pacific
Energy Research Centre; 2009. http://www.ieej.or.jp/aperc/ 2009pdfOut-look Volume I 4E.pdf [retrieved 10.03.2010].25] APEC Energy Demand and Supply Outlook. http://www.ieej.or.jp/aperc/2006pdf/Outlook2006//ER Malaysia.pdf; 2006 [retrieved 10.03.2010].
26] Press: UK lauds Malaysia’s pledge to cut carbon emissions. The Star Online;2009.
[
Energy Reviews 15 (2011) 897–904
27] Omer AM. Energy environment and sustainable development. Renewable andSustainable Energy Reviews 2008;12:2265–300.
28] Energy Policy and Planning. Energy Information Bureau Website,http://eib.org.my/index.php?page=article&item=99.
29] Ministry of Energy, Green Technology and Water, http://www.kettha.gov.my.30] Economic Planning Unit: 8th Malaysia Plan, http://www.epu.gov.my/ eight-
malaysiaplan.31] Economic Planning Unit: 9th Malaysia Plan, http://www.epu.gov.my/
html/themes.rm9.32] Energy sector embracing climate change. In: National Conference on Climate
Change Preparedness towards Policy Changes. 2007.33] Bumipower Biomass Power Plant Project in Malaysia,
http://www.dnv.com/focus/climate change/upload/pdd bumibiopower%20bi-omass 2004-03-19.pdf [retrieved 13.08.2010].
34] Oh TH, Pang SY, Chua SC. Energy policy and alternative energy in Malaysia:issues and challenges for sustainable growth. Renewable and SustainableEnergy Reviews 2010;14:1241–52.
35] Renewable energy and the clean development mechanism: potential, barriersand ways forward a guide for policy-makers. Federal ministry for the environ-ment. Nature Conservation and Nuclear Safety; 2007.
36] Sovacool BK. The importance of comprehensiveness in renewable electricityand energy-efficiency policy. Energy Policy 2009;37:1529–41.
37] Kadir MZAAb, Rafeeu Y, Adam NM. Prospective scenarios for the full solarenergy development in Malaysia. Renewable and Sustainable Energy Reviews2010;14:3023–31.
38] Chua SC, Oh TH. Review on Malaysia’s National energy developments; keypolicies, agencies, programmes and international involvement. Renewable and
http://mbipv.net.my/Re Industry Briefing on FiT.pdf [Retrieved 20.05.2010].40] Malaysia’s 2011 Proposed Solar, Biomass, Biogas & Hydro Tariffs,
http://www.renewableenergyworld.com/rea/news/article/2010/08/malaysias-2011-proposed-solar-biomass-biogas-hydro-tariffs [retrieved 21.05.2010].