Crustal thicknesses and Poisson's ratios in China by joint analysis of teleseismic receiver...
6
Crustal thicknesses and Poisson’s ratios in China by joint analysis of teleseismic receiver functions and Rayleigh wave dispersion Yanlu Ma 1 and Huilan Zhou 1 Received 2 March 2007; revised 11 May 2007; accepted 22 May 2007; published 22 June 2007. [1] A new grid search scheme, which extends the stacking H-k algorithm to multi-layered crustal models and fits observed dispersion of surface wave group velocity simultaneously, is proposed to estimate the thickness, Poisson’s ratio, and average P wave speed of the crust. We first apply it to a synthetic data of a 2-layered crustal model. Then we show the results analyzing records from 45 permanent broadband seismic stations in China. The estimates at six stations agree well with results from deep seismic sounding profiles. The crustal thicknesses agree in general with the Crust 2.0 model. We find that the Poisson’s ratio in the Yangtze platform is rather low compared with the other two platforms. The stations along the southeast coast of China have higher Poisson’s ratios. The Poisson’s ratio of the whole region tends to increase as the average P-wave velocity. Citation: Ma, Y., and H. Zhou (2007), Crustal thicknesses and Poisson’s ratios in China by joint analysis of teleseismic receiver functions and Rayleigh wave dispersion, Geophys. Res. Lett., 34, L12304, doi:10.1029/2007GL029848. 1. Introduction [2] The estimates of crustal thickness, average P velocity and Poisson’s ratio from seismic waves can provide helpful constraints on the bulk crustal composition and evolution models [Christensen and Mooney , 1995]. The converted phase Ps and Moho multiples (PpPs, PsPs, PpSs, etc.) which could be identified from teleseismic receiver func- tions had been used to determine crustal thickness (H) and V P /V S ratio (k), therefore Poisson’s ratio (s)[Zandt and Ammon, 1995; Zhu and Kanamori, 2000; Chevrot and van der Hilst, 2000]. However even for a single layered average crustal model in the H-k method [Zhu and Kanamori, 2000], the contours on the depth-V P /V S ratio plane generally show as a thin ridge which reflect the depth-V P /V S ratio trade-off in inversion of receiver functions. The depth- velocity trade-off demonstrated by Ammon et al. [1990] occurs when the average crustal P velocity is changed in the H-k method. In order to reduce the nonuniqueness, surface wave dispersion measurements have been complemented to teleseismic receiver functions for determining both discon- tinuities and velocity profile [Julia ` et al., 2000]. As surface wave dispersion primarily depends on shear wave speed, the P velocity in surface wave tomography [Huang et al., 2003] is often calculated from the S velocity using empirical formula, and the discontinuities are located ini- tially according to previous studies. Instead of resolving detailed crustal structure, we propose a new grid searching method in the study to estimate the average crustal P velocity and relocate the Moho discontinuity in the background velocity structure obtained from inversion of Rayleigh wave dispersion by taking advantage of receiver function and dispersion observations simultaneously. 2. Data and Method [3] 3-component teleseismic waveforms of about 230 earth- quakes recorded on 45 permanent broadband stations throughout China (Figure 1) are used for generating receiver functions in the study. The events occurred between 2000 and 2005 with magnitude greater than 5.5 and epicentral distance from 30° to 95°. The recordings which have clear P arrival in the vertical component and low pre-signal noise in all three components are kept. After the P onset is picked by hand, the raw seismograms are cut with a time window of 20 s before the P to 110 s after. The two horizontal components are rotated to the radial and tangen- tial directions. A receiver function is then constructed by deconvolving the vertical component from the radial com- ponent using the iterative approach [Ligorrı ´a and Ammon, 1999]. The Gaussian parameter is chosen to be 2.0. [4] The dispersion data set in the study is the group velocities of fundamental Rayleigh waves which are taken from a surface wave tomography of China by Huang et al. [2003]. [5] To incorporate the dispersions, the H-k stacking method is extended to include multi-layered crust. The traveltime difference of between P and Ps phases is calcu- lated as t Ps ¼ X nc i¼1 h i ffiffiffiffiffiffiffiffiffiffiffiffiffiffiffiffi 1 V 2 Si p 2 s ffiffiffiffiffiffiffiffiffiffiffiffiffiffiffiffi 1 V 2 Pi p 2 s ! ; ð1Þ where n c is the number of layers in the crust, V Pi and V Si are P-wave and S-wave velocity in the ith layer with a thickness h i , and p is the ray parameter of the incident P wave. Similarly the traveltime differences between P and multiples PpPs, PsPs + PpSs phases are: t PpPs ¼ X nc i¼1 h i ffiffiffiffiffiffiffiffiffiffiffiffiffiffiffiffi 1 V 2 Si p 2 s þ ffiffiffiffiffiffiffiffiffiffiffiffiffiffiffiffi 1 V 2 Pi p 2 s ! ; ð2Þ and t PsPsþPpSs ¼ X nc i¼1 2h i ffiffiffiffiffiffiffiffiffiffiffiffiffiffiffiffi 1 V 2 Si p 2 s : ð3Þ GEOPHYSICAL RESEARCH LETTERS, VOL. 34, L12304, doi:10.1029/2007GL029848, 2007 1 Laboratory of Computational Geodynamics, College of Earth Sciences, Graduate University of Chinese Academy of Sciences, Beijing, China. Copyright 2007 by the American Geophysical Union. 0094-8276/07/2007GL029848 L12304 1 of 6
Transcript of Crustal thicknesses and Poisson's ratios in China by joint analysis of teleseismic receiver...
Crustal thicknesses and Poisson’s ratios in China by joint analysis of
teleseismic receiver functions and Rayleigh wave dispersion
Yanlu Ma1 and Huilan Zhou1
Received 2 March 2007; revised 11 May 2007; accepted 22 May 2007; published 22 June 2007.
[1] A new grid search scheme, which extends the stackingH-k algorithm to multi-layered crustal models and fitsobserved dispersion of surface wave group velocitysimultaneously, is proposed to estimate the thickness,Poisson’s ratio, and average P wave speed of the crust.We first apply it to a synthetic data of a 2-layered crustalmodel. Then we show the results analyzing records from45 permanent broadband seismic stations in China. Theestimates at six stations agree well with results from deepseismic sounding profiles. The crustal thicknesses agree ingeneral with the Crust 2.0 model. We find that the Poisson’sratio in the Yangtze platform is rather low compared withthe other two platforms. The stations along the southeastcoast of China have higher Poisson’s ratios. The Poisson’sratio of the whole region tends to increase as the averageP-wave velocity. Citation: Ma, Y., and H. Zhou (2007),
Crustal thicknesses and Poisson’s ratios in China by joint analysis
of teleseismic receiver functions and Rayleigh wave dispersion,
Geophys. Res. Lett., 34, L12304, doi:10.1029/2007GL029848.
1. Introduction
[2] The estimates of crustal thickness, average P velocityand Poisson’s ratio from seismic waves can provide helpfulconstraints on the bulk crustal composition and evolutionmodels [Christensen and Mooney, 1995]. The convertedphase Ps and Moho multiples (PpPs, PsPs, PpSs, etc.)which could be identified from teleseismic receiver func-tions had been used to determine crustal thickness (H) andVP/VS ratio (k), therefore Poisson’s ratio (s) [Zandt andAmmon, 1995; Zhu and Kanamori, 2000; Chevrot and vander Hilst, 2000]. However even for a single layered averagecrustal model in the H-k method [Zhu and Kanamori,2000], the contours on the depth-VP/VS ratio plane generallyshow as a thin ridge which reflect the depth-VP/VS ratiotrade-off in inversion of receiver functions. The depth-velocity trade-off demonstrated by Ammon et al. [1990]occurs when the average crustal P velocity is changed in theH-k method. In order to reduce the nonuniqueness, surfacewave dispersion measurements have been complemented toteleseismic receiver functions for determining both discon-tinuities and velocity profile [Julia et al., 2000]. As surfacewave dispersion primarily depends on shear wave speed,the P velocity in surface wave tomography [Huang et al.,2003] is often calculated from the S velocity usingempirical formula, and the discontinuities are located ini-
tially according to previous studies. Instead of resolvingdetailed crustal structure, we propose a new grid searchingmethod in the study to estimate the average crustal P velocityand relocate the Moho discontinuity in the backgroundvelocity structure obtained from inversion of Rayleigh wavedispersion by taking advantage of receiver function anddispersion observations simultaneously.
2. Data and Method
[3] 3-component teleseismic waveforms of about 230 earth-quakes recorded on 45 permanent broadband stationsthroughout China (Figure 1) are used for generating receiverfunctions in the study. The events occurred between 2000and 2005 with magnitude greater than 5.5 and epicentraldistance from 30� to 95�. The recordings which have clearP arrival in the vertical component and low pre-signalnoise in all three components are kept. After the P onset ispicked by hand, the raw seismograms are cut with a timewindow of 20 s before the P to 110 s after. The twohorizontal components are rotated to the radial and tangen-tial directions. A receiver function is then constructed bydeconvolving the vertical component from the radial com-ponent using the iterative approach [Ligorrıa and Ammon,1999]. The Gaussian parameter is chosen to be 2.0.[4] The dispersion data set in the study is the group
velocities of fundamental Rayleigh waves which are takenfrom a surface wave tomography of China by Huang et al.[2003].[5] To incorporate the dispersions, the H-k stacking
method is extended to include multi-layered crust. Thetraveltime difference of between P and Ps phases is calcu-lated as
tPs ¼Xnci¼1
hi
ffiffiffiffiffiffiffiffiffiffiffiffiffiffiffiffi1
V 2Si
� p2
s�
ffiffiffiffiffiffiffiffiffiffiffiffiffiffiffiffiffi1
V 2Pi
� p2
s !; ð1Þ
where nc is the number of layers in the crust, VPi and VSi areP-wave and S-wave velocity in the ith layer with a thicknesshi, and p is the ray parameter of the incident P wave.Similarly the traveltime differences between P and multiplesPpPs, PsPs + PpSs phases are:
tPpPs ¼Xnci¼1
hi
ffiffiffiffiffiffiffiffiffiffiffiffiffiffiffiffi1
V 2Si
� p2
sþ
ffiffiffiffiffiffiffiffiffiffiffiffiffiffiffiffiffi1
V 2Pi
� p2
s !; ð2Þ
and
tPsPsþPpSs ¼Xnci¼1
2hi
ffiffiffiffiffiffiffiffiffiffiffiffiffiffiffiffi1
V 2Si
� p2
s: ð3Þ
GEOPHYSICAL RESEARCH LETTERS, VOL. 34, L12304, doi:10.1029/2007GL029848, 2007
1Laboratory of Computational Geodynamics, College of EarthSciences, Graduate University of Chinese Academy of Sciences, Beijing,China.
Copyright 2007 by the American Geophysical Union.0094-8276/07/2007GL029848
L12304 1 of 6
For teleseismic receiver functions which are generated bysteeply incident waves, the above extension makes littleimprovement compared with the one-layered averagemodel. However the effects of multi-layered model arequite significant on dispersion computation.[6] As both receiver functions and Rayleigh dispersions
are relatively insensitive to P wave speed, a P-wave velocityreference model with crustal thickness H0 and averagecrustal P velocity VP(H0), which is taken from the surfacewave tomography [Huang et al., 2003], is used in the gridsearch approach. The layer number of a reference modelis determined when the dispersion data is inverted. TheP reference models with different VP(H0) values can beconstructed by scaling the previous one. The VP/VS ratio isassumed to be constant in the crust for the first stepinvestigation. The Moho depth and S-wave velocity profileare adjusted from the given P-wave velocity referencemodel according to different values of H and k during thesearching process. For a multi-layered model, the VP(H),which is a simple weighted average by each layer thickness,isn’t fixed any more.[7] Two kinds of processing are performed during the
grid search. The first is stacking receiver functions, which issimilar to the original H-k method [Zhu and Kanamori,2000] except that equation (1), (2), and (3) are used in thefollowing now,
sR H ;kð Þ ¼XNi¼1
w1ri tPsð Þ þ w2ri tPpPs� �
� w3ri tPsPsþPpSs
� �� ; ð4Þ
where ri(t) is the ith of total N radial receiver functions, wi
are weighting factors, with w1 = 0.7, w2 = 0.2, and w3 = 0.1in the study. The other is calculating the least-squares misfitm(H, k) between the observed and synthetic dispersions foreach grid in the H-k plane. For the stations in the east ofChina, the range of period for dispersions is between 10 s
and 60 s. The upper limit becomes 80 s to 100 s for thewest. We define a fitness function
sD H ;kð Þ ¼ mmax � m H ;kð Þmmax � mmin
; ð5Þ
where mmax and mmin are the maximal and minimal valuesof the m(H, k) in the H-k plane. The combined objectionfunction for the grid search is the product of the two,
s H ;kð Þ ¼ sR H ;kð ÞsD H ;kð Þ: ð6Þ
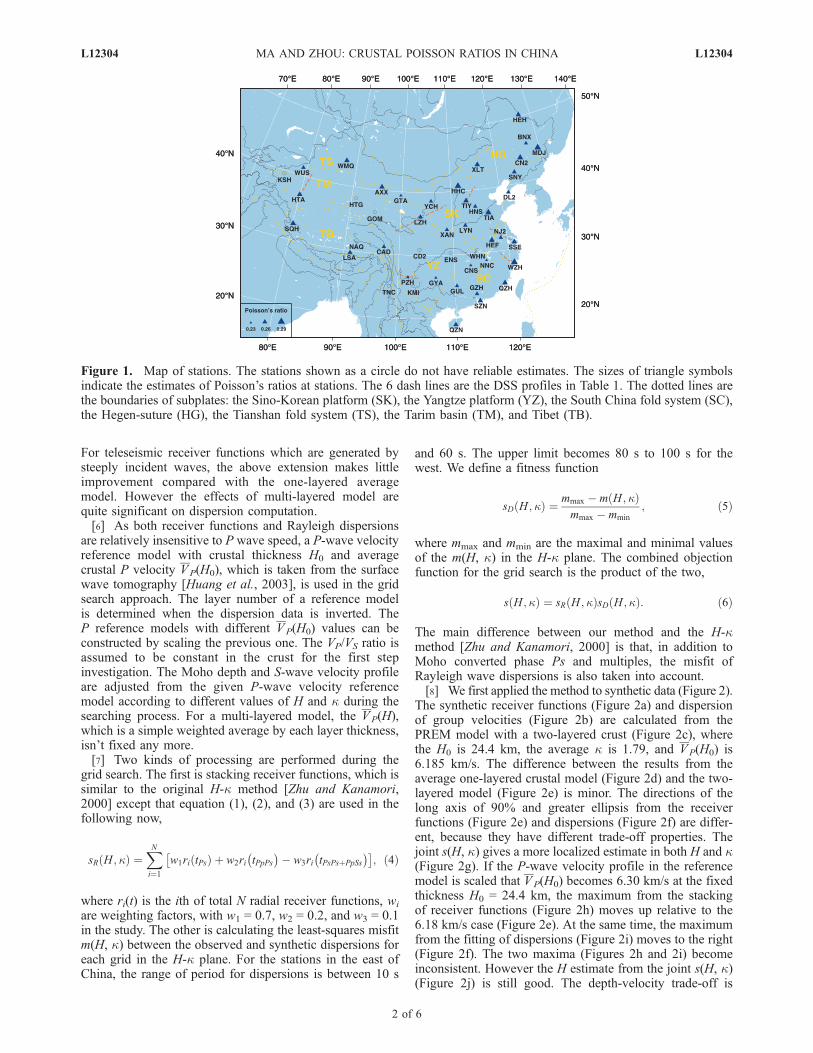
The main difference between our method and the H-kmethod [Zhu and Kanamori, 2000] is that, in addition toMoho converted phase Ps and multiples, the misfit ofRayleigh wave dispersions is also taken into account.[8] We first applied the method to synthetic data (Figure 2).
The synthetic receiver functions (Figure 2a) and dispersionof group velocities (Figure 2b) are calculated from thePREM model with a two-layered crust (Figure 2c), wherethe H0 is 24.4 km, the average k is 1.79, and VP(H0) is6.185 km/s. The difference between the results from theaverage one-layered crustal model (Figure 2d) and the two-layered model (Figure 2e) is minor. The directions of thelong axis of 90% and greater ellipsis from the receiverfunctions (Figure 2e) and dispersions (Figure 2f) are differ-ent, because they have different trade-off properties. Thejoint s(H, k) gives a more localized estimate in both H and k(Figure 2g). If the P-wave velocity profile in the referencemodel is scaled that VP(H0) becomes 6.30 km/s at the fixedthickness H0 = 24.4 km, the maximum from the stackingof receiver functions (Figure 2h) moves up relative to the6.18 km/s case (Figure 2e). At the same time, the maximumfrom the fitting of dispersions (Figure 2i) moves to the right(Figure 2f). The two maxima (Figures 2h and 2i) becomeinconsistent. However the H estimate from the joint s(H, k)(Figure 2j) is still good. The depth-velocity trade-off is
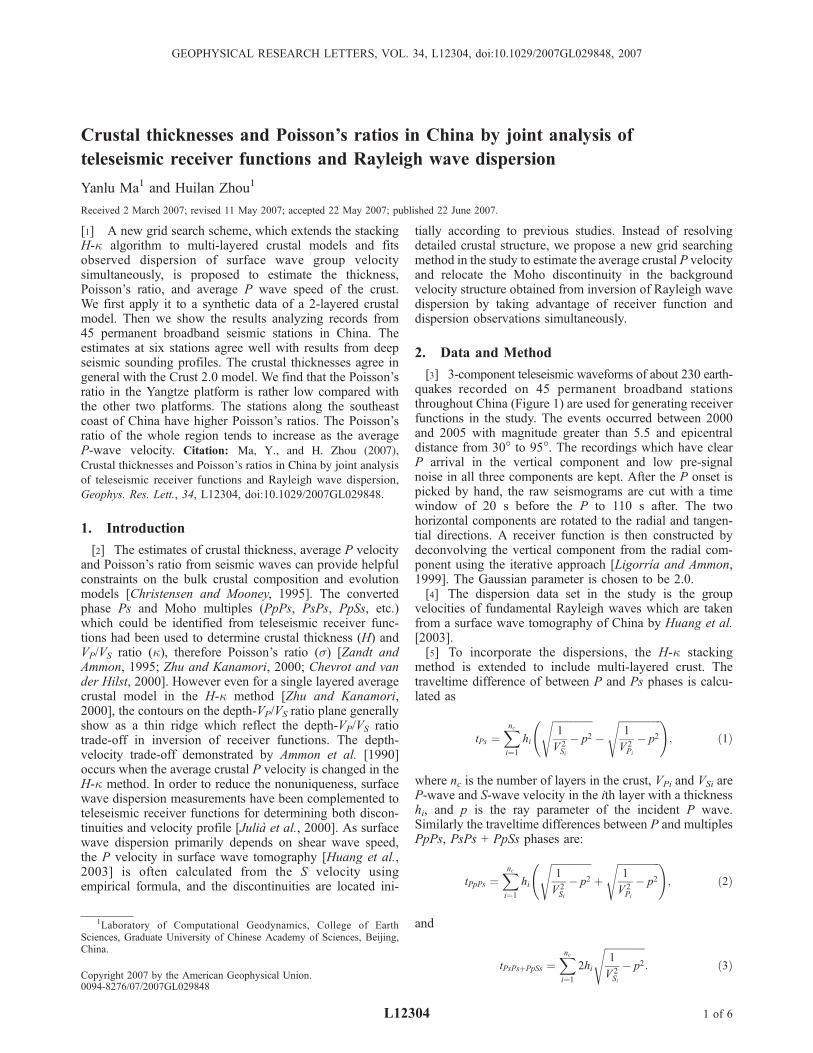
Figure 1. Map of stations. The stations shown as a circle do not have reliable estimates. The sizes of triangle symbolsindicate the estimates of Poisson’s ratios at stations. The 6 dash lines are the DSS profiles in Table 1. The dotted lines arethe boundaries of subplates: the Sino-Korean platform (SK), the Yangtze platform (YZ), the South China fold system (SC),the Hegen-suture (HG), the Tianshan fold system (TS), the Tarim basin (TM), and Tibet (TB).
L12304 MA AND ZHOU: CRUSTAL POISSON RATIOS IN CHINA L12304
2 of 6
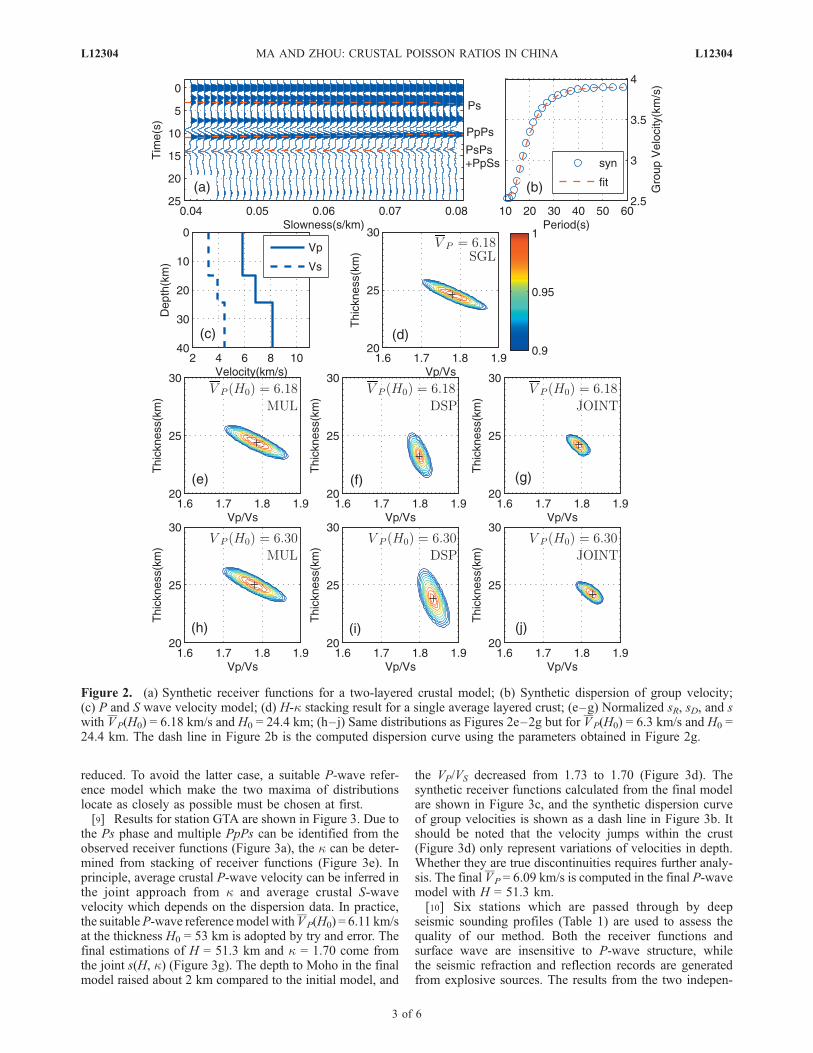
reduced. To avoid the latter case, a suitable P-wave refer-ence model which make the two maxima of distributionslocate as closely as possible must be chosen at first.[9] Results for station GTA are shown in Figure 3. Due to
the Ps phase and multiple PpPs can be identified from theobserved receiver functions (Figure 3a), the k can be deter-mined from stacking of receiver functions (Figure 3e). Inprinciple, average crustal P-wave velocity can be inferred inthe joint approach from k and average crustal S-wavevelocity which depends on the dispersion data. In practice,the suitableP-wave referencemodel withVP(H0) = 6.11 km/sat the thickness H0 = 53 km is adopted by try and error. Thefinal estimations of H = 51.3 km and k = 1.70 come fromthe joint s(H, k) (Figure 3g). The depth to Moho in the finalmodel raised about 2 km compared to the initial model, and
the VP/VS decreased from 1.73 to 1.70 (Figure 3d). Thesynthetic receiver functions calculated from the final modelare shown in Figure 3c, and the synthetic dispersion curveof group velocities is shown as a dash line in Figure 3b. Itshould be noted that the velocity jumps within the crust(Figure 3d) only represent variations of velocities in depth.Whether they are true discontinuities requires further analy-sis. The final VP = 6.09 km/s is computed in the final P-wavemodel with H = 51.3 km.[10] Six stations which are passed through by deep
seismic sounding profiles (Table 1) are used to assess thequality of our method. Both the receiver functions andsurface wave are insensitive to P-wave structure, whilethe seismic refraction and reflection records are generatedfrom explosive sources. The results from the two indepen-
Figure 2. (a) Synthetic receiver functions for a two-layered crustal model; (b) Synthetic dispersion of group velocity;(c) P and S wave velocity model; (d) H-k stacking result for a single average layered crust; (e–g) Normalized sR, sD, and swith VP(H0) = 6.18 km/s and H0 = 24.4 km; (h–j) Same distributions as Figures 2e–2g but for VP(H0) = 6.3 km/s and H0 =24.4 km. The dash line in Figure 2b is the computed dispersion curve using the parameters obtained in Figure 2g.
L12304 MA AND ZHOU: CRUSTAL POISSON RATIOS IN CHINA L12304
3 of 6
dent approaches agree well with each other. The differencesof thicknesses between them are within about 3 km.
3. Results and Discussion
[11] We obtained 36 reliable estimates (Table 2) out oftotal 45 stations. The multiples on receiver functions of theother 9 stations are so complicated that they can not bedetected undoubtedly and more than one extreme exist insR(H, k). As the VP/VS ratio is indeterminate in these cases,the combination of surface wave can not give a reliable VP.The uncertainties in the H and k are estimated from the 90%iso-contour line of the joint s(H, k). The errors in s are nomore than 2% as the changes in k are less than 5%. Theuncertainty of average VP is inferred by the departure of thetwo distributions sR(H, k) and sD(H, k), and estimated towithin 0.1 km/s. Our results on crustal thicknesses agree ingeneral with Crust 2.0 model (Available at mahi.ucsd.edu/Gabi/crust2.html) [Bassin et al., 2000] except 5 stations
(CN2, BNX, HEH, XAN, and LSA) where the differencesare larger than 5 km.[12] The mean of total Poisson’s ratios is about 0.26, a
little smaller than the global average 0.27 [Zandt andAmmon, 1995]. This might be attributed to the generalabsence of mafic lowermost crustal layer [Gao et al.,1998; Li et al., 2006]. The distribution of s is shown inFigure 1 by different sizes of triangles. For three major
Figure 3. (a) Observed receiver functions of station GTA; (b) Observed dispersions; (c) Synthetic receiver functions usingthe final model in Figure 3d; (d) Initial and final models; (e–g) Normalized sR, sD, and s with VP(H0) = 6.11 km/s and H0 =53 km. The dash line mark in Figure 3a is the computed arrival times for Ps and multiples using parameters in Figure 3g.The dash line in Figure 3b represents the synthetic dispersion using the final model in Figure 3d.
Table 1. Comparison of Depths to the Moho, Average P Velocities
From This Study and From Deep Seismic Sounding(DSS) Profiles
StationDepth,km
VP,km/s
DSS Depth,km
DSS VP,km/s Reference
HTA 51.6 6.1 55.0 6.1 Li et al. [2000]LZH 51.3 6.2 52.0 6.3 Li et al. [2002]PZH 52.2 6.0 52.5 6.2 Xiong et al. [1993]SSE 30.2 6.1 32.0 6.3 Bai and Wang [2006]TIY 44.0 6.4 41.0 6.4 Zhao et al. [2006]WZH 31.2 6.4 31.0 6.3 Xiong and Liu [2000]
L12304 MA AND ZHOU: CRUSTAL POISSON RATIOS IN CHINA L12304
4 of 6
Precambrian platforms in China [Zhang et al., 1984], thePoisson’s ratios of the Sino-Korean platform and the Tarimbasin average about 0.26 ± 0.01, while the Yangtze platformhas a rather low s, averaging 0.24 ± 0.02. The low H, VP,and s at the southeast boundary of the Yangtze (NNC, CNS
and GYA) agree with the crustal velocity-depth column forthe Mid China in Li et al. [2006], where besides the upperand middle crust being felsic, the lowermost crustal layer isintermediate. This kind of composition could result from adelamination process following the Proterozoic collision
Table 2. Locations of Broadband Stations, Number of Receiver Functions Used, and Results for Depth to
Moho, Velocity Ratio VP/VS, Poisson’s Ratio, and Average Crustal P Velocity
StationLatitude,
degLongitude,
deg N H, km k sVP,km/s
AXX 40.52 95.80 146 50.8 ± 2.2 1.77 ± 0.03 0.266 6.43BNX 45.74 127.40 123 30.4 ± 1.6 1.73 ± 0.04 0.249 6.09CAD 31.14 97.17 117 66.8 ± 2.7 1.74 ± 0.03 0.253 5.85CN2 43.80 125.45 119 28.6 ± 1.5 1.80 ± 0.05 0.277 6.27CNS 28.18 112.93 91 30.1 ± 1.8 1.70 ± 0.04 0.235 6.10DL2 38.91 121.63 90 34.0 ± 1.5 1.74 ± 0.02 0.253 6.14GTA 39.41 99.81 157 51.3 ± 2.2 1.70 ± 0.03 0.235 6.09GUL 25.08 110.29 103 29.8 ± 1.5 1.73 ± 0.03 0.249 6.05GYA 26.46 106.66 121 38.0 ± 1.8 1.70 ± 0.03 0.235 6.05GZH 23.65 113.65 89 29.6 ± 1.5 1.74 ± 0.03 0.253 6.19HEF 31.84 117.17 91 33.4 ± 1.8 1.79 ± 0.03 0.273 6.29HEH 50.25 127.41 146 31.0 ± 1.5 1.78 ± 0.03 0.269 6.15HHC 40.85 111.56 131 43.6 ± 2.0 1.81 ± 0.03 0.280 6.40HNS 37.40 114.71 134 30.7 ± 2.0 1.74 ± 0.04 0.253 6.05HTA 37.06 79.92 118 51.6 ± 2.0 1.77 ± 0.03 0.266 6.05LSA 29.70 91.15 121 78.2 ± 2.3 1.75 ± 0.02 0.258 6.17LYN 34.55 112.47 119 32.2 ± 1.2 1.74 ± 0.03 0.253 6.04LZH 36.09 103.84 135 51.3 ± 2.0 1.75 ± 0.03 0.258 6.18MDJ 44.62 129.59 100 35.8 ± 1.3 1.82 ± 0.03 0.284 6.52NJ2 32.05 118.85 105 30.1 ± 1.7 1.74 ± 0.04 0.253 6.09NNC 28.77 115.81 116 28.8 ± 1.1 1.69 ± 0.02 0.231 5.99PZH 26.50 101.74 156 52.2 ± 1.8 1.71 ± 0.03 0.240 5.96QZH 24.94 118.60 95 27.8 ± 1.0 1.78 ± 0.03 0.269 6.16QZN 19.03 109.84 95 30.1 ± 1.8 1.76 ± 0.03 0.262 6.10SNY 41.83 123.58 97 30.7 ± 1.6 1.75 ± 0.03 0.258 6.18SQH 32.50 80.08 92 72.4 ± 3.3 1.79 ± 0.03 0.273 6.35SSE 31.09 121.19 97 30.2 ± 1.5 1.77 ± 0.03 0.266 6.06SZN 22.53 114.13 63 28.4 ± 1.3 1.76 ± 0.03 0.262 6.17TIA 36.21 117.12 128 30.4 ± 1.8 1.81 ± 0.04 0.280 6.19TIY 38.43 113.00 138 44.0 ± 1.8 1.78 ± 0.03 0.269 6.37WMQ 43.82 87.69 136 52.8 ± 1.7 1.77 ± 0.02 0.266 6.35WUS 41.20 79.22 119 52.2 ± 1.6 1.74 ± 0.03 0.253 6.05WZH 27.93 120.67 82 30.8 ± 1.7 1.83 ± 0.03 0.287 6.40XAN 34.03 108.92 120 35.7 ± 2.2 1.73 ± 0.03 0.249 6.11XLT 43.90 116.08 135 36.6 ± 1.5 1.77 ± 0.03 0.266 6.20YCH 38.60 105.93 124 45.4 ± 2.0 1.73 ± 0.03 0.249 6.05
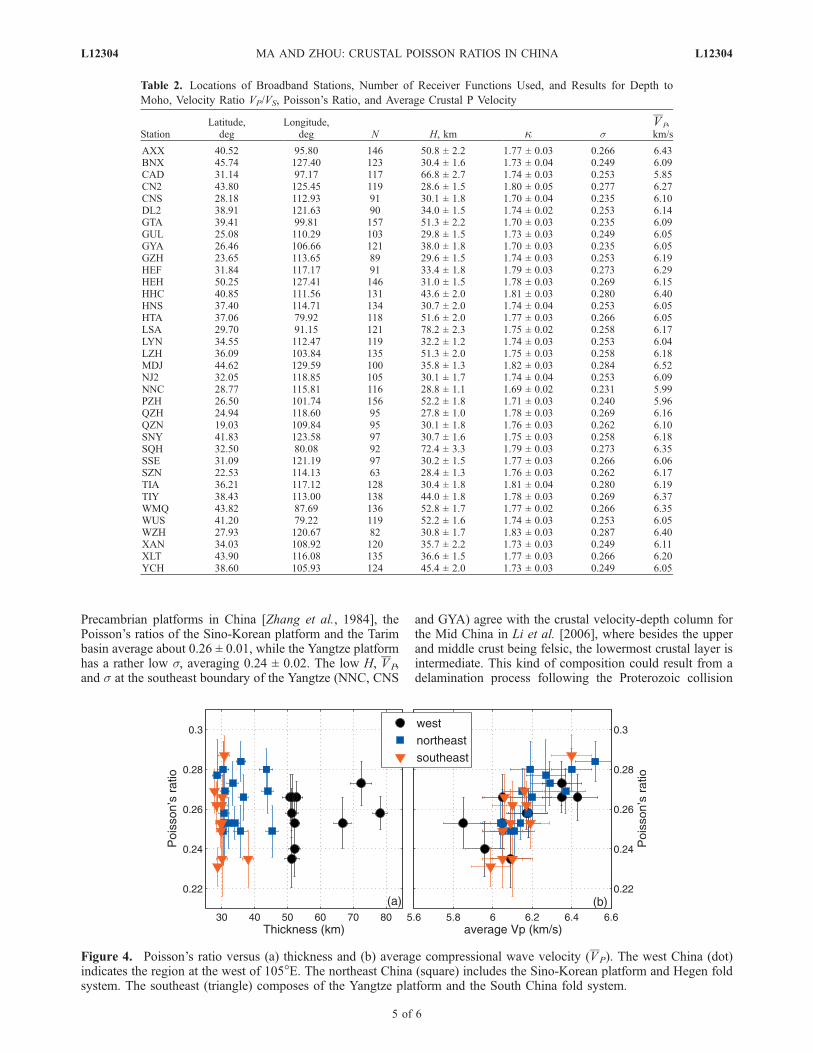
Figure 4. Poisson’s ratio versus (a) thickness and (b) average compressional wave velocity (VP). The west China (dot)indicates the region at the west of 105�E. The northeast China (square) includes the Sino-Korean platform and Hegen foldsystem. The southeast (triangle) composes of the Yangtze platform and the South China fold system.
L12304 MA AND ZHOU: CRUSTAL POISSON RATIOS IN CHINA L12304
5 of 6
between the Yangtze and the South China fold system [Xu etal., 2006]. The continental margin crust (WZH, QZH, SZNand QZN) in the South China fold system generally havelarger s than its interior. The large area of igneous rocksexisting in this region shows an oceanward younging of Ndmodel age TDM and an increase of initial eNd(T), whichindicate that the contribution of mantle-derived basalticmagmas becomes more significant toward the southeastcoast [Chen and Jahn, 1998].[13] The results for the crust in the western China,
separated by 105�E, and northeast region are shown inFigure 4. The s in the whole region increases with increas-ing average P-wave velocity (Figure 4b). The furtherinferences about the composition and evolution of the crustin China based on these results will be discussed morethoroughly in the future work.
[14] Acknowledgments. Supported by NSFC grant 40374009 and40574024. Data were provided by CENC. Thank to Z. Huang for providingthe dispersion data and velocity models from his research, L. Zhu forrevisions and comments, X. Song for the tectonic boundaries data,anonymous reviewer for critical reviews, and X. Li, J. Huang, and X. Shenfor helpful discussions. Figure 1 was produced by GMT [Wessel and Smith,1991].
ReferencesAmmon, C. J., G. E. Randall, and G. Zandt (1990), On the nonuniquenessof receiver function inversions, J. Geophys. Res., 95(B10), 15,303–15,318.
Bai, Z., and C. Wang (2006), Crustal P-wave velocity structure in lowerYangtze region: Reinterpretation of Fuliji-Fengxian deep seismic sound-ing profile, Chin. Sci. Bull., 51(19), 2391–2400.
Bassin, C., G. Laske, and G. Masters (2000), The current limits of resolu-tion for surface wave tomography in North America, Eos Trans. AGU,81(48), Fall Meet. Suppl., Abstract F897.
Chen, J., and B. Jahn (1998), Crustal evolution of southeastern China: Ndand Sr isotopic evidence, Tectonophysics, 284, 101–133.
Chevrot, S., and R. D. van der Hilst (2000), The Poisson ratio of theAustralian crust: Geological and geophysical implications, Earth Planet.Sci. Lett., 183, 121–132.
Christensen, N. I., and W. D. Mooney (1995), Seismic velocity structureand composition of the continental crust: A global view, J. Geophys. Res.,100(B7), 9761–9788.
Gao, S., B. Zhang, Z. Jia, H. Kern, T. Luo, and Z. Zhao (1998), How maficis the lower continental crust?, Earth Planet. Sci. Lett., 161, 101–117.
Huang, Z., W. Su, Y. Peng, Y. Zheng, and H. Li (2003), Rayleigh wavetomography of China and adjacent regions, J. Geophys. Res., 108(B2),2073, doi:10.1029/2001JB001696.
Julia, J., C. J. Ammon, R. B. Herrmann, and A. M. Correig (2000), Jointinversion of receiver function and surface wave dispersion observations,Geophys. J. Int., 143, 99–112.
Li, Q., et al. (2000), A explosive seismic sounding profile across the transi-tion zone between west Kunlun mountain and Tarim basin, Sci. China,Ser. D, 30, 16–21.
Li, S., X. Zhang, C. Zhang, J. Zhao, and S. Cheng (2002), A preliminarystudy on the crustal velocity structure of Maqin-Lanzhou-Jingbian bymeans of deep seismic sounding profile, Chin. J. Geophys., 45(2),210–217.
Li, S., W. D. Mooney, and J. Fan (2006), Crustal structure of mainlandChina from deep seismic sounding data, Tectonophysics, 420, 239–252.
Ligorrıa, J. P., and C. J. Ammon (1999), Iterative deconvolution andreceiver-function estimation, Bull. Seismol. Soc. Am., 89(5), 1395–1400.
Wessel, P., and W. H. F. Smith (1991), Free software helps map and displaydata, Eos Trans. AGU, 72(441), 445–446.
Xiong, S., and H. Liu (2000), Crust-mantle structure of Zhejiang-Anhuiregion and the boundary between Yangzi block and Huanan block, Prog.Geophys., 15(4), 3–17.
Xiong, S., Y. Zheng, Z. Yin, X. Zeng, Y. Quan, and K. Sun (1993), The 2-Dstructure and it’s tectonic implications of the crust in the Lijiang-Panzhihua-Zhehai region, Chin. J. Geophys., 36(4), 434–444.
Xu, D., X. Gu, P. Li, G. Chen, B. Xia, R. Bachlinski, Z. He, and G. Fu(2006), Mesoproterozoic-Neoproterozoic transition: Geochemistry, pro-venance and tectonic settings of clastic sedimentary rocks on the SEmargin of the Yangtze Block, South China, J. Asian Earth Sci,doi:10.1016/j.jseaes.2006.04.006.
Zandt, G., and C. J. Ammon (1995), Continental crust composition con-strained by measurements of crustal poisson’s ratio, Nature, 374, 152–154.
Zhang, Z. M., J. G. Liou, and R. G. Coleman (1984), An outline of the platetectonics of China, Geol. Soc. Am. Bull., 95, 295–312.
Zhao, J., X. Zhang, C. Zhang, J. Zhang, B. Liu, and S. Pan (2006), Featuresof deep crustal structure beneath the Wutai mountain area of Shanxiprovince, Chin. J. Geophys., 49(1), 123–129.
Zhu, L., and H. Kanamori (2000), Moho depth variation in southern Cali-fornia from teleseismic receiver functions, J. Geophys. Res., 105(B2),2969–2980.
�����������������������Y. Ma and H. Zhou, Laboratory of Computational Geodynamics, College
of Earth Sciences, Graduate University of Chinese Academy of Sciences,Beijing 100049, China. ([email protected]; [email protected])
L12304 MA AND ZHOU: CRUSTAL POISSON RATIOS IN CHINA L12304
6 of 6