
Prandtl and Rayleigh number dependence of heat transport in high Rayleigh number thermal convection
Upload
independentCategory
view
1download
0
TOWARD A RAYLEIGH WAVE ATTENUATION MODEL FOR CENTRAL ASIA
AND SURROUNDING REGIONS
Anatoli L. Levshin1, Mikhail P. Barmin1, Xiaoning (David) Yang2, Michael H. Ritzwoller1, and George E. Randall2
University of Colorado at Boulder1, Los Alamos National Laboratory2
Sponsored by National Nuclear Security Administration Office of Nonproliferation Research and Development
Office of Defense Nuclear Nonproliferation
Contracts No. DE-FC52-05NA266081 and DE-AC52-06NA253962
ABSTRACT We report on progress toward an attenuation model for short-period (10-20 s) Rayleigh waves in Central Asia and surrounding regions. This model will be defined by maps of attenuation across the region of study in the specified period band. The model is designed to calibrate the regional surface-wave magnitude scale and to extend the teleseismic ‘surface-wave magnitude – body-wave magnitude’ (Ms-mb) discriminant to regional distances (Marshall and Basham, 1970; Bonner et al., 2006; Russell, 2006). Work is progressing in three stages: (1) data accumulation and amplitude measurements, (2) estimation of attenuation coefficients, and (3) tomographic inversion of attenuation data. The first stage in model construction was the measurement of Rayleigh wave spectral amplitudes. To overcome inherent difficulties due to multipathing and scattering of short-period surface waves we applied the Surface Wave Amplitude Measurement Tool (SWAMTOOL) designed at the Los Alamos National Laboratory (LANL) (Yang et al., 2005), which incorporates dispersion analysis, phase-matched filtering, and additional means to estimate the quality and reliability of the measurements. We enhanced SWAMTOOL by providing different options for phase-matched filtering of surface wave signals (Levshin et al., 2006). We collected and processed waveform data for 200 earthquakes occurring throughout 2003-2006 inside and around Eurasia. The records of about 140 broadband permanent and temporary stations were used. The existing broadband station distribution and the pattern of seismicity provided sufficient number of spectral amplitude measurements between 12 and 20 s periods for the construction of the two–dimensional (2-D) tomographic maps of attenuation coefficients. Measurements at periods below about 12 s are too scarce for tomographic inversion. At the second stage of the work, spectral attenuation coefficients were estimated using both inter-station measurements and single-station measurements corrected for source and receiver terms. The model-related part of corrections was based on a three-dimensional (3-D) global model of the crust and upper mantle of Shapiro and Ritzwoller (CUB2.0: 2002). Information about source mechanisms of selected events was taken from the Harvard centroid moment tensor catalog (Dziewonski et al., CMT: 1981) and the hypocenter information from Engdahl et al., (EHB: 1998). The third stage is now in progress. It includes the refining of source parameters (especially, the depth and the scalar moments), recalculation of attenuation coefficients after this refinement, grooming of resulting coefficients, and the multi-stage tomograhic inversion of data. Preliminary tomographic maps of attenuation for the set of periods from 12 to 20 s have been obtained.

OBJECTIVES
The objectives of the study are 1) to develop short-period (10 – 18s), two-dimensional (2-D) Rayleigh-wave attenuation models for Central Asia along with associated uncertainty statistics through a tomographic approach, and 2) to calibrate Russell’s (2006) Ms formula with these models for the same region. At this report we describe results of developing of the attenuation model.
RESEARCH ACCOMPLISHED
Introduction
Knowledge of the losses of seismic energy during the propagation of the wave from the source to receivers is essential for the estimation of the surface wave magnitude Ms and the seismic moment of the source. This is especially important for monitoring of underground nuclear explosions, in which the estimation of Ms is used as a part of the most robust seismic discriminant, the Ms-mb discriminant. In order to apply this discriminant to regional-distance monitoring, a modified Ms formula using shorter-period (< 20 s) surface wave amplitudes is required (e.g., Marshall and Basham, 1970; Bonner et al., 2006; Russell, 2006). The purpose of this work is to construct short-period (10-20 s) two-dimensional (2-D) Rayleigh-wave attenuation models for Central Asia and to use them to calibrate Ms formula of Russell (2006). The first stage in model construction was the measurement of Rayleigh wave spectral amplitudes. To overcome inherent difficulties due to multipathing and scattering of short-period surface waves we applied the Surface Wave Amplitude Measurement Tool (SWAMTOOL) designed at the Los Alamos National Laboratory (LANL) (Yang et al., 2005. We enhanced SWAMTOOL by providing different options for phase-matched filtering of surface wave signals (Levshin et al., 2006). Waveform data for 200 earthquakes occurring throughout 2003-2006 inside and around Eurasia from about 140 broadband permanent and temporary stations have been collected and processed. This data set provided a sufficient number of spectral amplitude measurements between 12 and 18 s periods for the construction of the two–dimensional (2-D) tomographic maps of attenuation coefficients. At the second stage of the work, spectral attenuation coefficients were estimated using both inter-station measurements and single-station measurements corrected for the source and receiver terms. The model-related part of corrections was based on a three-dimensional (3-D) global model of the crust and upper mantle of Shapiro and Ritzwoller (CUB2.0:2002). Information about source mechanisms of selected events was taken from the Harvard centroid moment tensor catalog (Dziewonski et al., CMT: 1981) and the hypocenter information by Engdahl et al., (EHB: 1998). The third stage is now in progress. It includes the refining of source parameters (especially, the depth and the scalar moments), recalculation of attenuation coefficients after this refinement, grooming of resulting coefficients, and the multi-stage tomograhic inversion of data. Preliminary tomographic maps of attenuation for the set of periods from 12 to 20 s have been obtained.
Surface wave data collection and selection
We collected and processed surface-wave waveform data for 200 events that occurred in and around Eurasia through 2003-2006. Selected events are characterized by magnitudes Ms between 5 and 6 and source depths less than 70 km. Several global and regional broadband networks have existed in Eurasia during the considered time interval. These include Global Seismographic Network (GSN), International Monitoring System (IMS), GEOSCOPE, GEOFON, Mediterranean Seismic Network (MEDNET), China Digital Seismological Network (CDSN), Kyrgyz Seismic Network (KNET), Kazakhstan Seismic Network (KAZNET), and others. There have also been many temporary network deployments in the region including close to 10 projects of the Program for the Array Seismic Studies of the Continental Lithosphere (PASSCAL). Maps with the station and event distribution are shown in Figure 1. The original records were requested and provided by the Data Management Center (DMC) of Incorporated Research Institutions for Seismology (IRIS). After standard preprocessing all records were corrected for the instrument responses and converted to displacements using the Seismic Analysis Code (SAC). Then we apply SWAMTOOL, and as an output we obtain the raw spectral amplitudes of Rayleigh waves in the period range defined by the magnitude of an earthquake, the epicentral distance and the level of a background noise. Altogether more than 9000 records were selected for measurements. The path coverage for the set of periods is shown in Figure 2 and 3, both for source-station paths and paths between pairs of stations. The conditions for selecting such pairs of stations

are:(a) the difference in azimuths from epicenter to the stations is less than 1°; (b) the distance between stations is more than 300 km and less than 5000 km.
Figure 1. Stations and events selected for surface-wave data analysis.
Figure 2. The single-station paths used for spectral amplitude measurements at indicated periods.
Figure 4 presents the numbers of obtained single-station and inter-station measurements as a function of period. For the measurements of attenuation we selected data with quality factors, which are assigned by the analyst, of 'fair' or better, and observed backazimuth differs from great-circle backazimuth by less than 30°. This selection significantly decreased the data scatter.

Figure 3. The inter-station paths used for spectral amplitude measurements at indicated periods
Fgure 4. Number of paths for which the spectral amplitudes have been measured.

Observed and predicted spectral amplitudes, and attenuation coefficients
To determine attenuation coefficients from observed spectral amplitudes we use theoretical predictions based on 3-D-model CUB2.0 of the crust and upper mantle (Shapiro & Ritzwoller, 2002) presented on 2°×2°grid. Following the asymptotic theory of surface wave propagation in a 3-D medium (Woodhouse, 1974; Levshin et al., 1989) we calculated the predicted spectral amplitude Ath for a given 'event-station' pair as
)()sin(
))(exp(),,(
0
0 !!"
#! BR
RhSA
th
$
$%= (1)
Here ω is a circular frequency, h is the source depth, φ is an azimuth from epicenter to the station, and S(ω,h,φ,) is the source-dependent term.
|),,(|),,( 0 !"!" hMhS Em #= (2)
Here M0 is a scalar moment, m is a moment tensor, and E(ω,h,φ) is a strain tensor for the Rayleigh wave at given frequency and depth for the one-dimensional (1-D) structure at the grid point nearest to the epicenter. R0 is the Earth radius, ∆ is an epicentral distance in radians, ! is an attenuation coefficient at given ω for an average continental model. B(ω) is the station term:
( ) 21
0)(!
= UIB " (3)
Here I0 is a normalized kinetic energy of Rayleigh wave, and U is a corresponding group velocity at given frequency ω for the 1-D local model at the grid point nearest to the station. The values of station correction B normalized by the corresponding values for the average continental model vary in the range 0.45-1.6 for periods below 13 s and 0.75-1.35 for longer periods depending on the local structure near the station. Observed spectral amplitude Aobs should differ from predicted one by the exponential factor:
]))()((exp[ 0RAAthobs
!""= #$#$ (4)
where α(ω) is the wanted attenuation coefficient along the path 'epicenter-station'. The inter-station attenuation coefficient α12 is determined from two observed spectral amplitudes A2obs and A1obs according to relation:
2
1
1
212
)sin(
)sin(
B
BAAobsobs
!
!= ]))((exp[ 01212 R!"!" #$ (5)
To avoid effects caused by the poor 'near-node' radiation we exclude records for which the theoretical value of |m∗E(ω,h,φ)| for a given azimuth φ is less than 0.1 of its maximum value. Using formulas (1)-(5) to find the epicenter-station and inter-station attenuation coefficients for all selected paths we obtain a preliminary data set for the attenuation tomography. However, the behavior of corrected observed amplitudes as a function of distance (Figure 5a) shows that there are indications of a possible bias in source parameters which results in non-zero crossing by the least-square line at the zero distance.
Previous study (Levshin et al., 2006) demonstrated the significant dependence of measured epicenter-station attenuation coefficients on source mechanism and depth. Taking into account the accuracy of the CMT moment tensor solutions and possible uncertainties in the source depths both at the CMT and EHB catalogs we applied a Monte Carlo procedure to refine these solutions for each event by minimizing the differences between observed attenuation coefficients and ones predicted by the average continental model. The scatter of data has been critically diminished (Figure 6); there is the zero crossing of the regression line at zero distance as it should be in a real Earth. The differences in source parameters before and after optimization are shown in Figure 7. The general tendency to decrease the scalar moments by optimization agrees with results by Yang at al. (2004) for the 20 s period. To evaluate the scatter quantitatively we apply the cluster analysis similar to one which was used for evaluation of velocity scattering in group velocity tomography (Ritzwoller & Levshin, 1998). We consider some paths belonging

to a cluster if the end points of these paths belong to the same cell 50 km x 50 km size. The average attenuation coefficient for the region under study and corresponding error bars obtained by the cluster analysis are shown in Figure 8.
Figure 5. (a) Corrected single station amplitudes as a function of source-receiver distance. (b) Corrected two-station amplitude ratio as a function of inter-station distance. The dashed line is the least-square fit of the data.
Figure 6. Effect of source parameters' optimization on data shown in Figure 5a at 16s period.

Figure 7. Average attenuation coefficients for a region under study for designated periods obtained using single-station data. Error bars for single-station data are also shown.
Figure 8. Histograms of differences in source parameters before and after optimization. Differences in scalar moments (top right) are presented as the ratios of moments after and before optimization. Preliminary tomographic maps Selected data were used for 2-D tomographic inversion using technique described by Barmin et al. (2001). The path density of selected paths for periods 12, 16, and 18 s is shown in Figure 9a. We define path density as a number of
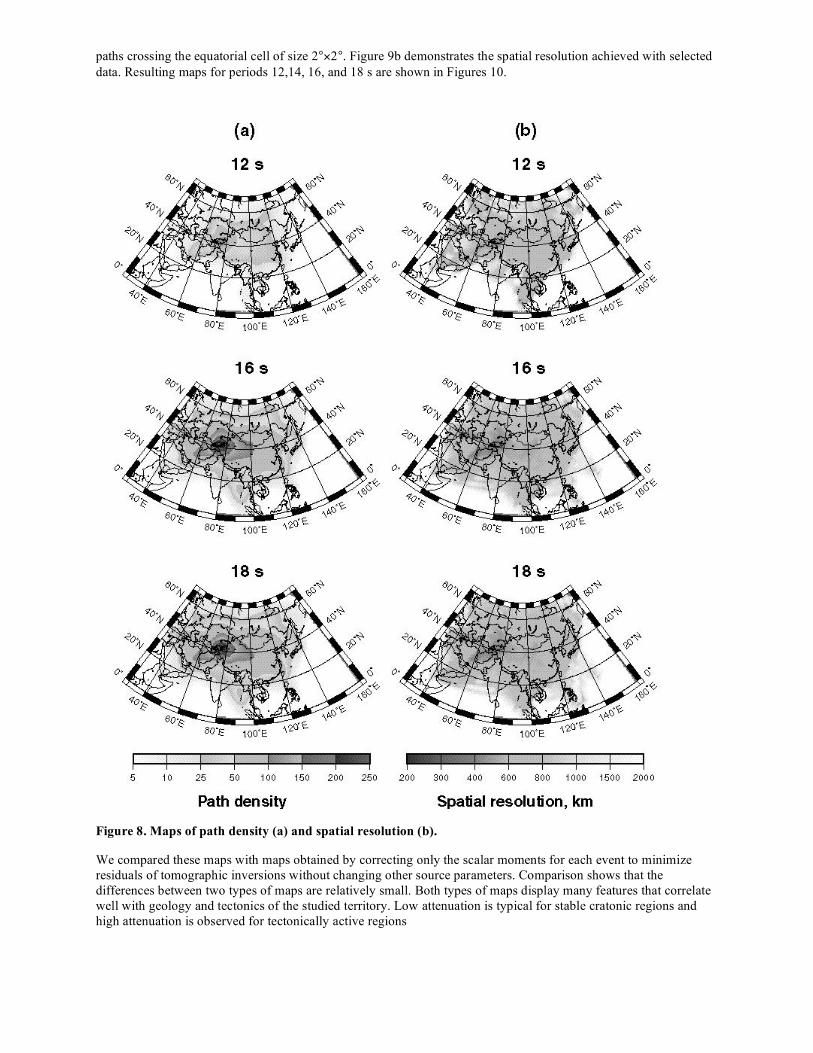
paths crossing the equatorial cell of size 2°×2°. Figure 9b demonstrates the spatial resolution achieved with selected data. Resulting maps for periods 12,14, 16, and 18 s are shown in Figures 10.
Figure 8. Maps of path density (a) and spatial resolution (b).
We compared these maps with maps obtained by correcting only the scalar moments for each event to minimize residuals of tomographic inversions without changing other source parameters. Comparison shows that the differences between two types of maps are relatively small. Both types of maps display many features that correlate well with geology and tectonics of the studied territory. Low attenuation is typical for stable cratonic regions and high attenuation is observed for tectonically active regions

Figure 9. Maps of attenuation coefficients across Eurasia.
CONCLUSIONS AND RECOMMENDATIONS
The modified SWAMTOOL technique permits reliable measurement of surface wave amplitude spectra and evaluation of the quality of measurements. We found that the existing networks and the pattern of seismicity will provide a significant amount of data on spectral amplitudes for periods in the range 12-20 s, appropriate for 2-D tomographic inversion for attenuation coefficients. Data for shorter periods are too scarce for tomographic inversion. The careful selection of data based on quality estimates by SWAMTOOL and refinement of the source parameters provides a reliable input for 2-D tomographic inversion for attenuation coefficients of Rayleigh waves at periods 12 – 20 s. The preliminary tomographic maps for this range of periods have been obtained which exhibit clear correlation with geology and tectonics of the territory under study. The evaluation of stability of inversion to different schemes of source parameters’ optimization are ongoing. We are also investigating a refined two-station amplitude-ratio measurement procedure to improve both the coverage and the measurement quality of amplitude ratios. Improved ratio measurements will be used in tomographic inversions to produce results that are to be compared with results from single-station amplitude tomographic inversions

ACKNOWLEDGEMENTS
The authors highly appreciate the opportunity to receive digital records from IRIS DMC, GEOSCOPE, and GEOFON. Most figures have been plotted using Generic Mapping Tool (Wessel & Smith 1995: GMT)
REFERENCES
Barmin, M. P., M. H. Ritzwoller, and A. L. Levshin (2001). A fast and reliable method for surface wave tomography, Pure Appl. Geophys., 158(8), pp. 1351 - 1375. Basham, P. W. (1971). A new magnitude formula for short period continental Rayleigh waves, Geophys. J. R. Ast . Soc., 23, pp. 255-260. Bonner, J. L., D. R. Russel, D. G. Harkrider, D. T. Reiter, and R. B. Herrmann (2006). Development of a time- domain, variable-period surface wave magnitude measurement procedure for application at regional and teleseismic distances, Bull. Seism. Soc. Am. 96, pp. 678-696. Dziewonski, A., Chou, T.-A. & Woodhouse, J. H. (1981). Determination of earthquake source parameters from waveform data for studies of global and regional seismicity, J. Geophys. Res., 86, pp. 2825-2852. Engdahl, E. R., R. van der Hilst, and R. Buland (1998). Global teleseismic earthquake relocation with improved travel times and procedures for depth determination. Bull. Seism. Soc. Am., 88, pp. 722 – 743. Levshin, A. L., T. B. Yanovskaya, A. V. Lander, B. G. Bukchin, M. P. Barmin, L. I. Ratnikova, and E. N. Its (1989). Seismic Surface Waves in Laterally Inhomogeneous Earth. (Ed. V.I. Keilis-Borok), Kluwer Publ. House. Levshin, A.L., X. Yang, M. H. Ritzwoller, M. P. Barmin, and A. R. Lowry (2006). Toward a Rayleigh wave attenuation model for Central Asia, in Proceedings of the 28th Seismic Research Review: Ground-Based Nuclear Explosion Monitoring Technologies,LA-UR-06-5741, 1-10. Marshall, P. D. and P. W. Basham (1972). Discrimination between earthquakes and underground explosions employing an improved Ms scale, Geophys. J. R. astr. Soc., 28, pp. 431-458. Russell, D. R. (2006). Development of a time-domain, variable-period surface wave magnitude measurement procedure for application at regional and teleseismic distances, Part I: Theory, Bull. Seism. Soc. Am., 96, pp. 665-677. Shapiro, N. M. and M. H. Ritzwoller (2002). Monte-Carlo inversion for a global shear-velocity model of the crust and upper mantle, Geophys. J. Int., 151, pp. 88-105. Wessel, P. A. and W. H. Smith (1995). New version of the generic mapping tools released, EOS, Trans. Amer. geophys. Un., 76, Suppl., 329. Woodhouse, J. H. (1974). Surface waves in a laterally varying layered structure, Geophys. J. Roy. Astr. Soc., 37, pp. 461-490. Yang, X., S. R. Taylor, and H. J. Patton (2004). The 20-s Rayleigh wave attenuation tomography for Central and Southeastern Asia, J. Geophys. Res,. 108, B12304, doi:10.1029/2004JB003193. Yang, X.A., A. R. Lowry, A. L. Levshin, and M. H. Ritzwoller (20050. Toward a Rayleigh wave attenuation model for Eurasia and calibrating a new Ms formula, in Proceedings of the 27th Seismic Research Review: Ground-Based Nuclear Explosion Monitoring Technologies, LA-UR-05-6407, pp. 259-265.
Copyright © 2022 FDOKUMEN