Corrosion Protection of AA2024-T3 Alloy by Modified Hybrid ...
139
Corrosion Protection of AA2024-T3 Alloy by Modified Hybrid Titania-Containing Sol-Gel Coatings A dissertation submitted to the University of Manchester for the degree of Master of Science by Research in the Faculty of Engineering and Physical Sciences 2014 Feng Yu School of Materials University of Manchester
-
Upload
khangminh22 -
Category
Documents
-
view
1 -
download
0
Transcript of Corrosion Protection of AA2024-T3 Alloy by Modified Hybrid ...
Corrosion Protection of AA2024-T3
Alloy by Modified Hybrid
Titania-Containing Sol-Gel Coatings
A dissertation submitted to the University of Manchester
for the degree of Master of Science by Research
in the Faculty of Engineering and Physical Sciences
2014
Feng Yu
School of Materials
University of Manchester
2
List of Contents
LIST OF CONTENTS .......................................................................................... 2
LIST OF FIGURES ............................................................................................. 5
LIST OF TABLES ................................................................................................ 8
LIST OF ABBREVIATIONS ................................................................................ 9
ABSTRACT ....................................................................................................... 10
DECLARATION ................................................................................................ 11
COPYRIGHT STATEMENT .............................................................................. 11
ACKNOWLEDGEMENTS ................................................................................. 12
CHAPTER 1 INTRODUCTION ......................................................................... 13
1.1 GENERAL BACKGROUND ................................................................................ 13
1.2 AIMS AND OBJECTIVES ................................................................................... 14
1.3 RESEARCH APPROACH .................................................................................. 15
1.4 OUTLINE OF THE DISSERTATION ..................................................................... 16
CHAPTER 2 LITERATURE REVIEW ............................................................... 17
2.1 CORROSION.................................................................................................. 17
2.1.1 Corrosion damage ................................................................................................. 17
2.1.2 Forms of corrosion ................................................................................................ 18
2.1.3 Mechanisms of corrosion ...................................................................................... 18
2.1.3.1 Thermodynamics of corrosion process ...................................................................... 18
2.1.3.2 Kinetics of corrosion process..................................................................................... 20
2.1.4 Corrosion protection .............................................................................................. 21
2.2 ALUMINIUM ALLOY ......................................................................................... 22
2.2.1 Introduction to AA2024 .......................................................................................... 23
2.2.2 Corrosion of AA2024 ............................................................................................. 23
2.2.3 Corrosion protection of AA2024 ............................................................................ 26
2.3 SOL-GEL TECHNOLOGY .................................................................................. 28
2.3.1 Introduction to sol-gel process .............................................................................. 28
2.3.2 Sol-gel coatings for corrosion protection ............................................................... 31
2.3.3 Titania-containing hybrid inorganic/organic sol-gel coating .................................. 32
2.4 CONDUCTING POLYMERS ............................................................................... 34
2.4.1 Introduction to conducting polymers ..................................................................... 34
2.4.2 Introduction to polyaniline ...................................................................................... 36
2.4.3 Synthesis of polyaniline ......................................................................................... 38
2.4.3.1 Synthesis of polyaniline nanofibers ........................................................................... 41
2.4.3.2 Synthesis of polyaniline agglomerated particles ........................................................ 43
2.4.4 Corrosion protection by polyaniline ....................................................................... 44
3
2.5 GLASS FLAKE ................................................................................................ 45
2.5.1 Introduction to glass flake ...................................................................................... 45
2.5.2 Corrosion protection by glass flake ....................................................................... 46
CHAPTER 3 EXPERIMENTAL WORK ............................................................. 48
3.1 PREPARATION OF SAMPLES ........................................................................... 48
3.1.1 Cleaning of AA2024 substrate ............................................................................... 48
3.1.2 Synthesis of polyaniline ......................................................................................... 48
3.1.3 Preparation of sol-gel coatings .............................................................................. 50
3.1.3.1 Synthesis of standard sol-gel .................................................................................... 50
3.1.3.2 Synthesis of PVB modified sol-gel ............................................................................. 51
3.1.3.3 Synthesis of PANI modified PVB sol-gel ................................................................... 51
3.1.3.4 Synthesis of GF modified PVB sol-gel ....................................................................... 52
3.1.3.5 Synthesis of PANI and GF modified PVB sol-gel ...................................................... 52
3.1.3.6 Preparation of sol-gel coatings .................................................................................. 53
3.2 CHARACTERIZATION TECHNIQUES .................................................................. 53
3.2.1 Scanning electron microscopy with energy dispersive X-ray spectroscopy
(SEM/EDX) ......................................................................................................................... 53
3.2.2 Optical Microscopy ................................................................................................ 55
3.2.3 Fourier transformation infrared spectroscopy (FTIR) ............................................ 55
3.2.4 Differential scanning calorimetry (DSC) and Thermogravimetry (TG) .................. 56
3.3 TESTING TECHNIQUES ................................................................................... 57
3.3.1 Electrochemical impedance spectroscopy (EIS) ................................................... 57
3.3.2 Water drop contact angle ...................................................................................... 58
3.3.3 Cross-hatch adhesion testing ................................................................................ 58
CHAPTER 4 RESULTS .................................................................................... 61
4.1 CHARACTERIZATION OF MATERIALS ................................................................ 62
4.1.1 Surface condition of AA2024-T3 alloy ................................................................... 62
4.1.1.1 AR2024 ..................................................................................................................... 62
4.1.1.2 AD2024 ..................................................................................................................... 62
4.1.1.3 AE2024 ..................................................................................................................... 63
4.1.2 Morphology of polyaniline ...................................................................................... 63
4.1.2.1 PANI agglomerated particles ..................................................................................... 64
4.1.2.2 PANI nanofibers ........................................................................................................ 65
4.1.2.3 Commercial PANI on carbon black ............................................................................ 65
4.1.3 Morphology of glass flake ...................................................................................... 66
4.2 CORROSION PERFORMANCE .......................................................................... 66
4.2.1 Bare AA2024 ......................................................................................................... 67
4.2.2 Standard sol-gel coatings ...................................................................................... 69
4.2.3 Co-polymer modified sol-gel coatings ................................................................... 73
4.2.4 Polyaniline modified sol-gel coatings .................................................................... 77
4.2.5 Glass flake modified sol-gel coatings .................................................................... 81
4.3 PROPERTIES OF THE SOL-GEL COATINGS ........................................................ 84
4
4.3.1 Contact angle measurements ............................................................................... 84
4.3.2 Cross-hatch adhesion tests ................................................................................... 85
CHAPTER 5 DISCUSSION .............................................................................. 90
5.1 PREPARATION OF MATERIALS ............................................................................... 90
5.1.1 Surface pre-treatments of AA2024 alloy ................................................................... 90
5.1.2 Synthesis of nanostructured polyaniline .................................................................... 91
5.1.2.1 Chemical processes during the polymerization of aniline ................................................. 92
5.1.2.2 Formation of different PANI nanostructures ..................................................................... 93
5.1.3 Preparation of sol-gel coatings on AA2024 ............................................................... 94
5.1.4 Modification of the standard sol-gel coatings ............................................................ 96
5.1.4.1 Influence on thermal properties ........................................................................................ 97
5.1.4.2 Influence on chemical bonding ......................................................................................... 98
5.2 CORROSION PERFORMANCE .............................................................................. 101
5.2.1 Bare AA2024 ........................................................................................................... 101
5.2.2 Standard sol-gel coatings ........................................................................................ 105
5.2.3 PVB modified sol-gel coatings ................................................................................. 108
5.2.4 PANI modified sol-gel coatings ............................................................................... 110
5.2.5 GF modified sol-gel coatings ................................................................................... 114
CHAPTER 6 CONCLUSIONS AND FUTURE WORK .................................... 119
6.1 CONCLUSIONS .................................................................................................. 119
6.1.1 Preparation of materials .......................................................................................... 119
6.1.2 Properties of the sol-gel coatings ............................................................................ 120
6.1.3 Corrosion performance ............................................................................................ 120
6.2 FUTURE WORK .................................................................................................. 122
REFERENCES ............................................................................................... 123
Word count 31,427
5
List of Figures
Fig 2.1 Schematic of localized pitting corrosion of AA2024 [30]........................ 25
Fig 2.2 Schematic presentation of components that make up an aircraft coating
system [30]. ............................................................................................... 26
Fig 2.3 Overview showing two synthesis examples by the sol-gel method; (a)
films from a colloidal sol; (b) powders from a colloidal sol transformed into a
gel [64]. ...................................................................................................... 29
Fig 2.4 The general scheme of sol-gel process of silicon alkoxide precursor [56].
................................................................................................................... 30
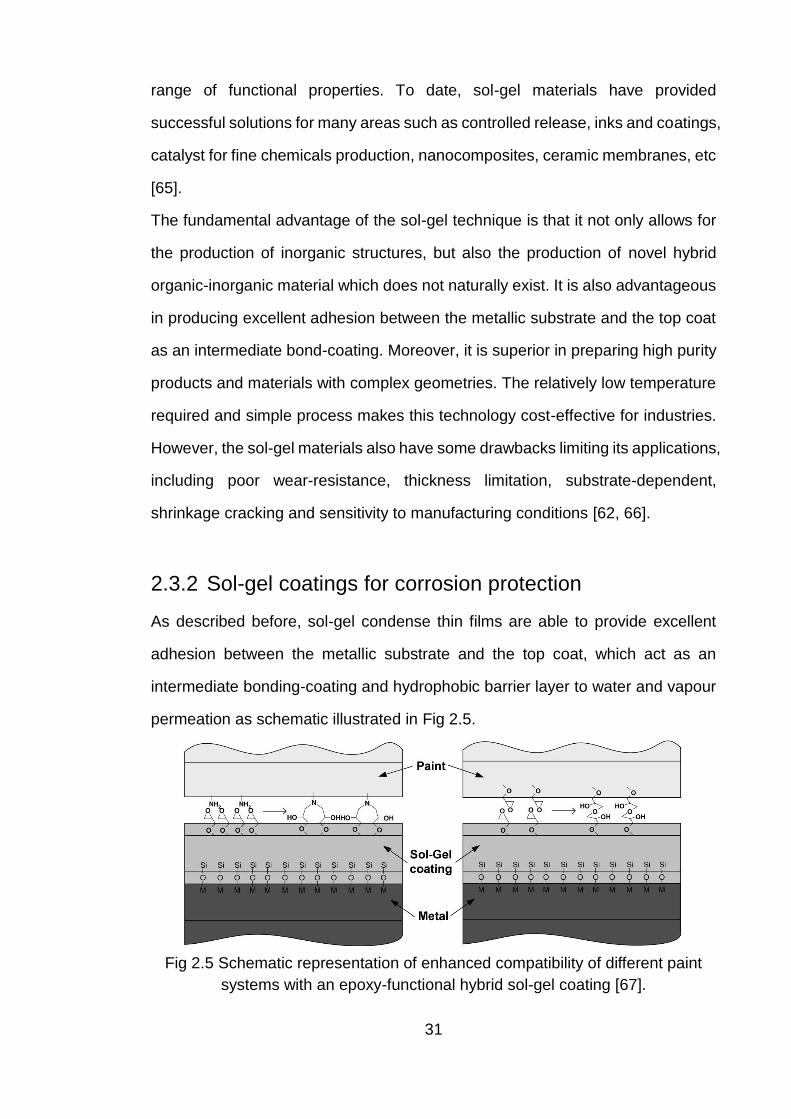
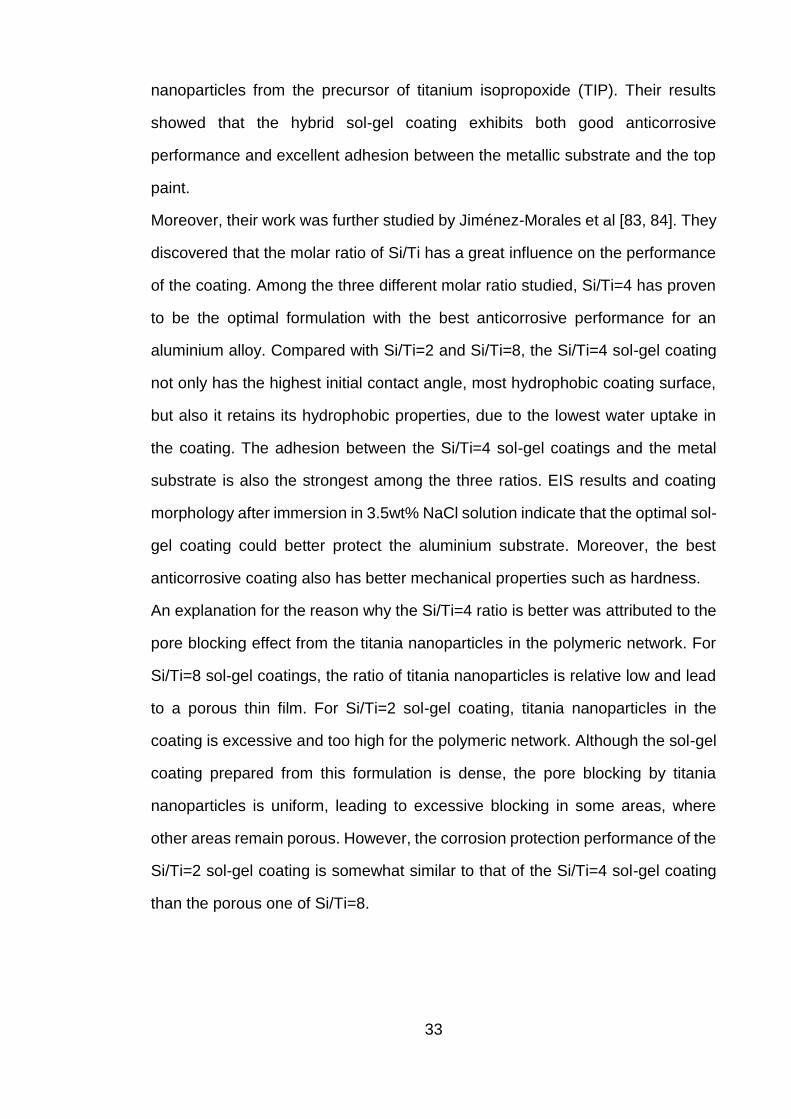
Fig 2.5 Schematic representation of enhanced compatibility of different paint
systems with an epoxy-functional hybrid sol-gel coating [67]. .................... 31
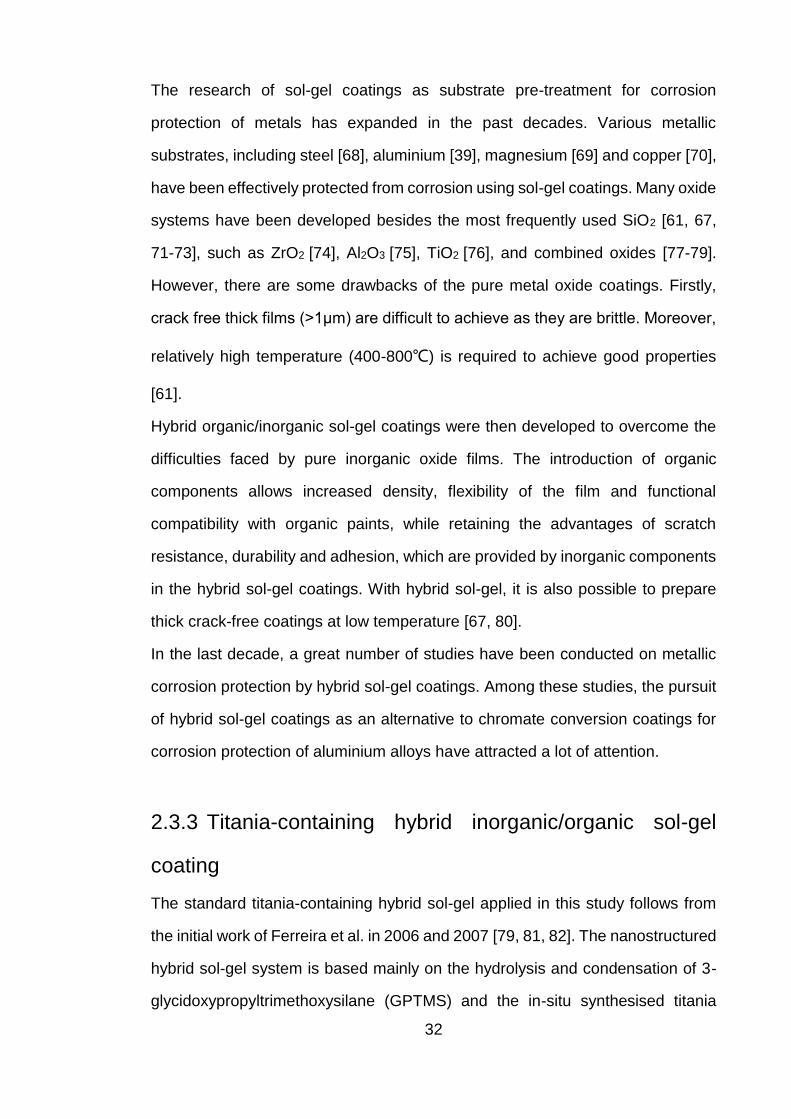
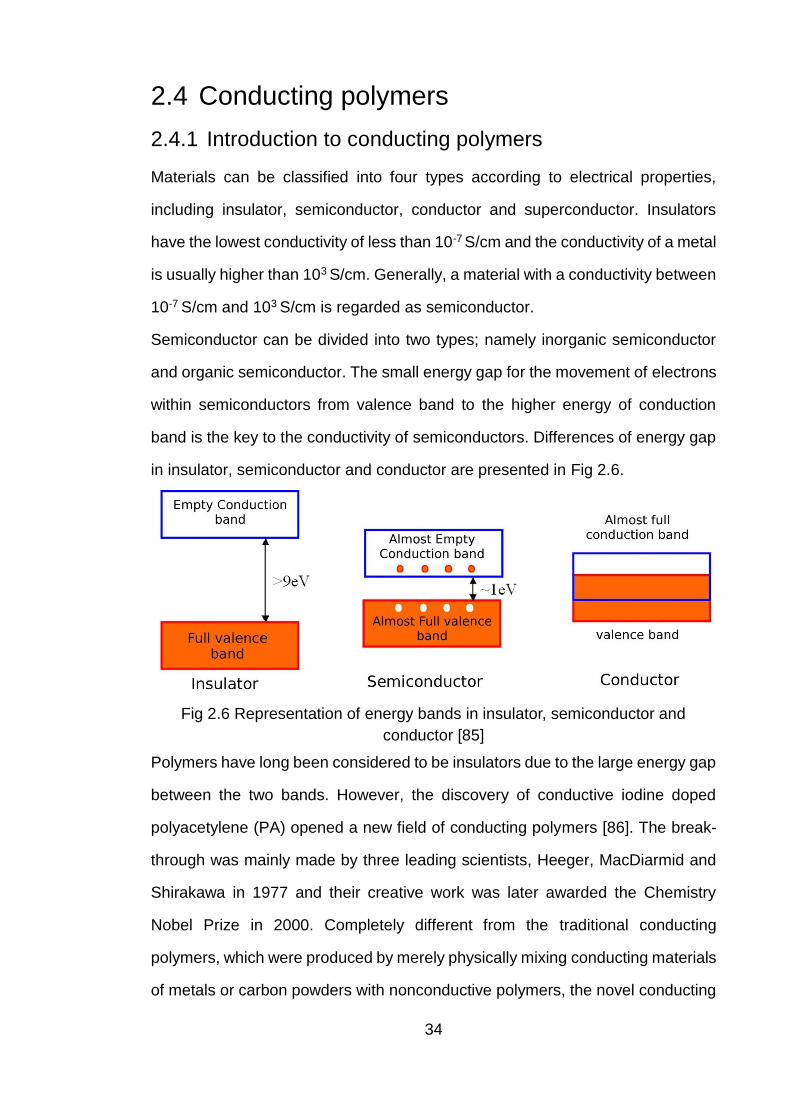
Fig 2.6 Representation of energy bands in insulator, semiconductor and
conductor [85] ............................................................................................ 34
Fig 2.7 Conductivity range of ICPs varies from doping degree [88]. ................. 35
Fig 2.8 Conductivity of doped and undoped trans-(CH)x and emeraldine
polyaniline [89]. .......................................................................................... 36
Fig 2.9 Molecular structure of typical ICPs. ....................................................... 36
Fig 2.10 Schematic diagram showing the molecular structure, synthesis
chemistry, reversible acid/base doping/dedoping, and redox chemistry of
PANI [95]. .................................................................................................. 38
Fig 2.11 Overall reaction of chemical oxidation synthesis of PANI ES [129]. .... 40
Fig 2.12 Synthesis of different nanostructured PANI from various synthetic
conditions [131]. ......................................................................................... 40
Fig 2.13 Schematic illustration of the synthesis of polyaniline nanofibers by a
rapidly mixed reaction [132]. ...................................................................... 42
Fig 2.14 Schematic illustration of the synthesis of polyaniline nanofibers using
interfacial polymerization [132]. ................................................................. 42
Fig 2.15 Schematic illustrations of the formation and aggregation of polyaniline
particles. The green fibers and purple dots represent polyaniline particles
that result from homogeneous and heterogeneous nucleation, respectively
[133]. .......................................................................................................... 42
Fig 2.16 SEM images of PANI nanofibers made with following dopant acid in
interfacial polymerization: (a) HCl, (b) H2SO4, (c)HNO3, and (d) HClO4
[102]. .......................................................................................................... 43
Fig 2.17 Schematic diagram illustrating the formation of PANI agglomerates
during conventional chemical synthesis [103]. ........................................... 43
Fig 2.18 Mechanism of PANI corrosion protection on aluminium [139]. ............ 44
Fig 2.19 SEM images of advanced nano glass flake [144]. .............................. 45
Fig 2.20 The tortuous path effect [144]. ............................................................ 46
Fig 3.1 Chemical formula of the PVB [154]. ...................................................... 51
Fig 3.2 Image showing dip-coating method for preparation of sol-gel coatings. 53
6
Fig 3.3 Image of Quanta 200 FEG SEM/EDX. .................................................. 54
Fig 3.4 Images of Zeiss AXIO Lab.A1 2-D Optical Microscope (left) and Bruker
ContourGT-I 3D Optical Microscope (right)................................................ 55
Fig 3.5 Image of Thermo Electron FTIR Nicolet 5700 with diamond ATR unit. . 56
Fig 3.6 Images of Q-100 DSC (left) and Q-500 TGA (right) from TA instruments.
................................................................................................................... 56
Fig 3.7 Image of typical aerated three-electrode cell used for EIS
measurements ........................................................................................... 57
Fig 3.8 Image of FTA 188 Video Tensiometer used in this study. ..................... 58
Fig 3.9 Schematic illustrations for the operation procedures of cross hatch
adhesion test according to ASTM D3359-09E2 standard [157]. ................ 59
Fig 4.1 SEM images of AR2024 surface. .......................................................... 62
Fig 4.2 SEM images of AD2024 surface. .......................................................... 63
Fig 4.3 SEM images of AE2024 surface. .......................................................... 63
Fig 4.4 SEM images of PANI ES agglomerated particles ................................. 64
Fig 4.5 SEM images of PANI ES nanofibers. .................................................... 65
Fig 4.6 SEM images of PANI ES on carbon black. ........................................... 66
Fig 4.7 SEM images of GF001 glass flake. ....................................................... 66
Fig 4.8 Bode (upper) and phase angle (bottom) plots of bare AR2024, AD2024
and AE2024 in 3.5% NaCl solution at 1h, 1 day and 8 days immersion. ... 68
Fig 4.9 Optical microscopy images of bare AR2024 (left), AD2024 (middle) and
AE2024 (right) (a) before and (b) after 8 days immersion in 3.5% NaCl
solution; (c) Digital images after 8 days immersion. ................................... 69
Fig 4.10 Bode (upper) and phase angle (bottom) plots of standard sol-gel
coated AR2024 (AR2024_SG), AD2024 (AD2024_SG) and AE2024
(AE2024_SG) in 3.5% NaCl solution at 1hour, 8 and 24 hours immersion.
................................................................................................................... 70
Fig 4.11 Cross-section SEM images of standard sol-gel coatings on AR2024
(left), AD2024 (middle) and AE2024 (right). ............................................... 72
Fig 4.12 Optical microscopies(a),(b) of bare AR2024_SG (left), AD2024_SG
(middle) and AE2024_SG (right) (a) before and (b) after 8 days immersion
in 3.5% NaCl solution and (c) digital images after 8 days immersion. ....... 73
Fig 4.13 Bode (upper) and phase angle (bottom) plots of PVB modified sol-gel
coatings on AE2024 in 3.5% NaCl solution at 1 hour, 1 day and 4 days
immersion. Volume ratios of PVB (10wt% solution in ethanol) versus the
standard sol-gel were SG_PVB_4 and SG_PVB_8. .................................. 74
Fig 4.14 Cross-section SEM images of PVB containing sol-gel coatings,
SG_PVB_8 (left), SG_PVB_4 (right). ......................................................... 75
Fig 4.15 Optical micrographs of SG_PVB_8 (left) and SG_PVB_4 (right) (a)
before and (b) after 8 days immersion in 3.5% NaCl solution and (c) digital
images after 8 days immersion. ................................................................. 76
Fig 4.16 Cross-section SEM images of PANI_NF modified PVB sol-gel coatings.
................................................................................................................... 78
7
Fig 4.17 Bode(upper) and phase angle (bottom) plots of PANI containing PVB
sol-gel coatings on AE2024 in 3.5% NaCl solution at 1 hour, 4 days and 8
days immersion. (PANI_AP/NMP_PVB, PANI_NF/NMP_PVB and
PANI_CB/NMP_PVB refers to the addition of PANI ES agglomerated
particles, nanofibers and carbon black composites into SG_PVB_4 sol-
gels, respectively.) ..................................................................................... 78
Fig 4.18 Optical micrographs of PANI_AP/NMP_PVB (left),
PANI_NF/NMP_PVB (middle) and PANI_CB/NMP_PVB (right) (a) before
and (b) after 8 days immersion in 3.5% NaCl solution and (c) Digital images
after 8 days immersion. ............................................................................. 80
Fig 4.19 Bode(upper) and phase angle (bottom) plots of glass flake containing
PVB sol-gel coatings(GF001_PVB) on AE2024 in 3.5% NaCl solution at 1
hour, 1 days, 4 days immersion and combination of GF001 and PANI ES
nanofibers (GF001_PANI_NF/NMP_PVB) at 1 hour, 4 days and 8 days
immersion. ................................................................................................. 82
Fig 4.20 Optical micrographs of GF001_PVB (left) and
GF001_PANI_NF/NMP_PVB (right) (a) before and (b) after 8 days
immersion in 3.5% NaCl solution and (c) Digital images after 8 days
immersion. ................................................................................................. 83
Fig 4.21 Contact angle for the surface of bare AA2024 and various sol-gel
coatings. .................................................................................................... 85
Fig 4.22 Typical optical micrographs showing the condition of all the coatings
after cross-hatch adhesion tests at dry (left) and wet (right) environment. 89
Fig 5.1 Proposed mechanism for polymerization of aniline by Wei et al [177]. . 93
Fig 5.2 DSC/TG curves for standard sol-gel and PVB, PANI, GF001 modified
sol-gel. ....................................................................................................... 97
Fig 5.3 FTIR spectra of standard sol-gel coating and PVB, PANI, GF001,
GF001/PANI modified sol-gel coatings ...................................................... 99
Fig 5.4 Two typical EECs used for the simulation of bare AA2024 immersed in
3.5% NaCl solution. ................................................................................. 102
Fig 5.5 Nyquist plots of bare AA2024 alloy in 3.5% NaCl solution during 1 hour,
1 day and 8 days immersion for AR2024, AD2024 and AE2024. ............ 103
Fig 5.6 SEM image of pits on AA2024 (Insert is Cu-rich aggregate) [51]. ....... 104
Fig 5.7 Nyquist plots of standard sol-gel coated AA2024 in 3.5%NaCl solution
during 1, 8 and 24 hours immersion for AR2024_SG, AD2024_SG and
AE2024_SG. ............................................................................................ 105
Fig 5.8 Two typical EECs used for the analysis of sol-gel coated AA2024
immersed in 3.5% NaCl solution. ............................................................. 106
Fig 5.9 Nyquist plots of PVB modified sol-gel coated AA2024 in 3.5%NaCl
solution for 1 hour, 1 day and 4 days immersion. .................................... 109
Fig 5.10 Nyquist plots of PANI AP and NF modified sol-gel coated AA2024 in
3.5%NaCl solution during 1 hour, 1 day, 4 days immersion and PANI CB
modified coatings during 1 hour and 4 hours immersion. ........................ 111
8
Fig 5.11 EEC used for the simulation of PANI AP and NF modified coatings in
3.5% NaCl solution during 8 days immersion. ......................................... 111
Fig 5.12 Images of three PANI modified sol-gels on glass slides;
PANI_AP/NMP_PVB (left), PANI_NF/NMP_PVB (middle),
PANI_CB/NMP_PVB (right) ..................................................................... 113
Fig 5.13 Nyquist plots of GF001 modified PVB and PANI NF sol-gel coatings on
AA2024 in 3.5%NaCl solution during 1 hour, 1 day, 4 days immersion and
additional 8 days for GF001_PANI_NF/NMP_PVB coating. .................... 115
Fig 5.14 Optical image of GF001 modified PANI sol-gel coating on 1µm mirror
finished AA2024. ...................................................................................... 117
Fig 5.15 Interferometry images of GF001 modified sol-gel coatings showing
buried (left) and protruded (right) GF001. ................................................ 117
List of Tables
Table 3.1 Percent chemical composition of AA2024-T3 aluminium [151, 152]. 48
Table 3.2 Chemical compositions of GF001 glass flakes [155]. ........................ 52
Table 3.3 Properties of GF001 glass flakes [155]. ............................................ 52
Table 3.4 Descriptions and results for cross hatch adhesion test according to
ASTM D3359-09E2 standard [157]. ........................................................... 60
Table 4.1 Cross-hatch adhesion for the surface of bare AA2024 and various sol-
gel coatings. ............................................................................................... 86
Table 5.1 Assignments for the peaks highlighted in the FTIR spectra of sol-gel
coatings. .................................................................................................. 100
Table 5.2 Parameters of standard sol-gel coated AA2024 system after fitting the
EIS data with different EECs. ................................................................... 106
Table 5.3 Parameters of standard and PVB modified sol-gel coated AA2024
system after fitting the EIS data with different EEC in Fig 5.8 (a). ........... 110
Table 5.4 Parameters of PVB and PANI modified sol-gel system after fitting the
EIS data with different EECs in Fig 5.8 (a) and Fig 5.11. ......................... 112
Table 5.5 Parameters of GF001 modified and unmodified PVB and PANI sol-gel
system after fitting the EIS data with different EECs in Fig 5.8 (a) and Fig
5.11. ......................................................................................................... 115
9
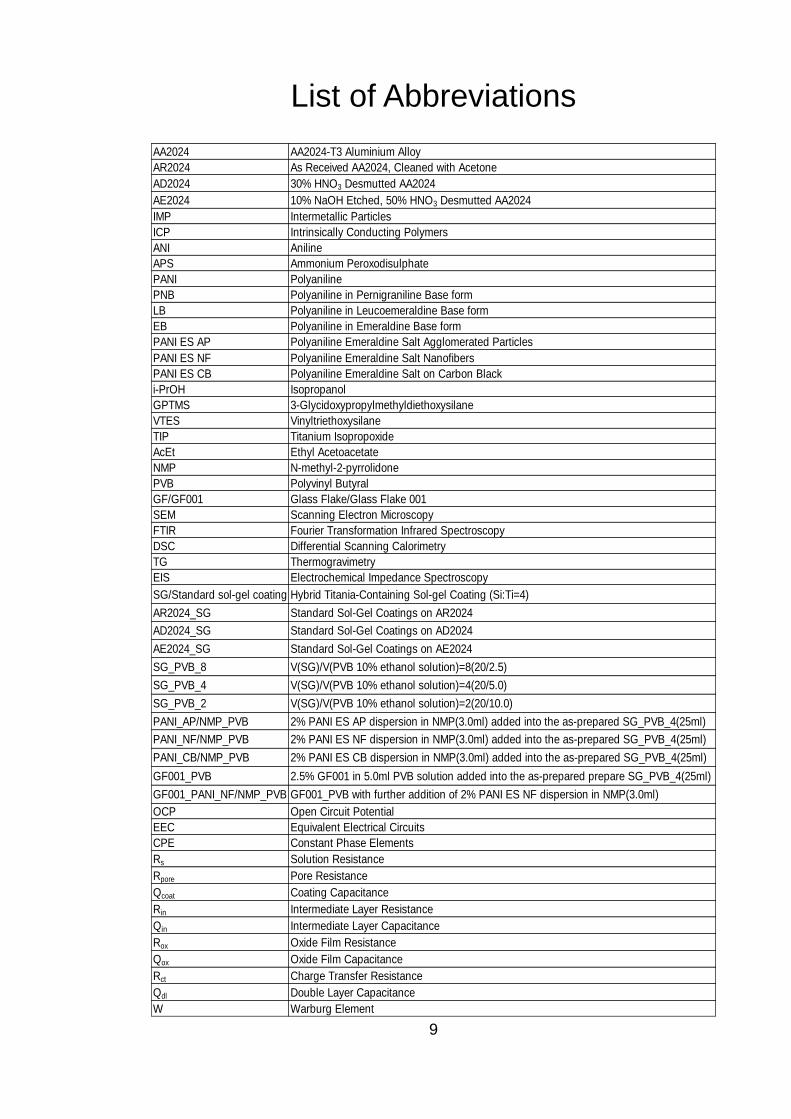
List of Abbreviations
AA2024 AA2024-T3 Aluminium Alloy
AR2024 As Received AA2024, Cleaned with Acetone
AD2024 30% HNO3 Desmutted AA2024
AE2024 10% NaOH Etched, 50% HNO3 Desmutted AA2024
IMP Intermetallic Particles
ICP Intrinsically Conducting Polymers
ANI Aniline
APS Ammonium Peroxodisulphate
PANI Polyaniline
PNB Polyaniline in Pernigraniline Base form
LB Polyaniline in Leucoemeraldine Base form
EB Polyaniline in Emeraldine Base form
PANI ES AP Polyaniline Emeraldine Salt Agglomerated Particles
PANI ES NF Polyaniline Emeraldine Salt Nanofibers
PANI ES CB Polyaniline Emeraldine Salt on Carbon Black
i-PrOH Isopropanol
GPTMS 3-Glycidoxypropylmethyldiethoxysilane
VTES Vinyltriethoxysilane
TIP Titanium Isopropoxide
AcEt Ethyl Acetoacetate
NMP N-methyl-2-pyrrolidone
PVB Polyvinyl Butyral
GF/GF001 Glass Flake/Glass Flake 001
SEM Scanning Electron Microscopy
FTIR Fourier Transformation Infrared Spectroscopy
DSC Differential Scanning Calorimetry
TG Thermogravimetry
EIS Electrochemical Impedance Spectroscopy
SG/Standard sol-gel coating Hybrid Titania-Containing Sol-gel Coating (Si:Ti=4)
AR2024_SG Standard Sol-Gel Coatings on AR2024
AD2024_SG Standard Sol-Gel Coatings on AD2024
AE2024_SG Standard Sol-Gel Coatings on AE2024
SG_PVB_8 V(SG)/V(PVB 10% ethanol solution)=8(20/2.5)
SG_PVB_4 V(SG)/V(PVB 10% ethanol solution)=4(20/5.0)
SG_PVB_2 V(SG)/V(PVB 10% ethanol solution)=2(20/10.0)
PANI_AP/NMP_PVB 2% PANI ES AP dispersion in NMP(3.0ml) added into the as-prepared SG_PVB_4(25ml)
PANI_NF/NMP_PVB 2% PANI ES NF dispersion in NMP(3.0ml) added into the as-prepared SG_PVB_4(25ml)
PANI_CB/NMP_PVB 2% PANI ES CB dispersion in NMP(3.0ml) added into the as-prepared SG_PVB_4(25ml)
GF001_PVB 2.5% GF001 in 5.0ml PVB solution added into the as-prepared prepare SG_PVB_4(25ml)
GF001_PANI_NF/NMP_PVB GF001_PVB with further addition of 2% PANI ES NF dispersion in NMP(3.0ml)
OCP Open Circuit Potential
EEC Equivalent Electrical Circuits
CPE Constant Phase Elements
Rs Solution Resistance
Rpore Pore Resistance
Qcoat Coating Capacitance
Rin Intermediate Layer Resistance
Qin Intermediate Layer Capacitance
Rox Oxide Film Resistance
Qox Oxide Film Capacitance
Rct Charge Transfer Resistance
Qdl Double Layer Capacitance
W Warburg Element
10
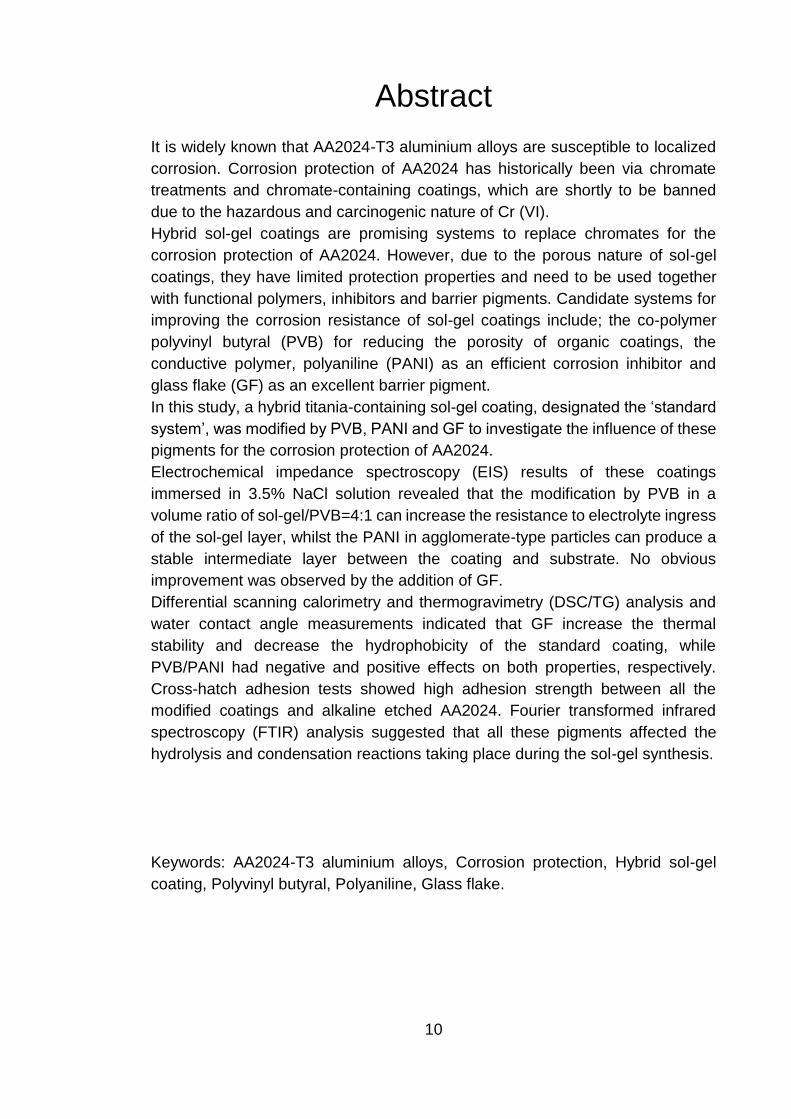
Abstract
It is widely known that AA2024-T3 aluminium alloys are susceptible to localized
corrosion. Corrosion protection of AA2024 has historically been via chromate
treatments and chromate-containing coatings, which are shortly to be banned
due to the hazardous and carcinogenic nature of Cr (VI).
Hybrid sol-gel coatings are promising systems to replace chromates for the
corrosion protection of AA2024. However, due to the porous nature of sol-gel
coatings, they have limited protection properties and need to be used together
with functional polymers, inhibitors and barrier pigments. Candidate systems for
improving the corrosion resistance of sol-gel coatings include; the co-polymer
polyvinyl butyral (PVB) for reducing the porosity of organic coatings, the
conductive polymer, polyaniline (PANI) as an efficient corrosion inhibitor and
glass flake (GF) as an excellent barrier pigment.
In this study, a hybrid titania-containing sol-gel coating, designated the ‘standard
system’, was modified by PVB, PANI and GF to investigate the influence of these
pigments for the corrosion protection of AA2024.
Electrochemical impedance spectroscopy (EIS) results of these coatings
immersed in 3.5% NaCl solution revealed that the modification by PVB in a
volume ratio of sol-gel/PVB=4:1 can increase the resistance to electrolyte ingress
of the sol-gel layer, whilst the PANI in agglomerate-type particles can produce a
stable intermediate layer between the coating and substrate. No obvious
improvement was observed by the addition of GF.
Differential scanning calorimetry and thermogravimetry (DSC/TG) analysis and
water contact angle measurements indicated that GF increase the thermal
stability and decrease the hydrophobicity of the standard coating, while
PVB/PANI had negative and positive effects on both properties, respectively.
Cross-hatch adhesion tests showed high adhesion strength between all the
modified coatings and alkaline etched AA2024. Fourier transformed infrared
spectroscopy (FTIR) analysis suggested that all these pigments affected the
hydrolysis and condensation reactions taking place during the sol-gel synthesis.
Keywords: AA2024-T3 aluminium alloys, Corrosion protection, Hybrid sol-gel
coating, Polyvinyl butyral, Polyaniline, Glass flake.
11
Declaration
No portion of the work referred to in the dissertation has been submitted in
support of an application for another degree or qualification of this or any other
university or other institute of learning.
Signature
Copyright Statement
The author of this dissertation (including any appendices and/or schedules to this
dissertation) owns any copyright in it (the “Copyright”) and s/he has given The
University of Manchester the right to use such Copyright for any administrative,
promotional, educational and/or teaching purposes.
Copies of this dissertation, either in full or in extracts, may be made only in
accordance with the regulations of the John Rylands University Library of
Manchester. Details of these regulations may be obtained from the Librarian. This
page must form part of any such copies made.
The ownership of any patents, designs, trademarks and any and all other
intellectual property rights except for the Copyright (the “Intellectual Property
Rights”) and any reproductions of copyright works, for example graphs and tables
(“Reproductions”), which may be described in this dissertation, may not be owned
by the author and may be owned by third parties. Such Intellectual Property
Rights and Reproductions cannot and must not be made available for use without
the prior written permission of the owner(s) of the relevant Intellectual Property
Rights and/or Reproductions.
Further information on the conditions under which disclosure, publication and
exploitation of this dissertation, the Copyright and any Intellectual Property Rights
and/or Reproductions described in it may take place is available from the Head
of School of Materials.

12
Acknowledgements
I would like to express my sincerest gratitude to my supervisor Professor Robert
Akid for his guidance over the last year. Without his great support on experiments
and funding, expert advice on concept and progress, patient assistance on
understanding and revision of this dissertation, it would be impossible for me to
finish this mater project alone. One year cooperation with him was really an
enjoyment of scientific research and corrosion study.
I would like to thank my co-supervisor Dr Robert Lindsay and course director Dr
Xiaorong Zhou for their helpful guidance and suggestions through my study and
research as well as Professor Peter Skelton, Professor Stuart Lyon, Dr Rafael
Leiva-García, Dr Clara Escriva-Cerdan, Dr Yuanfeng Yang, Dr Suzanne Morsch,
Dr Tony Cook, Dr Yanwen Liu, Dr Andronikos Balaskas, Dr Alex Cassell, Mr
Federico García-Galván, Mr Steve Blatch, Mr Simon Smith, Mr Paul Jordan, Mr
Teruo Hashimoto, Mr Patrick Hill, Mr Hong Liu, Mrs Polly Greensmith and all the
colleagues in BP lab for their important help on providing either conceptual or
experimental suggestions and help. I would like to thank Professor Robert Freer,
Dr Joe Robson, Dr Zhu Liu, Dr Michele Curioni, Dr Nick Stevens and Dr Dirk
Engelberg for their help on introducing basic knowledge of either materials or
corrosion during the taught units and Mrs Olwen Richert for her assistance on the
problems in my programme.
I would like to thank Professor David Leigh, Ms Valerie Bruyr from the School of
Chemistry and Professor Krishna Persaud, Dr Danesh Ehsan from the School of
Chemical Engineering and Analytical Science for their kind assistance on
preparation of polyaniline. I would like to thank Dr Gittens Jeanette from Sheffield
Hallam University, Mr Charles Watkinson from CorroCoat UK, Mr Dave Gray from
IMCD UK Ltd, Mr John Fletcher from Elcometer UK for their generous donation
of materials or suggestions on the use of equipment as well as generous financial
support from BP.
Last but not least, I would like to give my deepest gratitude to my family,
especially my parents and brother, and best friends, who gave me so much
support, care, encouragement and love so that I could overcome the difficulties
over the last year.
13
Chapter 1 Introduction
1.1 General background
Corrosion has always been a problem in society, especially in an economic sense
in that it costs approximately 3-4% Gross National Product of many countries.
Direct corrosion damage also increases the risk to safety and lack of conservation.
Besides some common problems raised from indirect corrosion damage,
including plant shutdown and contamination of products, many catastrophic
failures may also bring serious problems to the society and humans, such as
leaking of toxic chemicals and breakdown of bridges or nuclear power plants.
As the most widely used non-ferrous metal, aluminium has a long track history
for the application in various important industries, including aircrafts, automobiles
and construction. The alloy AA2024-T3 has the advantage of high strength to
weight ratio being particularly important for the aerospace industry and is perhaps
the best known of the Al alloys. Unfortunately, due to the introduction of alloying
elements, notably Cu, AA2024 is susceptible to localized corrosion, especially in
chloride containing environments.
Chromate based conversion coatings have achieved remarkable successes in
the corrosion protection of AA2024 over many decades. However, the toxic and
carcinogenic nature of chromium (VI) from these coatings has limited their
application. A ban on these products is due to the increasing restrictions imposed
by environmental legislation. As a result, this is leading to an increasing demand
for environmentally friendly corrosion protection coatings.
Among all the alternatives to chromate conversion coatings, hybrid sol-gel
coatings are showing promise, owing to ability to form thin films at low cure
temperatures, excellent adhesion between the metal and topcoat, and
importantly, their non-toxic properties. Moreover, the combination of both the
benefits from inorganic ceramics and organic networks also provides the hybrid
sol-gel coatings with excellent durability, scratch resistance, flexibility and
14
functional compatibility with organic paints. In addition, a good candidate for the
replacement of chromate conversion coatings is that of conductive polymers,
especially polyaniline (PANI), which is an interesting material for corrosion
inhibition, due to the redox-active nature of PANI and its good stability in many
systems.
As an excellent binder, the co-polymer Polyvinyl butyral (PVB) is superior in
providing effective adhesion between organic coatings and metals, along with
providing cross-linking properties for sol-gel coatings. High aspect ratio glass
flake (GF), especially at nanoscale, has been successfully applied as an efficient
physical barrier pigment in organic coatings for corrosion protection of metals.
With the addition of glass flake, not only the mechanical properties but also the
lifetime of organic coatings may be significantly improved.
In this study, a conductive polymer, PANI, a co-polymer of PVB and commercial
corrosion resistant GF are used as pigments to modify a hybrid titania-containing
sol-gel coating. An investigation on the modified sol-gel coatings was carried out
for the corrosion protection of AA2024 alloy.
1.2 Aims and objectives
To meet the increasing demand for chromate conversion coating alternatives, a
hybrid titania-containing sol-gel coating has been newly developed. However,
corrosion protection for AA2024 by this coating is still limited due to the porous
nature of hybrid sol-gel network.
The aim of this project is therefore to improve the performance of this coating for
the corrosion protection of AA2024 and investigate the influences of different
pigments on the hybrid titania-containing sol-gel coating.
The main objectives of the project are
1. To produce a dense thin film and increase the adhesion strength between the
substrate and the sol-gel coating. Modification by the co-polymer of PVB may be
15
promising in achieving this goal, due to additional cross-linking properties
introduced by PVB and its excellent binding properties.
2. To stabilise active corrosion inhibitors in the sol-gel network, which may
provide long term corrosion protection properties. The addition of PANI, which
predominantly acts as an anodic corrosion inhibitor, may be promising to improve
the corrosion performance of the standard sol-gel coating.
3. To introduce additional physical barrier properties to the porous sol-gel network
and decrease the permeability of aggressive species. From this point of view,
corrosion resistant glass flake may be an ideal candidate and improvement may
be obtained if used appropriately.
1.3 Research approach
To cover the aims and objectives listed above, this study is divided into two parts.
In the first part, different surface pre-treatments for cleaning AA2024 alloy were
studied on bare substrate of AA2024, as variations in properties of the substrate
surface may be introduced by an inappropriate cleaning procedures, which
influence subsequent performance of the sol-gel coatings.
In the second part, binary, ternary and quaternary systems were studied to
evaluate the effect these pigments had on the corrosion performance of the sol-
gel coatings.
In this study, scanning electron microscopy (SEM) was used to characterize the
surface of AA2024, morphology of both PANI and GF as well as the cross-section
thickness of the sol-gel coatings. Electrochemical impedance spectroscopy (EIS)
was used to investigate the corrosion behaviour of bare AA2024 and sol-gel
coated samples in 3.5% NaCl solution. Optical microscopy was used to compare
the alloy and coating surface of AA2024 before and after corrosion, as well as
evaluate the adhesion properties of the different coating systems to the substrate.
Cross-hatch adhesion tests and water drop contact angle measurements were
16
used to study the adhesion strength and surface hydrophobicity of the coatings,
respectively. Differential scanning calorimetry (DSC) and thermogravimetry (TG)
were used to compare the thermal stability of different sol-gel coatings and study
the influence of coating formulation on curing temperature. Fourier transform
infrared spectroscopy (FTIR) was used to study the influence of these pigments
on the chemical bonding properties in comparison to that of the standard sol-gel
coating.
1.4 Outline of the dissertation
To provide essential background information of the research, chapter 2 provides
a review of literature. The concept of corrosion, aluminium alloy, sol-gel process,
conducting polymers and glass flakes, along with general corrosion protection,
corrosion protection of AA2024 alloy, corrosion protection by sol-gel coatings,
conducting polymers and glass flake were briefly reviewed in this chapter. The
details of cleaning processes of AA2024 alloy, preparation procedures of PANI
and sol-gel coatings along with characterization and testing techniques were
given in chapter 3. Chapter 4 presents the results on the morphology of different
AA2024 alloy surface, different nanostructured PANI and glass flake, the
corrosion performance of substrates cleaned under different conditions and
performance of standard and modified sol-gel coatings, and surface
hydrophobicity and adhesion strength between the coatings.
Chapter 5 discusses the influence of cleaning procedures on substrate behaviour;
the synthesis of different nanostructured PANI, preparation of hybrid sol-gel
coatings; the influence of formulation modifications on corrosion resistance in
comparison to the standard coating. Finally, general conclusions and some
recommendations for future work are given in chapter 6.
17
Chapter 2 Literature Review
2.1 Corrosion
Corrosion is generally described as the result of interaction between materials
and the environment. The term corrosion is associated with metals only. The term
environment, normally aggressive to the materials, may range from humid air and
marine water to soils etc. The magnitude of corrosion does not depend on the
materials or environment alone, but upon the positive or negative interaction
between them [1]. More specifically, corrosion is defined as the destructive attack
of a metal or alloy by the chemical or electrochemical reaction with the
environment, leading to a gradual degradation of the material. Physically
deterioration of materials, e.g., galling, erosion or wear is not termed as corrosion,
however in some cases, physical deterioration is accompanied by chemical
degradation of the materials, for example, erosion-corrosion or tribocorrosion [2,
3].
2.1.1 Corrosion damage
Corrosion damage is mainly divided into three aspects, including loss of economy,
failure of safety and lack of conservation. According to recent studies [1, 4], the
direct economic loss of corrosion is approximately 3-4% of the Gross National
Product (GNP) in the United States, Great Britain, China, Australia, Japan and
many other countries. Although indirect loss of the economy is difficult to assess,
some important types include, plant shutdown, loss of product and plant efficiency,
contamination of products and overdesign. Corrosion of operating equipment
materials could lead to catastrophic failure of, for example, pressure vessels,
toxic chemical metallic containers, bridges and especially nuclear power plants.
The lack of conservation for metals is not only a bare loss of materials, but also

18
a waste of energy as well as human efforts and raw materials required for the lost
metals [2].
2.1.2 Forms of corrosion
Corrosion of materials may be classified into numerous forms, as shown below
[5]:
1. Uniform corrosion
2. Intergranular corrosion
3. Galvanic corrosion
4. Crevice corrosion
5. Pitting corrosion
6. Erosion corrosion
7. Stress corrosion cracking
8. Biological corrosion
9. Selective leaching
The order of this list does not mean any order of importance and each form would
need to be considered for a specific couple of metal and environment.
2.1.3 Mechanisms of corrosion
2.1.3.1 Thermodynamics of corrosion process
Generally, corrosion processes follow the First and Second Law of
thermodynamics [6].
The energy conservation principle in the First Law of thermodynamics defines
that the internal energy change in a corrosion system is equal to the sum of work
done to or by a corrosion system and the heat released or absorbed by a
corrosion system, according to equation (2-1).
ΔU=W+Q (2-1)
Where

19
ΔU is the internal energy change in a corrosion system (J)
W is the work done to or by a corrosion system (J)
Q is the heat released or absorbed by a corrosion system (J)
A closed corrosion system then follows the Second Law of thermodynamics,
which also refers to the entropy principle. In case of constant pressure and
temperature, the Gibbs free energy of a corrosion system must decrease for the
corrosion process to be spontaneous. The Gibbs free energy is presented in the
form of enthalpy and entropy, according to equation (2-2).
G=H-TS (2-2)
Where
G is the Gibbs free energy (Jmol-1)
H is the enthalpy (Jmol-1)
S is the entropy (Jmol-1K-1)
T is the absolute temperature (K)
For electrochemical corrosion reactions in aqueous solutions [7], Faraday's law
relates the Gibbs free energy to electrode potential as shown in equation (2-3).
ΔG=-nEF (2-3)
Where
ΔG is the Gibbs free energy change (Jmol-1)
E is the reversible electrode potential at constant temperature and pressure
(V)
F is the Faraday’s constant (96,485 Cmol-1)
n is the number of electrons transferred during the reaction
It is important to note that the potential in the equation (2-3) is the standard
electrode potentials, where recants and products are in their standard states.
The relationship between actual reversible potential and standard reversible
potential of an electrode may be expressed by the Nernst equation. Taking anodic
reaction of metallic dissolution reaction
M ⇋ Mn++ne- (2-4)
20
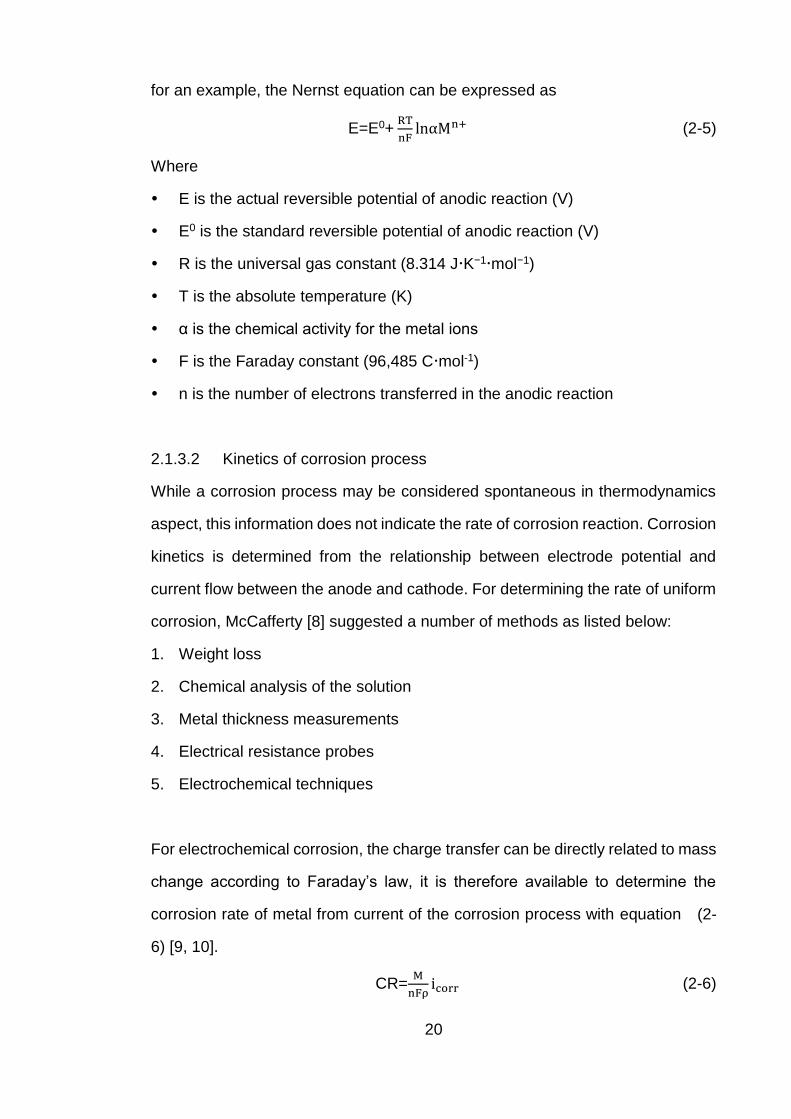
for an example, the Nernst equation can be expressed as
E=E0+ RT
nFlnαMn+ (2-5)
Where
E is the actual reversible potential of anodic reaction (V)
E0 is the standard reversible potential of anodic reaction (V)
R is the universal gas constant (8.314 JK−1mol−1)
T is the absolute temperature (K)
α is the chemical activity for the metal ions
F is the Faraday constant (96,485 Cmol-1)
n is the number of electrons transferred in the anodic reaction
2.1.3.2 Kinetics of corrosion process
While a corrosion process may be considered spontaneous in thermodynamics
aspect, this information does not indicate the rate of corrosion reaction. Corrosion
kinetics is determined from the relationship between electrode potential and
current flow between the anode and cathode. For determining the rate of uniform
corrosion, McCafferty [8] suggested a number of methods as listed below:
1. Weight loss
2. Chemical analysis of the solution
3. Metal thickness measurements
4. Electrical resistance probes
5. Electrochemical techniques
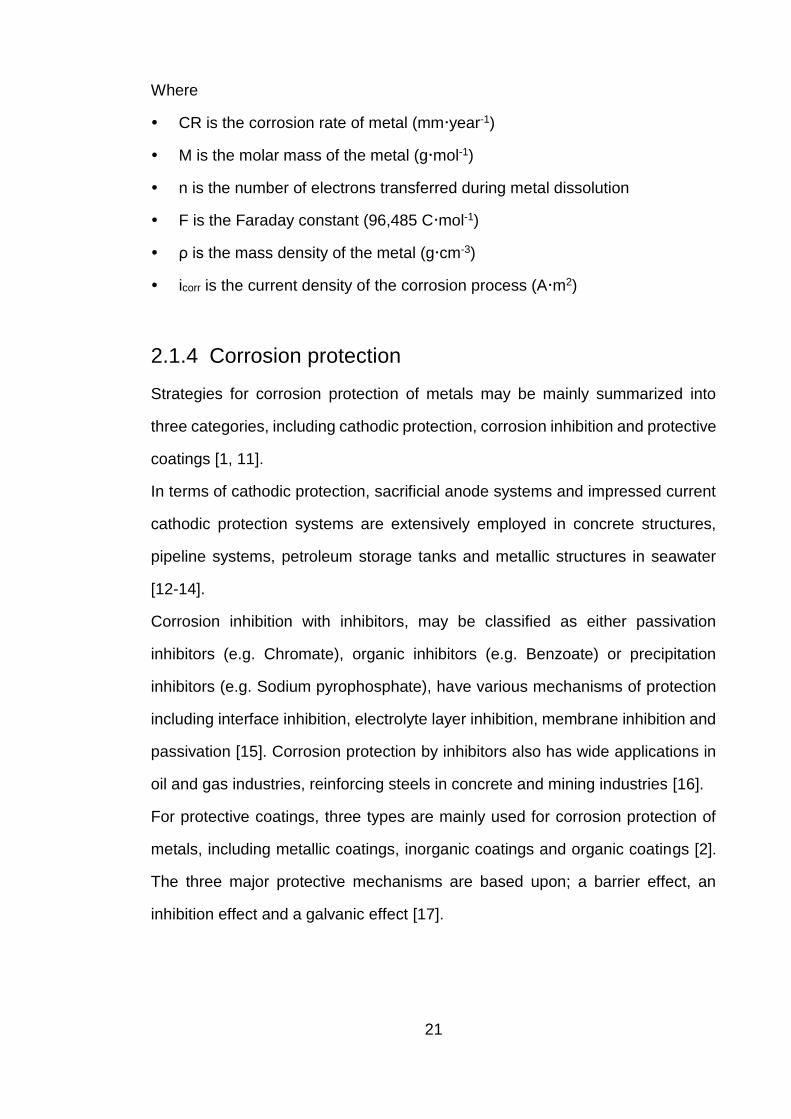
For electrochemical corrosion, the charge transfer can be directly related to mass
change according to Faraday’s law, it is therefore available to determine the
corrosion rate of metal from current of the corrosion process with equation (2-
6) [9, 10].
CR=M
nFρicorr (2-6)
21
Where
CR is the corrosion rate of metal (mmyear-1)
M is the molar mass of the metal (gmol-1)
n is the number of electrons transferred during metal dissolution
F is the Faraday constant (96,485 Cmol-1)
ρ is the mass density of the metal (gcm-3)
icorr is the current density of the corrosion process (Am2)
2.1.4 Corrosion protection
Strategies for corrosion protection of metals may be mainly summarized into
three categories, including cathodic protection, corrosion inhibition and protective
coatings [1, 11].
In terms of cathodic protection, sacrificial anode systems and impressed current
cathodic protection systems are extensively employed in concrete structures,
pipeline systems, petroleum storage tanks and metallic structures in seawater
[12-14].
Corrosion inhibition with inhibitors, may be classified as either passivation
inhibitors (e.g. Chromate), organic inhibitors (e.g. Benzoate) or precipitation
inhibitors (e.g. Sodium pyrophosphate), have various mechanisms of protection
including interface inhibition, electrolyte layer inhibition, membrane inhibition and
passivation [15]. Corrosion protection by inhibitors also has wide applications in
oil and gas industries, reinforcing steels in concrete and mining industries [16].
For protective coatings, three types are mainly used for corrosion protection of
metals, including metallic coatings, inorganic coatings and organic coatings [2].
The three major protective mechanisms are based upon; a barrier effect, an
inhibition effect and a galvanic effect [17].
22
Generally, anticorrosive metallic coatings provide anodic protection from noble
metal coatings (Ni, Cr, Ti, Pb), cathodic protection by sacrificial metal coatings
(Zn, Ca, Mg) or mixed control protective coatings (phosphate, chromate) [7].
Inorganic coatings are usually made of natural minerals, amongst which zinc
silicate was once the most extensively applied. Another significant type of
inorganic coating is the sol-gel coating, which creates solid ZnO, SiO2 or SiO2-
TiO2 barrier inorganic network from liquid organic precursors for corrosion
protection of metals [17].
Typically, organic coatings are utilized to prevent or reduce the contact of
corrosive species with a metal surface [10]. Resins (e.g. Acrylic resins, polyester
resins, amino resins, epoxy resins), waxes, oils and latexes are commonly used
organic coatings for corrosion protection [18]. Organic coatings are rarely used
alone, but in combination with a conversion or anodized coatings [10, 19].
2.2 Aluminium alloy
As the most widely used non-ferrous metal and the most abundant metallic
element in the earth crust, the production and application of aluminium and its
alloys have been increasing since 1950s. While the naturally formed oxide on
pure aluminium provides excellent anticorrosion properties, the key intrinsic
drawback of pure aluminium is its poor mechanical properties such as strength
and ductility, which have greatly limited its applications. The addition of alloying
elements improves the mechanical properties, whilst cost effectively retaining the
core advantages of pure aluminium, such as lightness, thermal and electrical
conductivity [20]. Typical alloying elements include copper, manganese,
magnesium, silicon, iron, zinc and other minor constituents. From a metallurgical
point of view, aluminium alloys are generally classified into two types; wrought
and cast alloys. Wrought alloys are semi-finished products and subsequent work
is required to make end-use products. Cast aluminium alloys are final or near-
23
final products, which are produced by pouring molten alloys into a mould followed
by cooling to give the final shape [21, 22].
2.2.1 Introduction to AA2024
With the very high strength to weight ratio, aluminium alloys are particularly
important structural materials for aerospace industries. Among various
aerospace aluminium alloys, AA2024 is one of the most extensively used due to
its excellent strength to weight ratio and good fatigue resistance. AA2024 is the
best known aluminium alloy in the 2xxx group, whose primary alloying element is
copper. AA2024-T3 is solution heat treated, cold worked and naturally aged to a
substantially stable condition to produce the desired mechanical properties [9]. It
is important to note that the introduction of Cu (up to 5wt%) to the aluminium alloy,
whilst increasing strength, leads to the formation of supersaturated solid solution
particles or Cu-rich intermetallic particles (IMP), which are heterogeneously
distributed throughout the alloy [23].
The most predominant IMP in AA2024 is found to be the S-phase precipitates
(Al2CuMg) with 60% volume out of all the IMPs and 3% of the geometrical surface
area of the alloy [24]. The second largest type of IMP is Al6(Cu, Fe, Mn), which
comprise about 12% volume of all the precipitates. Minor proportions of Al2CuFe,
(Al, Cu)6Mn and Al2Cu are also present in the alloy [25].
2.2.2 Corrosion of AA2024
General corrosion for aluminium is rare and only experienced if the metal is
exposed to highly acidic or alkaline media. Aluminium, although
thermodynamically reactive, is often naturally oxidized in air and water, providing
a thin passive film on the surface. This uniform oxide thin film is effective in
preventing the underlying aluminium from corrosion, and is able to naturally
reform on a freshly abraded surface, in the presence of oxygen. However, when
24
the protective layer is removed or damaged under conditions that the film is not
able to repair, the breakdown usually initiates localized corrosion attack of the
aluminium [26].
Due to the formation of IMPs in the AA2024 alloy matrix, the alloy is much more
susceptible to localized corrosion attack than pure aluminium, especially in
chloride containing aqueous environments. Pitting corrosion and intergranular
corrosion are two major forms of localized corrosion on AA2024 alloy.
Pits are usually formed by two steps including initiation and propagation. The
alloy matrix underneath the passive film is either aluminium or IMPs. When
chloride ions attack passive film and cause breakdown in the area where
aluminium is underneath, the dissolution of aluminium (equation (2-7)) will initiate
pitting corrosion.
Al→Al3++3e- (2-7)
Simultaneously, cathodic reaction of oxygen reduction (in neutral or alkaline
solution) (equation (2-8)) or hydrogen evolution (in acidic solution) (equation (2-
9)) will take place.
O2+2H2O+4e-→4OH- (2-8)
2H++2e-→H2 (2-9)
Following this, the formation of Al3+ will attract Cl- to migrate from the bulk solution
into the pit solution. With the accumulation of Al3+ and Cl- in pits, H+ is produced
through the hydrolysis of Al3+ with the presence of Cl- (equation (2-10)).
Al3++Cl-+H20→H++AlOHCl+ (2-10)
The production of H+ in pits then catalyses the dissolution of Al (equation (2-11)),
leading to further propagation of pitting.
Al+3H++2Cl-→3/2H2+AlCl2+ (2-11)
When chloride ions attack the oxide film and cause breakdown at IMPs on the
alloy surface, the dissolution and dealloying of aluminium and magnesium
(equation (2-7), (2-12)) in the anodic S-phase IMPs (Al2CuMg) will further initiate
the formation of pits and releasing copper ions into solution [24, 27].
25
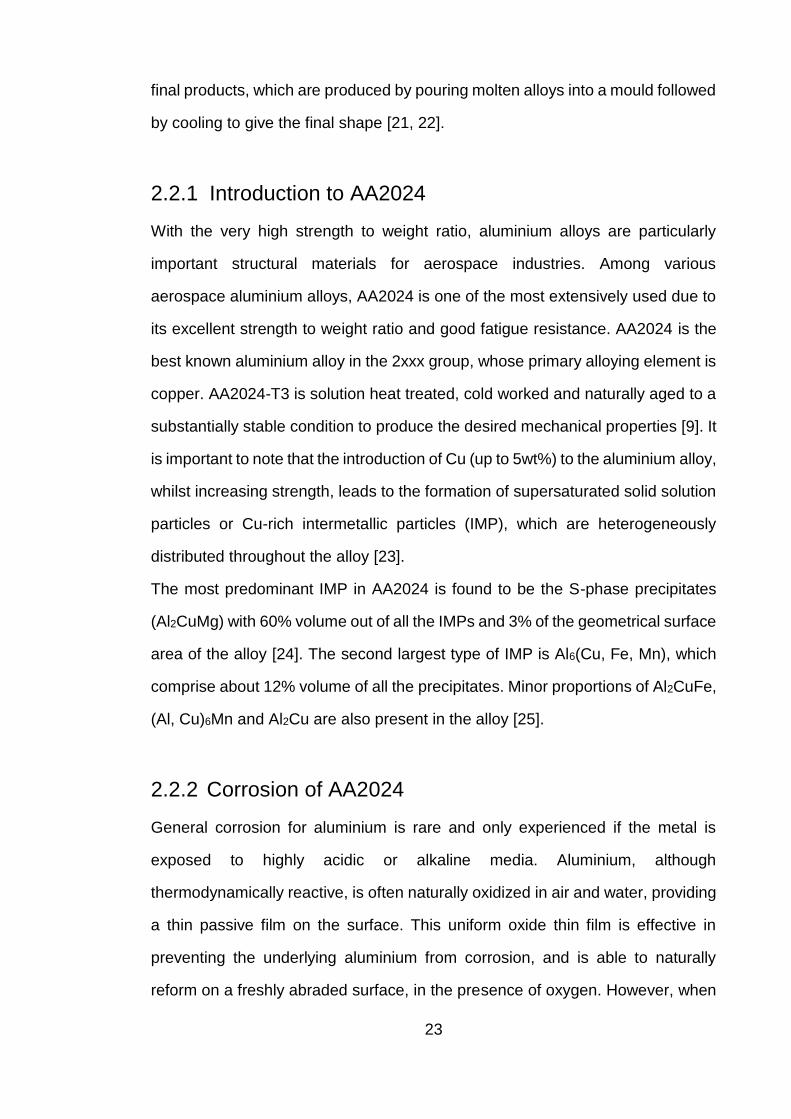
Mg→Mg2++2e- (2-12)
Simultaneously, a thin copper layer then redeposit on the surface and acts as a
cathode supporting the cathodic reaction (equation (2-8), (2-9)) and coupling with
surrounding aluminium pits to further propagate it [25, 27-29]. Schematic of
localized pitting corrosion of AA2024 is shown in Fig 2.1.
Fig 2.1 Schematic of localized pitting corrosion of AA2024 [30].
It is widely accepted that other second phase particles, mainly Al6(Cu, Fe, Mn),
Al2CuFe, (Al, Cu)6Mn and Al2Cu, with nobler elements, act as cathodic sites
relative to the matrix, rather than a transformation of Al2CuMg from anode to
cathode, during immersion in chloride-containing electrolyte [23, 31, 32].
Since both pitting and intergranular corrosion stems from the local breakdown of
the passive film on the surface, they seem to be similar in nature from an
electrochemical point of view. However, pitting generally suffer from attack of
IMPs or the grain in the alloy matrix, where intergranular corrosion is a result of
attack at grain boundaries. Moreover, intergranular corrosion is regarded as a
26
special kind of pitting corrosion, when pits grow into the microstructure and
develop into intergranular corrosion [33].
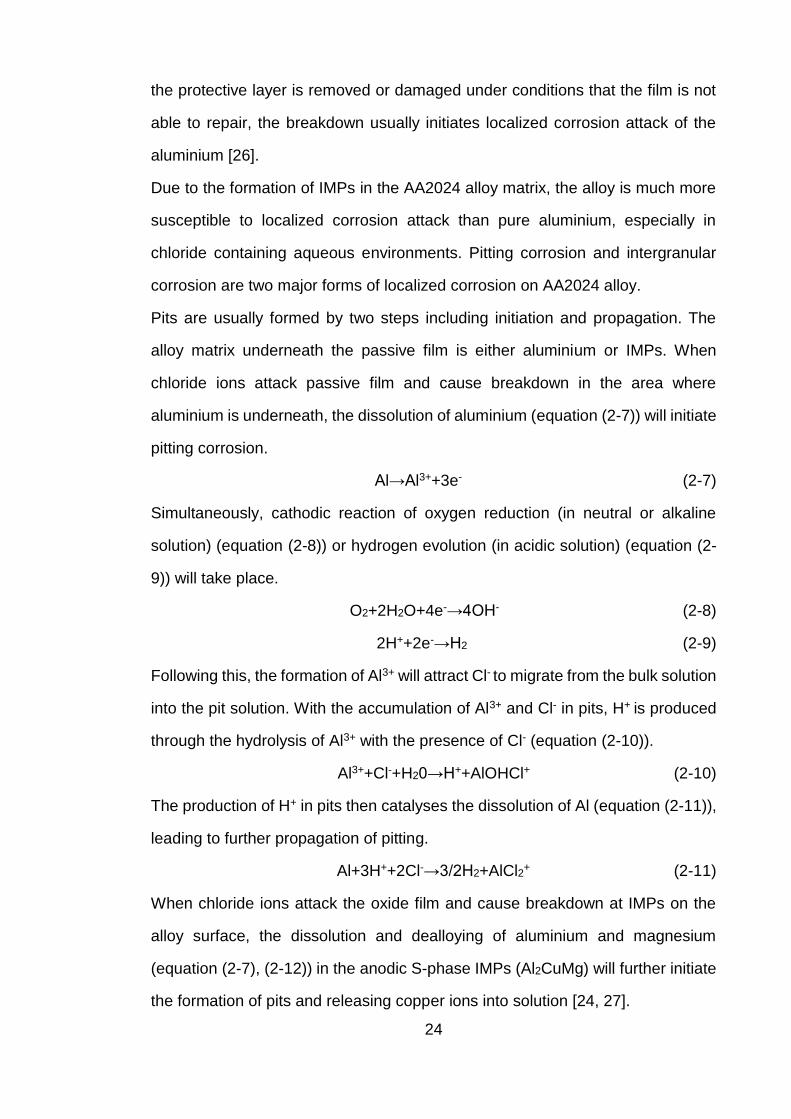
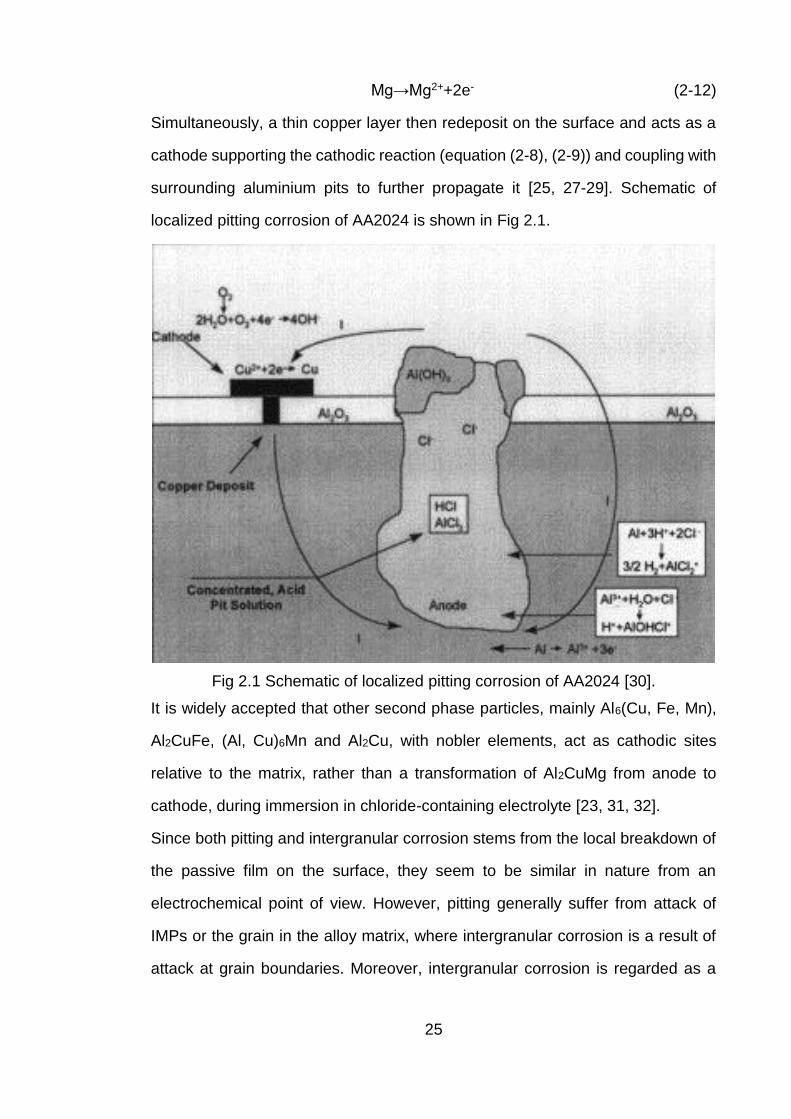
2.2.3 Corrosion protection of AA2024
As one of the most widely used aerospace alloys, the corrosion protection system
of AA2024-T3 typically comprises of three individual layers when applied to
aircraft structures (Fig 2.2) [30]. The first layer on the substrate is a thin (<10-
60nm) inorganic conversion pre-treatment layer, which mainly provides
enhanced adhesion between the substrate and the second layer of primer but
also corrosion protection. The primer is mainly for corrosion protection function
and made up of a pigmented organic resin matrix, which is relatively thick vary
from 5 to 200µm. Finally, a top coat is applied as the third layer, whose principal
function is to offer a barrier against environmental influence such as extreme
climates and ultra-violet rays. Moreover, the topcoat is also used for decoration
or camouflage of aircrafts.
Fig 2.2 Schematic presentation of components that make up an aircraft coating
system [30].
Since the advent of chromate inhibitor in the late 1970s, it has proved to be the
most effective method for corrosion protection of aluminium alloys in pre-
treatment layer and primer. However, due to its carcinogenic effects on humans
and adverse effects on the environment, the application of chromium (VI)
containing compounds has been gradually restricted by many countries.
27
To develop effective alternatives to chromate inhibitors, great efforts have been
spent in the last decades. Promising alternatives could be generally classified
into four types, including chromate replacement inhibitors, barrier coatings,
conducting polymers and surface modification.
Numerous active inhibitors have found to be promising as chromate replacement
inhibitors, such as rare-earth compounds [25], phosphates [34], organic inhibitors
[35] or a combination of these [36]. With regards to barrier coatings; plasma
deposition [37, 38], sol-gel coatings [39-41], self-priming topcoats [42] and
electrodeposited coatings [43, 44] have been shown to be successful to a greater
or lesser degree. Two major types of conducting polymers have been applied for
the corrosion protection of AA2024 [45], i.e. polyaniline [46] and polypyrrole [47].
Differing from inhibitors, coatings and conducting polymers, surface modification
creates a conversion layer on an aluminium surface by electrochemical
anodization [48] or laser ablation [49] to improve adhesion or optimize the second
phase particles on the surface.
It is also vital to note that more studies have been focused on a binary or ternary
system from these alternatives. Wang & Akid, have reported a series of
successful systems for corrosion protection of AA2024 alloy, including cerium
nitrate inhibitors containing hybrid sol-gel system [39] and hybrid polyaniline/sol-
gel coatings. Various nanostructured hybrid sol-gel coatings with organic and
inorganic inhibitors have also been reported to provide active protection for
AA2024 by Ferreira et al [50, 51]. Other studies on modified sol-gel coatings have
also been reported by Thompson [52, 53] and Donley [54, 55].
Moreover, the majority of modified sol-gel coatings reported are not only
anticorrosive and environmentally friendly but also offer self-repair functionality,
which make the modified hybrid sol-gel coatings a promising candidate for the
alternative to chromate-based inhibitors. The aim of this study also stems from
the advantages of these newly developed hybrid sol-gel systems.
28
2.3 Sol-gel technology
The sol-gel process, which is initially employed in the preparation of inorganic
materials such as glasses and ceramics, is a chemical synthesis method mainly
based on inorganic polymerization reactions [56, 57]. More specifically, the sol-
gel process is defined as the preparation of a sol, gelation of the sol, and removal
of the solvent [58]. The sol-gel history dates back to the mid-1800s from Ebelman
and Graham’s discoveries [59] on the formation of “glass-like” SiO2 material from
the hydrolysis of tetraethylorthosilicate (TEOS). However, little attention was paid
at that time until a breakthrough was made by Roy and co-workers in 1950s. They
synthesised many novel ceramic oxides using sol-gel process rather than
traditional ceramic power methods [60]. It was after this breakthrough that the
sol-gel process attracted a lot of attention from both the industry and academia.
In the middle 1980s, hybrid organic/inorganic sol-gel materials were proposed
and synthesised by Wilkes and Schmidt et al., which they termed as “ormosils”
or “ceramer” [56]. Since then, sol-gel technology was extensively applied to
prepare novel materials and further investigated in the field of ceramics, polymer
chemistry, inorganic and organic chemistry and physics [61].
2.3.1 Introduction to sol-gel process
The sol-gel process, as the name implies, involves the terms of sol and gel. A sol
is a stable suspension of colloidal solid particles within a liquid. A gel is a porous
3-D interconnected solid network that expands in a stable manner throughout a
liquid medium and is only limited by the size of the container. The process here
refers to gelation, during which a sol can be converted to a colloidal or polymeric
gel by going through a gel-point [58, 62].
In a typical sol-gel process [63, 64], presented in Fig 2.3 (b), the first step is the
formation of homogeneous solution of the precursor in a solvent. Then hydrolysis
and polymerization will initiate the production of sol species, such as oligomers,
29
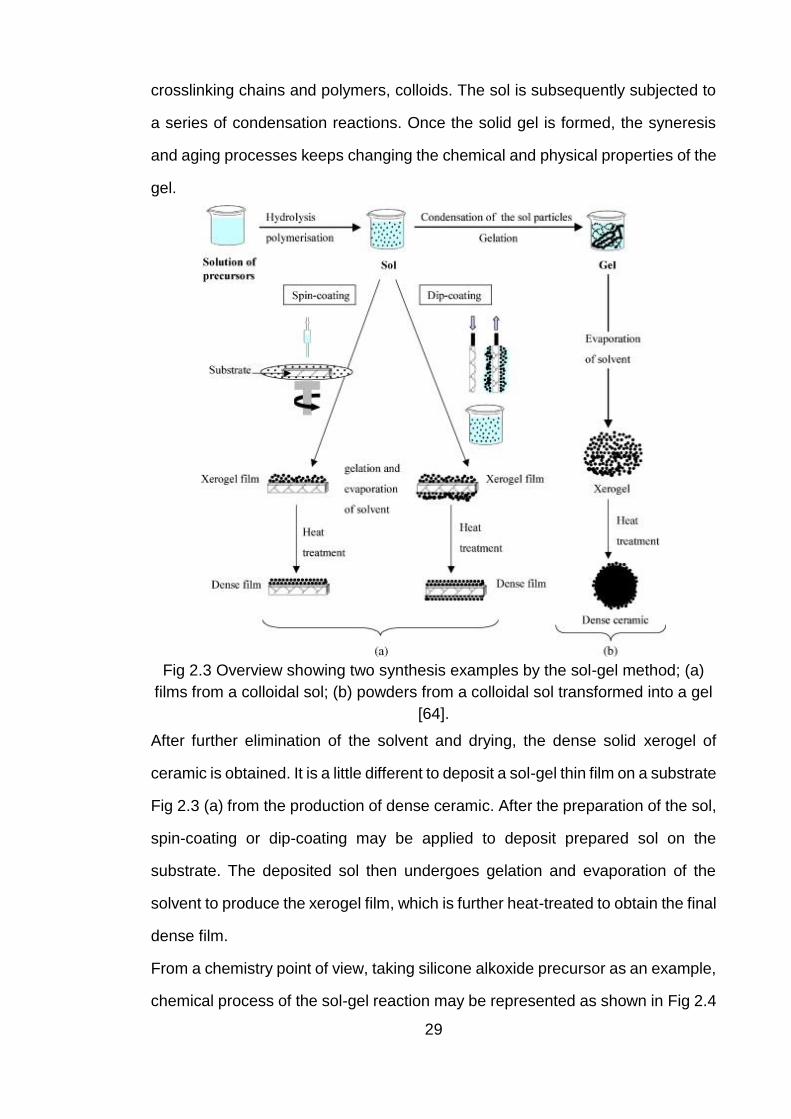
crosslinking chains and polymers, colloids. The sol is subsequently subjected to
a series of condensation reactions. Once the solid gel is formed, the syneresis
and aging processes keeps changing the chemical and physical properties of the
gel.
Fig 2.3 Overview showing two synthesis examples by the sol-gel method; (a)
films from a colloidal sol; (b) powders from a colloidal sol transformed into a gel
[64].
After further elimination of the solvent and drying, the dense solid xerogel of
ceramic is obtained. It is a little different to deposit a sol-gel thin film on a substrate
Fig 2.3 (a) from the production of dense ceramic. After the preparation of the sol,
spin-coating or dip-coating may be applied to deposit prepared sol on the
substrate. The deposited sol then undergoes gelation and evaporation of the
solvent to produce the xerogel film, which is further heat-treated to obtain the final
dense film.
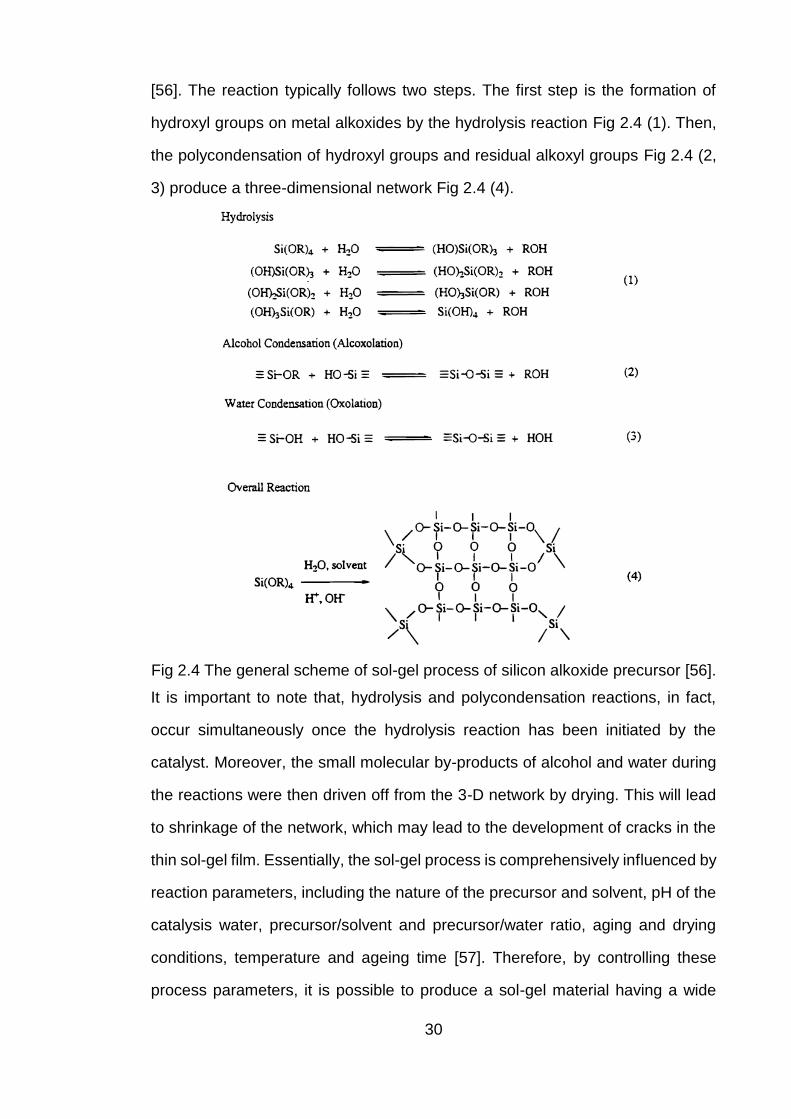
From a chemistry point of view, taking silicone alkoxide precursor as an example,
chemical process of the sol-gel reaction may be represented as shown in Fig 2.4
30
[56]. The reaction typically follows two steps. The first step is the formation of
hydroxyl groups on metal alkoxides by the hydrolysis reaction Fig 2.4 (1). Then,
the polycondensation of hydroxyl groups and residual alkoxyl groups Fig 2.4 (2,
3) produce a three-dimensional network Fig 2.4 (4).
Fig 2.4 The general scheme of sol-gel process of silicon alkoxide precursor [56].
It is important to note that, hydrolysis and polycondensation reactions, in fact,
occur simultaneously once the hydrolysis reaction has been initiated by the
catalyst. Moreover, the small molecular by-products of alcohol and water during
the reactions were then driven off from the 3-D network by drying. This will lead
to shrinkage of the network, which may lead to the development of cracks in the
thin sol-gel film. Essentially, the sol-gel process is comprehensively influenced by
reaction parameters, including the nature of the precursor and solvent, pH of the
catalysis water, precursor/solvent and precursor/water ratio, aging and drying
conditions, temperature and ageing time [57]. Therefore, by controlling these
process parameters, it is possible to produce a sol-gel material having a wide
31
range of functional properties. To date, sol-gel materials have provided
successful solutions for many areas such as controlled release, inks and coatings,
catalyst for fine chemicals production, nanocomposites, ceramic membranes, etc
[65].
The fundamental advantage of the sol-gel technique is that it not only allows for
the production of inorganic structures, but also the production of novel hybrid
organic-inorganic material which does not naturally exist. It is also advantageous
in producing excellent adhesion between the metallic substrate and the top coat
as an intermediate bond-coating. Moreover, it is superior in preparing high purity
products and materials with complex geometries. The relatively low temperature
required and simple process makes this technology cost-effective for industries.
However, the sol-gel materials also have some drawbacks limiting its applications,
including poor wear-resistance, thickness limitation, substrate-dependent,
shrinkage cracking and sensitivity to manufacturing conditions [62, 66].
2.3.2 Sol-gel coatings for corrosion protection
As described before, sol-gel condense thin films are able to provide excellent
adhesion between the metallic substrate and the top coat, which act as an
intermediate bonding-coating and hydrophobic barrier layer to water and vapour
permeation as schematic illustrated in Fig 2.5.
Fig 2.5 Schematic representation of enhanced compatibility of different paint
systems with an epoxy-functional hybrid sol-gel coating [67].
32
The research of sol-gel coatings as substrate pre-treatment for corrosion
protection of metals has expanded in the past decades. Various metallic
substrates, including steel [68], aluminium [39], magnesium [69] and copper [70],
have been effectively protected from corrosion using sol-gel coatings. Many oxide
systems have been developed besides the most frequently used SiO2 [61, 67,
71-73], such as ZrO2 [74], Al2O3 [75], TiO2 [76], and combined oxides [77-79].
However, there are some drawbacks of the pure metal oxide coatings. Firstly,
crack free thick films (>1μm) are difficult to achieve as they are brittle. Moreover,
relatively high temperature (400-800℃) is required to achieve good properties
[61].
Hybrid organic/inorganic sol-gel coatings were then developed to overcome the
difficulties faced by pure inorganic oxide films. The introduction of organic
components allows increased density, flexibility of the film and functional
compatibility with organic paints, while retaining the advantages of scratch
resistance, durability and adhesion, which are provided by inorganic components
in the hybrid sol-gel coatings. With hybrid sol-gel, it is also possible to prepare
thick crack-free coatings at low temperature [67, 80].
In the last decade, a great number of studies have been conducted on metallic
corrosion protection by hybrid sol-gel coatings. Among these studies, the pursuit
of hybrid sol-gel coatings as an alternative to chromate conversion coatings for
corrosion protection of aluminium alloys have attracted a lot of attention.
2.3.3 Titania-containing hybrid inorganic/organic sol-gel
coating
The standard titania-containing hybrid sol-gel applied in this study follows from
the initial work of Ferreira et al. in 2006 and 2007 [79, 81, 82]. The nanostructured
hybrid sol-gel system is based mainly on the hydrolysis and condensation of 3-
glycidoxypropyltrimethoxysilane (GPTMS) and the in-situ synthesised titania
33
nanoparticles from the precursor of titanium isopropoxide (TIP). Their results
showed that the hybrid sol-gel coating exhibits both good anticorrosive
performance and excellent adhesion between the metallic substrate and the top
paint.
Moreover, their work was further studied by Jiménez-Morales et al [83, 84]. They
discovered that the molar ratio of Si/Ti has a great influence on the performance
of the coating. Among the three different molar ratio studied, Si/Ti=4 has proven
to be the optimal formulation with the best anticorrosive performance for an
aluminium alloy. Compared with Si/Ti=2 and Si/Ti=8, the Si/Ti=4 sol-gel coating
not only has the highest initial contact angle, most hydrophobic coating surface,
but also it retains its hydrophobic properties, due to the lowest water uptake in
the coating. The adhesion between the Si/Ti=4 sol-gel coatings and the metal
substrate is also the strongest among the three ratios. EIS results and coating
morphology after immersion in 3.5wt% NaCl solution indicate that the optimal sol-
gel coating could better protect the aluminium substrate. Moreover, the best
anticorrosive coating also has better mechanical properties such as hardness.
An explanation for the reason why the Si/Ti=4 ratio is better was attributed to the
pore blocking effect from the titania nanoparticles in the polymeric network. For
Si/Ti=8 sol-gel coatings, the ratio of titania nanoparticles is relative low and lead
to a porous thin film. For Si/Ti=2 sol-gel coating, titania nanoparticles in the
coating is excessive and too high for the polymeric network. Although the sol-gel
coating prepared from this formulation is dense, the pore blocking by titania
nanoparticles is uniform, leading to excessive blocking in some areas, where
other areas remain porous. However, the corrosion protection performance of the
Si/Ti=2 sol-gel coating is somewhat similar to that of the Si/Ti=4 sol-gel coating
than the porous one of Si/Ti=8.
34
2.4 Conducting polymers
2.4.1 Introduction to conducting polymers
Materials can be classified into four types according to electrical properties,
including insulator, semiconductor, conductor and superconductor. Insulators
have the lowest conductivity of less than 10-7 S/cm and the conductivity of a metal
is usually higher than 103 S/cm. Generally, a material with a conductivity between
10-7 S/cm and 103 S/cm is regarded as semiconductor.
Semiconductor can be divided into two types; namely inorganic semiconductor
and organic semiconductor. The small energy gap for the movement of electrons
within semiconductors from valence band to the higher energy of conduction
band is the key to the conductivity of semiconductors. Differences of energy gap
in insulator, semiconductor and conductor are presented in Fig 2.6.
Fig 2.6 Representation of energy bands in insulator, semiconductor and
conductor [85]
Polymers have long been considered to be insulators due to the large energy gap
between the two bands. However, the discovery of conductive iodine doped
polyacetylene (PA) opened a new field of conducting polymers [86]. The break-
through was mainly made by three leading scientists, Heeger, MacDiarmid and
Shirakawa in 1977 and their creative work was later awarded the Chemistry
Nobel Prize in 2000. Completely different from the traditional conducting
polymers, which were produced by merely physically mixing conducting materials
of metals or carbon powders with nonconductive polymers, the novel conducting
35
polymers they developed are more specifically termed as “intrinsically conducting
polymers” (ICPs) or “synthetic metal” [87]. While retaining the mechanical
properties, easy processing and other properties of a conventional polymer, ICPs
can also possess electrical, electronic, magnetic and optical properties of metals.
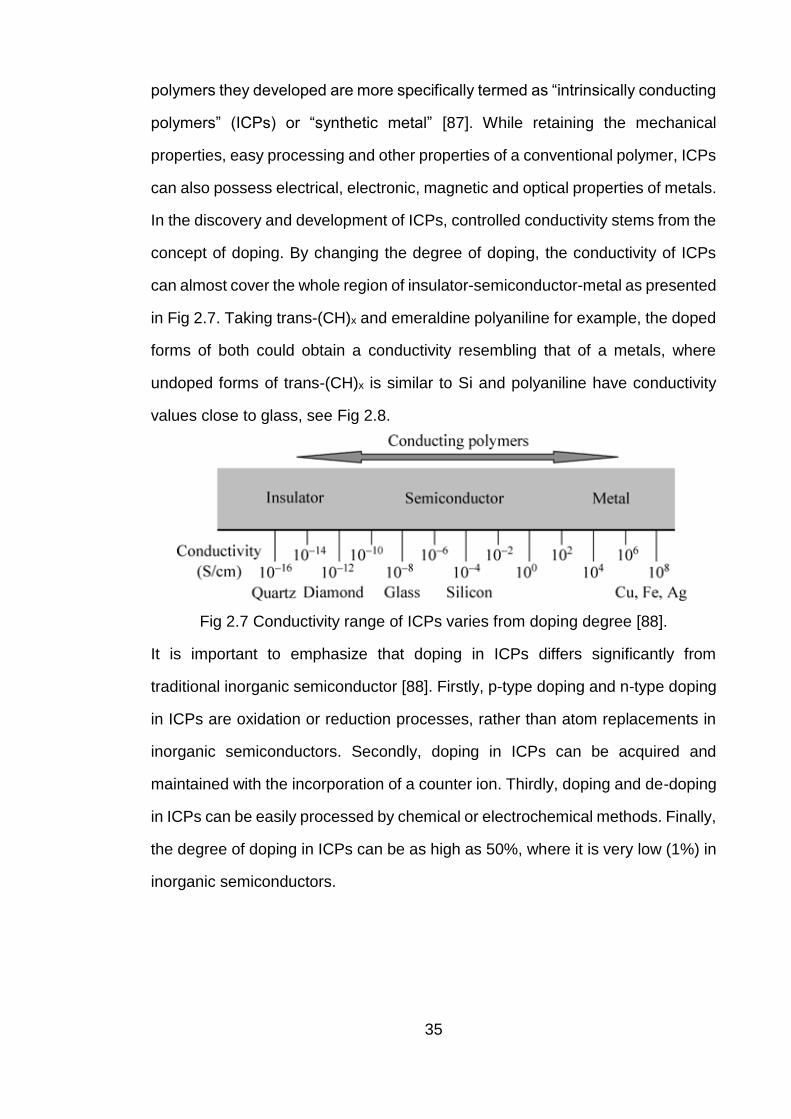
In the discovery and development of ICPs, controlled conductivity stems from the
concept of doping. By changing the degree of doping, the conductivity of ICPs
can almost cover the whole region of insulator-semiconductor-metal as presented
in Fig 2.7. Taking trans-(CH)x and emeraldine polyaniline for example, the doped
forms of both could obtain a conductivity resembling that of a metals, where
undoped forms of trans-(CH)x is similar to Si and polyaniline have conductivity
values close to glass, see Fig 2.8.
Fig 2.7 Conductivity range of ICPs varies from doping degree [88].
It is important to emphasize that doping in ICPs differs significantly from
traditional inorganic semiconductor [88]. Firstly, p-type doping and n-type doping
in ICPs are oxidation or reduction processes, rather than atom replacements in
inorganic semiconductors. Secondly, doping in ICPs can be acquired and
maintained with the incorporation of a counter ion. Thirdly, doping and de-doping
in ICPs can be easily processed by chemical or electrochemical methods. Finally,
the degree of doping in ICPs can be as high as 50%, where it is very low (1%) in
inorganic semiconductors.

36
Fig 2.8 Conductivity of doped and undoped trans-(CH)x and emeraldine
polyaniline [89].
2.4.2 Introduction to polyaniline
Since the breakthrough on ICPs made by MacDiarmid et al in 1977, a great
amount of ICPs have been discovered, synthesised and applied. The molecular
structures of typical ICPs are presented in Fig 2.9. It is evident that π-conjugated
chains on the polymer backbone is a shared feature in ICPs.
Fig 2.9 Molecular structure of typical ICPs.
(a) trans-polyacetylene (PA); (b) polythiophenes (PPy); (c) poly(p-phenylene)
(PTH); (d) polypyrrole (PPP); (e) poly(p-phenylenevinylene) (PPV); (f) poly(2, 5-
thienylenevinylene) (PANI) [90].
37
Among the various ICPs, polyaniline (PANI) is one of the most promising, due to
the advantages of easy synthesis, low cost of raw materials, environmental
stability and controllable physical properties via different oxidation and proton
doping states. Moreover, PANI has many potential application in the area of
energy transformers, optical information storage, non-linear optics, membranes,
corrosion protection etc.
Although, polyaniline was first electrochemically synthesised in 1862 [91], which
is now recognized as “aniline black”, the electrical properties indicating the nature
of ICPs was not studied at that time. It was for the first time in 1985 [92] that
MacDiarmid synthesised the green power of PANI with a conductivity of 3S/cm
via chemical oxidation of aniline monomer by ammonium peroxydisulphate (APS)
in acid aqueous solution. The protonic doping enabled the emeraldine oxidation
state of PANI convert from undoped “insulator” of emeraldine base (EB) form
(σ~10-10S/cm) to a doped “metal” of emeraldine salt (ES) form (σ~5S/cm) of
emeraldine hydrochloride by treatment with 1M aqueous HCl solution [93, 94].
The widely accepted chemical structure of PANI was proposed by MacDiamid in
1987 [93]. He suggested a model of PANI composed of both the reduced repeat
units of and oxidized repeat units of .
The general formula for a series of PANI in the base form is
In this formula, y is the oxidation-reduction degree in PANI and 0<y<1. When y=0,
PANI is in fully oxidized state of pernigraniline base (PNB). The fully reduced
state of leucoemeraldine base (LB) corresponds to a value of y=1. The half
oxidized or half reduced state of emeraldine base (EB) has a value of y=0.5. PNB,
LB and EB are three oxidation states of PANI and their relationship is explained
in Fig 2.10. In the form of EB, PANI could turn to electrically conducting from of
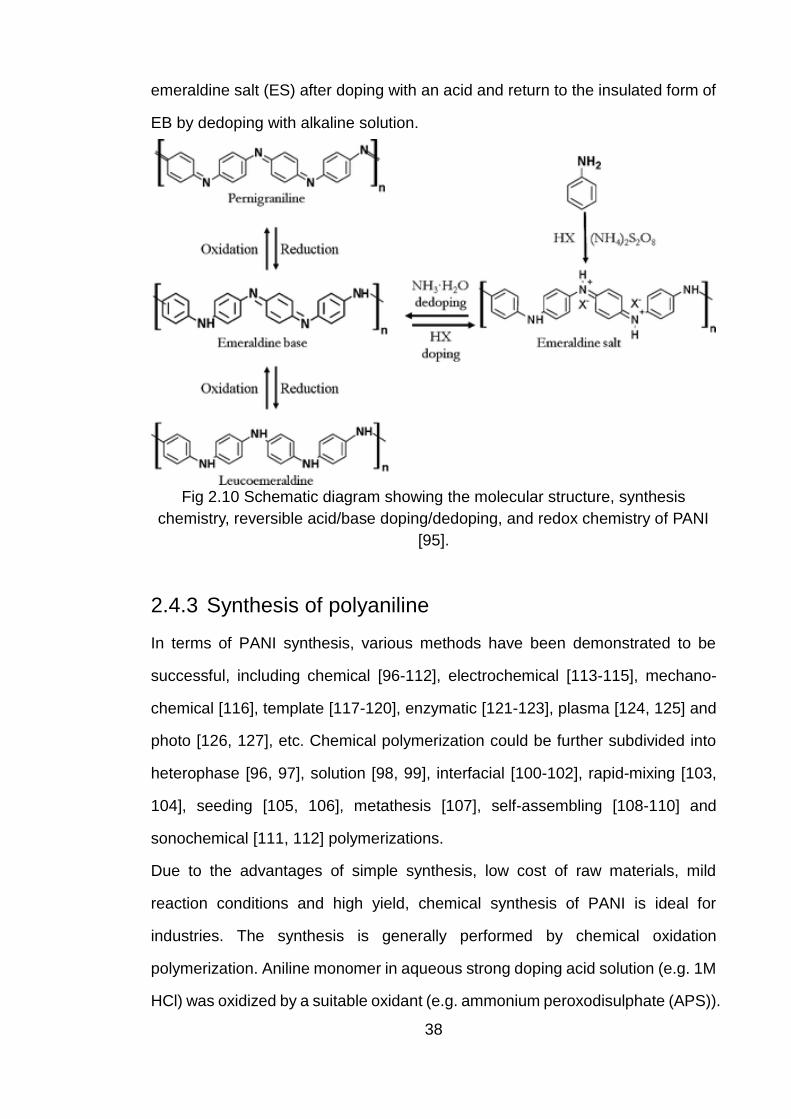
38
emeraldine salt (ES) after doping with an acid and return to the insulated form of
EB by dedoping with alkaline solution.
Fig 2.10 Schematic diagram showing the molecular structure, synthesis
chemistry, reversible acid/base doping/dedoping, and redox chemistry of PANI
[95].
2.4.3 Synthesis of polyaniline
In terms of PANI synthesis, various methods have been demonstrated to be
successful, including chemical [96-112], electrochemical [113-115], mechano-
chemical [116], template [117-120], enzymatic [121-123], plasma [124, 125] and
photo [126, 127], etc. Chemical polymerization could be further subdivided into
heterophase [96, 97], solution [98, 99], interfacial [100-102], rapid-mixing [103,
104], seeding [105, 106], metathesis [107], self-assembling [108-110] and
sonochemical [111, 112] polymerizations.
Due to the advantages of simple synthesis, low cost of raw materials, mild
reaction conditions and high yield, chemical synthesis of PANI is ideal for
industries. The synthesis is generally performed by chemical oxidation
polymerization. Aniline monomer in aqueous strong doping acid solution (e.g. 1M
HCl) was oxidized by a suitable oxidant (e.g. ammonium peroxodisulphate (APS)).
39
The reaction is mainly influenced by the concentration of monomer, type and
concentration of both the oxidant and doping acid, temperature and reaction time,
along with other solution treatment methods. Among all these factors, the oxidant
and doping acid are the most important and widely investigated by researchers.
There is a wide range of oxidants available and demonstrated to be successful in
the chemical synthesis of PANI [128]. APS and Fe(Ⅲ) compounds are the two
vital and most frequently used oxidizers. Various other oxidants were also
developed, including transition metal compounds (Mn(Ⅲ), Mn(Ⅳ), Mn(Ⅶ), Cr(Ⅵ),
Ce(Ⅳ), V(Ⅴ), Cu(Ⅱ)), noble metal compounds (Au(Ⅲ), Pt(Ⅳ), Pd(Ⅱ), Ag(Ⅰ))
and KIO3, H2O2, benzoyl peroxide or mixtures of oxidants (e.g. FeCl3/H2O2 and
KIO3/NaClO). Doping acid also has abundant choices from traditional mineral
acid (hydrochloric, sulphuric, nitric, perchloric or phosphoric, etc.) and organic
acid (formic, acetic, camphorsulphonic, methylsulphonic, 4-toluene-sulphonic,
ethylsulphonic, tartaric, etc.).
Due to the oxidising power and high yield of APS, it is regarded as an optimal
oxidant for the chemical synthesis of PANI. Taking APS as the oxidant, chemical
polymerization synthesis reaction of PANI ES is briefly given in Fig 2.11 [129].
The final product of chemical oxidation of aniline by APS in strong acidic medium
is PANI in green doped emeraldine salt form and by-products of sulphuric acid
and ammonium sulphate. It is clear that the final products are produced after the
formation of an intermediate of blue protonated PNB. Although, the process for
the formation of PANI ES is complicated and various mechanisms were proposed,
the formation of fully oxidized blue PNB intermediate is widely accepted.
Moreover, the stoichiometric monomer/oxidant ratio, obvious from the reaction,
is 0.8, which was found in 1996 by Stejskal et al [130].
However, it does not need to exactly follow this ratio when using APS to prepare
PANI. Some synthesis of different PANI nanostructures may require special ratio
or oxidant to achieve the goal. In Fig 2.12, some very interesting PANI
nanostructures were synthesized using various oxidants, ratios and conditions.

40
Fig 2.11 Overall reaction of chemical oxidation synthesis of PANI ES [129].
Fig 2.12 Synthesis of different nanostructured PANI from various synthetic
conditions [131].
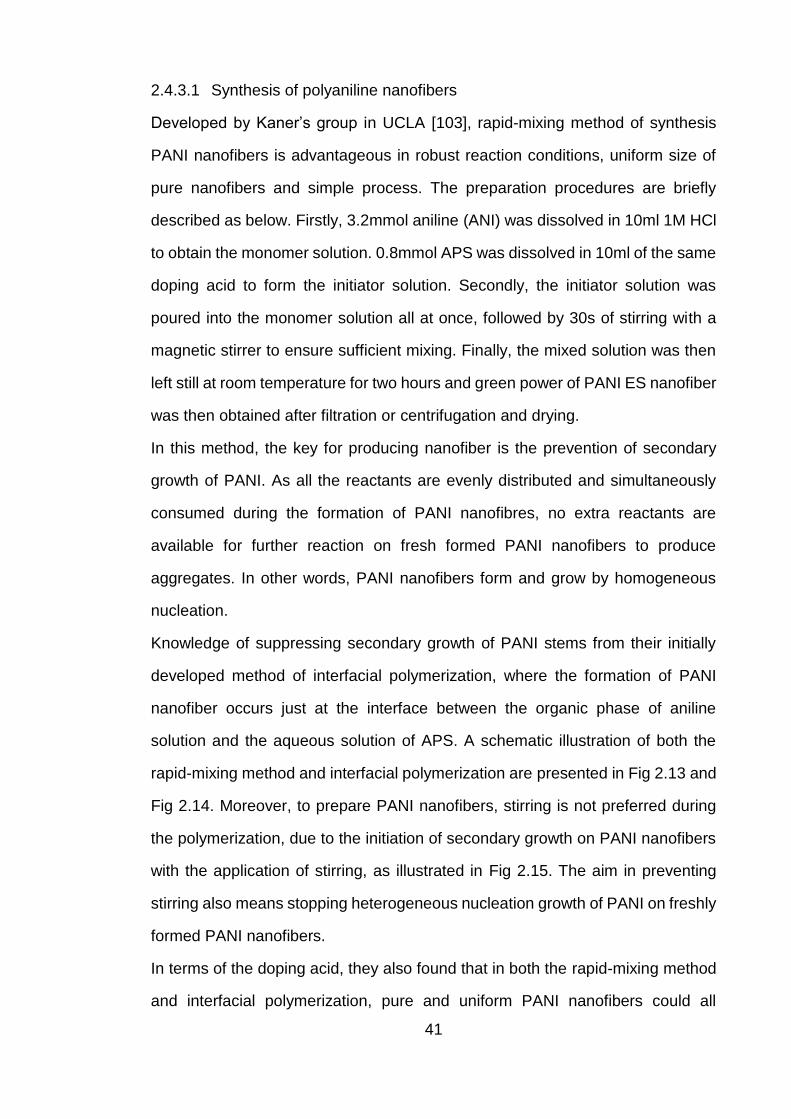
41
2.4.3.1 Synthesis of polyaniline nanofibers
Developed by Kaner’s group in UCLA [103], rapid-mixing method of synthesis
PANI nanofibers is advantageous in robust reaction conditions, uniform size of
pure nanofibers and simple process. The preparation procedures are briefly
described as below. Firstly, 3.2mmol aniline (ANI) was dissolved in 10ml 1M HCl
to obtain the monomer solution. 0.8mmol APS was dissolved in 10ml of the same
doping acid to form the initiator solution. Secondly, the initiator solution was
poured into the monomer solution all at once, followed by 30s of stirring with a
magnetic stirrer to ensure sufficient mixing. Finally, the mixed solution was then
left still at room temperature for two hours and green power of PANI ES nanofiber
was then obtained after filtration or centrifugation and drying.
In this method, the key for producing nanofiber is the prevention of secondary
growth of PANI. As all the reactants are evenly distributed and simultaneously
consumed during the formation of PANI nanofibres, no extra reactants are
available for further reaction on fresh formed PANI nanofibers to produce
aggregates. In other words, PANI nanofibers form and grow by homogeneous
nucleation.
Knowledge of suppressing secondary growth of PANI stems from their initially
developed method of interfacial polymerization, where the formation of PANI
nanofiber occurs just at the interface between the organic phase of aniline
solution and the aqueous solution of APS. A schematic illustration of both the
rapid-mixing method and interfacial polymerization are presented in Fig 2.13 and
Fig 2.14. Moreover, to prepare PANI nanofibers, stirring is not preferred during
the polymerization, due to the initiation of secondary growth on PANI nanofibers
with the application of stirring, as illustrated in Fig 2.15. The aim in preventing
stirring also means stopping heterogeneous nucleation growth of PANI on freshly
formed PANI nanofibers.
In terms of the doping acid, they also found that in both the rapid-mixing method
and interfacial polymerization, pure and uniform PANI nanofibers could all
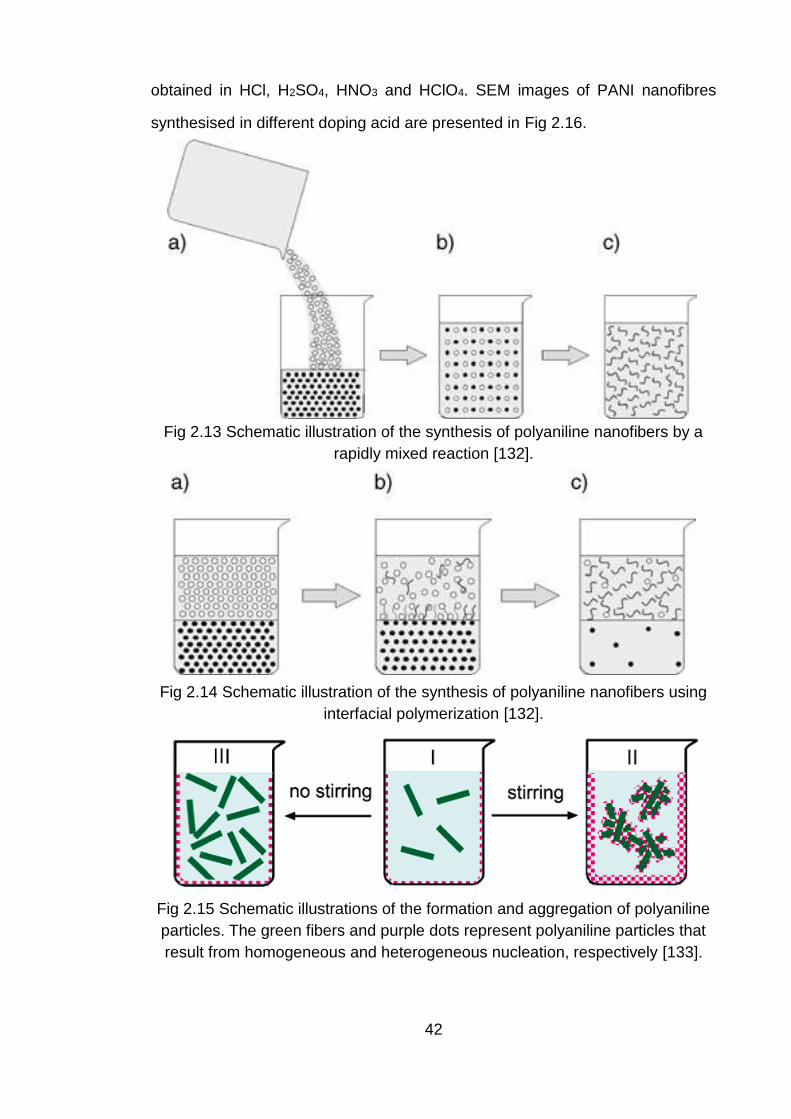
42
obtained in HCl, H2SO4, HNO3 and HClO4. SEM images of PANI nanofibres
synthesised in different doping acid are presented in Fig 2.16.
Fig 2.13 Schematic illustration of the synthesis of polyaniline nanofibers by a
rapidly mixed reaction [132].
Fig 2.14 Schematic illustration of the synthesis of polyaniline nanofibers using
interfacial polymerization [132].
Fig 2.15 Schematic illustrations of the formation and aggregation of polyaniline
particles. The green fibers and purple dots represent polyaniline particles that
result from homogeneous and heterogeneous nucleation, respectively [133].
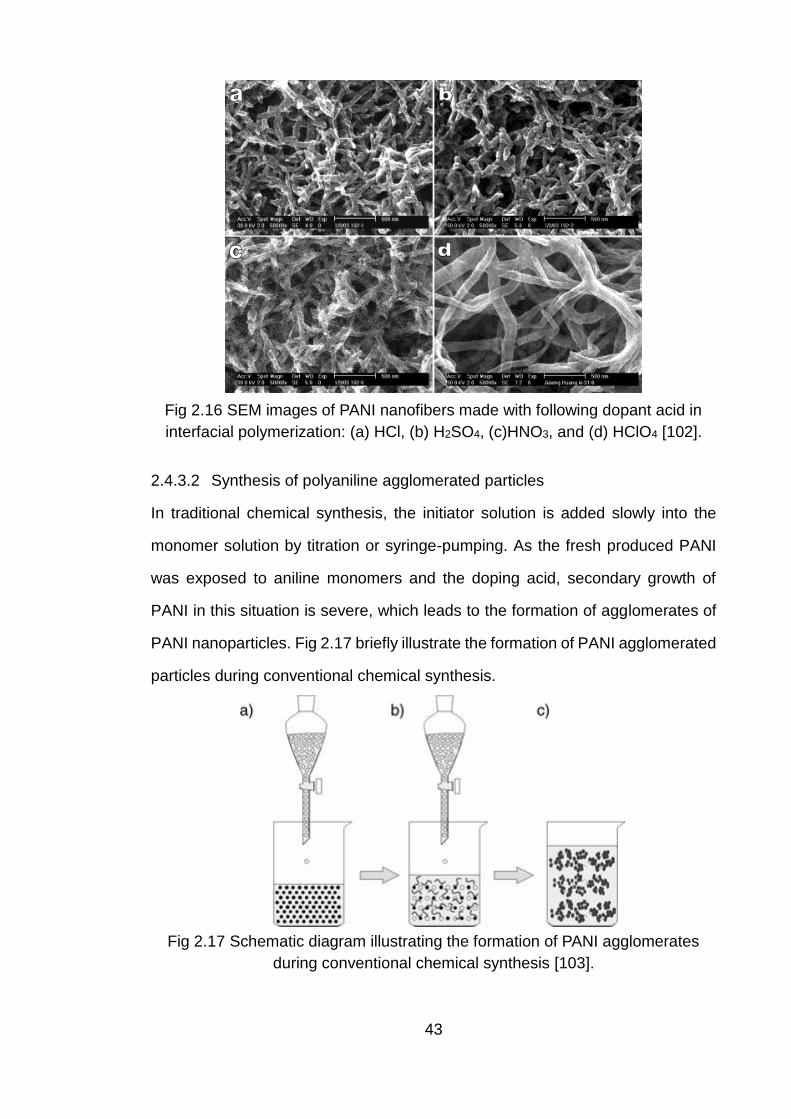
43
Fig 2.16 SEM images of PANI nanofibers made with following dopant acid in
interfacial polymerization: (a) HCl, (b) H2SO4, (c)HNO3, and (d) HClO4 [102].
2.4.3.2 Synthesis of polyaniline agglomerated particles
In traditional chemical synthesis, the initiator solution is added slowly into the
monomer solution by titration or syringe-pumping. As the fresh produced PANI
was exposed to aniline monomers and the doping acid, secondary growth of
PANI in this situation is severe, which leads to the formation of agglomerates of
PANI nanoparticles. Fig 2.17 briefly illustrate the formation of PANI agglomerated
particles during conventional chemical synthesis.
Fig 2.17 Schematic diagram illustrating the formation of PANI agglomerates
during conventional chemical synthesis [103].
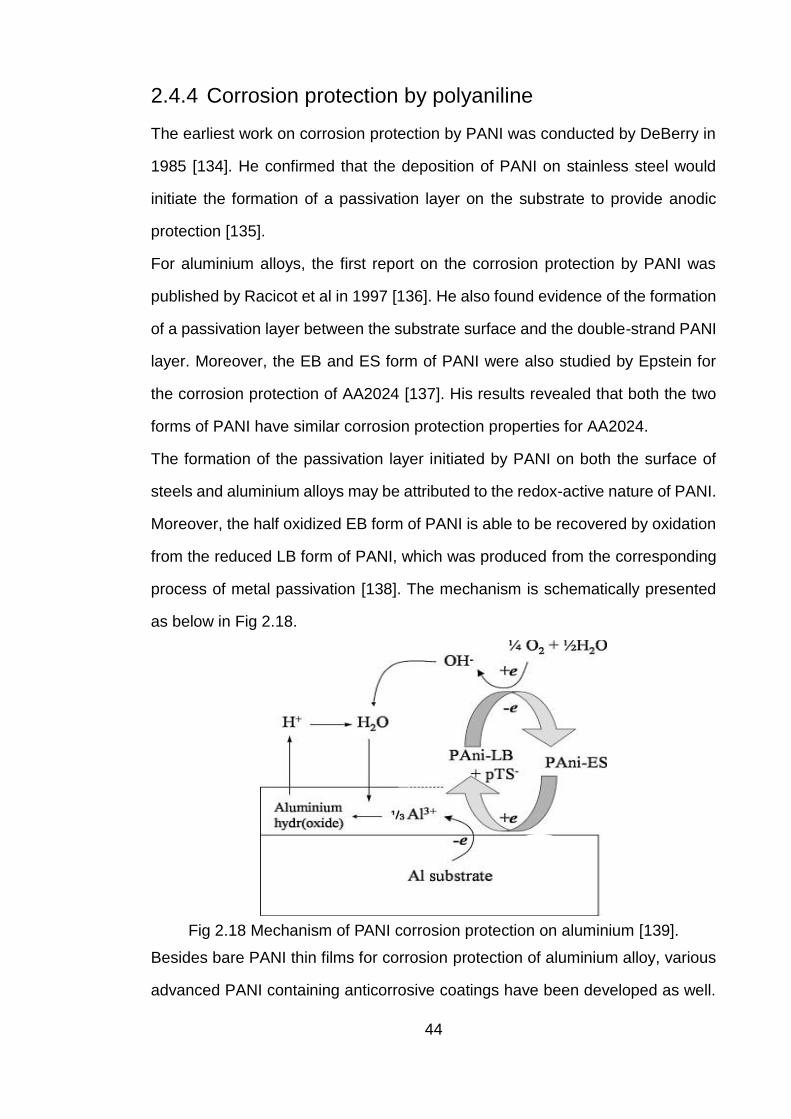
44
2.4.4 Corrosion protection by polyaniline
The earliest work on corrosion protection by PANI was conducted by DeBerry in
1985 [134]. He confirmed that the deposition of PANI on stainless steel would
initiate the formation of a passivation layer on the substrate to provide anodic
protection [135].
For aluminium alloys, the first report on the corrosion protection by PANI was
published by Racicot et al in 1997 [136]. He also found evidence of the formation
of a passivation layer between the substrate surface and the double-strand PANI
layer. Moreover, the EB and ES form of PANI were also studied by Epstein for
the corrosion protection of AA2024 [137]. His results revealed that both the two
forms of PANI have similar corrosion protection properties for AA2024.
The formation of the passivation layer initiated by PANI on both the surface of
steels and aluminium alloys may be attributed to the redox-active nature of PANI.
Moreover, the half oxidized EB form of PANI is able to be recovered by oxidation
from the reduced LB form of PANI, which was produced from the corresponding
process of metal passivation [138]. The mechanism is schematically presented
as below in Fig 2.18.
Fig 2.18 Mechanism of PANI corrosion protection on aluminium [139].
Besides bare PANI thin films for corrosion protection of aluminium alloy, various
advanced PANI containing anticorrosive coatings have been developed as well.
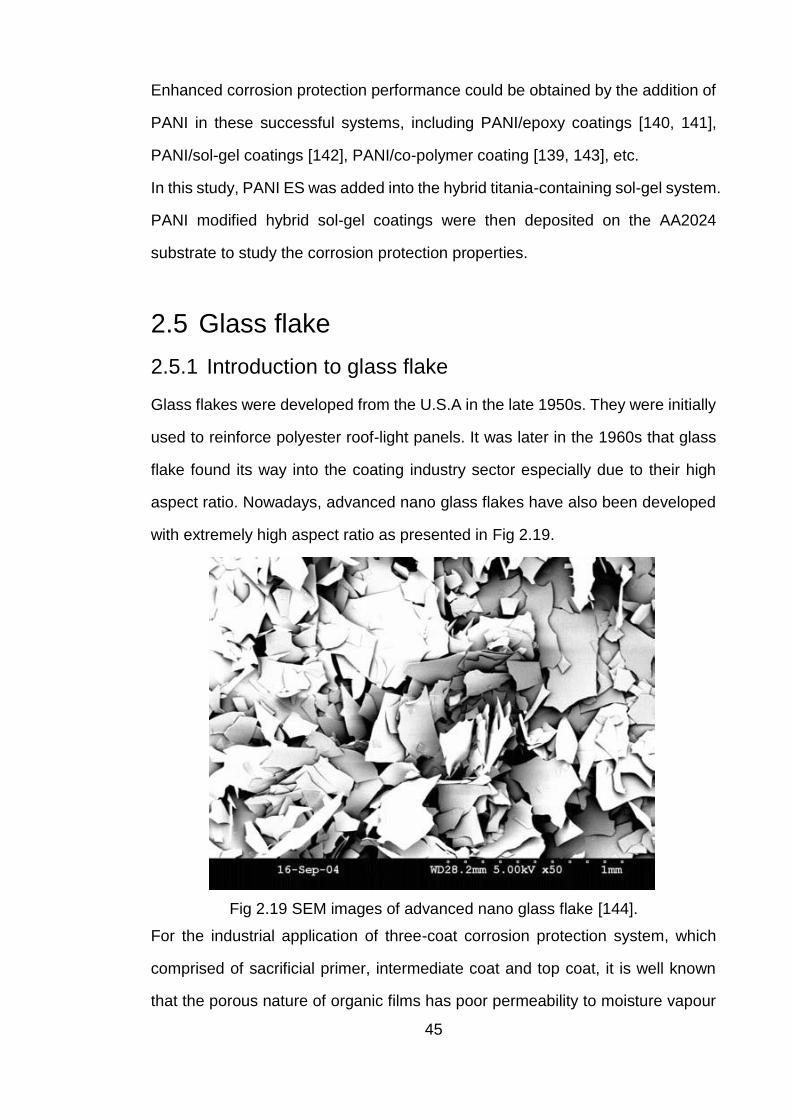
45
Enhanced corrosion protection performance could be obtained by the addition of
PANI in these successful systems, including PANI/epoxy coatings [140, 141],
PANI/sol-gel coatings [142], PANI/co-polymer coating [139, 143], etc.
In this study, PANI ES was added into the hybrid titania-containing sol-gel system.
PANI modified hybrid sol-gel coatings were then deposited on the AA2024
substrate to study the corrosion protection properties.
2.5 Glass flake
2.5.1 Introduction to glass flake
Glass flakes were developed from the U.S.A in the late 1950s. They were initially
used to reinforce polyester roof-light panels. It was later in the 1960s that glass
flake found its way into the coating industry sector especially due to their high
aspect ratio. Nowadays, advanced nano glass flakes have also been developed
with extremely high aspect ratio as presented in Fig 2.19.
Fig 2.19 SEM images of advanced nano glass flake [144].
For the industrial application of three-coat corrosion protection system, which
comprised of sacrificial primer, intermediate coat and top coat, it is well known
that the porous nature of organic films has poor permeability to moisture vapour
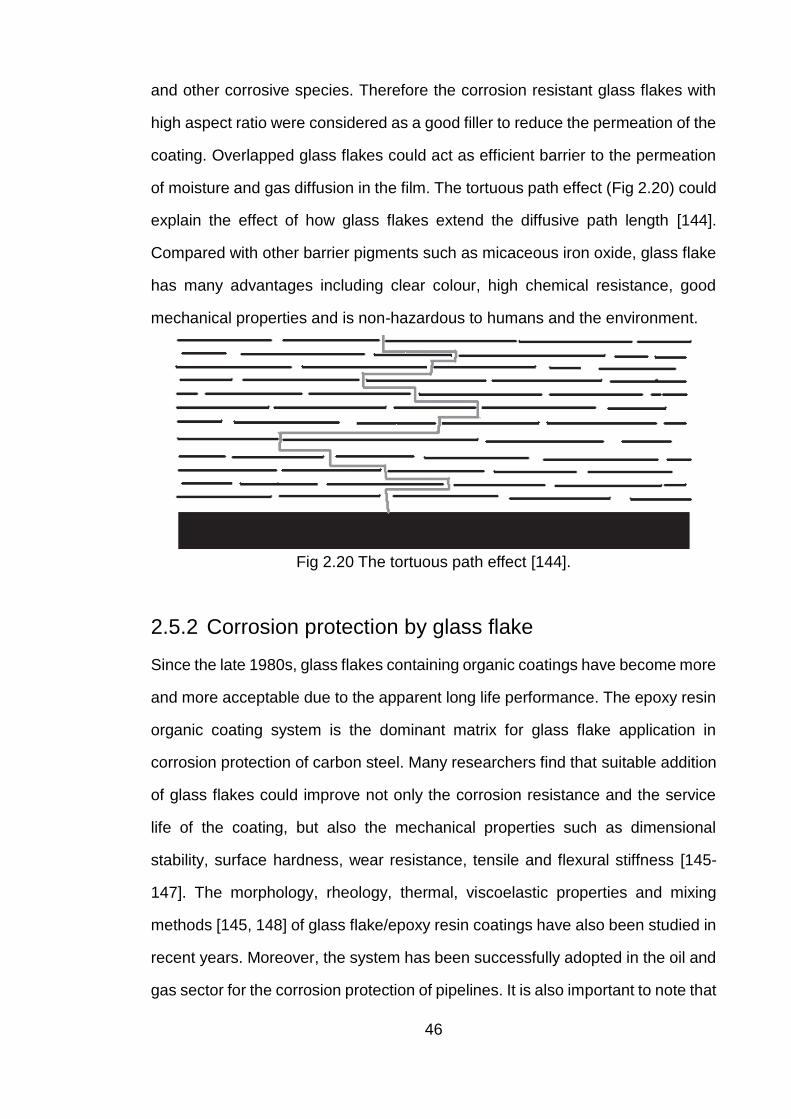
46
and other corrosive species. Therefore the corrosion resistant glass flakes with
high aspect ratio were considered as a good filler to reduce the permeation of the
coating. Overlapped glass flakes could act as efficient barrier to the permeation
of moisture and gas diffusion in the film. The tortuous path effect (Fig 2.20) could
explain the effect of how glass flakes extend the diffusive path length [144].
Compared with other barrier pigments such as micaceous iron oxide, glass flake
has many advantages including clear colour, high chemical resistance, good
mechanical properties and is non-hazardous to humans and the environment.
Fig 2.20 The tortuous path effect [144].
2.5.2 Corrosion protection by glass flake
Since the late 1980s, glass flakes containing organic coatings have become more
and more acceptable due to the apparent long life performance. The epoxy resin
organic coating system is the dominant matrix for glass flake application in
corrosion protection of carbon steel. Many researchers find that suitable addition
of glass flakes could improve not only the corrosion resistance and the service
life of the coating, but also the mechanical properties such as dimensional
stability, surface hardness, wear resistance, tensile and flexural stiffness [145-
147]. The morphology, rheology, thermal, viscoelastic properties and mixing
methods [145, 148] of glass flake/epoxy resin coatings have also been studied in
recent years. Moreover, the system has been successfully adopted in the oil and
gas sector for the corrosion protection of pipelines. It is also important to note that
47
surface modified glass flake by silane or polyaniline, compared with bare glass
flakes, have been shown to provide excellent corrosion protection performance
for epoxy resin coatings due to better bonding properties of glass flakes in the
polymeric matrix [147, 149].
However, until now, all the studies for the corrosion protection of glass flake
containing organic coatings are epoxy resin systems and the substrate based is
just carbon steel. To the authors knowledge, sol-gel coatings, incorporating glass
flake for the corrosion protection of aluminium alloys, has never been reported
before. In this study, glass flake were added in the hybrid titania-containing sol-
gel systems and applied to the AA2024. The corrosion protection of the coating
systems were then assessed.
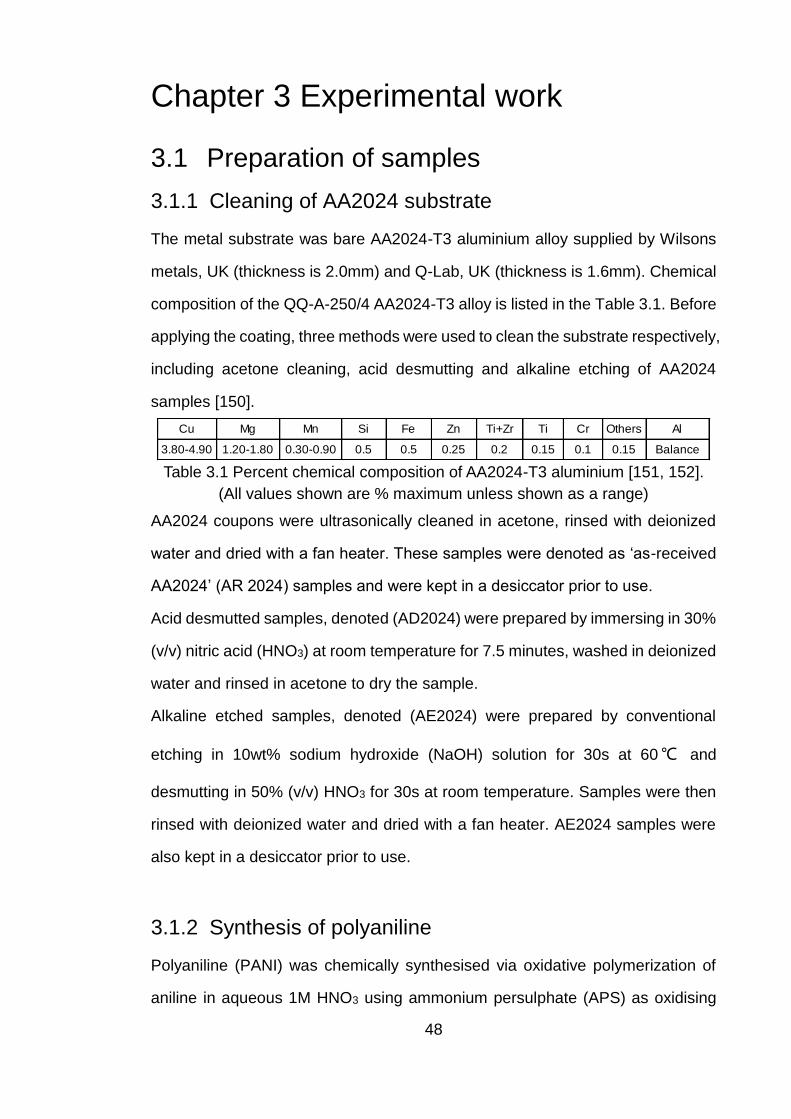
48
Chapter 3 Experimental work
3.1 Preparation of samples
3.1.1 Cleaning of AA2024 substrate
The metal substrate was bare AA2024-T3 aluminium alloy supplied by Wilsons
metals, UK (thickness is 2.0mm) and Q-Lab, UK (thickness is 1.6mm). Chemical
composition of the QQ-A-250/4 AA2024-T3 alloy is listed in the Table 3.1. Before
applying the coating, three methods were used to clean the substrate respectively,
including acetone cleaning, acid desmutting and alkaline etching of AA2024
samples [150].
Table 3.1 Percent chemical composition of AA2024-T3 aluminium [151, 152].
(All values shown are % maximum unless shown as a range)
AA2024 coupons were ultrasonically cleaned in acetone, rinsed with deionized
water and dried with a fan heater. These samples were denoted as ‘as-received
AA2024’ (AR 2024) samples and were kept in a desiccator prior to use.
Acid desmutted samples, denoted (AD2024) were prepared by immersing in 30%
(v/v) nitric acid (HNO3) at room temperature for 7.5 minutes, washed in deionized
water and rinsed in acetone to dry the sample.
Alkaline etched samples, denoted (AE2024) were prepared by conventional
etching in 10wt% sodium hydroxide (NaOH) solution for 30s at 60℃ and
desmutting in 50% (v/v) HNO3 for 30s at room temperature. Samples were then
rinsed with deionized water and dried with a fan heater. AE2024 samples were
also kept in a desiccator prior to use.
3.1.2 Synthesis of polyaniline
Polyaniline (PANI) was chemically synthesised via oxidative polymerization of
aniline in aqueous 1M HNO3 using ammonium persulphate (APS) as oxidising
Cu Mg Mn Si Fe Zn Ti+Zr Ti Cr Others Al
3.80-4.90 1.20-1.80 0.30-0.90 0.5 0.5 0.25 0.2 0.15 0.1 0.15 Balance

49
agent. Two different forms of nanostructured PANI were obtained using different
preparation methods. PANI nanofibres were synthesised via rapid-mixing
reaction [103] and agglomerates of PANI particles were prepared through
traditional polymerization reaction [153]. The overall reaction may be described
as shown in equation (3-1), based on the work of J. Stejskal et al [130].
(3-1)
Prior to the rapid-mixing reaction, monomer aqueous solution was prepared by
dissolving 3.2 mmol aniline in 10ml 1M doping agent of HNO3 and 0.8 mmol of
APS (NH4)2S2O8 was also dissolved in 10ml 1 M HNO3 to form the aqueous
oxidising solution.
Rapid polymerization of aniline was then initiated by pouring the oxidising solution
into the monomer solution in one batch, followed by stirring with a magnetic stirrer
for 30s and then left unstirred in a room temperature water bath for two hours.
The collection of HNO3 doped polyaniline emeraldine salt (PANI ES) nanofibres
was then conducted by traditional vacuum filtration. The filter cake was washed
with 1M HNO3 to replace the H2SO4 doped PANI by-products during the reaction.
Then ethanol (absolute) was used to wash away any remaining small monomers
or other organic molecules. Finally, the cake was washed with deionized water to
remove residual acid until the filtrate reached a clear colour and neutral pH. The
filter cake was dried in an oven at 60℃ for 48 hours and a green powder of
HNO3-doped PANI ES nanofibres was obtained.
During the traditional polymerization synthesis of agglomerated PANI particles,
the same concentration of both the monomer solution and the oxidiser solution
was used as that of rapid-mixing reaction. However, 100ml of oxidising solution
was added drop wise into 100ml monomer solution using a cylindrical funnel over
a period of 30 mins. The solution was continually stirred during the reaction for 2
hours at room temperature in a water bath. After the reaction was complete, the

50
same procedures of filtration and drying, as used for preparing nanofibres, were
applied to generate the HNO3-doped agglomerates of PANI particles.
Blue PANI EB powers were obtained by dedoping the green PANI ES powders
in 1M NH4OH overnight following by filtration and drying.
3.1.3 Preparation of sol-gel coatings
3.1.3.1 Synthesis of standard sol-gel
Original work on preparation of the hybrid titania containing sol was reported
elsewhere [79, 83], however for fullness, details of the synthesis is provided
below.
The main procedure of the hybrid sol was obtained by two alcosols, which were
formed by dispersing solid components in alcohols. The first alcosol was
prepared by the hydrolysis of silane precursors. 5.2ml 3-glycidoxypropylmethyl-
diethoxysilane (GPTMS/C9H20O5Si) and 1.3ml vinyltriethoxysilane (VTES/H2C=C
-HSi(OC2H5)3) was mixed in 6.5ml absolute isopropanol (i-PrOH/(CH3)2CHOH).
Then 1.6ml acidified water of pH 1 HNO3 was added into the silane precursors to
catalyse the hydrolysis process. Mechanically magnetic agitation was then
applied during the hydrolysis for 1 hour. The second alcosol with in-situ formed
titania nanoparticles was prepared by controlled hydrolysis of 2.12 ml titanium
isopropoxide (TIP/Ti{OCH(CH3)2}4) in the 2.12 ml isopropanol. Ethyl acetoacetate
(AcEt/CH3COCH2COOC2H5) (2.12ml) was also added as a complexing agent to
reduce the reactivity of the metallic alkoxides of TIP. After the mixture was sealed
at room temperature for 20 mins to form the titanium (Ⅳ) coordination complex,
0.53ml acidified water of pH 1 HNO3 was added into the mixture under magnetic
stirring for another 20 mins to synthesise the titania nanoparticles containing
alcosol. Finally, the second alcosol was added drop wise into the first alcosol
under magnetic stirring for 1 hour. The hybrid sol system was then aged at room
temperature for 24 hours before being deposited on the AA2024 substrates. The

51
hybrid titania-containing sol-gel prepared from this method was termed as the
‘standard sol-gel’ in this study.
3.1.3.2 Synthesis of PVB modified sol-gel
In order to increase the cross-linking properties and viscosity of the hybrid sol, a
co-polymer or binder, commercial Mowital B 60 H polyvinyl butyral (PVB) from
Kuraray Europe GMBH, was added into the sol-gel system. The chemical formula
of the PVB is presented in Fig 3.1.
Fig 3.1 Chemical formula of the PVB [154].
Before the synthesis of PVB modified sol-gel, Mowital B 60 H polyvinyl butyral,
the fine powder was firstly dissolved in ethanol to form a 10wt% solution.
Magnetic stirring and ultrasonically agitation was applied to the solution until the
PVB powder was completely dissolved in ethanol and a transparent solution
without any bubbles was obtained. Three different PVB/hybrid sols were
prepared by adding, individually, 2.5ml, 5.0ml and 10.0ml of PVB solution drop
wise into the as synthesised hybrid sol just before the aging stage. These sol-
gels were termed as SG_PVB_8, SG_PVB_4 and SG_PVB_2, respectively.
3.1.3.3 Synthesis of PANI modified PVB sol-gel
The synthesised PANI ES nanofibres, agglomerated particles and commercial
PANI ES on carbon black were solution blended before added into the PVB sol-
gel. The solution blending strategies applied involved the preparation of 2wt%
52
PANI ES dispersions in the traditional solvent of N-methyl-2-pyrrolidone (NMP)
with both the as prepared PANI and commercial PANI ES (20wt%) on carbon
black (Sigma Aldrich). PANI ES powders were firstly ground with agate and then
slowly added into the NMP. Magnetic stirring and ultrasonically agitation were
applied to the dispersion until no large precipitates of PANI ES were observed in
the dispersion.
PANI ES in NMP hybrid sol was prepared by the addition of 3.0ml 2wt% PANI ES
NMP dispersion into the as synthesised hybrid PVB sol just before the aging
stage.
3.1.3.4 Synthesis of GF modified PVB sol-gel
The corrosion resistance glass flake (GF) used in this study was from CorroCoat,
UK. Chemical compositions in weight ratio and other properties of the glass flakes
were provided by CorroCoat and are listed in Table 3.2 and Table 3.3. Before
preparing the glass flake containing sol, 0.125g of GF001 was firstly dispersed in
5.0ml PVB solution. After slurry of 2.5wt% glass flakes in the PVB solution was
prepared, it was then added drop wise into the standard sol-gel before aging to
prepare the glass flake modified PVB sol-gel.
Table 3.2 Chemical compositions of GF001 glass flakes [155].
Table 3.3 Properties of GF001 glass flakes [155].
Notes: 1. Extra corrosion resistant (ECR) glass flake is manufactured from a
modified C glass
2. The GF001 glass flakes are micronized
3.1.3.5 Synthesis of PANI and GF modified PVB sol-gel
SiO2 Al2O3 CaO MgO B2O3 Na2O K2O TiO2 ZnO
64-70% 3-6% 3-7% 1-4% 2-5% 8-13% 0-3% 0-3% 1-5%
<12% >88% 1.0-1.3 ECR 1.6 930-1020
50<D<300µm D<50µm Type Melt Temperature/℃Density/g∙cm-3Thickness/µm
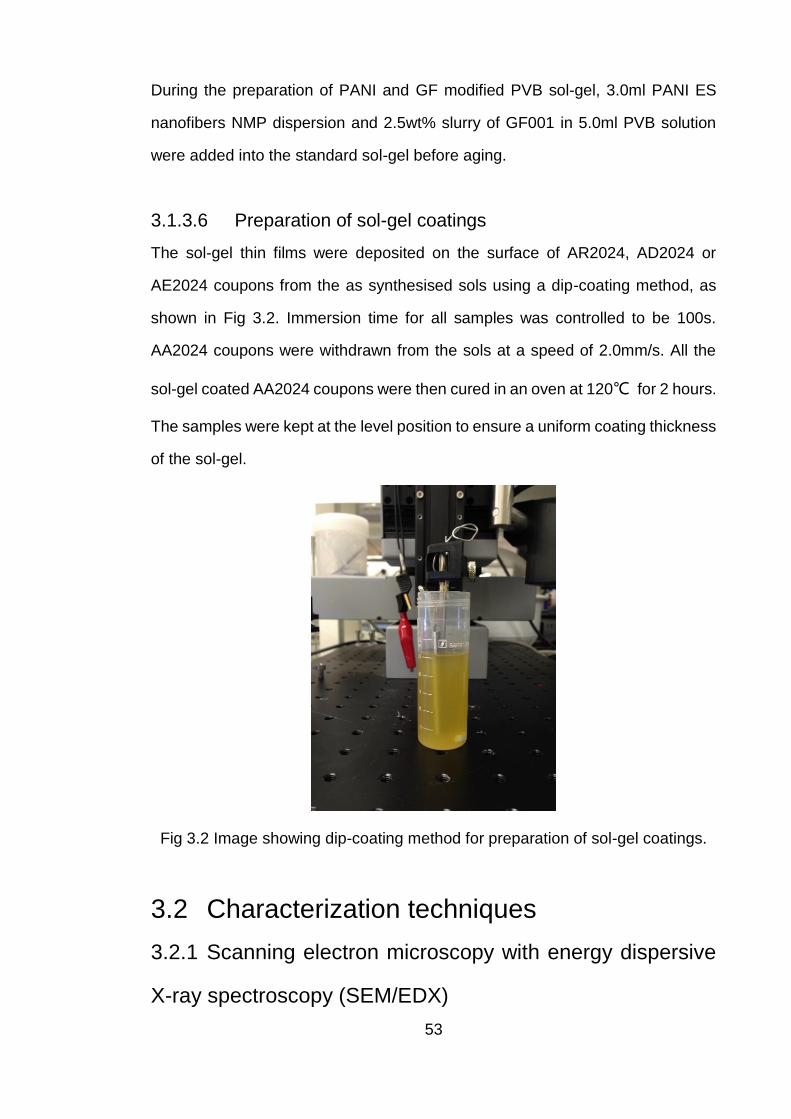
53
During the preparation of PANI and GF modified PVB sol-gel, 3.0ml PANI ES
nanofibers NMP dispersion and 2.5wt% slurry of GF001 in 5.0ml PVB solution
were added into the standard sol-gel before aging.
3.1.3.6 Preparation of sol-gel coatings
The sol-gel thin films were deposited on the surface of AR2024, AD2024 or
AE2024 coupons from the as synthesised sols using a dip-coating method, as
shown in Fig 3.2. Immersion time for all samples was controlled to be 100s.
AA2024 coupons were withdrawn from the sols at a speed of 2.0mm/s. All the
sol-gel coated AA2024 coupons were then cured in an oven at 120℃ for 2 hours.
The samples were kept at the level position to ensure a uniform coating thickness
of the sol-gel.
Fig 3.2 Image showing dip-coating method for preparation of sol-gel coatings.
3.2 Characterization techniques
3.2.1 Scanning electron microscopy with energy dispersive
X-ray spectroscopy (SEM/EDX)
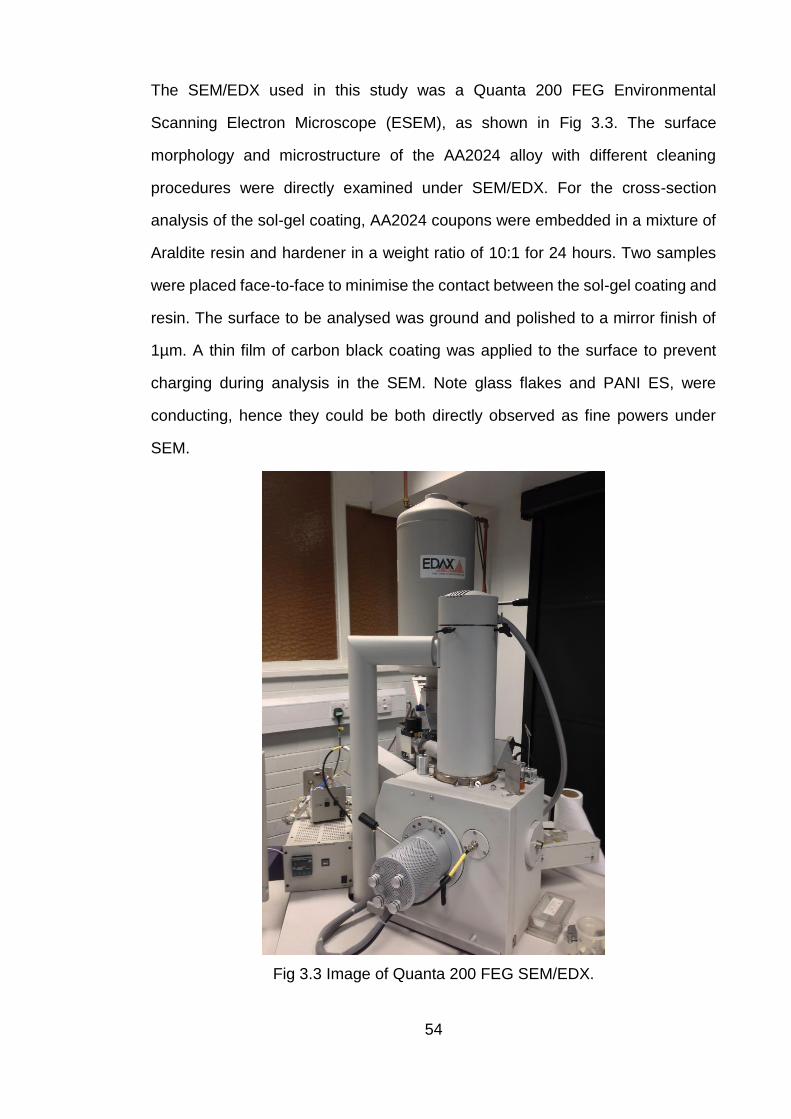
54
The SEM/EDX used in this study was a Quanta 200 FEG Environmental
Scanning Electron Microscope (ESEM), as shown in Fig 3.3. The surface
morphology and microstructure of the AA2024 alloy with different cleaning
procedures were directly examined under SEM/EDX. For the cross-section
analysis of the sol-gel coating, AA2024 coupons were embedded in a mixture of
Araldite resin and hardener in a weight ratio of 10:1 for 24 hours. Two samples
were placed face-to-face to minimise the contact between the sol-gel coating and
resin. The surface to be analysed was ground and polished to a mirror finish of
1µm. A thin film of carbon black coating was applied to the surface to prevent
charging during analysis in the SEM. Note glass flakes and PANI ES, were
conducting, hence they could be both directly observed as fine powers under
SEM.
Fig 3.3 Image of Quanta 200 FEG SEM/EDX.
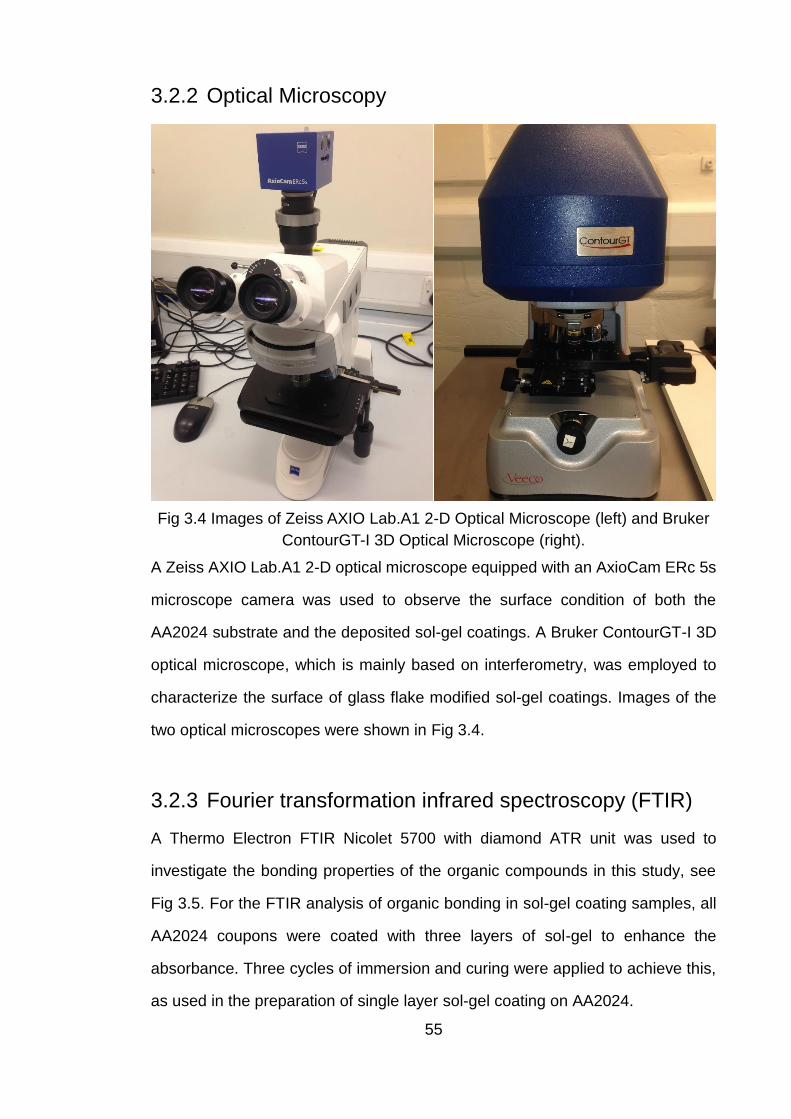
55
3.2.2 Optical Microscopy
Fig 3.4 Images of Zeiss AXIO Lab.A1 2-D Optical Microscope (left) and Bruker
ContourGT-I 3D Optical Microscope (right).
A Zeiss AXIO Lab.A1 2-D optical microscope equipped with an AxioCam ERc 5s
microscope camera was used to observe the surface condition of both the
AA2024 substrate and the deposited sol-gel coatings. A Bruker ContourGT-I 3D
optical microscope, which is mainly based on interferometry, was employed to
characterize the surface of glass flake modified sol-gel coatings. Images of the
two optical microscopes were shown in Fig 3.4.
3.2.3 Fourier transformation infrared spectroscopy (FTIR)
A Thermo Electron FTIR Nicolet 5700 with diamond ATR unit was used to
investigate the bonding properties of the organic compounds in this study, see
Fig 3.5. For the FTIR analysis of organic bonding in sol-gel coating samples, all
AA2024 coupons were coated with three layers of sol-gel to enhance the
absorbance. Three cycles of immersion and curing were applied to achieve this,
as used in the preparation of single layer sol-gel coating on AA2024.
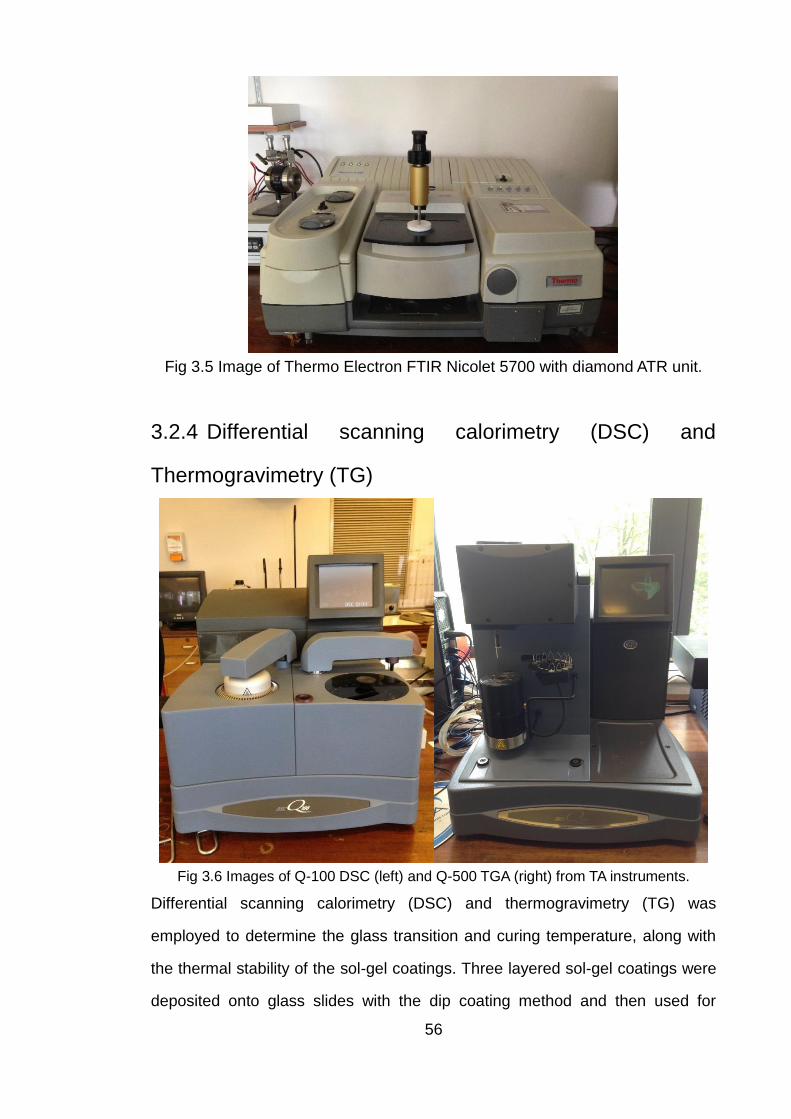
56
Fig 3.5 Image of Thermo Electron FTIR Nicolet 5700 with diamond ATR unit.
3.2.4 Differential scanning calorimetry (DSC) and
Thermogravimetry (TG)
Fig 3.6 Images of Q-100 DSC (left) and Q-500 TGA (right) from TA instruments.
Differential scanning calorimetry (DSC) and thermogravimetry (TG) was
employed to determine the glass transition and curing temperature, along with
the thermal stability of the sol-gel coatings. Three layered sol-gel coatings were
deposited onto glass slides with the dip coating method and then used for
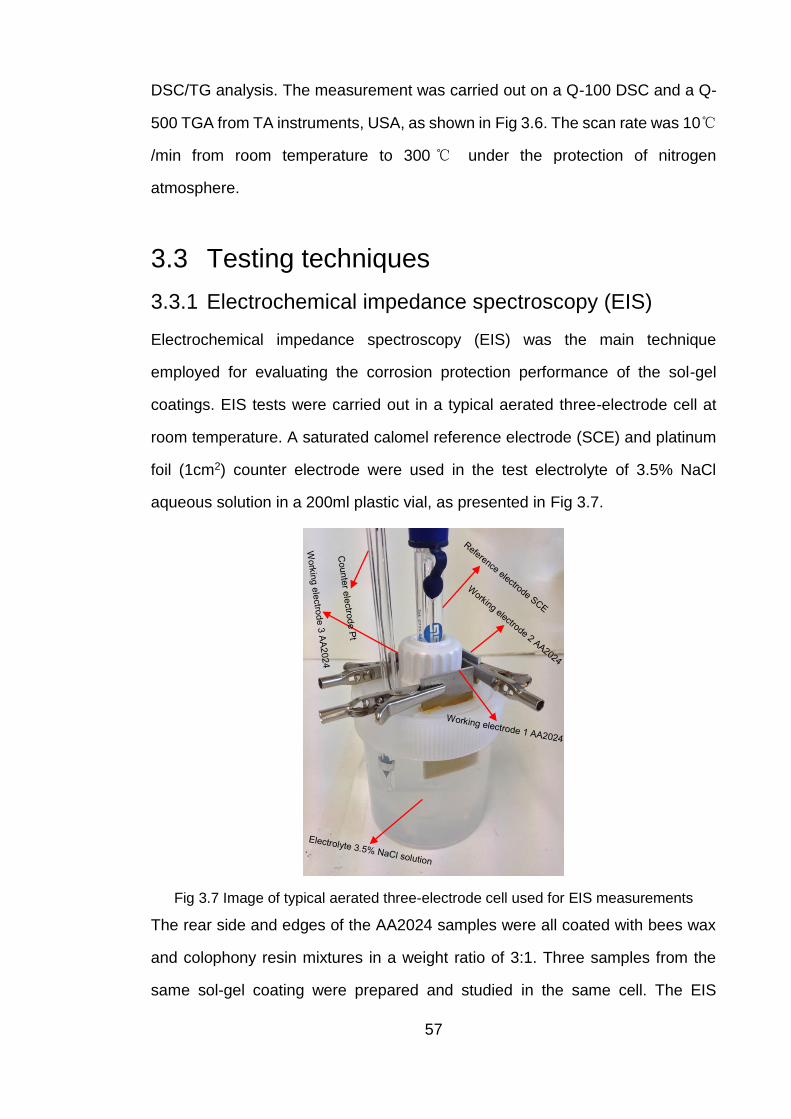
57
DSC/TG analysis. The measurement was carried out on a Q-100 DSC and a Q-
500 TGA from TA instruments, USA, as shown in Fig 3.6. The scan rate was 10℃
/min from room temperature to 300 ℃ under the protection of nitrogen
atmosphere.
3.3 Testing techniques
3.3.1 Electrochemical impedance spectroscopy (EIS)
Electrochemical impedance spectroscopy (EIS) was the main technique
employed for evaluating the corrosion protection performance of the sol-gel
coatings. EIS tests were carried out in a typical aerated three-electrode cell at
room temperature. A saturated calomel reference electrode (SCE) and platinum
foil (1cm2) counter electrode were used in the test electrolyte of 3.5% NaCl
aqueous solution in a 200ml plastic vial, as presented in Fig 3.7.
Fig 3.7 Image of typical aerated three-electrode cell used for EIS measurements
The rear side and edges of the AA2024 samples were all coated with bees wax
and colophony resin mixtures in a weight ratio of 3:1. Three samples from the
same sol-gel coating were prepared and studied in the same cell. The EIS
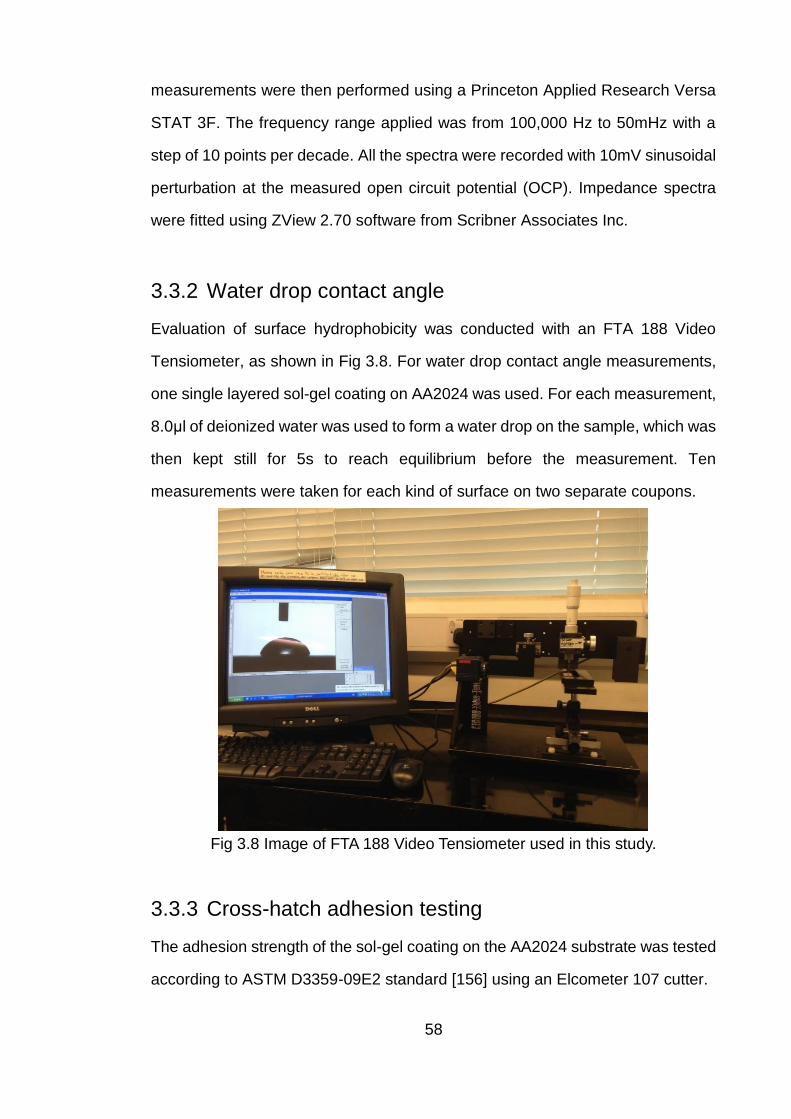
58
measurements were then performed using a Princeton Applied Research Versa
STAT 3F. The frequency range applied was from 100,000 Hz to 50mHz with a
step of 10 points per decade. All the spectra were recorded with 10mV sinusoidal
perturbation at the measured open circuit potential (OCP). Impedance spectra
were fitted using ZView 2.70 software from Scribner Associates Inc.
3.3.2 Water drop contact angle
Evaluation of surface hydrophobicity was conducted with an FTA 188 Video
Tensiometer, as shown in Fig 3.8. For water drop contact angle measurements,
one single layered sol-gel coating on AA2024 was used. For each measurement,
8.0μl of deionized water was used to form a water drop on the sample, which was
then kept still for 5s to reach equilibrium before the measurement. Ten
measurements were taken for each kind of surface on two separate coupons.
Fig 3.8 Image of FTA 188 Video Tensiometer used in this study.
3.3.3 Cross-hatch adhesion testing
The adhesion strength of the sol-gel coating on the AA2024 substrate was tested
according to ASTM D3359-09E2 standard [156] using an Elcometer 107 cutter.
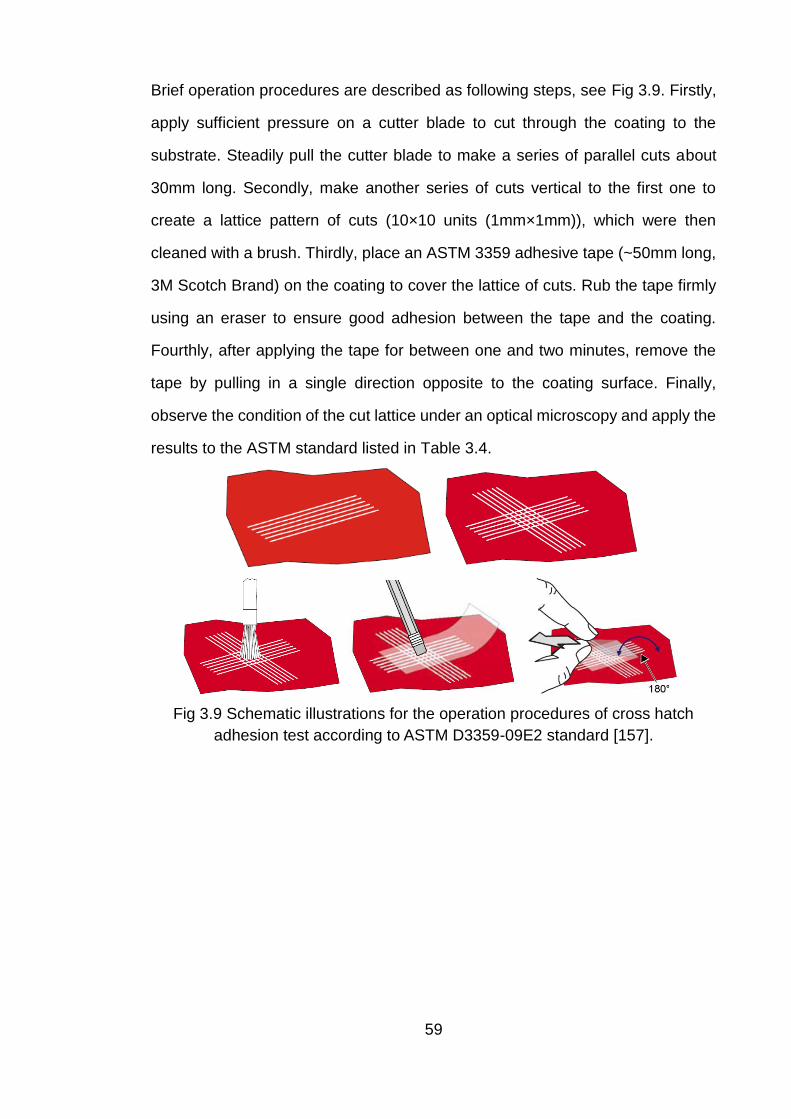
59
Brief operation procedures are described as following steps, see Fig 3.9. Firstly,
apply sufficient pressure on a cutter blade to cut through the coating to the
substrate. Steadily pull the cutter blade to make a series of parallel cuts about
30mm long. Secondly, make another series of cuts vertical to the first one to
create a lattice pattern of cuts (10×10 units (1mm×1mm)), which were then
cleaned with a brush. Thirdly, place an ASTM 3359 adhesive tape (~50mm long,
3M Scotch Brand) on the coating to cover the lattice of cuts. Rub the tape firmly
using an eraser to ensure good adhesion between the tape and the coating.
Fourthly, after applying the tape for between one and two minutes, remove the
tape by pulling in a single direction opposite to the coating surface. Finally,
observe the condition of the cut lattice under an optical microscopy and apply the
results to the ASTM standard listed in Table 3.4.
Fig 3.9 Schematic illustrations for the operation procedures of cross hatch
adhesion test according to ASTM D3359-09E2 standard [157].
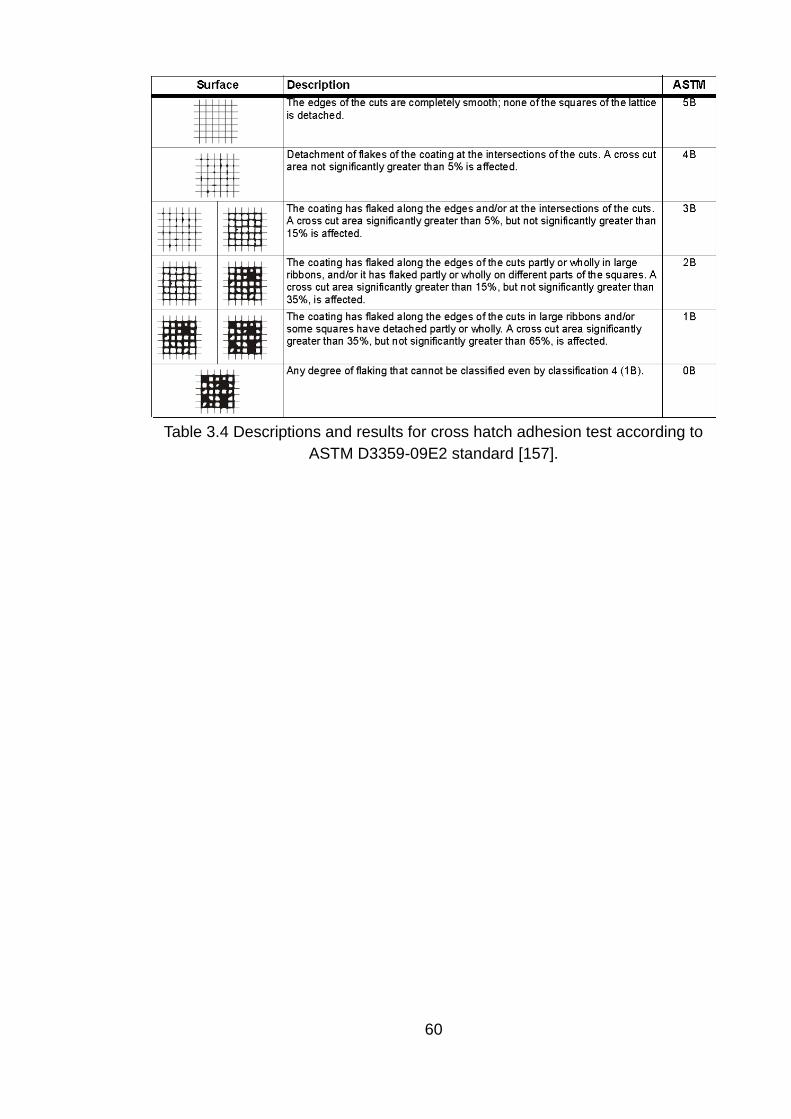
60
Table 3.4 Descriptions and results for cross hatch adhesion test according to
ASTM D3359-09E2 standard [157].

61
Chapter 4 Results
This chapter consists mainly of three parts, including characterization of materials,
corrosion performance of both coated and uncoated samples, and other
properties of sol-gel coatings.
In part one, the results on the characterization of the different systems are
presented. Firstly, an SEM study was carried out to characterize the surface
condition of AA2024 alloy following the different cleaning procedures, to assess
the morphology of polyaniline synthesised via different methods and commercial
products, as well as the morphology of glass flake.
Part two details the results of the corrosion performance of bare AA2024-T3 alloy
and sol-gel coated samples in 3.5% NaCl solutions via EIS measurements. Bare
AA2024 with different cleaning procedures and their standard sol-gel coated
samples are also presented. The influence of PVB on bare titania-containing sol-
gel coatings for the protection of AA2024 were then investigated. Following this,
the different kinds of PANI were dispersed in N-Methyl-2-pyrrolidone (NMP) to
study their effects on the sol-gel for corrosion protection. Results from sol-gel
formulations containing, bare glass flake and its combination with PANI are also
provided.
In part three, the hydrophobic nature of the sol-gel coatings was examined using
the water drop contact angle technique. Finally, adhesion strength between
different sol-gel coatings and substrates was examined by cross-hatch tests.
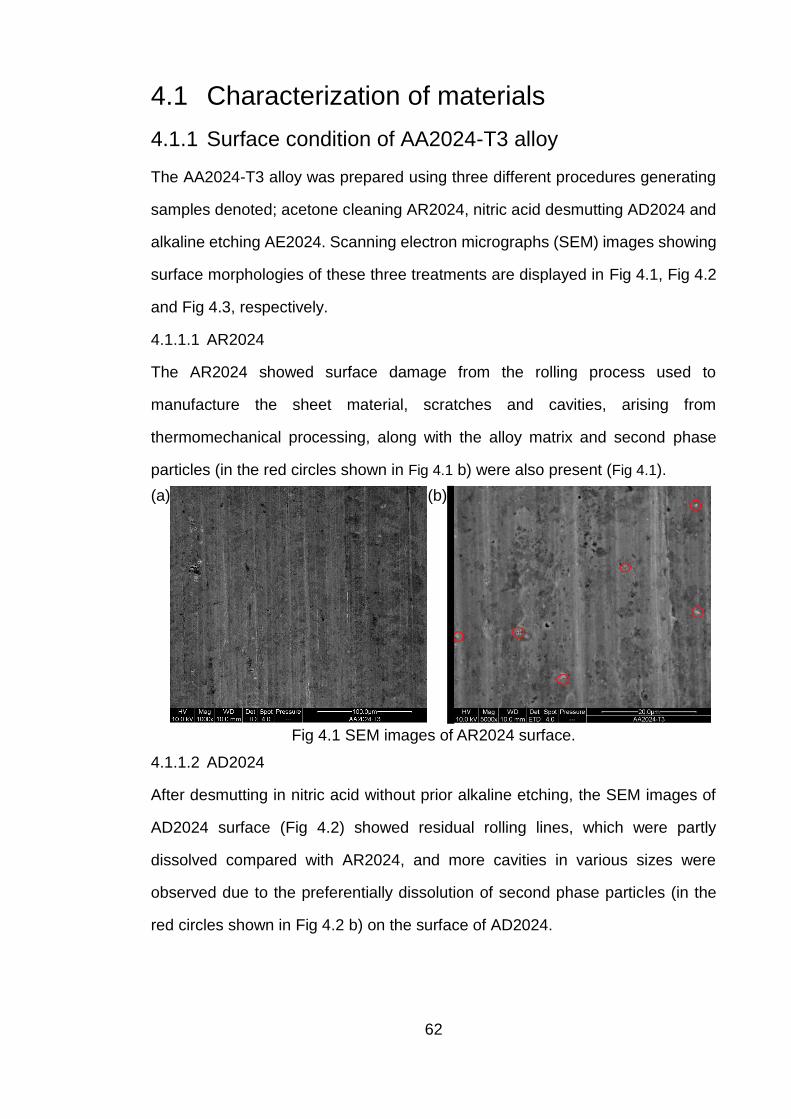
62
4.1 Characterization of materials
4.1.1 Surface condition of AA2024-T3 alloy
The AA2024-T3 alloy was prepared using three different procedures generating
samples denoted; acetone cleaning AR2024, nitric acid desmutting AD2024 and
alkaline etching AE2024. Scanning electron micrographs (SEM) images showing
surface morphologies of these three treatments are displayed in Fig 4.1, Fig 4.2
and Fig 4.3, respectively.
4.1.1.1 AR2024
The AR2024 showed surface damage from the rolling process used to
manufacture the sheet material, scratches and cavities, arising from
thermomechanical processing, along with the alloy matrix and second phase
particles (in the red circles shown in Fig 4.1 b) were also present (Fig 4.1).
(a) (b)
Fig 4.1 SEM images of AR2024 surface.
4.1.1.2 AD2024
After desmutting in nitric acid without prior alkaline etching, the SEM images of
AD2024 surface (Fig 4.2) showed residual rolling lines, which were partly
dissolved compared with AR2024, and more cavities in various sizes were
observed due to the preferentially dissolution of second phase particles (in the
red circles shown in Fig 4.2 b) on the surface of AD2024.
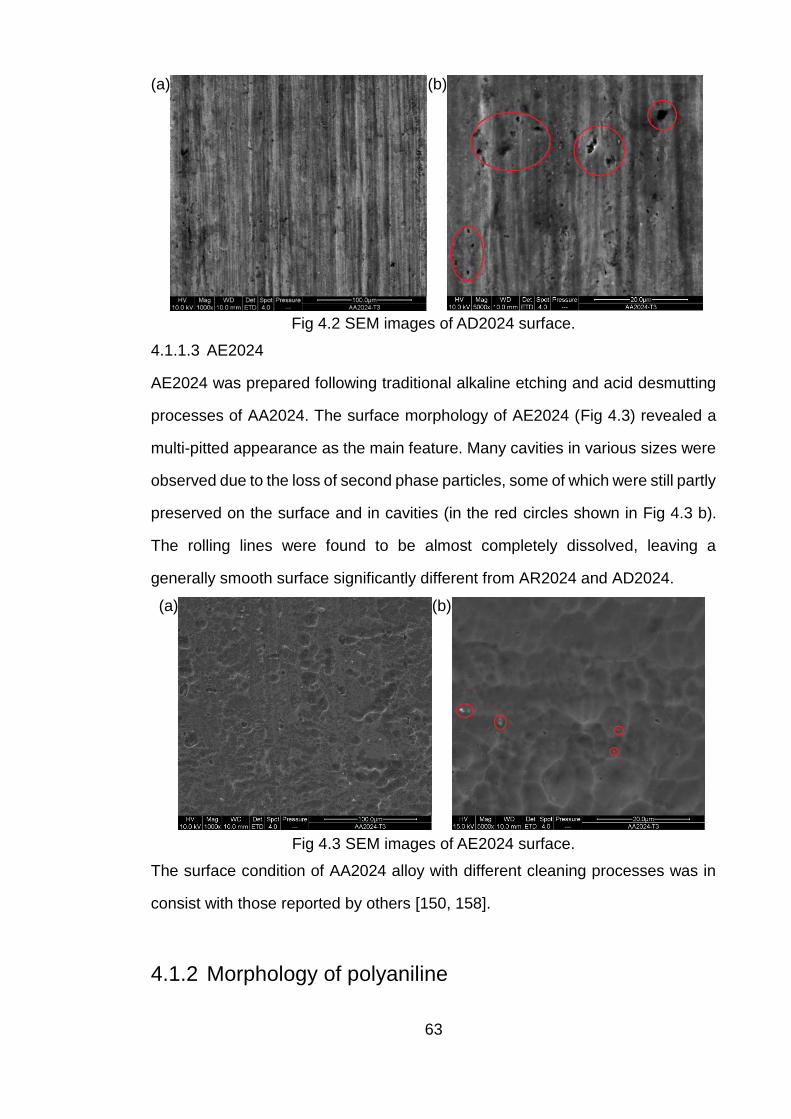
63
(a) (b)
Fig 4.2 SEM images of AD2024 surface.
4.1.1.3 AE2024
AE2024 was prepared following traditional alkaline etching and acid desmutting
processes of AA2024. The surface morphology of AE2024 (Fig 4.3) revealed a
multi-pitted appearance as the main feature. Many cavities in various sizes were
observed due to the loss of second phase particles, some of which were still partly
preserved on the surface and in cavities (in the red circles shown in Fig 4.3 b).
The rolling lines were found to be almost completely dissolved, leaving a
generally smooth surface significantly different from AR2024 and AD2024.
(a) (b)
Fig 4.3 SEM images of AE2024 surface.
The surface condition of AA2024 alloy with different cleaning processes was in
consist with those reported by others [150, 158].
4.1.2 Morphology of polyaniline
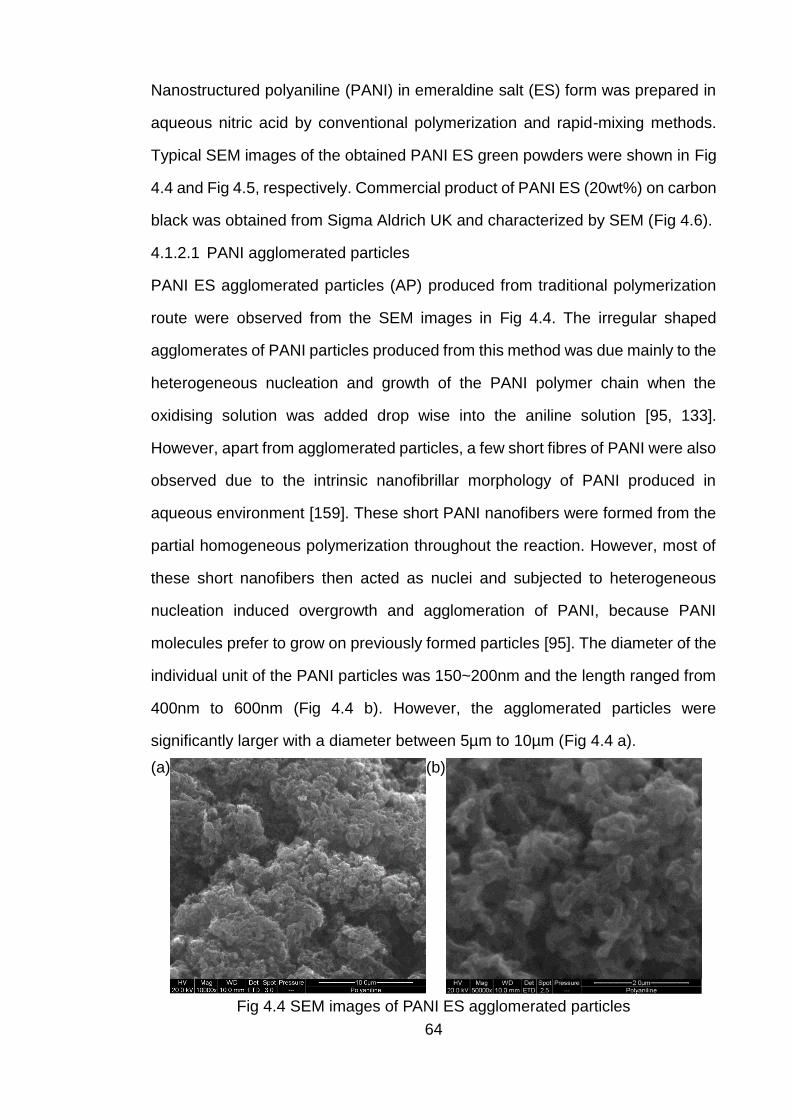
64
Nanostructured polyaniline (PANI) in emeraldine salt (ES) form was prepared in
aqueous nitric acid by conventional polymerization and rapid-mixing methods.
Typical SEM images of the obtained PANI ES green powders were shown in Fig
4.4 and Fig 4.5, respectively. Commercial product of PANI ES (20wt%) on carbon
black was obtained from Sigma Aldrich UK and characterized by SEM (Fig 4.6).
4.1.2.1 PANI agglomerated particles
PANI ES agglomerated particles (AP) produced from traditional polymerization
route were observed from the SEM images in Fig 4.4. The irregular shaped
agglomerates of PANI particles produced from this method was due mainly to the
heterogeneous nucleation and growth of the PANI polymer chain when the
oxidising solution was added drop wise into the aniline solution [95, 133].
However, apart from agglomerated particles, a few short fibres of PANI were also
observed due to the intrinsic nanofibrillar morphology of PANI produced in
aqueous environment [159]. These short PANI nanofibers were formed from the
partial homogeneous polymerization throughout the reaction. However, most of
these short nanofibers then acted as nuclei and subjected to heterogeneous
nucleation induced overgrowth and agglomeration of PANI, because PANI
molecules prefer to grow on previously formed particles [95]. The diameter of the
individual unit of the PANI particles was 150~200nm and the length ranged from
400nm to 600nm (Fig 4.4 b). However, the agglomerated particles were
significantly larger with a diameter between 5µm to 10µm (Fig 4.4 a).
(a) (b)
Fig 4.4 SEM images of PANI ES agglomerated particles
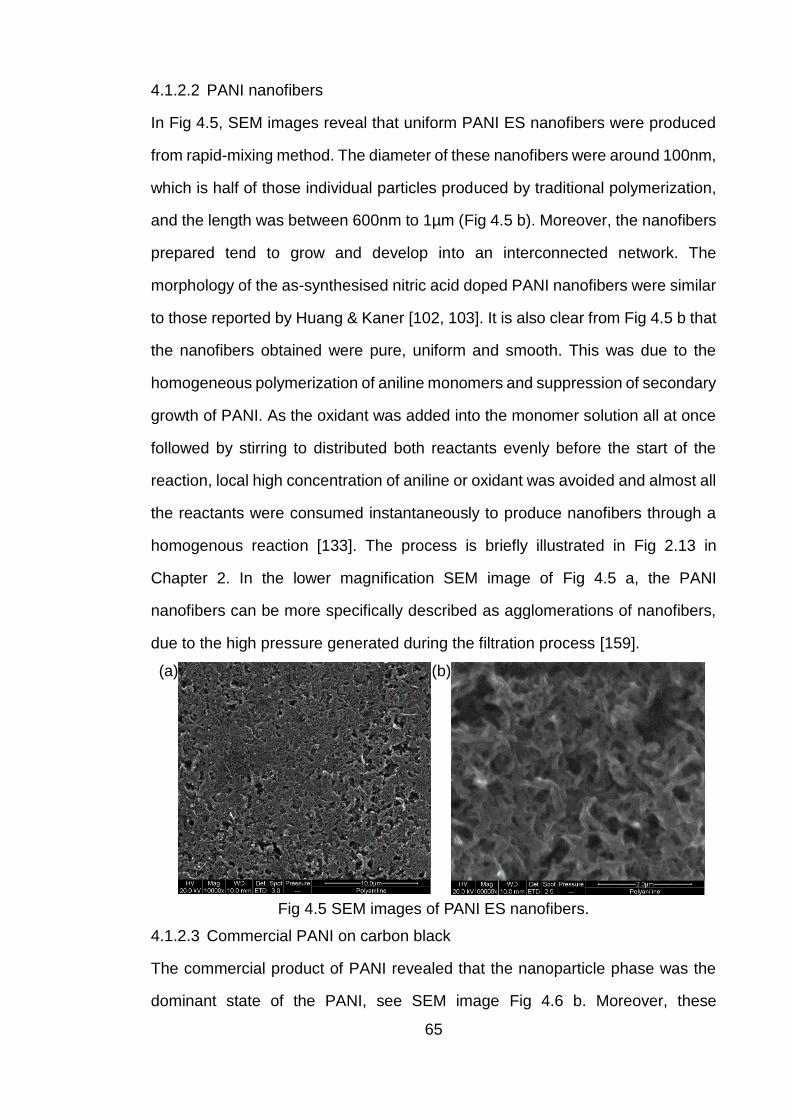
65
4.1.2.2 PANI nanofibers
In Fig 4.5, SEM images reveal that uniform PANI ES nanofibers were produced
from rapid-mixing method. The diameter of these nanofibers were around 100nm,
which is half of those individual particles produced by traditional polymerization,
and the length was between 600nm to 1µm (Fig 4.5 b). Moreover, the nanofibers
prepared tend to grow and develop into an interconnected network. The
morphology of the as-synthesised nitric acid doped PANI nanofibers were similar
to those reported by Huang & Kaner [102, 103]. It is also clear from Fig 4.5 b that
the nanofibers obtained were pure, uniform and smooth. This was due to the
homogeneous polymerization of aniline monomers and suppression of secondary
growth of PANI. As the oxidant was added into the monomer solution all at once
followed by stirring to distributed both reactants evenly before the start of the
reaction, local high concentration of aniline or oxidant was avoided and almost all
the reactants were consumed instantaneously to produce nanofibers through a
homogenous reaction [133]. The process is briefly illustrated in Fig 2.13 in
Chapter 2. In the lower magnification SEM image of Fig 4.5 a, the PANI
nanofibers can be more specifically described as agglomerations of nanofibers,
due to the high pressure generated during the filtration process [159].
(a) (b)
Fig 4.5 SEM images of PANI ES nanofibers.
4.1.2.3 Commercial PANI on carbon black
The commercial product of PANI revealed that the nanoparticle phase was the
dominant state of the PANI, see SEM image Fig 4.6 b. Moreover, these
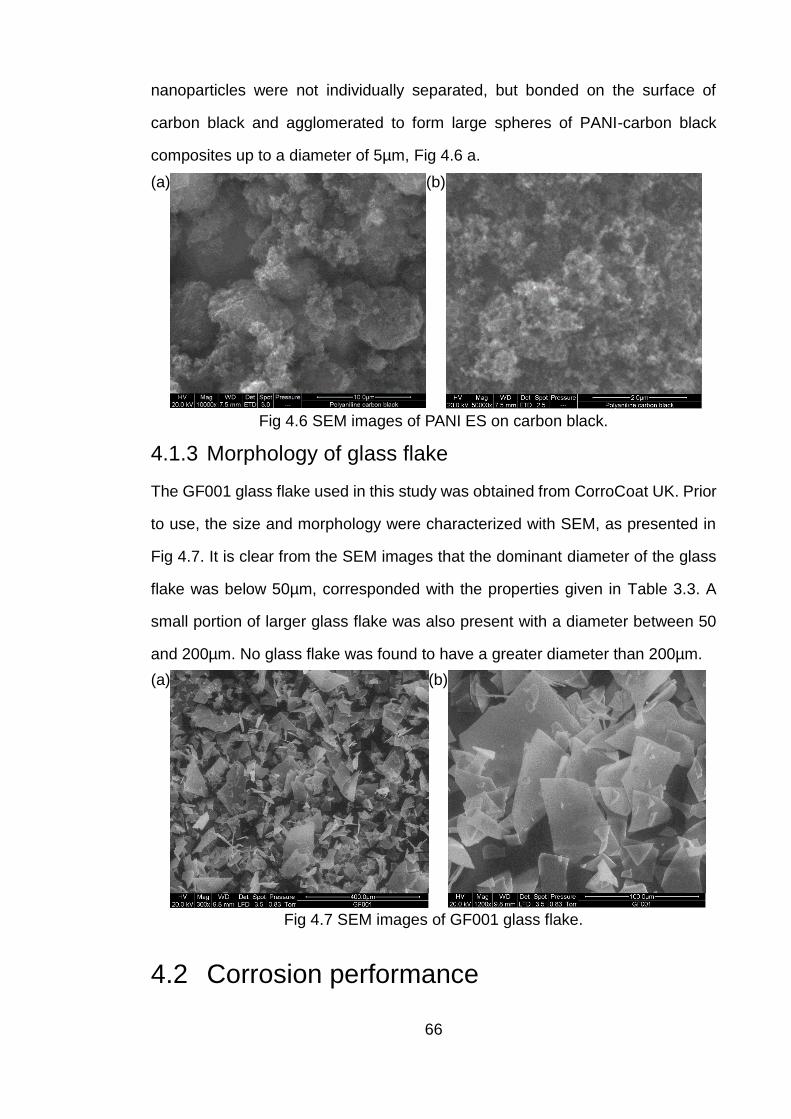
66
nanoparticles were not individually separated, but bonded on the surface of
carbon black and agglomerated to form large spheres of PANI-carbon black
composites up to a diameter of 5µm, Fig 4.6 a.
(a) (b)
Fig 4.6 SEM images of PANI ES on carbon black.
4.1.3 Morphology of glass flake
The GF001 glass flake used in this study was obtained from CorroCoat UK. Prior
to use, the size and morphology were characterized with SEM, as presented in
Fig 4.7. It is clear from the SEM images that the dominant diameter of the glass
flake was below 50µm, corresponded with the properties given in Table 3.3. A
small portion of larger glass flake was also present with a diameter between 50
and 200µm. No glass flake was found to have a greater diameter than 200µm.
(a) (b)
Fig 4.7 SEM images of GF001 glass flake.
4.2 Corrosion performance
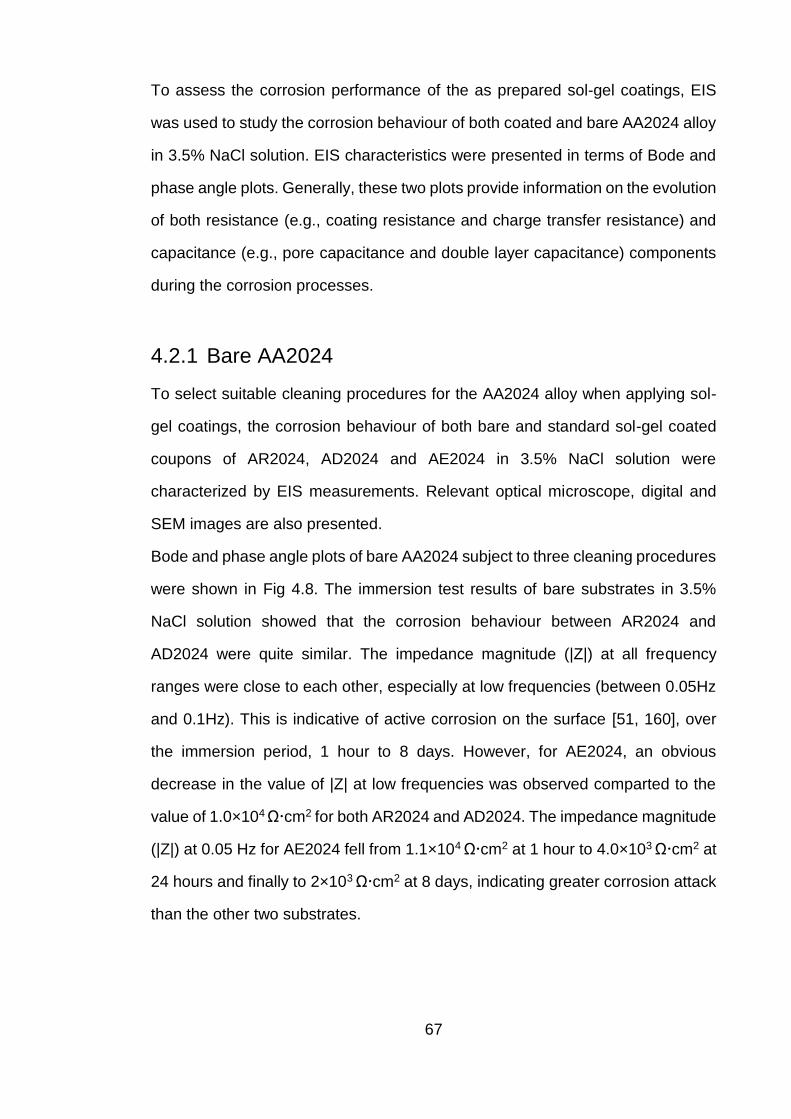
67
To assess the corrosion performance of the as prepared sol-gel coatings, EIS
was used to study the corrosion behaviour of both coated and bare AA2024 alloy
in 3.5% NaCl solution. EIS characteristics were presented in terms of Bode and
phase angle plots. Generally, these two plots provide information on the evolution
of both resistance (e.g., coating resistance and charge transfer resistance) and
capacitance (e.g., pore capacitance and double layer capacitance) components
during the corrosion processes.
4.2.1 Bare AA2024
To select suitable cleaning procedures for the AA2024 alloy when applying sol-
gel coatings, the corrosion behaviour of both bare and standard sol-gel coated
coupons of AR2024, AD2024 and AE2024 in 3.5% NaCl solution were
characterized by EIS measurements. Relevant optical microscope, digital and
SEM images are also presented.
Bode and phase angle plots of bare AA2024 subject to three cleaning procedures
were shown in Fig 4.8. The immersion test results of bare substrates in 3.5%
NaCl solution showed that the corrosion behaviour between AR2024 and
AD2024 were quite similar. The impedance magnitude (|Z|) at all frequency
ranges were close to each other, especially at low frequencies (between 0.05Hz
and 0.1Hz). This is indicative of active corrosion on the surface [51, 160], over
the immersion period, 1 hour to 8 days. However, for AE2024, an obvious
decrease in the value of |Z| at low frequencies was observed comparted to the
value of 1.0×10⁴ Ωcm2 for both AR2024 and AD2024. The impedance magnitude
(|Z|) at 0.05 Hz for AE2024 fell from 1.1×10⁴ Ωcm2 at 1 hour to 4.0×10³ Ωcm2 at
24 hours and finally to 2×10³ Ωcm2 at 8 days, indicating greater corrosion attack
than the other two substrates.
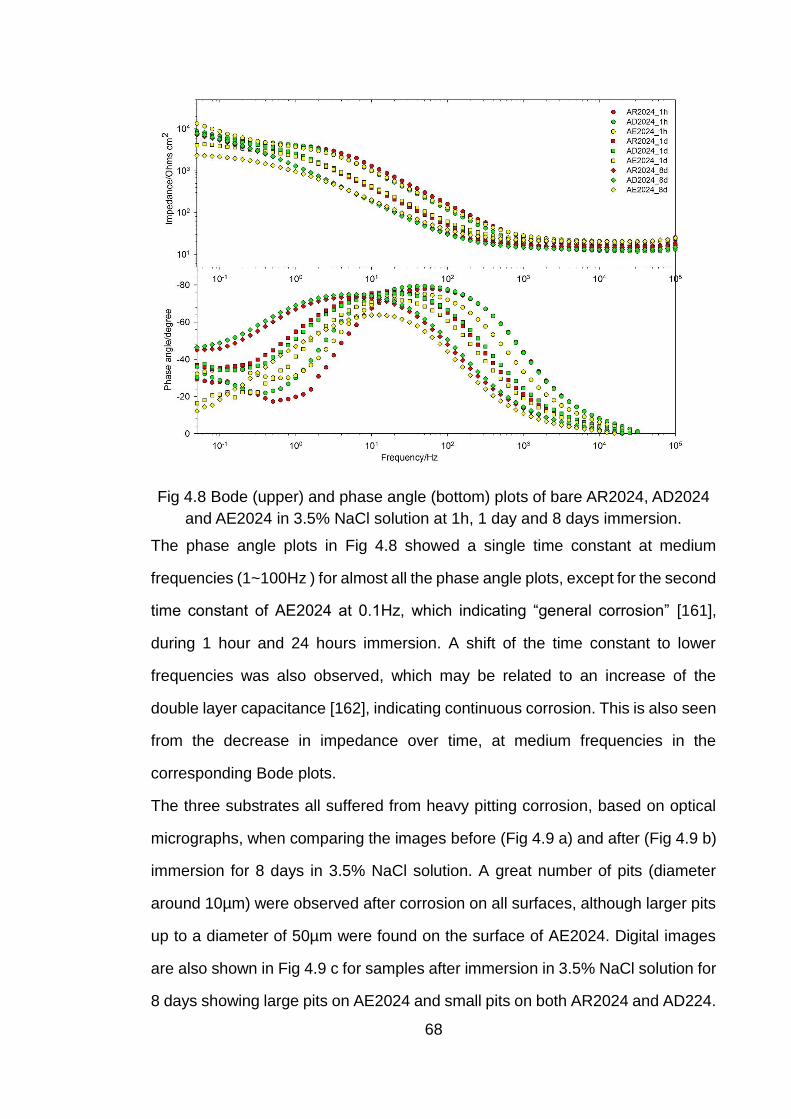
68
Fig 4.8 Bode (upper) and phase angle (bottom) plots of bare AR2024, AD2024
and AE2024 in 3.5% NaCl solution at 1h, 1 day and 8 days immersion.
The phase angle plots in Fig 4.8 showed a single time constant at medium
frequencies (1~100Hz ) for almost all the phase angle plots, except for the second
time constant of AE2024 at 0.1Hz, which indicating “general corrosion” [161],
during 1 hour and 24 hours immersion. A shift of the time constant to lower
frequencies was also observed, which may be related to an increase of the
double layer capacitance [162], indicating continuous corrosion. This is also seen
from the decrease in impedance over time, at medium frequencies in the
corresponding Bode plots.
The three substrates all suffered from heavy pitting corrosion, based on optical
micrographs, when comparing the images before (Fig 4.9 a) and after (Fig 4.9 b)
immersion for 8 days in 3.5% NaCl solution. A great number of pits (diameter
around 10µm) were observed after corrosion on all surfaces, although larger pits
up to a diameter of 50µm were found on the surface of AE2024. Digital images
are also shown in Fig 4.9 c for samples after immersion in 3.5% NaCl solution for
8 days showing large pits on AE2024 and small pits on both AR2024 and AD224.
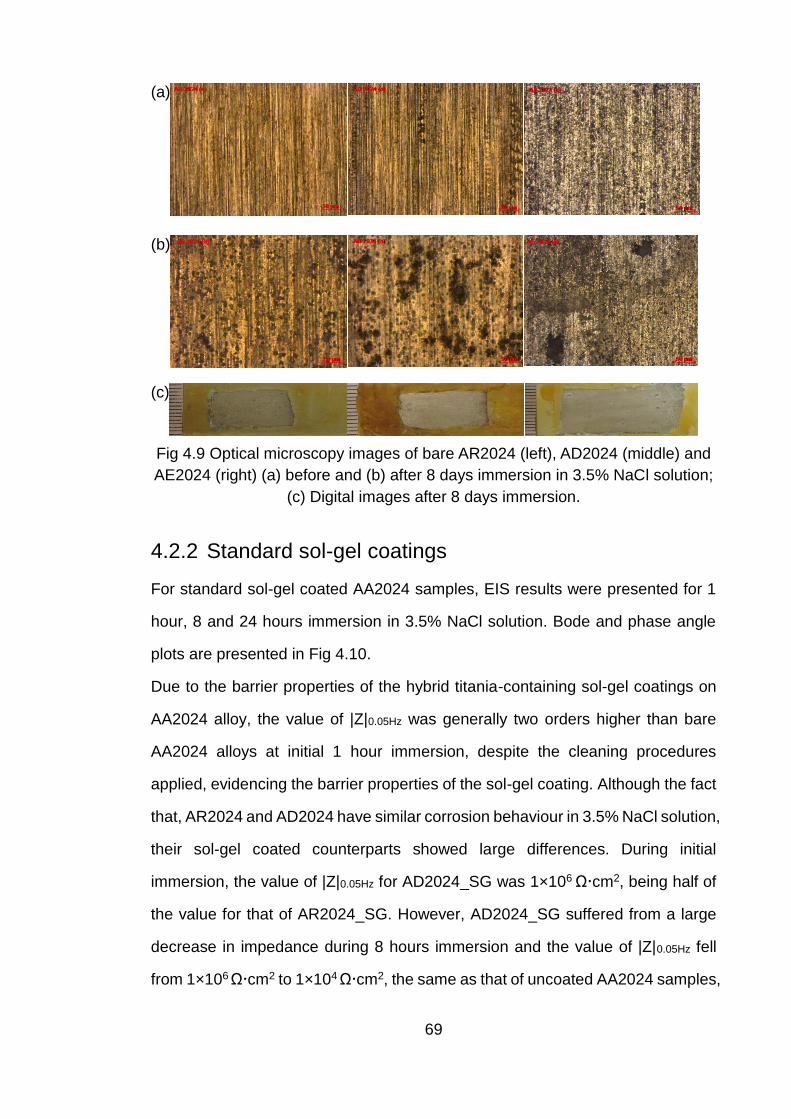
69
(a)
(b)
(c)
Fig 4.9 Optical microscopy images of bare AR2024 (left), AD2024 (middle) and
AE2024 (right) (a) before and (b) after 8 days immersion in 3.5% NaCl solution;
(c) Digital images after 8 days immersion.
4.2.2 Standard sol-gel coatings
For standard sol-gel coated AA2024 samples, EIS results were presented for 1
hour, 8 and 24 hours immersion in 3.5% NaCl solution. Bode and phase angle
plots are presented in Fig 4.10.
Due to the barrier properties of the hybrid titania-containing sol-gel coatings on
AA2024 alloy, the value of |Z|0.05Hz was generally two orders higher than bare
AA2024 alloys at initial 1 hour immersion, despite the cleaning procedures
applied, evidencing the barrier properties of the sol-gel coating. Although the fact
that, AR2024 and AD2024 have similar corrosion behaviour in 3.5% NaCl solution,
their sol-gel coated counterparts showed large differences. During initial
immersion, the value of |Z|0.05Hz for AD2024_SG was 1×10⁶ Ωcm2, being half of
the value for that of AR2024_SG. However, AD2024_SG suffered from a large
decrease in impedance during 8 hours immersion and the value of |Z|0.05Hz fell
from 1×10⁶ Ωcm2 to 1×10⁴ Ωcm2, the same as that of uncoated AA2024 samples,
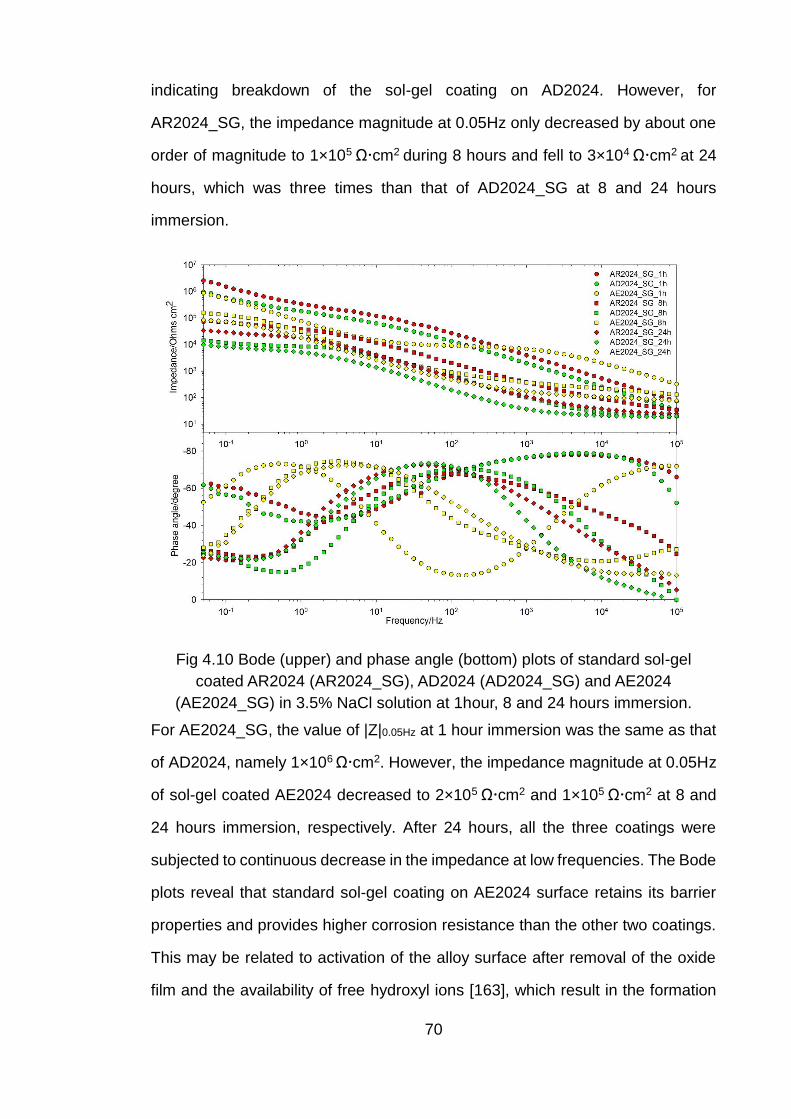
70
indicating breakdown of the sol-gel coating on AD2024. However, for
AR2024_SG, the impedance magnitude at 0.05Hz only decreased by about one
order of magnitude to 1×10⁵ Ωcm2 during 8 hours and fell to 3×10⁴ Ωcm2 at 24
hours, which was three times than that of AD2024_SG at 8 and 24 hours
immersion.
Fig 4.10 Bode (upper) and phase angle (bottom) plots of standard sol-gel
coated AR2024 (AR2024_SG), AD2024 (AD2024_SG) and AE2024
(AE2024_SG) in 3.5% NaCl solution at 1hour, 8 and 24 hours immersion.
For AE2024_SG, the value of |Z|0.05Hz at 1 hour immersion was the same as that
of AD2024, namely 1×10⁶ Ωcm2. However, the impedance magnitude at 0.05Hz
of sol-gel coated AE2024 decreased to 2×10⁵ Ωcm2 and 1×10⁵ Ωcm2 at 8 and
24 hours immersion, respectively. After 24 hours, all the three coatings were
subjected to continuous decrease in the impedance at low frequencies. The Bode
plots reveal that standard sol-gel coating on AE2024 surface retains its barrier
properties and provides higher corrosion resistance than the other two coatings.
This may be related to activation of the alloy surface after removal of the oxide
film and the availability of free hydroxyl ions [163], which result in the formation
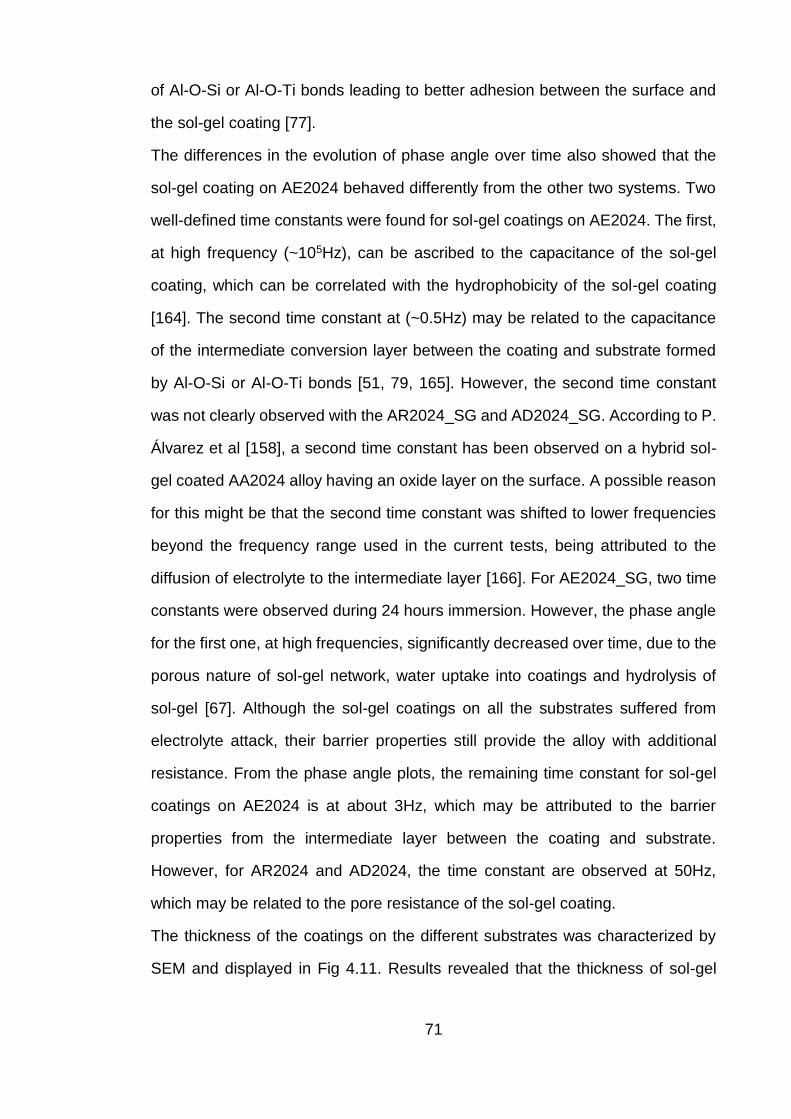
71
of Al-O-Si or Al-O-Ti bonds leading to better adhesion between the surface and
the sol-gel coating [77].
The differences in the evolution of phase angle over time also showed that the
sol-gel coating on AE2024 behaved differently from the other two systems. Two
well-defined time constants were found for sol-gel coatings on AE2024. The first,
at high frequency (~105Hz), can be ascribed to the capacitance of the sol-gel
coating, which can be correlated with the hydrophobicity of the sol-gel coating
[164]. The second time constant at (~0.5Hz) may be related to the capacitance
of the intermediate conversion layer between the coating and substrate formed
by Al-O-Si or Al-O-Ti bonds [51, 79, 165]. However, the second time constant
was not clearly observed with the AR2024_SG and AD2024_SG. According to P.
Álvarez et al [158], a second time constant has been observed on a hybrid sol-
gel coated AA2024 alloy having an oxide layer on the surface. A possible reason
for this might be that the second time constant was shifted to lower frequencies
beyond the frequency range used in the current tests, being attributed to the
diffusion of electrolyte to the intermediate layer [166]. For AE2024_SG, two time
constants were observed during 24 hours immersion. However, the phase angle
for the first one, at high frequencies, significantly decreased over time, due to the
porous nature of sol-gel network, water uptake into coatings and hydrolysis of
sol-gel [67]. Although the sol-gel coatings on all the substrates suffered from
electrolyte attack, their barrier properties still provide the alloy with additional
resistance. From the phase angle plots, the remaining time constant for sol-gel
coatings on AE2024 is at about 3Hz, which may be attributed to the barrier
properties from the intermediate layer between the coating and substrate.
However, for AR2024 and AD2024, the time constant are observed at 50Hz,
which may be related to the pore resistance of the sol-gel coating.
The thickness of the coatings on the different substrates was characterized by
SEM and displayed in Fig 4.11. Results revealed that the thickness of sol-gel
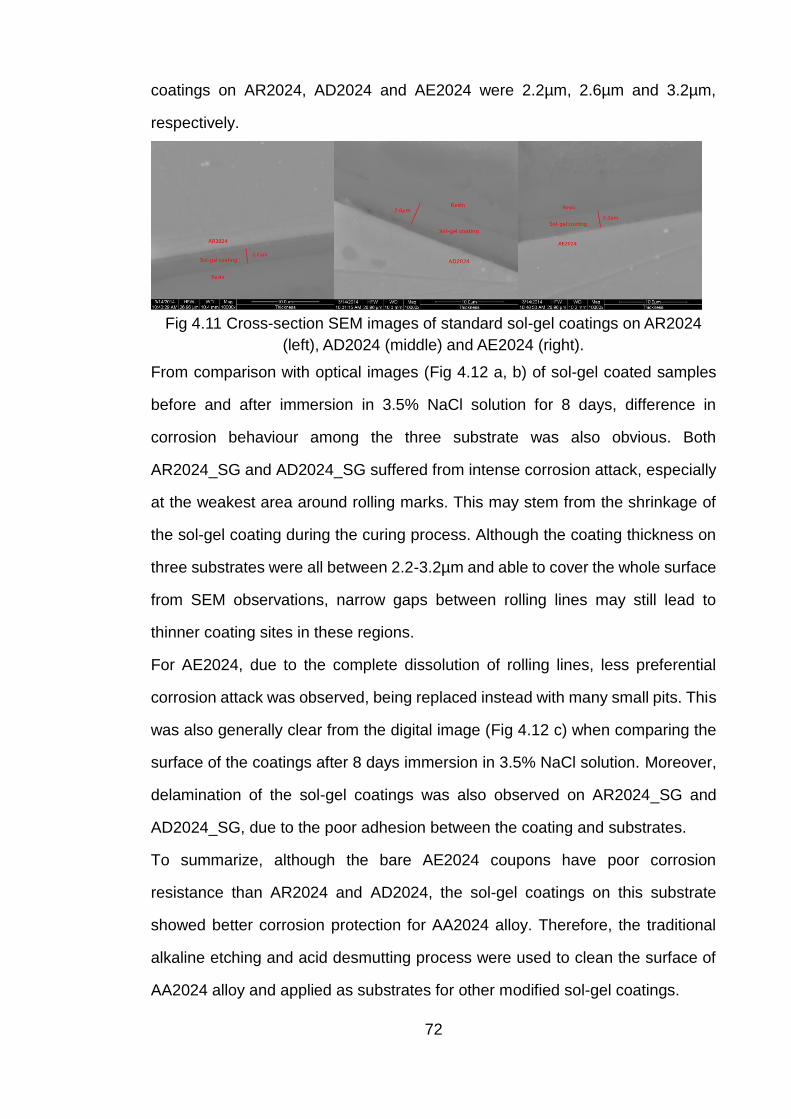
72
coatings on AR2024, AD2024 and AE2024 were 2.2µm, 2.6µm and 3.2µm,
respectively.
Fig 4.11 Cross-section SEM images of standard sol-gel coatings on AR2024
(left), AD2024 (middle) and AE2024 (right).
From comparison with optical images (Fig 4.12 a, b) of sol-gel coated samples
before and after immersion in 3.5% NaCl solution for 8 days, difference in
corrosion behaviour among the three substrate was also obvious. Both
AR2024_SG and AD2024_SG suffered from intense corrosion attack, especially
at the weakest area around rolling marks. This may stem from the shrinkage of
the sol-gel coating during the curing process. Although the coating thickness on
three substrates were all between 2.2-3.2µm and able to cover the whole surface
from SEM observations, narrow gaps between rolling lines may still lead to
thinner coating sites in these regions.
For AE2024, due to the complete dissolution of rolling lines, less preferential
corrosion attack was observed, being replaced instead with many small pits. This
was also generally clear from the digital image (Fig 4.12 c) when comparing the
surface of the coatings after 8 days immersion in 3.5% NaCl solution. Moreover,
delamination of the sol-gel coatings was also observed on AR2024_SG and
AD2024_SG, due to the poor adhesion between the coating and substrates.
To summarize, although the bare AE2024 coupons have poor corrosion
resistance than AR2024 and AD2024, the sol-gel coatings on this substrate
showed better corrosion protection for AA2024 alloy. Therefore, the traditional
alkaline etching and acid desmutting process were used to clean the surface of
AA2024 alloy and applied as substrates for other modified sol-gel coatings.
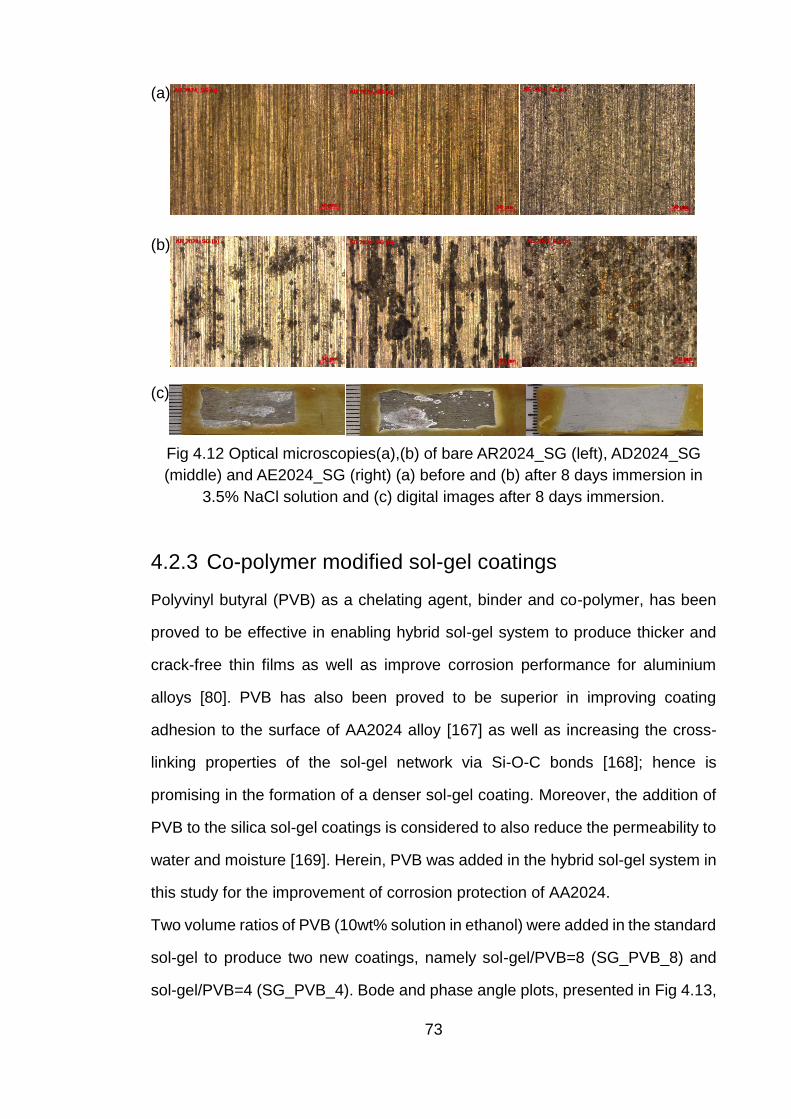
73
(a)
(b)
(c)
Fig 4.12 Optical microscopies(a),(b) of bare AR2024_SG (left), AD2024_SG
(middle) and AE2024_SG (right) (a) before and (b) after 8 days immersion in
3.5% NaCl solution and (c) digital images after 8 days immersion.
4.2.3 Co-polymer modified sol-gel coatings
Polyvinyl butyral (PVB) as a chelating agent, binder and co-polymer, has been
proved to be effective in enabling hybrid sol-gel system to produce thicker and
crack-free thin films as well as improve corrosion performance for aluminium
alloys [80]. PVB has also been proved to be superior in improving coating
adhesion to the surface of AA2024 alloy [167] as well as increasing the cross-
linking properties of the sol-gel network via Si-O-C bonds [168]; hence is
promising in the formation of a denser sol-gel coating. Moreover, the addition of
PVB to the silica sol-gel coatings is considered to also reduce the permeability to
water and moisture [169]. Herein, PVB was added in the hybrid sol-gel system in
this study for the improvement of corrosion protection of AA2024.
Two volume ratios of PVB (10wt% solution in ethanol) were added in the standard
sol-gel to produce two new coatings, namely sol-gel/PVB=8 (SG_PVB_8) and
sol-gel/PVB=4 (SG_PVB_4). Bode and phase angle plots, presented in Fig 4.13,
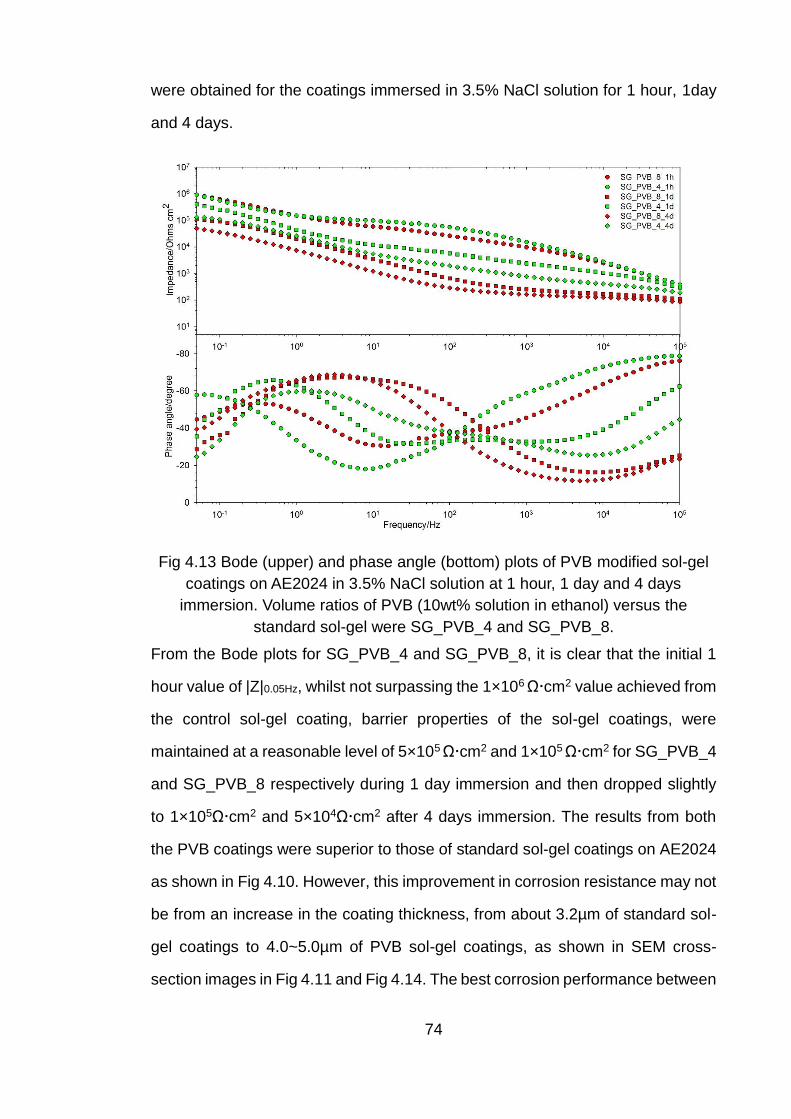
74
were obtained for the coatings immersed in 3.5% NaCl solution for 1 hour, 1day
and 4 days.
Fig 4.13 Bode (upper) and phase angle (bottom) plots of PVB modified sol-gel
coatings on AE2024 in 3.5% NaCl solution at 1 hour, 1 day and 4 days
immersion. Volume ratios of PVB (10wt% solution in ethanol) versus the
standard sol-gel were SG_PVB_4 and SG_PVB_8.
From the Bode plots for SG_PVB_4 and SG_PVB_8, it is clear that the initial 1
hour value of |Z|0.05Hz, whilst not surpassing the 1×10⁶ Ωcm2 value achieved from
the control sol-gel coating, barrier properties of the sol-gel coatings, were
maintained at a reasonable level of 5×10⁵ Ωcm2 and 1×10⁵ Ωcm2 for SG_PVB_4
and SG_PVB_8 respectively during 1 day immersion and then dropped slightly
to 1×10⁵Ωcm2 and 5×10⁴Ωcm2 after 4 days immersion. The results from both
the PVB coatings were superior to those of standard sol-gel coatings on AE2024
as shown in Fig 4.10. However, this improvement in corrosion resistance may not
be from an increase in the coating thickness, from about 3.2µm of standard sol-
gel coatings to 4.0~5.0µm of PVB sol-gel coatings, as shown in SEM cross-
section images in Fig 4.11 and Fig 4.14. The best corrosion performance between
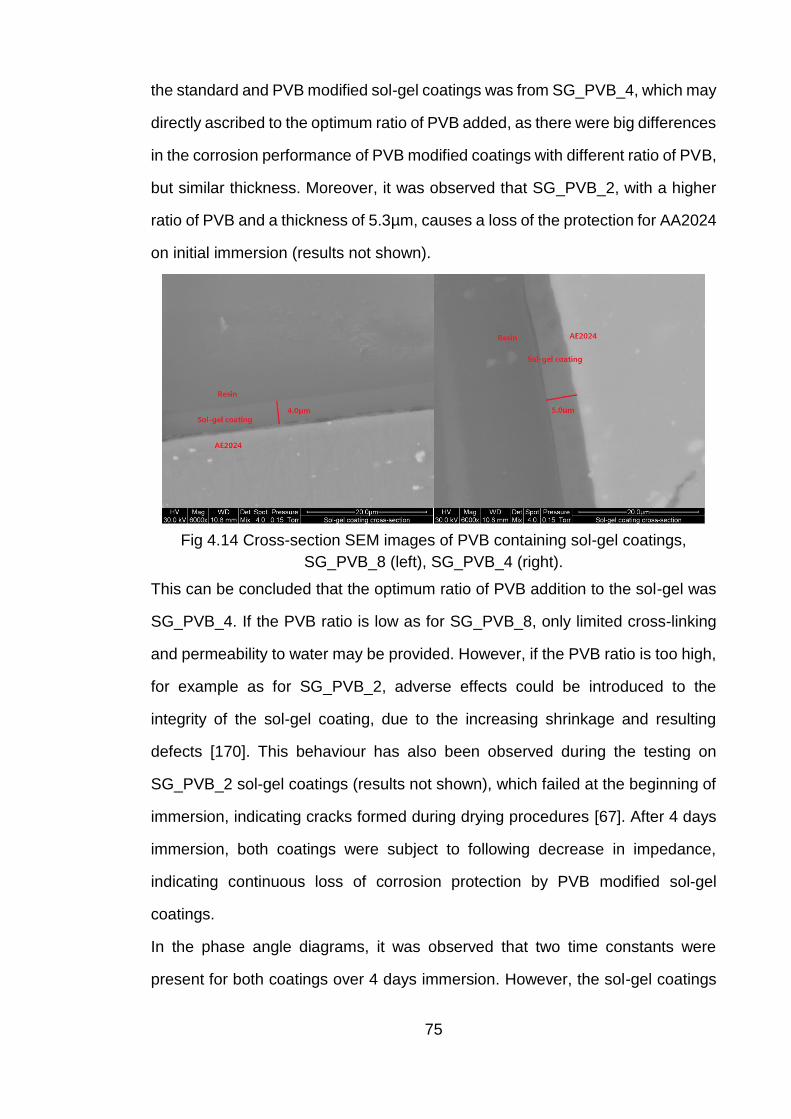
75
the standard and PVB modified sol-gel coatings was from SG_PVB_4, which may
directly ascribed to the optimum ratio of PVB added, as there were big differences
in the corrosion performance of PVB modified coatings with different ratio of PVB,
but similar thickness. Moreover, it was observed that SG_PVB_2, with a higher
ratio of PVB and a thickness of 5.3µm, causes a loss of the protection for AA2024
on initial immersion (results not shown).
Fig 4.14 Cross-section SEM images of PVB containing sol-gel coatings,
SG_PVB_8 (left), SG_PVB_4 (right).
This can be concluded that the optimum ratio of PVB addition to the sol-gel was
SG_PVB_4. If the PVB ratio is low as for SG_PVB_8, only limited cross-linking
and permeability to water may be provided. However, if the PVB ratio is too high,
for example as for SG_PVB_2, adverse effects could be introduced to the
integrity of the sol-gel coating, due to the increasing shrinkage and resulting
defects [170]. This behaviour has also been observed during the testing on
SG_PVB_2 sol-gel coatings (results not shown), which failed at the beginning of
immersion, indicating cracks formed during drying procedures [67]. After 4 days
immersion, both coatings were subject to following decrease in impedance,
indicating continuous loss of corrosion protection by PVB modified sol-gel
coatings.
In the phase angle diagrams, it was observed that two time constants were
present for both coatings over 4 days immersion. However, the sol-gel coatings
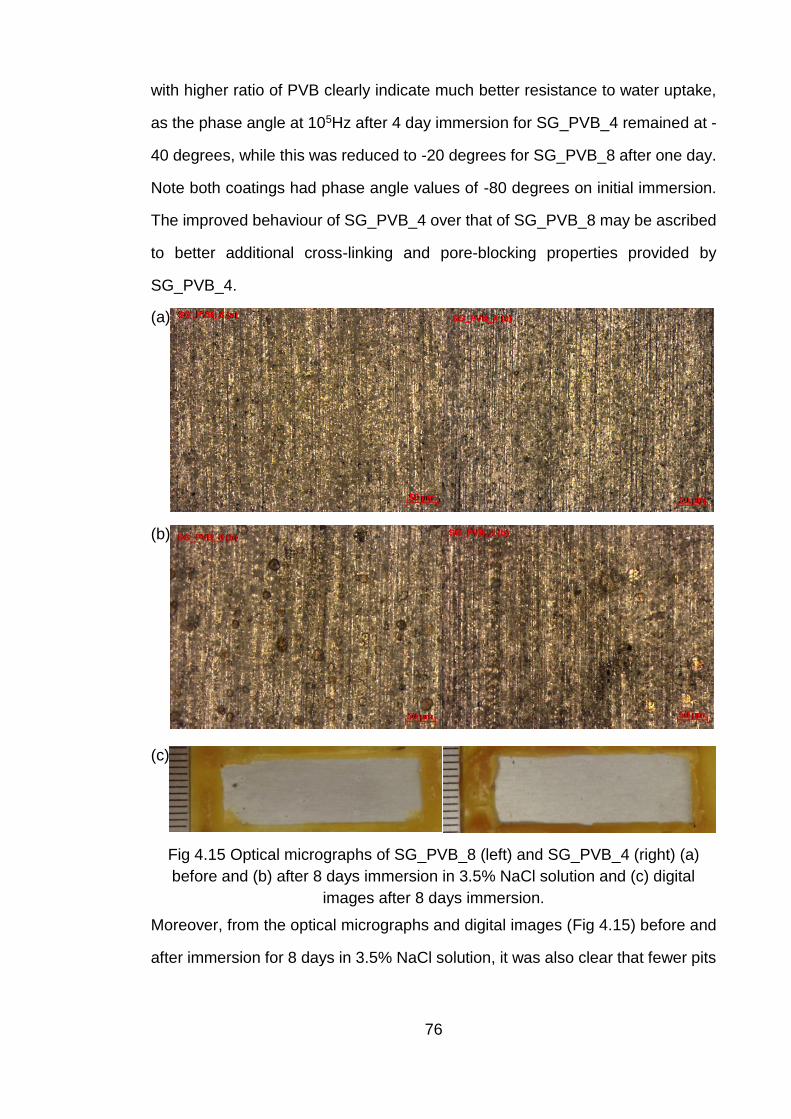
76
with higher ratio of PVB clearly indicate much better resistance to water uptake,
as the phase angle at 105Hz after 4 day immersion for SG_PVB_4 remained at -
40 degrees, while this was reduced to -20 degrees for SG_PVB_8 after one day.
Note both coatings had phase angle values of -80 degrees on initial immersion.
The improved behaviour of SG_PVB_4 over that of SG_PVB_8 may be ascribed
to better additional cross-linking and pore-blocking properties provided by
SG_PVB_4.
(a)
(b)
(c)
Fig 4.15 Optical micrographs of SG_PVB_8 (left) and SG_PVB_4 (right) (a)
before and (b) after 8 days immersion in 3.5% NaCl solution and (c) digital
images after 8 days immersion.
Moreover, from the optical micrographs and digital images (Fig 4.15) before and
after immersion for 8 days in 3.5% NaCl solution, it was also clear that fewer pits
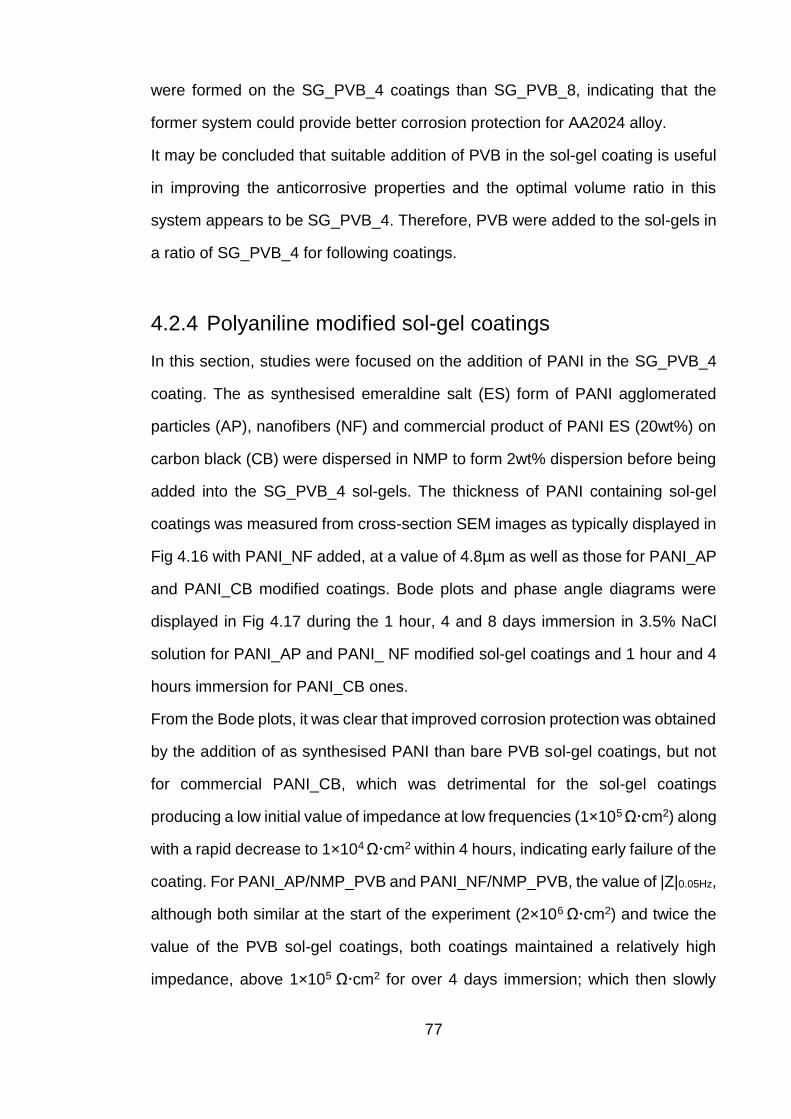
77
were formed on the SG_PVB_4 coatings than SG_PVB_8, indicating that the
former system could provide better corrosion protection for AA2024 alloy.
It may be concluded that suitable addition of PVB in the sol-gel coating is useful
in improving the anticorrosive properties and the optimal volume ratio in this
system appears to be SG_PVB_4. Therefore, PVB were added to the sol-gels in
a ratio of SG_PVB_4 for following coatings.
4.2.4 Polyaniline modified sol-gel coatings
In this section, studies were focused on the addition of PANI in the SG_PVB_4
coating. The as synthesised emeraldine salt (ES) form of PANI agglomerated
particles (AP), nanofibers (NF) and commercial product of PANI ES (20wt%) on
carbon black (CB) were dispersed in NMP to form 2wt% dispersion before being
added into the SG_PVB_4 sol-gels. The thickness of PANI containing sol-gel
coatings was measured from cross-section SEM images as typically displayed in
Fig 4.16 with PANI_NF added, at a value of 4.8µm as well as those for PANI_AP
and PANI_CB modified coatings. Bode plots and phase angle diagrams were
displayed in Fig 4.17 during the 1 hour, 4 and 8 days immersion in 3.5% NaCl
solution for PANI_AP and PANI_ NF modified sol-gel coatings and 1 hour and 4
hours immersion for PANI_CB ones.
From the Bode plots, it was clear that improved corrosion protection was obtained
by the addition of as synthesised PANI than bare PVB sol-gel coatings, but not
for commercial PANI_CB, which was detrimental for the sol-gel coatings
producing a low initial value of impedance at low frequencies (1×10⁵ Ωcm2) along
with a rapid decrease to 1×10⁴ Ωcm2 within 4 hours, indicating early failure of the
coating. For PANI_AP/NMP_PVB and PANI_NF/NMP_PVB, the value of |Z|0.05Hz,
although both similar at the start of the experiment (2×10⁶ Ωcm2) and twice the
value of the PVB sol-gel coatings, both coatings maintained a relatively high
impedance, above 1×10⁵ Ωcm2 for over 4 days immersion; which then slowly
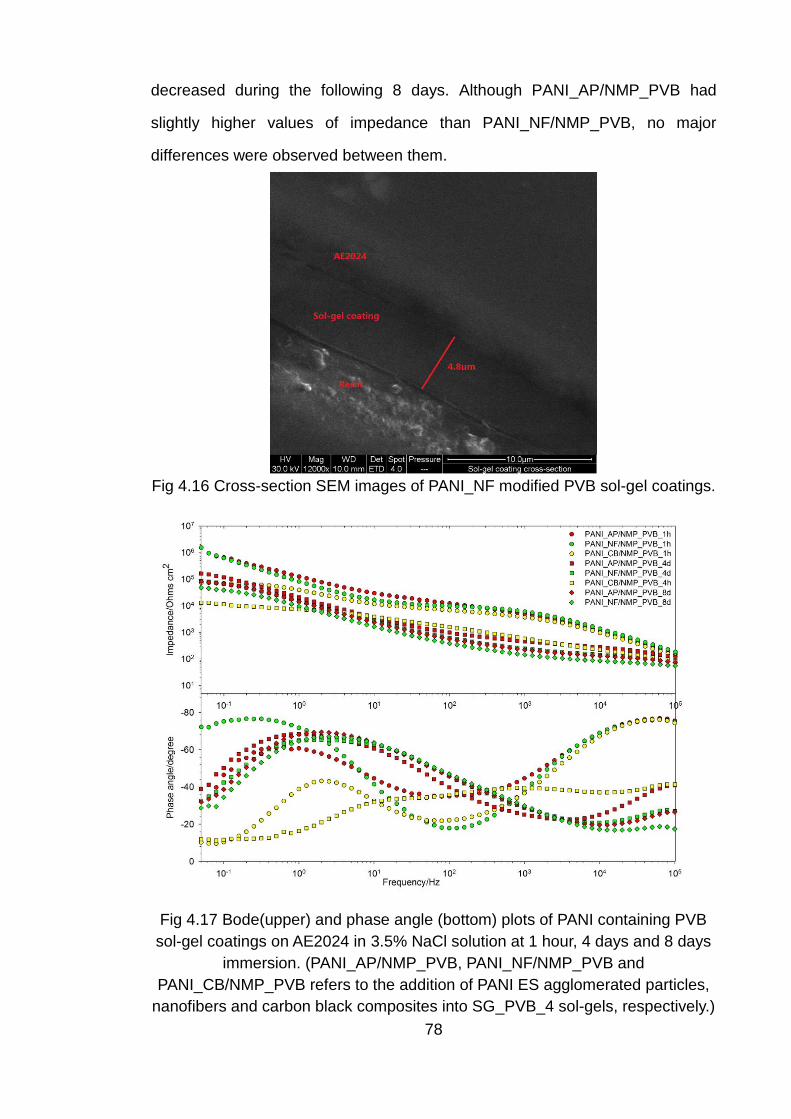
78
decreased during the following 8 days. Although PANI_AP/NMP_PVB had
slightly higher values of impedance than PANI_NF/NMP_PVB, no major
differences were observed between them.
Fig 4.16 Cross-section SEM images of PANI_NF modified PVB sol-gel coatings.
Fig 4.17 Bode(upper) and phase angle (bottom) plots of PANI containing PVB
sol-gel coatings on AE2024 in 3.5% NaCl solution at 1 hour, 4 days and 8 days
immersion. (PANI_AP/NMP_PVB, PANI_NF/NMP_PVB and
PANI_CB/NMP_PVB refers to the addition of PANI ES agglomerated particles,
nanofibers and carbon black composites into SG_PVB_4 sol-gels, respectively.)
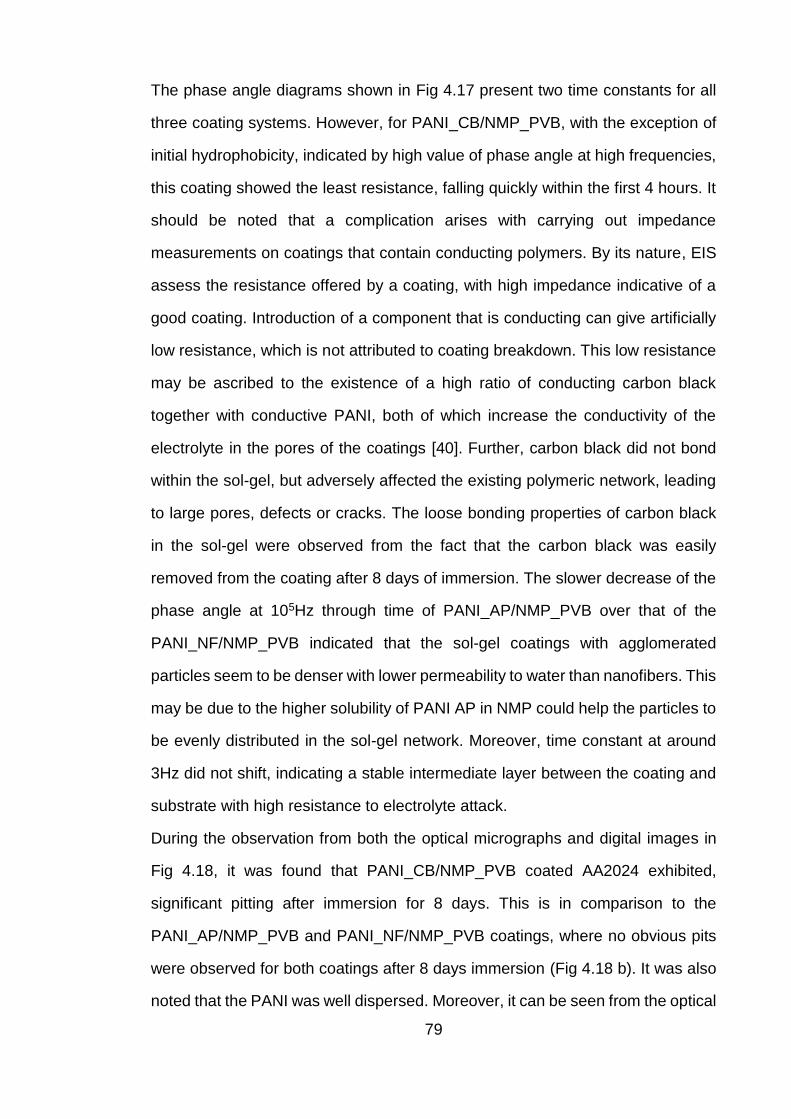
79
The phase angle diagrams shown in Fig 4.17 present two time constants for all
three coating systems. However, for PANI_CB/NMP_PVB, with the exception of
initial hydrophobicity, indicated by high value of phase angle at high frequencies,
this coating showed the least resistance, falling quickly within the first 4 hours. It
should be noted that a complication arises with carrying out impedance
measurements on coatings that contain conducting polymers. By its nature, EIS
assess the resistance offered by a coating, with high impedance indicative of a
good coating. Introduction of a component that is conducting can give artificially
low resistance, which is not attributed to coating breakdown. This low resistance
may be ascribed to the existence of a high ratio of conducting carbon black
together with conductive PANI, both of which increase the conductivity of the
electrolyte in the pores of the coatings [40]. Further, carbon black did not bond
within the sol-gel, but adversely affected the existing polymeric network, leading
to large pores, defects or cracks. The loose bonding properties of carbon black
in the sol-gel were observed from the fact that the carbon black was easily
removed from the coating after 8 days of immersion. The slower decrease of the
phase angle at 105Hz through time of PANI_AP/NMP_PVB over that of the
PANI_NF/NMP_PVB indicated that the sol-gel coatings with agglomerated
particles seem to be denser with lower permeability to water than nanofibers. This
may be due to the higher solubility of PANI AP in NMP could help the particles to
be evenly distributed in the sol-gel network. Moreover, time constant at around
3Hz did not shift, indicating a stable intermediate layer between the coating and
substrate with high resistance to electrolyte attack.
During the observation from both the optical micrographs and digital images in
Fig 4.18, it was found that PANI_CB/NMP_PVB coated AA2024 exhibited,
significant pitting after immersion for 8 days. This is in comparison to the
PANI_AP/NMP_PVB and PANI_NF/NMP_PVB coatings, where no obvious pits
were observed for both coatings after 8 days immersion (Fig 4.18 b). It was also
noted that the PANI was well dispersed. Moreover, it can be seen from the optical
80
images that large PANI AP (1-2µm) was well distributed in the coating, where
smaller size (<1µm) of PANI NF was dispersed. This may be explained by the
differences in both particle size and solubility of the agglomerate and nanofiber
forms of PANI. As PANI agglomerated particles were hard to separate individually,
the size of these particles was bigger than that of the uniform and individually
separated nanofibers. Moreover, as the agglomerated particles have short
polymer chains, they have better solubility in NMP than that of the longer chain
nanofibers which are individually separated. Digital images of the three coatings
after 8 days immersion (Fig 4.18 c) also shows that PANI_CB coatings suffered
from severe pitting corrosion, whilst the synthesised PANI agglomerated particles
and nanofibers coating systems provided greater corrosion protection with no
evidence of pitting. Note, the black sites in the images were actually dark green
PANI particles in the sol-gel coatings.
(a)
(b)
(c)
Fig 4.18 Optical micrographs of PANI_AP/NMP_PVB (left), PANI_NF/NMP_PVB
(middle) and PANI_CB/NMP_PVB (right) (a) before and (b) after 8 days
immersion in 3.5% NaCl solution and (c) Digital images after 8 days immersion.
In summary, NMP dispersion of the PANI ES form of agglomerated particles or
nanofibers within the PVB sol-gel improved the corrosion protection performance
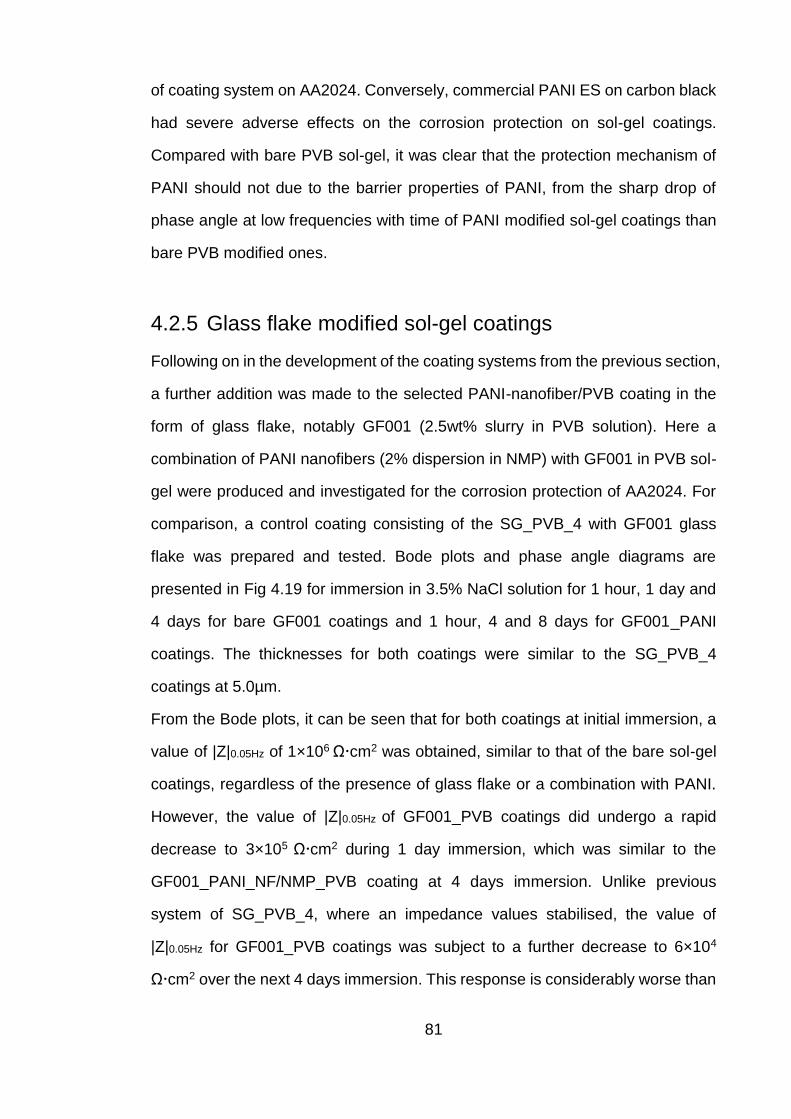
81
of coating system on AA2024. Conversely, commercial PANI ES on carbon black
had severe adverse effects on the corrosion protection on sol-gel coatings.
Compared with bare PVB sol-gel, it was clear that the protection mechanism of
PANI should not due to the barrier properties of PANI, from the sharp drop of
phase angle at low frequencies with time of PANI modified sol-gel coatings than
bare PVB modified ones.
4.2.5 Glass flake modified sol-gel coatings
Following on in the development of the coating systems from the previous section,
a further addition was made to the selected PANI-nanofiber/PVB coating in the
form of glass flake, notably GF001 (2.5wt% slurry in PVB solution). Here a
combination of PANI nanofibers (2% dispersion in NMP) with GF001 in PVB sol-
gel were produced and investigated for the corrosion protection of AA2024. For
comparison, a control coating consisting of the SG_PVB_4 with GF001 glass
flake was prepared and tested. Bode plots and phase angle diagrams are
presented in Fig 4.19 for immersion in 3.5% NaCl solution for 1 hour, 1 day and
4 days for bare GF001 coatings and 1 hour, 4 and 8 days for GF001_PANI
coatings. The thicknesses for both coatings were similar to the SG_PVB_4
coatings at 5.0µm.
From the Bode plots, it can be seen that for both coatings at initial immersion, a
value of |Z|0.05Hz of 1×10⁶ Ωcm2 was obtained, similar to that of the bare sol-gel
coatings, regardless of the presence of glass flake or a combination with PANI.
However, the value of |Z|0.05Hz of GF001_PVB coatings did undergo a rapid
decrease to 3×10⁵ Ωcm2 during 1 day immersion, which was similar to the
GF001_PANI_NF/NMP_PVB coating at 4 days immersion. Unlike previous
system of SG_PVB_4, where an impedance values stabilised, the value of
|Z|0.05Hz for GF001_PVB coatings was subject to a further decrease to 6×10⁴
Ωcm2 over the next 4 days immersion. This response is considerably worse than
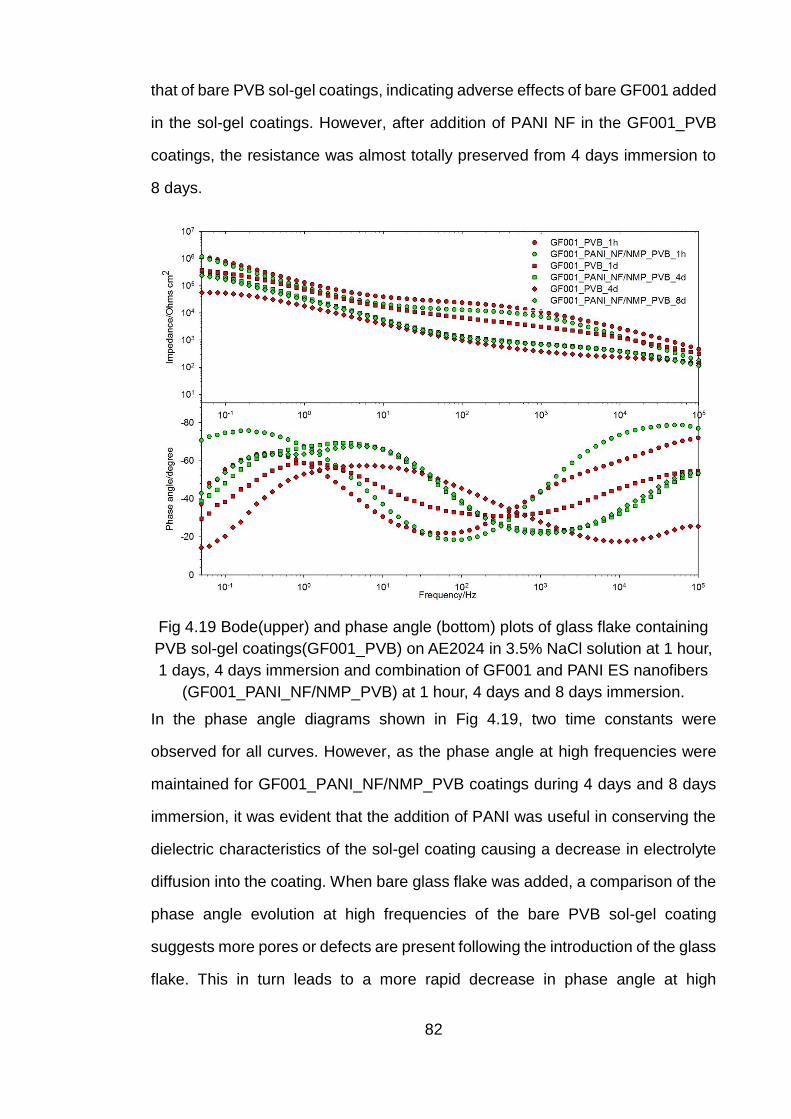
82
that of bare PVB sol-gel coatings, indicating adverse effects of bare GF001 added
in the sol-gel coatings. However, after addition of PANI NF in the GF001_PVB
coatings, the resistance was almost totally preserved from 4 days immersion to
8 days.
Fig 4.19 Bode(upper) and phase angle (bottom) plots of glass flake containing
PVB sol-gel coatings(GF001_PVB) on AE2024 in 3.5% NaCl solution at 1 hour,
1 days, 4 days immersion and combination of GF001 and PANI ES nanofibers
(GF001_PANI_NF/NMP_PVB) at 1 hour, 4 days and 8 days immersion.
In the phase angle diagrams shown in Fig 4.19, two time constants were
observed for all curves. However, as the phase angle at high frequencies were
maintained for GF001_PANI_NF/NMP_PVB coatings during 4 days and 8 days
immersion, it was evident that the addition of PANI was useful in conserving the
dielectric characteristics of the sol-gel coating causing a decrease in electrolyte
diffusion into the coating. When bare glass flake was added, a comparison of the
phase angle evolution at high frequencies of the bare PVB sol-gel coating
suggests more pores or defects are present following the introduction of the glass
flake. This in turn leads to a more rapid decrease in phase angle at high
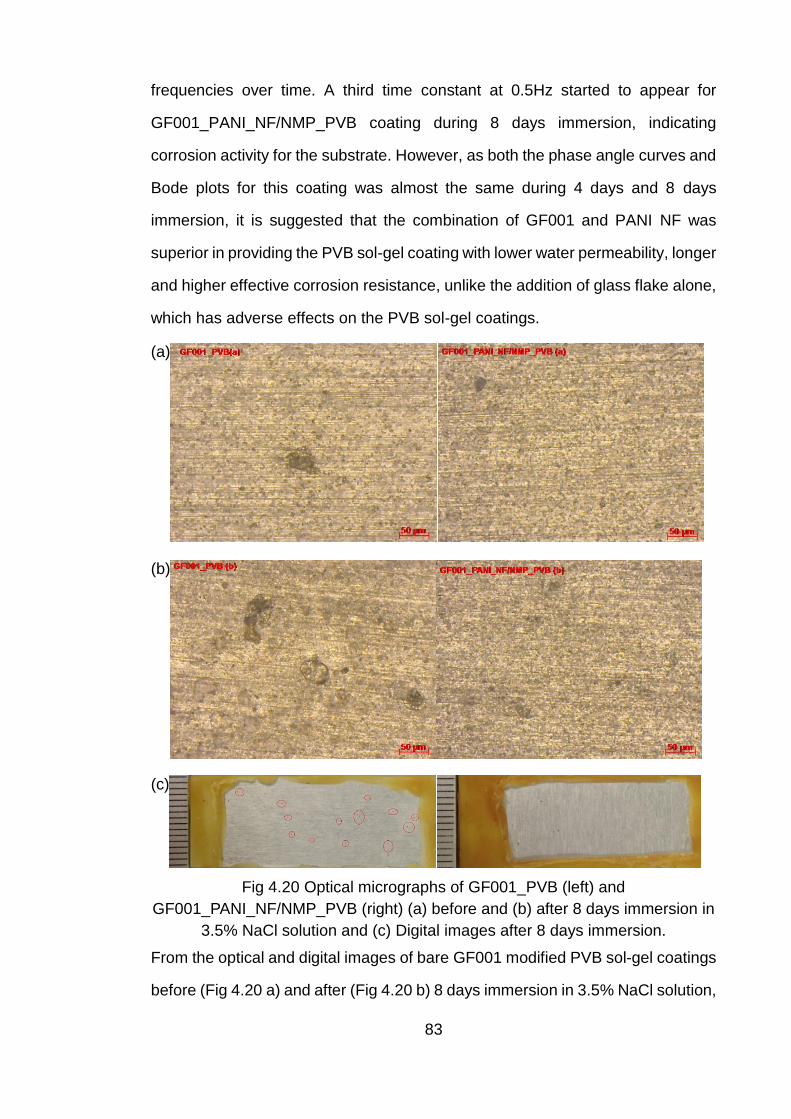
83
frequencies over time. A third time constant at 0.5Hz started to appear for
GF001_PANI_NF/NMP_PVB coating during 8 days immersion, indicating
corrosion activity for the substrate. However, as both the phase angle curves and
Bode plots for this coating was almost the same during 4 days and 8 days
immersion, it is suggested that the combination of GF001 and PANI NF was
superior in providing the PVB sol-gel coating with lower water permeability, longer
and higher effective corrosion resistance, unlike the addition of glass flake alone,
which has adverse effects on the PVB sol-gel coatings.
(a)
(b)
(c)
Fig 4.20 Optical micrographs of GF001_PVB (left) and
GF001_PANI_NF/NMP_PVB (right) (a) before and (b) after 8 days immersion in
3.5% NaCl solution and (c) Digital images after 8 days immersion.
From the optical and digital images of bare GF001 modified PVB sol-gel coatings
before (Fig 4.20 a) and after (Fig 4.20 b) 8 days immersion in 3.5% NaCl solution,

84
it can be seen that pits were introduced by the presence of glass flake, which was
more obvious from the corresponding digital images in Fig 4.20 c (most pits were
labelled in the red circles). There was almost no change in the
GF001_PANI_NF/NMP_PVB coating after immersion from the images (note,
black points on digital image were PANI particles). Small glass flake
(diameter<50µm) was observed in the sol-gel coatings, however, bare addition
of GF001 did lead to adverse effects on bare PVB coatings. This may be due to
the destructive properties of glass flake to the sol-gel network, leading to direct
attack of electrolyte on the substrate, through the formation of a weaker network
in the coatings. However, the introduction of PANI NF did bring a level of stability
through the formation of an intermediate layer, working in combination with the
glass flake that provided a barrier to the electrolyte, giving the resulting good
anticorrosive properties of the sol-gel coating.
4.3 Properties of the sol-gel coatings
4.3.1 Contact angle measurements
The hydrophobicity of the surface of both bare AA2024 and various prepared sol-
gel coatings were assessed using water contact angle measurements. Average
results of ten measurements on each sample are displayed in Fig 4.21.
It can be seen from the results that the surface of bare AA2024 was increased by
conducting surface pre-treatments, especially for AE2024. The rough and smooth
surface as well as the residual hydroxyl ions, obtained by alkaline etching and
acid desmutting can be seen in the SEM images (Fig 4.3), which were reasonable
for a hydrophobic surface with the highest contact angle of 92.3° among all the
samples. The surface of the as-received and acid desmutted bare AA2024
showed low contact angles of 67° and 74°, respectively, which were more
hydrophilic and may due to the roughness of their surface and the native oxide
layer. Although the contact angle for AE2024_SG was the highest among the
85
three SG-only coatings, they were all hydrophilic with contact angle lower than
90° [171].
Fig 4.21 Contact angle for the surface of bare AA2024 and various sol-gel
coatings.
After the addition of PVB in the sol-gel, the contact angles were all decreased to
75° by the two ratios. This may stems from the hydrophilic properties of the PVB,
whose pure thin film has a value of 60° for contact angle [172]. When PANI was
added in the sol-gel, the values for contact angle were all increased by about 10
degrees compared with SG_PVB coatings, especially for PANI nanofibers, which
are known to be superhydrophobic with a water contact angle up to 164.5° [173].
The influence of PANI in increasing the hydrophobicity of the sol-gel coatings was
also shown when comparing the results of the last two samples. If glass flake was
added in the SG_PVB_4 coatings, very small increase (3 degrees from 75° to
78°) was obtained. However, when PANI nanofibers were added together with
glass flake, the hydrophobicity of the coating was similar to those without glass
flake of PANI_NF/NMP_PVB coatings with the same value of 87°.
4.3.2 Cross-hatch adhesion tests
The adhesion strength between the sol-gel coatings and the substrate is vital for
the performance of sol-gel coatings if they are to be used commercially as a pre-
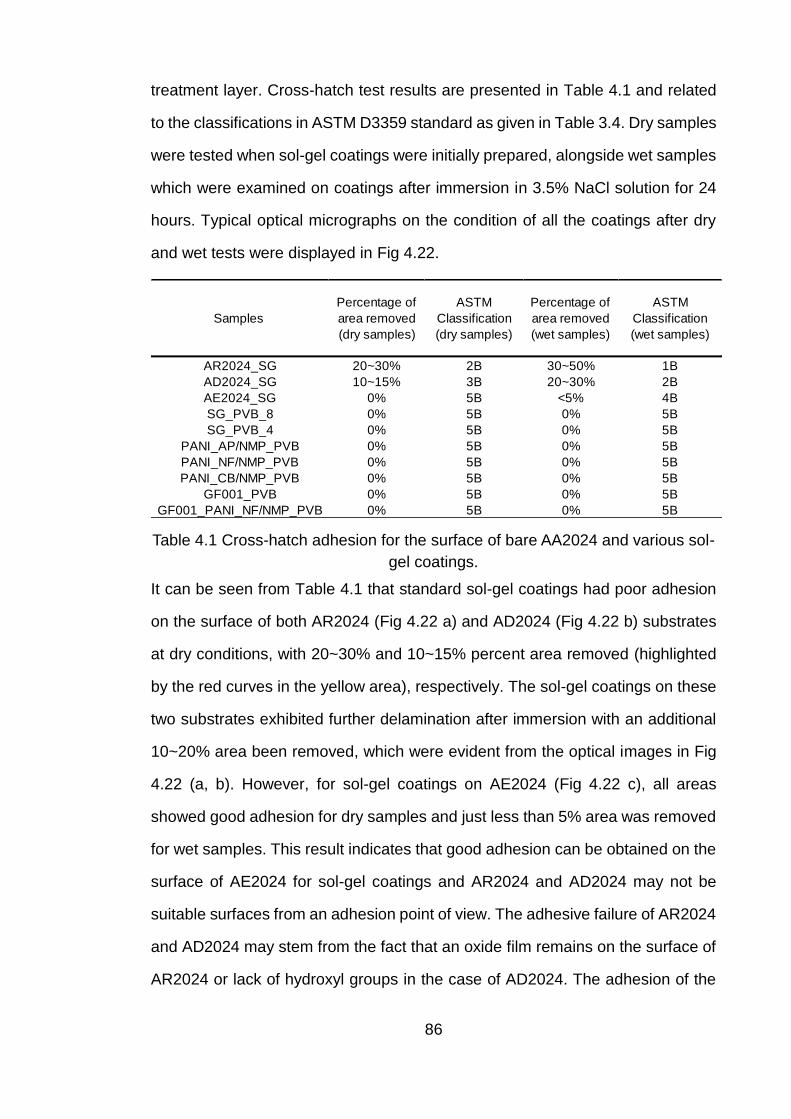
86
treatment layer. Cross-hatch test results are presented in Table 4.1 and related
to the classifications in ASTM D3359 standard as given in Table 3.4. Dry samples
were tested when sol-gel coatings were initially prepared, alongside wet samples
which were examined on coatings after immersion in 3.5% NaCl solution for 24
hours. Typical optical micrographs on the condition of all the coatings after dry
and wet tests were displayed in Fig 4.22.
Table 4.1 Cross-hatch adhesion for the surface of bare AA2024 and various sol-
gel coatings.
It can be seen from Table 4.1 that standard sol-gel coatings had poor adhesion
on the surface of both AR2024 (Fig 4.22 a) and AD2024 (Fig 4.22 b) substrates
at dry conditions, with 20~30% and 10~15% percent area removed (highlighted
by the red curves in the yellow area), respectively. The sol-gel coatings on these
two substrates exhibited further delamination after immersion with an additional
10~20% area been removed, which were evident from the optical images in Fig
4.22 (a, b). However, for sol-gel coatings on AE2024 (Fig 4.22 c), all areas
showed good adhesion for dry samples and just less than 5% area was removed
for wet samples. This result indicates that good adhesion can be obtained on the
surface of AE2024 for sol-gel coatings and AR2024 and AD2024 may not be
suitable surfaces from an adhesion point of view. The adhesive failure of AR2024
and AD2024 may stem from the fact that an oxide film remains on the surface of
AR2024 or lack of hydroxyl groups in the case of AD2024. The adhesion of the
AR2024_SG 20~30% 2B 30~50% 1B
AD2024_SG 10~15% 3B 20~30% 2B
AE2024_SG 0% 5B <5% 4B
SG_PVB_8 0% 5B 0% 5B
SG_PVB_4 0% 5B 0% 5B
PANI_AP/NMP_PVB 0% 5B 0% 5B
PANI_NF/NMP_PVB 0% 5B 0% 5B
PANI_CB/NMP_PVB 0% 5B 0% 5B
GF001_PVB 0% 5B 0% 5B
GF001_PANI_NF/NMP_PVB 0% 5B 0% 5B
Percentage of
area removed
(wet samples)
Samples
Percentage of
area removed
(dry samples)
ASTM
Classification
(dry samples)
ASTM
Classification
(wet samples)
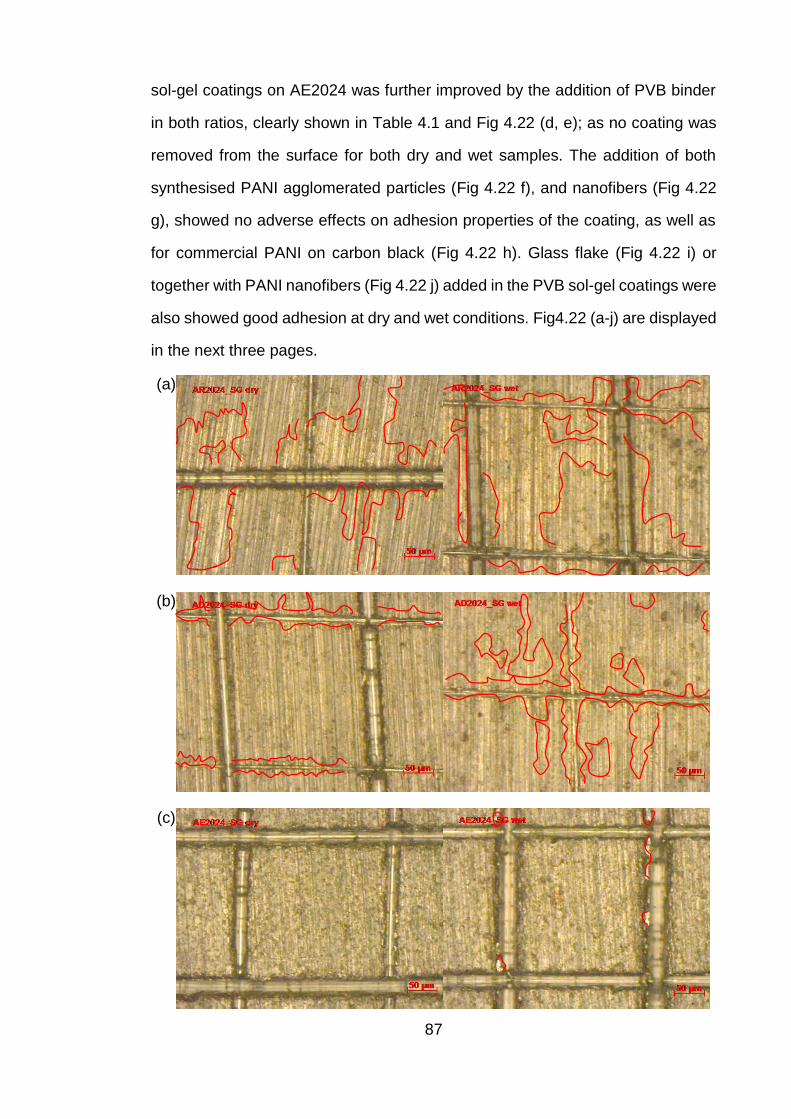
87
sol-gel coatings on AE2024 was further improved by the addition of PVB binder
in both ratios, clearly shown in Table 4.1 and Fig 4.22 (d, e); as no coating was
removed from the surface for both dry and wet samples. The addition of both
synthesised PANI agglomerated particles (Fig 4.22 f), and nanofibers (Fig 4.22
g), showed no adverse effects on adhesion properties of the coating, as well as
for commercial PANI on carbon black (Fig 4.22 h). Glass flake (Fig 4.22 i) or
together with PANI nanofibers (Fig 4.22 j) added in the PVB sol-gel coatings were
also showed good adhesion at dry and wet conditions. Fig4.22 (a-j) are displayed
in the next three pages.
(a)
(b)
(c)

88
(d)
(e)
(f)
(g)
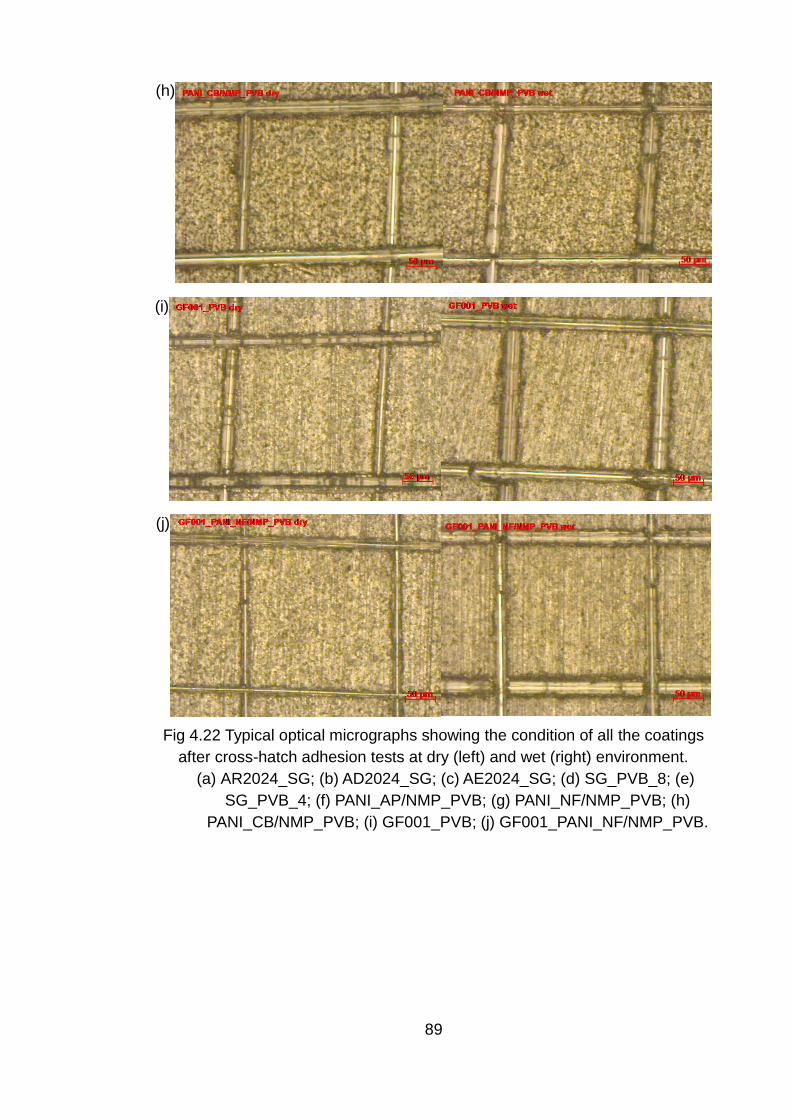
89
(h)
(i)
(j)
Fig 4.22 Typical optical micrographs showing the condition of all the coatings
after cross-hatch adhesion tests at dry (left) and wet (right) environment.
(a) AR2024_SG; (b) AD2024_SG; (c) AE2024_SG; (d) SG_PVB_8; (e)
SG_PVB_4; (f) PANI_AP/NMP_PVB; (g) PANI_NF/NMP_PVB; (h)
PANI_CB/NMP_PVB; (i) GF001_PVB; (j) GF001_PANI_NF/NMP_PVB.
90
Chapter 5 Discussion
5.1 Preparation of materials
5.1.1 Surface pre-treatments of AA2024 alloy
The surface cleaning of AA2024 alloy is typically undertaken for the removal of
organic contaminants, native oxide layer and any corrosion product to aid
bonding between the deposited sol-gel coatings and the substrates [174].
Acetone degreasing was used for organic contaminants, such as oils and greases.
However, the native oxide film still remained on the surface of the substrate.
Whilst this is corrosion resistant, it has variable reactivity with the sol-gel, leading
to variable adhesion of the applied coatings. Therefore, it is crucial to further treat
the alloy with alkaline and/or acid solution to remove the oxide layer and any
possible corrosion products.
For the application of AA2024 alloy in aerospace industry, alkaline etching and/or
acid desmutting are usually applied for cleaning prior to the deposition of coatings.
The native oxide film on the surface of AA2024 is mainly composed of Al2O3 and
MgO [175]. During alkaline etching, usually concentrated sodium hydroxide
solution, Al2O3 will dissolve according to equation (5.1), leaving a black ‘smut’ of
loosely bound intermetallic material and magnesium rich oxide film, along with
other alkali-insoluble components, such as copper.
(5.1)
Therefore, it is essential to apply acid pickling, usually concentrated nitric acid, to
remove the smut on the surface. The desmutting process will dissolve the MgO
(equation (5.2)) and/or Mg(OH)2 (equation (5.3)) on the surface.
(5.2)
(5.3)
Moreover, the copper on the surface will also be partially removed in
concentrated HNO3 (e.g. 3M and 50%) according to equation (5.4), (5.5), leaving
Al2O3 +2OH-→ 2AlO2-+H2O
MgO+2H+→Mg2++H2O
Mg(OH)2+2H+→Mg2++2H2O

91
a blue solution and clean surface of AA2024. Residual Cu may still be kept after
acidic treatment, due either to the replacement of dissolved Cu from alloy matrix
by Al (equation (5.6)) or preferentially dissolution of Al matrix (equation (5.7)),
which leaves undissolved solid Cu on the surface [171].
(5.4)
(5.5)
(5.6)
(5.7)
It is also important to note that the alloy matrix, typically aluminium, although
underneath the oxide film, may still be dissolved during both alkaline etching
(equation (5.8)) and acid desmutting (equation (5.7)).
(5.8)
The comprehensive action of all the above processes during traditional alkaline
etching and acid desmutting produces a clean, uniform and chemically active
surface of AA2024 alloy with suitable texture and smooth appearance, as seen
in Fig 4.3 (a, b). If only acid desmutting is applied, the oxide film, being less active
in the solution than copper-containing intermetallic particles (IMPs) on the surface,
can cause dealloying of IMPs to be initiated followed by dissolution of copper
[150]. The preferential dissolution of IMPs in this process would finally produce
significant cavities in the surface, as shown in Fig 4.2 b.
5.1.2 Synthesis of nanostructured polyaniline
During the synthesis of PANI in this study, the chemical oxidative polymerization
of aniline (ANI) in aqueous solution of 1M HNO3 with the presence of ammonium
persulphate (APS) was successfully used to prepare PANI agglomerated
particles and PANI nanofibers via slow-mixing and rapid-mixing methods,
respectively.
Cu+4HNO3→Cu(NO3)2+2NO2+2H2O
3Cu+8HNO3→3Cu(NO3)2+2NO+4H2O
3Cu2++2Al→3Cu+2Al3+
2Al+6H+→2Al3++3H2
2Al+2OH-+2H20→2AlO2-+3H2
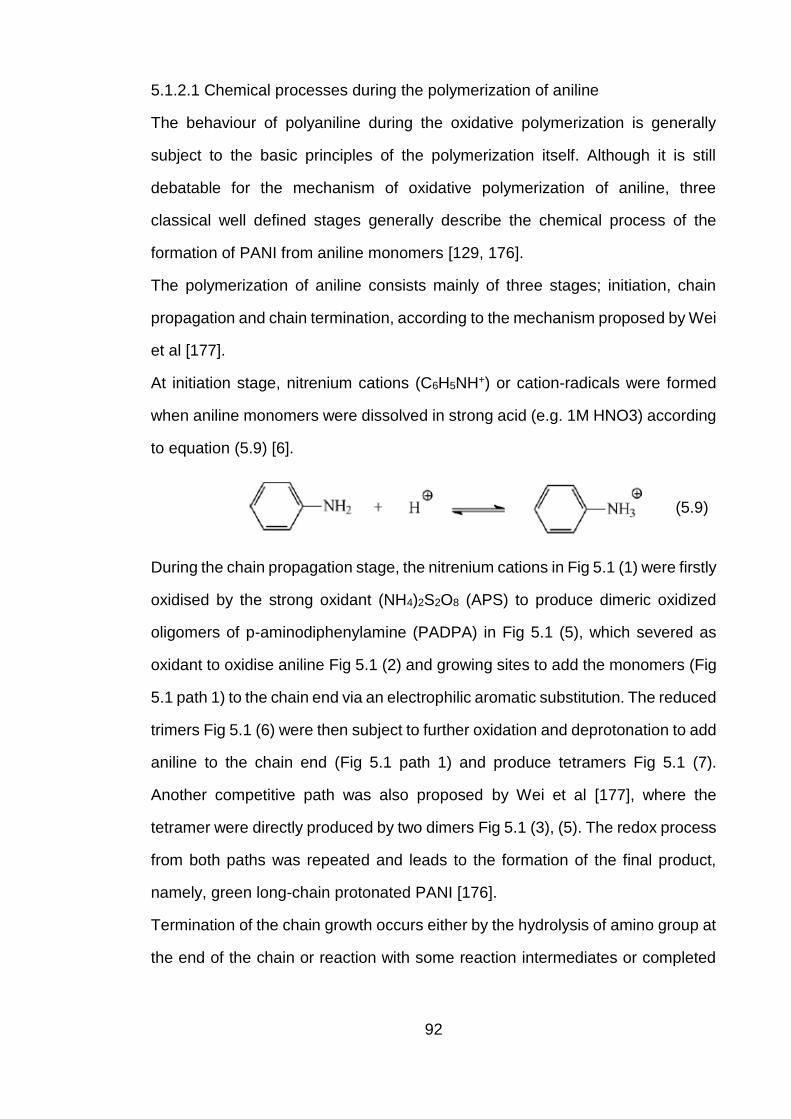
92
5.1.2.1 Chemical processes during the polymerization of aniline
The behaviour of polyaniline during the oxidative polymerization is generally
subject to the basic principles of the polymerization itself. Although it is still
debatable for the mechanism of oxidative polymerization of aniline, three
classical well defined stages generally describe the chemical process of the
formation of PANI from aniline monomers [129, 176].
The polymerization of aniline consists mainly of three stages; initiation, chain
propagation and chain termination, according to the mechanism proposed by Wei
et al [177].
At initiation stage, nitrenium cations (C6H5NH+) or cation-radicals were formed
when aniline monomers were dissolved in strong acid (e.g. 1M HNO3) according
to equation (5.9) [6].
(5.9)
During the chain propagation stage, the nitrenium cations in Fig 5.1 (1) were firstly
oxidised by the strong oxidant (NH4)2S2O8 (APS) to produce dimeric oxidized
oligomers of p-aminodiphenylamine (PADPA) in Fig 5.1 (5), which severed as
oxidant to oxidise aniline Fig 5.1 (2) and growing sites to add the monomers (Fig
5.1 path 1) to the chain end via an electrophilic aromatic substitution. The reduced
trimers Fig 5.1 (6) were then subject to further oxidation and deprotonation to add
aniline to the chain end (Fig 5.1 path 1) and produce tetramers Fig 5.1 (7).
Another competitive path was also proposed by Wei et al [177], where the
tetramer were directly produced by two dimers Fig 5.1 (3), (5). The redox process
from both paths was repeated and leads to the formation of the final product,
namely, green long-chain protonated PANI [176].
Termination of the chain growth occurs either by the hydrolysis of amino group at
the end of the chain or reaction with some reaction intermediates or completed
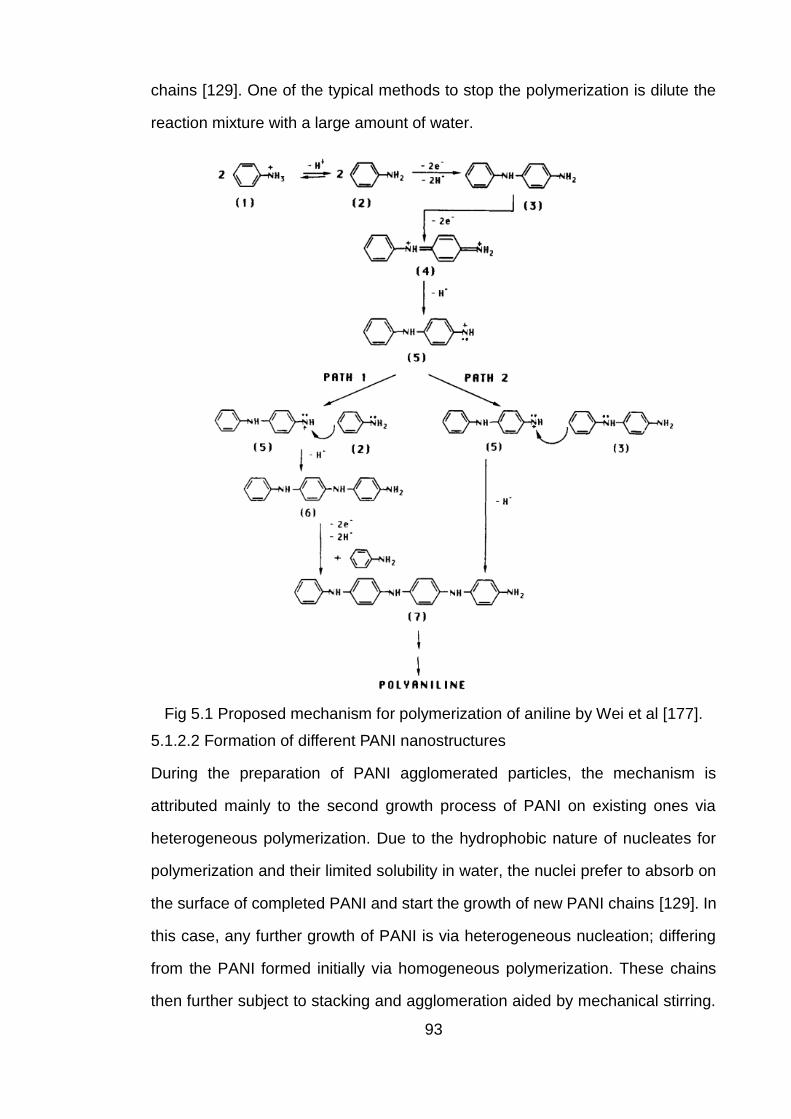
93
chains [129]. One of the typical methods to stop the polymerization is dilute the
reaction mixture with a large amount of water.
Fig 5.1 Proposed mechanism for polymerization of aniline by Wei et al [177].
5.1.2.2 Formation of different PANI nanostructures
During the preparation of PANI agglomerated particles, the mechanism is
attributed mainly to the second growth process of PANI on existing ones via
heterogeneous polymerization. Due to the hydrophobic nature of nucleates for
polymerization and their limited solubility in water, the nuclei prefer to absorb on
the surface of completed PANI and start the growth of new PANI chains [129]. In
this case, any further growth of PANI is via heterogeneous nucleation; differing
from the PANI formed initially via homogeneous polymerization. These chains
then further subject to stacking and agglomeration aided by mechanical stirring.
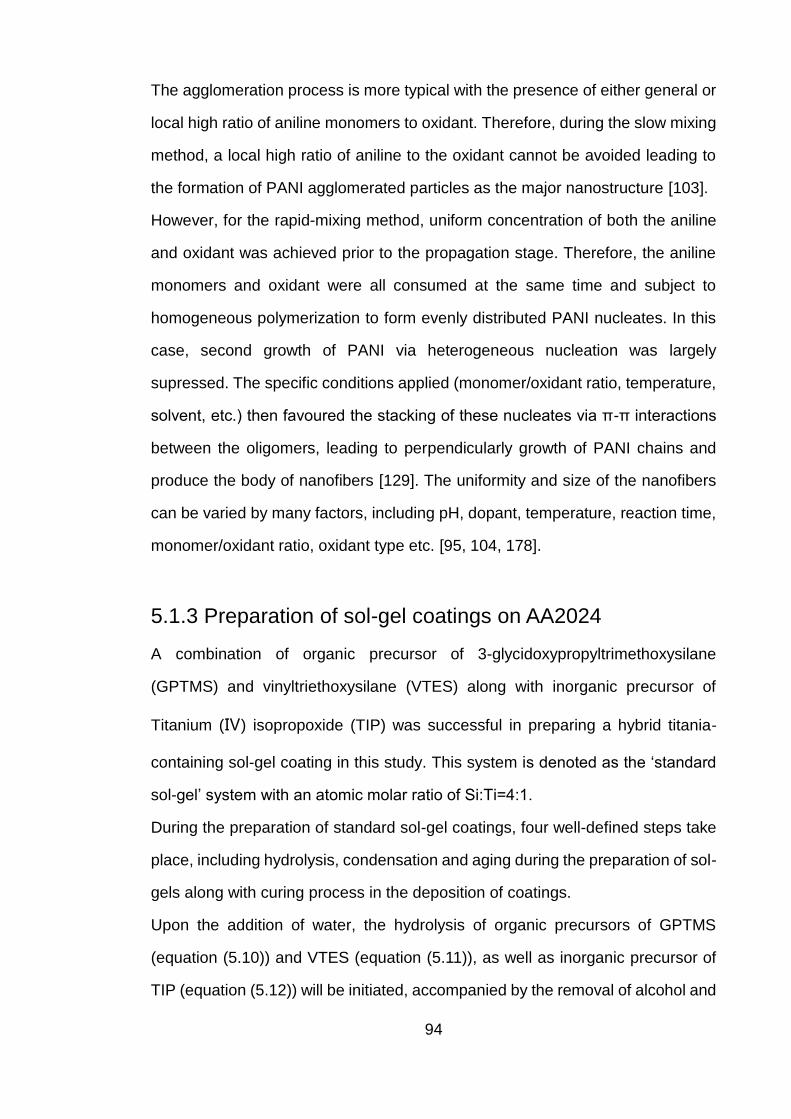
94
The agglomeration process is more typical with the presence of either general or
local high ratio of aniline monomers to oxidant. Therefore, during the slow mixing
method, a local high ratio of aniline to the oxidant cannot be avoided leading to
the formation of PANI agglomerated particles as the major nanostructure [103].
However, for the rapid-mixing method, uniform concentration of both the aniline
and oxidant was achieved prior to the propagation stage. Therefore, the aniline
monomers and oxidant were all consumed at the same time and subject to
homogeneous polymerization to form evenly distributed PANI nucleates. In this
case, second growth of PANI via heterogeneous nucleation was largely
supressed. The specific conditions applied (monomer/oxidant ratio, temperature,
solvent, etc.) then favoured the stacking of these nucleates via π-π interactions
between the oligomers, leading to perpendicularly growth of PANI chains and
produce the body of nanofibers [129]. The uniformity and size of the nanofibers
can be varied by many factors, including pH, dopant, temperature, reaction time,
monomer/oxidant ratio, oxidant type etc. [95, 104, 178].
5.1.3 Preparation of sol-gel coatings on AA2024
A combination of organic precursor of 3-glycidoxypropyltrimethoxysilane
(GPTMS) and vinyltriethoxysilane (VTES) along with inorganic precursor of
Titanium (Ⅳ) isopropoxide (TIP) was successful in preparing a hybrid titania-
containing sol-gel coating in this study. This system is denoted as the ‘standard
sol-gel’ system with an atomic molar ratio of Si:Ti=4:1.
During the preparation of standard sol-gel coatings, four well-defined steps take
place, including hydrolysis, condensation and aging during the preparation of sol-
gels along with curing process in the deposition of coatings.
Upon the addition of water, the hydrolysis of organic precursors of GPTMS
(equation (5.10)) and VTES (equation (5.11)), as well as inorganic precursor of
TIP (equation (5.12)) will be initiated, accompanied by the removal of alcohol and

95
formation of hydroxyl groups. In the hydrolysis of both organic and inorganic
precursors, acidified water was used as the catalyst and ethyl acetoacetate (AcEt)
was added as a complexing agent to control the reactivity of TIP.
(5.10) [82]
(5.11)
(5.12) [82]
Two types of process were involved during the condensation stage, notably,
homo-condensation between the same hydroxylated species (equation (5.13),
(5.14)) and heter-condensation between the different ones (equation (5.15)).
Moreover, the relatively slow condensation process of organic species would be
accelerated by inorganic species [179]. Thus, with a combination of saline and
metal alkoxides, a significant degree of condensation can be achieved within a
short time for hybrid sol-gels.
(5.13) [82]
(5.14) [82]
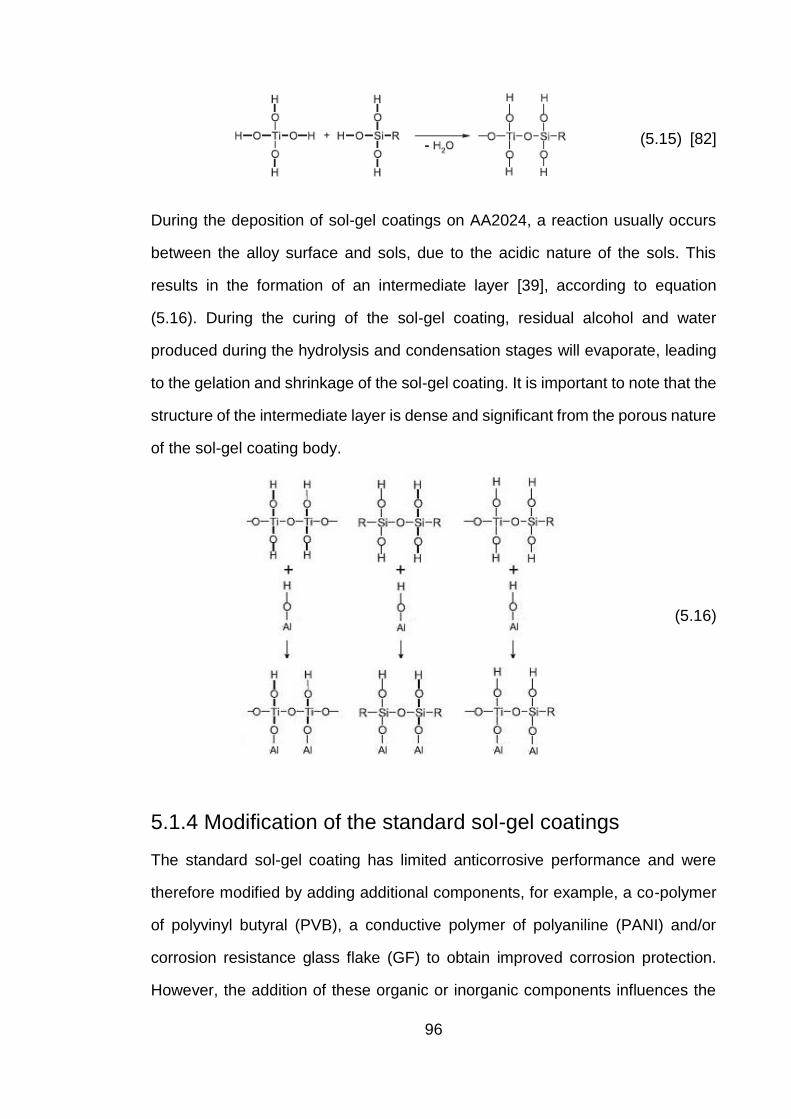
96
(5.15) [82]
During the deposition of sol-gel coatings on AA2024, a reaction usually occurs
between the alloy surface and sols, due to the acidic nature of the sols. This
results in the formation of an intermediate layer [39], according to equation
(5.16). During the curing of the sol-gel coating, residual alcohol and water
produced during the hydrolysis and condensation stages will evaporate, leading
to the gelation and shrinkage of the sol-gel coating. It is important to note that the
structure of the intermediate layer is dense and significant from the porous nature
of the sol-gel coating body.
(5.16)
5.1.4 Modification of the standard sol-gel coatings
The standard sol-gel coating has limited anticorrosive performance and were
therefore modified by adding additional components, for example, a co-polymer
of polyvinyl butyral (PVB), a conductive polymer of polyaniline (PANI) and/or
corrosion resistance glass flake (GF) to obtain improved corrosion protection.
However, the addition of these organic or inorganic components influences the

97
properties of the standard sol-gel coating, i.e., thermal and chemical properties.
Thus, possible effects on the addition of these components are discussed.
5.1.4.1 Influence on thermal properties
To study whether thermal stability was still achieved using a fixed curing
temperature at 120℃ for 2 hours, DSC/TG analysis was performed on xerogel
samples, which were produced as described in section 3.2.3. Fig 5.2 showed the
DSC/TG curves for a standard sol-gel, a PVB_4 sol-gel, a PANI_NF/NMP_PVB
sol-gel and a GF001_PVB modified sol-gel.
Fig 5.2 DSC/TG curves for standard sol-gel and PVB, PANI, GF001 modified
sol-gel.
It was clear from TG curves that an initial steep weight loss occurred at 35~50℃,
with similar glass transition points between 50~60℃ for all four sol-gels. The
weight loss during this stage may due to the loss of residual alcohol within the
sol-gels [180]. Four similar broad endothermic peaks were observed between
120 and 200℃ for all sol-gels, with simultaneous small weight loss. These
processes can be ascribed to the desorption of physically absorbed water
molecules [181]. A sharp exothermic peak and increased weight loss was
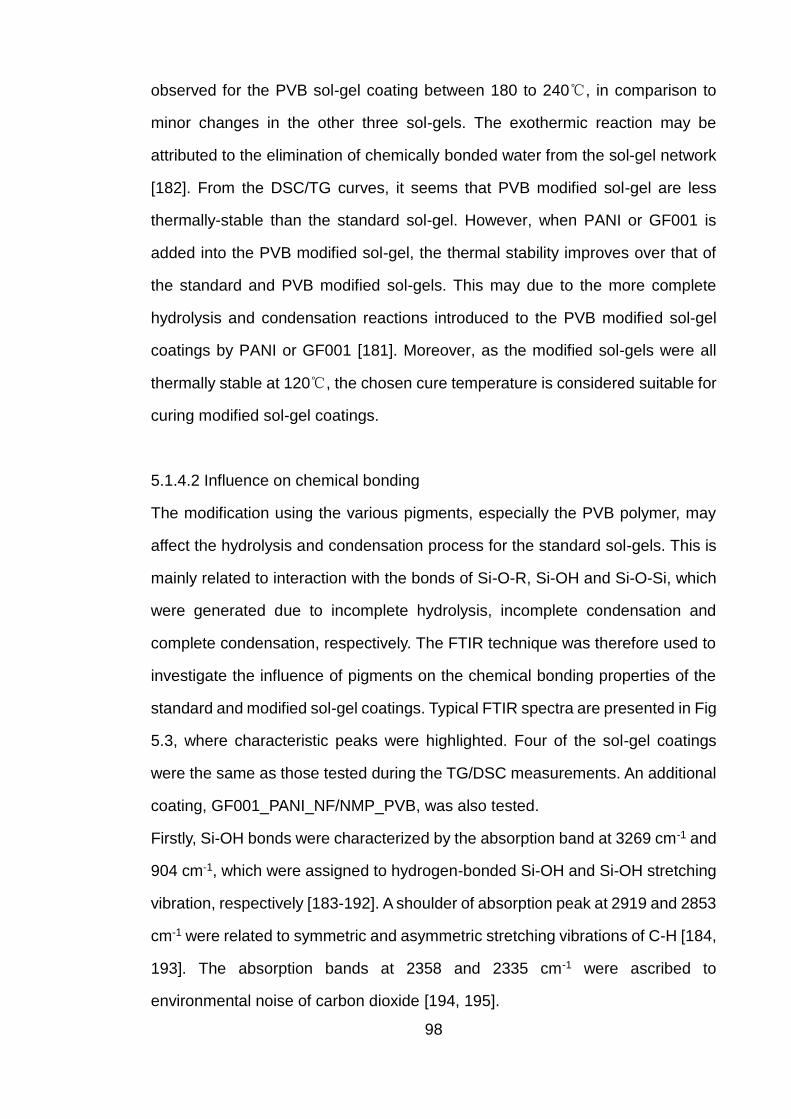
98
observed for the PVB sol-gel coating between 180 to 240℃, in comparison to
minor changes in the other three sol-gels. The exothermic reaction may be
attributed to the elimination of chemically bonded water from the sol-gel network
[182]. From the DSC/TG curves, it seems that PVB modified sol-gel are less
thermally-stable than the standard sol-gel. However, when PANI or GF001 is
added into the PVB modified sol-gel, the thermal stability improves over that of
the standard and PVB modified sol-gels. This may due to the more complete
hydrolysis and condensation reactions introduced to the PVB modified sol-gel
coatings by PANI or GF001 [181]. Moreover, as the modified sol-gels were all
thermally stable at 120℃, the chosen cure temperature is considered suitable for
curing modified sol-gel coatings.
5.1.4.2 Influence on chemical bonding
The modification using the various pigments, especially the PVB polymer, may
affect the hydrolysis and condensation process for the standard sol-gels. This is
mainly related to interaction with the bonds of Si-O-R, Si-OH and Si-O-Si, which
were generated due to incomplete hydrolysis, incomplete condensation and
complete condensation, respectively. The FTIR technique was therefore used to
investigate the influence of pigments on the chemical bonding properties of the
standard and modified sol-gel coatings. Typical FTIR spectra are presented in Fig
5.3, where characteristic peaks were highlighted. Four of the sol-gel coatings
were the same as those tested during the TG/DSC measurements. An additional
coating, GF001_PANI_NF/NMP_PVB, was also tested.
Firstly, Si-OH bonds were characterized by the absorption band at 3269 cm-1 and
904 cm-1, which were assigned to hydrogen-bonded Si-OH and Si-OH stretching
vibration, respectively [183-192]. A shoulder of absorption peak at 2919 and 2853
cm-1 were related to symmetric and asymmetric stretching vibrations of C-H [184,
193]. The absorption bands at 2358 and 2335 cm-1 were ascribed to
environmental noise of carbon dioxide [194, 195].
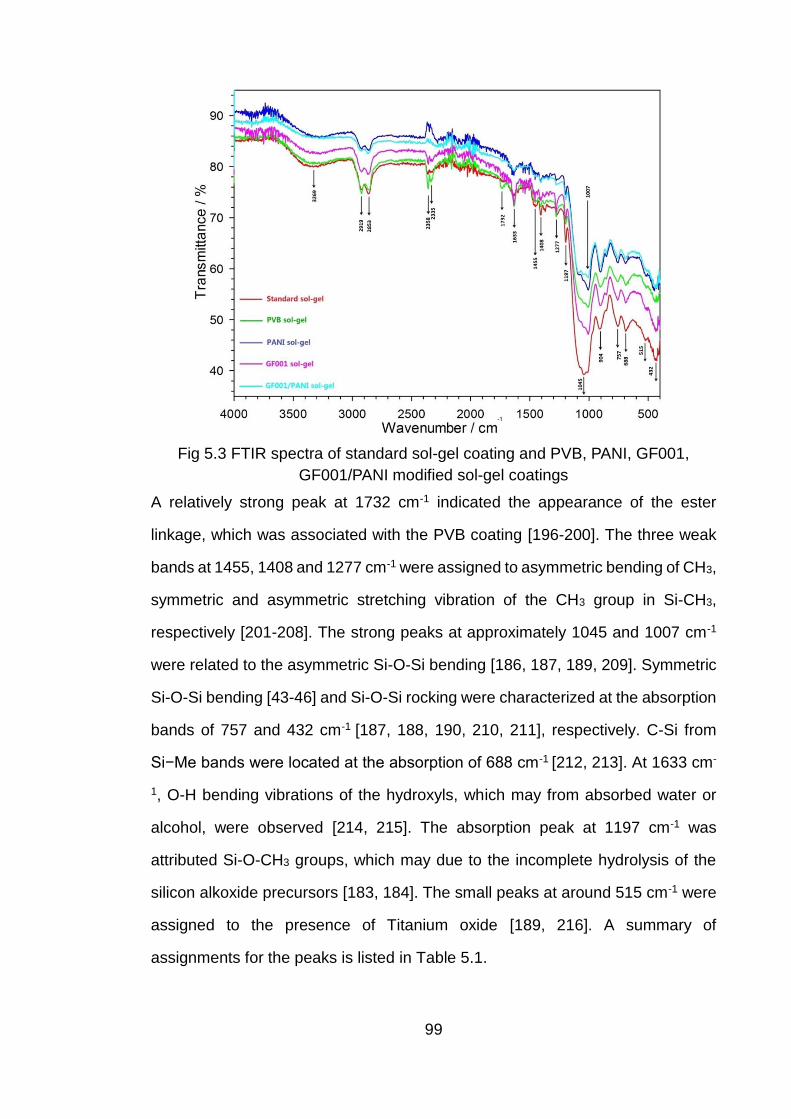
99
Fig 5.3 FTIR spectra of standard sol-gel coating and PVB, PANI, GF001,
GF001/PANI modified sol-gel coatings
A relatively strong peak at 1732 cm-1 indicated the appearance of the ester
linkage, which was associated with the PVB coating [196-200]. The three weak
bands at 1455, 1408 and 1277 cm-1 were assigned to asymmetric bending of CH3,
symmetric and asymmetric stretching vibration of the CH3 group in Si-CH3,
respectively [201-208]. The strong peaks at approximately 1045 and 1007 cm-1
were related to the asymmetric Si-O-Si bending [186, 187, 189, 209]. Symmetric
Si-O-Si bending [43-46] and Si-O-Si rocking were characterized at the absorption
bands of 757 and 432 cm-1 [187, 188, 190, 210, 211], respectively. C-Si from
Si−Me bands were located at the absorption of 688 cm-1 [212, 213]. At 1633 cm-
1, O-H bending vibrations of the hydroxyls, which may from absorbed water or
alcohol, were observed [214, 215]. The absorption peak at 1197 cm-1 was
attributed Si-O-CH3 groups, which may due to the incomplete hydrolysis of the
silicon alkoxide precursors [183, 184]. The small peaks at around 515 cm-1 were
assigned to the presence of Titanium oxide [189, 216]. A summary of
assignments for the peaks is listed in Table 5.1.
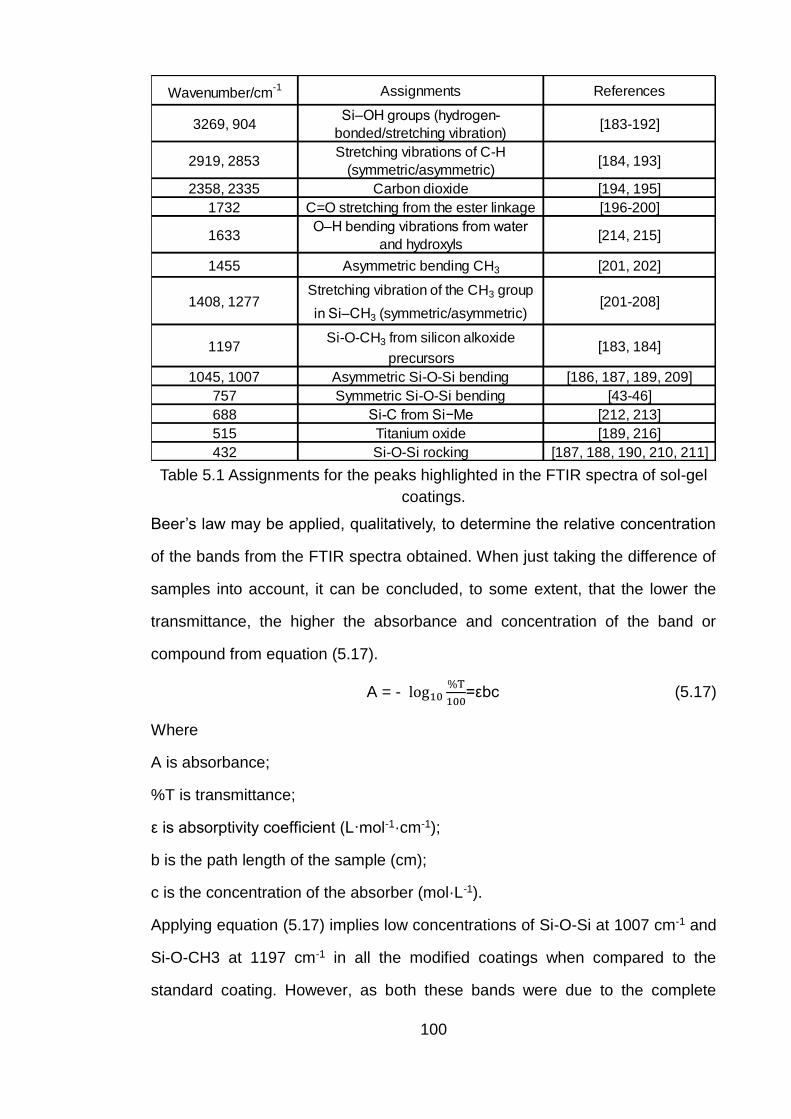
100
Table 5.1 Assignments for the peaks highlighted in the FTIR spectra of sol-gel
coatings.
Beer’s law may be applied, qualitatively, to determine the relative concentration
of the bands from the FTIR spectra obtained. When just taking the difference of
samples into account, it can be concluded, to some extent, that the lower the
transmittance, the higher the absorbance and concentration of the band or
compound from equation (5.17).
A = - log10%T
100=εbc (5.17)
Where
A is absorbance;
%T is transmittance;
ε is absorptivity coefficient (L·mol-1·cm-1);
b is the path length of the sample (cm);
c is the concentration of the absorber (mol·L-1).
Applying equation (5.17) implies low concentrations of Si-O-Si at 1007 cm-1 and
Si-O-CH3 at 1197 cm-1 in all the modified coatings when compared to the
standard coating. However, as both these bands were due to the complete
Wavenumber/cm-1 Assignments References
3269, 904Si–OH groups (hydrogen-
bonded/stretching vibration)[183-192]
2919, 2853Stretching vibrations of C-H
(symmetric/asymmetric)[184, 193]
2358, 2335 Carbon dioxide [194, 195]
1732 C=O stretching from the ester linkage [196-200]
1633O–H bending vibrations from water
and hydroxyls[214, 215]
1455 Asymmetric bending CH3 [201, 202]
1408, 1277Stretching vibration of the CH3 group
in Si–CH3 (symmetric/asymmetric)[201-208]
1197Si-O-CH3 from silicon alkoxide
precursors[183, 184]
1045, 1007 Asymmetric Si-O-Si bending [186, 187, 189, 209]
757 Symmetric Si-O-Si bending [43-46]
688 Si-C from Si−Me [212, 213]
515 Titanium oxide [189, 216]
432 Si-O-Si rocking [187, 188, 190, 210, 211]
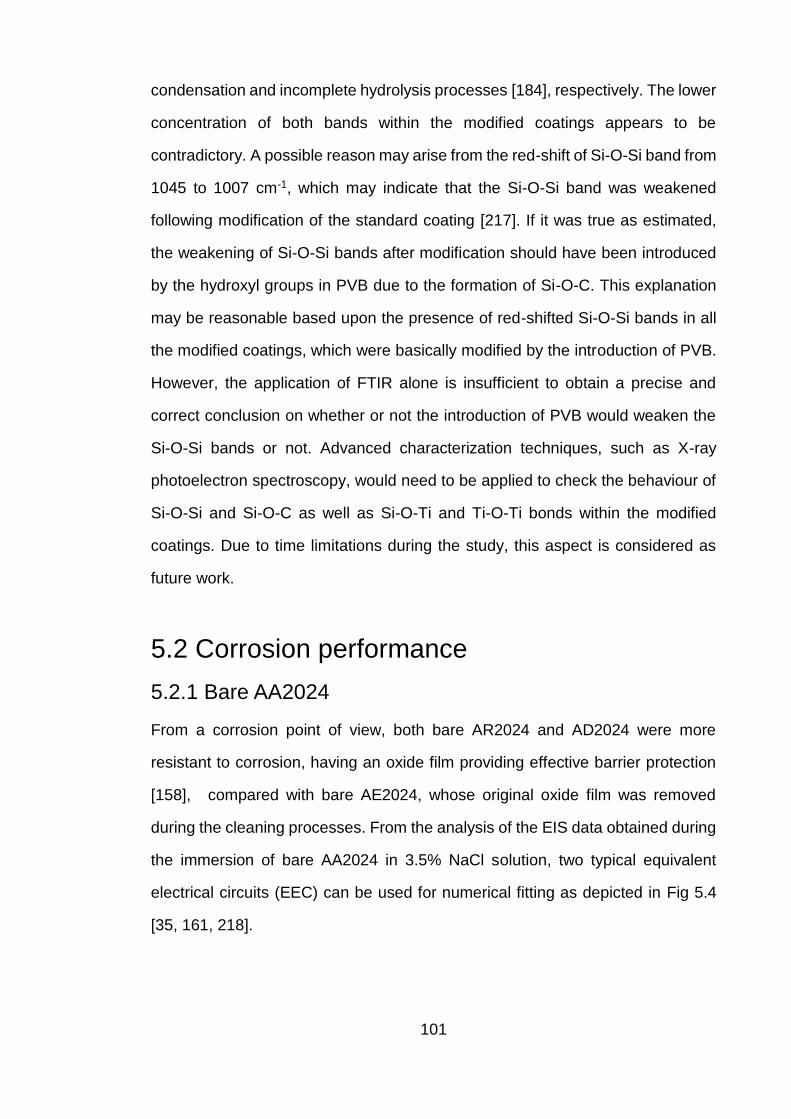
101
condensation and incomplete hydrolysis processes [184], respectively. The lower
concentration of both bands within the modified coatings appears to be
contradictory. A possible reason may arise from the red-shift of Si-O-Si band from
1045 to 1007 cm-1, which may indicate that the Si-O-Si band was weakened
following modification of the standard coating [217]. If it was true as estimated,
the weakening of Si-O-Si bands after modification should have been introduced
by the hydroxyl groups in PVB due to the formation of Si-O-C. This explanation
may be reasonable based upon the presence of red-shifted Si-O-Si bands in all
the modified coatings, which were basically modified by the introduction of PVB.
However, the application of FTIR alone is insufficient to obtain a precise and
correct conclusion on whether or not the introduction of PVB would weaken the
Si-O-Si bands or not. Advanced characterization techniques, such as X-ray
photoelectron spectroscopy, would need to be applied to check the behaviour of
Si-O-Si and Si-O-C as well as Si-O-Ti and Ti-O-Ti bonds within the modified
coatings. Due to time limitations during the study, this aspect is considered as
future work.
5.2 Corrosion performance
5.2.1 Bare AA2024
From a corrosion point of view, both bare AR2024 and AD2024 were more
resistant to corrosion, having an oxide film providing effective barrier protection
[158], compared with bare AE2024, whose original oxide film was removed
during the cleaning processes. From the analysis of the EIS data obtained during
the immersion of bare AA2024 in 3.5% NaCl solution, two typical equivalent
electrical circuits (EEC) can be used for numerical fitting as depicted in Fig 5.4
[35, 161, 218].
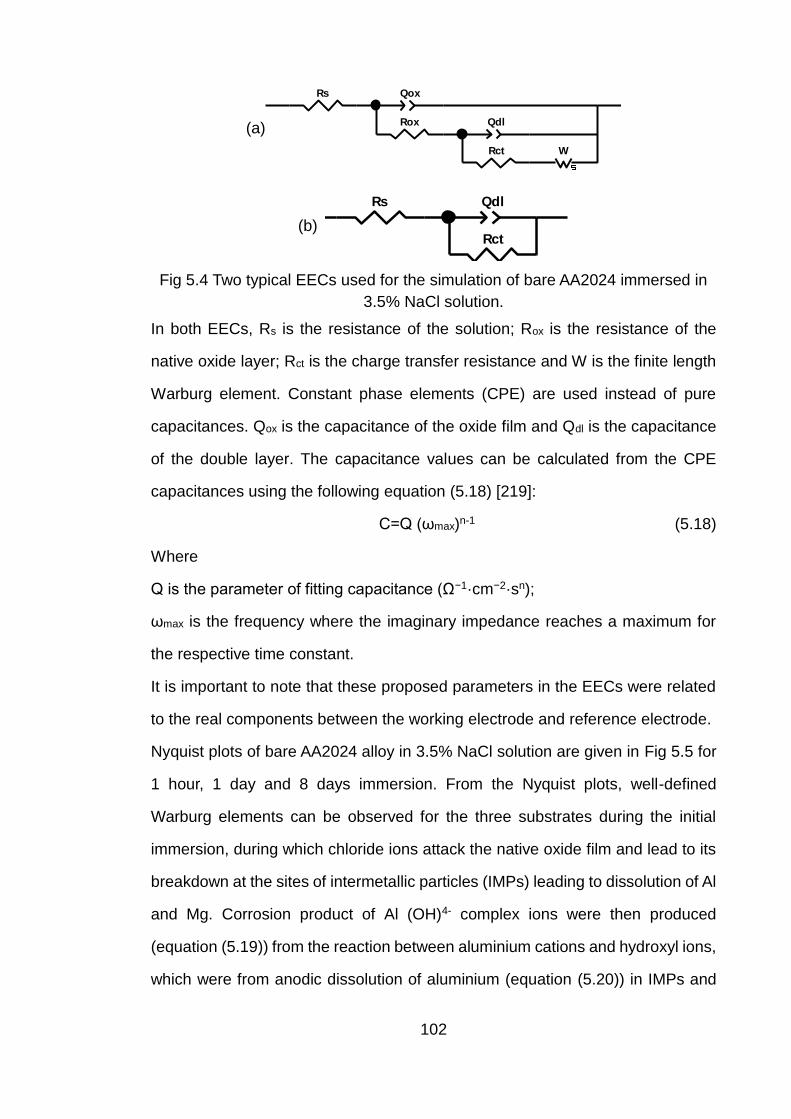
102
(a)
(b)
Fig 5.4 Two typical EECs used for the simulation of bare AA2024 immersed in
3.5% NaCl solution.
In both EECs, Rs is the resistance of the solution; Rox is the resistance of the
native oxide layer; Rct is the charge transfer resistance and W is the finite length
Warburg element. Constant phase elements (CPE) are used instead of pure
capacitances. Qox is the capacitance of the oxide film and Qdl is the capacitance
of the double layer. The capacitance values can be calculated from the CPE
capacitances using the following equation (5.18) [219]:
C=Q (ωmax)n-1 (5.18)
Where
Q is the parameter of fitting capacitance (Ω−1·cm−2·sn);
ωmax is the frequency where the imaginary impedance reaches a maximum for
the respective time constant.
It is important to note that these proposed parameters in the EECs were related
to the real components between the working electrode and reference electrode.
Nyquist plots of bare AA2024 alloy in 3.5% NaCl solution are given in Fig 5.5 for
1 hour, 1 day and 8 days immersion. From the Nyquist plots, well-defined
Warburg elements can be observed for the three substrates during the initial
immersion, during which chloride ions attack the native oxide film and lead to its
breakdown at the sites of intermetallic particles (IMPs) leading to dissolution of Al
and Mg. Corrosion product of Al (OH)4- complex ions were then produced
(equation (5.19)) from the reaction between aluminium cations and hydroxyl ions,
which were from anodic dissolution of aluminium (equation (5.20)) in IMPs and
Rs Qox
Rox Qdl
Rct W
Element Freedom Value Error Error %
Rs Free(+) 0 N/A N/A
Qox-T Free(+) 0 N/A N/A
Qox-P Free(+) 1 N/A N/A
Rox Free(+) 0 N/A N/A
Qdl-T Free(+) 0 N/A N/A
Qdl-P Free(+) 1 N/A N/A
Rct Free(+) 0 N/A N/A
W-R Free(+) 0 N/A N/A
W-T Free(+) 0 N/A N/A
W-P Fixed(X) 0.5 N/A N/A
Data File:
Circuit Model File: C:\Users\Feng\Google 云端硬盘 \data\Fitting\Model\bare AA2024.mdl
Mode: Run Fitting / All Data Points (1 - 1)
Maximum Iterations: 100
Optimization Iterations: 0
Type of Fitting: Complex
Type of Weighting: Calc-Modulus
Rs Qdl
Rct
Element Freedom Value Error Error %
Rs Free(+) 0 N/A N/A
Qdl-T Free(+) 0 N/A N/A
Qdl-P Free(+) 1 N/A N/A
Rct Free(+) 0 N/A N/A
Data File:
Circuit Model File: C:\Users\Feng\Google 云端硬盘 \data\Fitting\Model\bare AA2024 2.mdl
Mode: Run Fitting / All Data Points (1 - 1)
Maximum Iterations: 100
Optimization Iterations: 0
Type of Fitting: Complex
Type of Weighting: Calc-Modulus
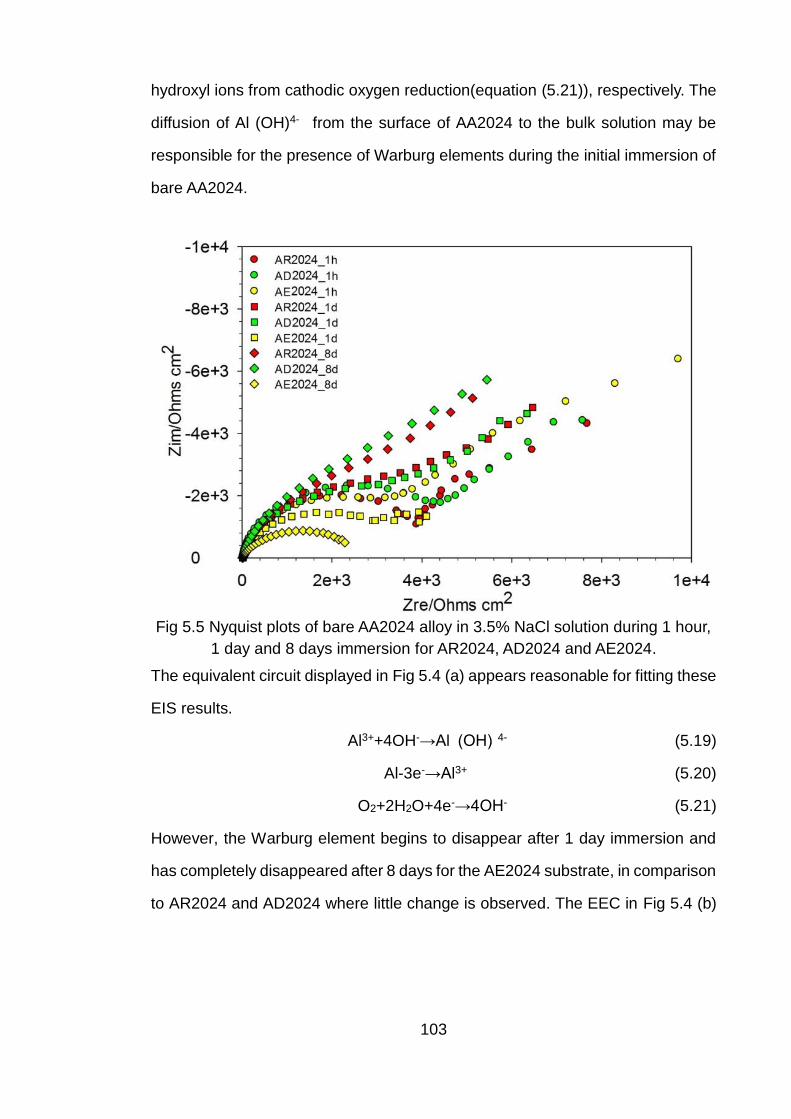
103
hydroxyl ions from cathodic oxygen reduction(equation (5.21)), respectively. The
diffusion of Al (OH)4- from the surface of AA2024 to the bulk solution may be
responsible for the presence of Warburg elements during the initial immersion of
bare AA2024.
Fig 5.5 Nyquist plots of bare AA2024 alloy in 3.5% NaCl solution during 1 hour,
1 day and 8 days immersion for AR2024, AD2024 and AE2024.
The equivalent circuit displayed in Fig 5.4 (a) appears reasonable for fitting these
EIS results.
Al3++4OH-→Al (OH) 4- (5.19)
Al-3e-→Al3+ (5.20)
O2+2H2O+4e-→4OH- (5.21)
However, the Warburg element begins to disappear after 1 day immersion and
has completely disappeared after 8 days for the AE2024 substrate, in comparison
to AR2024 and AD2024 where little change is observed. The EEC in Fig 5.4 (b)
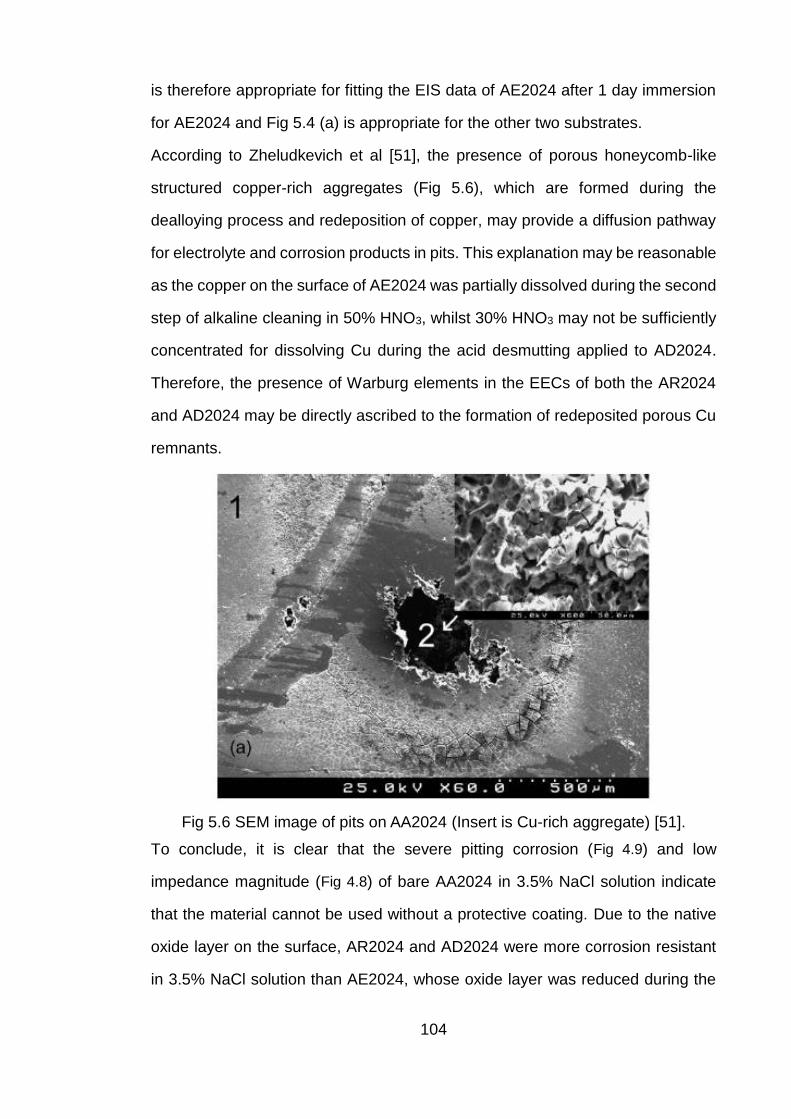
104
is therefore appropriate for fitting the EIS data of AE2024 after 1 day immersion
for AE2024 and Fig 5.4 (a) is appropriate for the other two substrates.
According to Zheludkevich et al [51], the presence of porous honeycomb-like
structured copper-rich aggregates (Fig 5.6), which are formed during the
dealloying process and redeposition of copper, may provide a diffusion pathway
for electrolyte and corrosion products in pits. This explanation may be reasonable
as the copper on the surface of AE2024 was partially dissolved during the second
step of alkaline cleaning in 50% HNO3, whilst 30% HNO3 may not be sufficiently
concentrated for dissolving Cu during the acid desmutting applied to AD2024.
Therefore, the presence of Warburg elements in the EECs of both the AR2024
and AD2024 may be directly ascribed to the formation of redeposited porous Cu
remnants.
Fig 5.6 SEM image of pits on AA2024 (Insert is Cu-rich aggregate) [51].
To conclude, it is clear that the severe pitting corrosion (Fig 4.9) and low
impedance magnitude (Fig 4.8) of bare AA2024 in 3.5% NaCl solution indicate
that the material cannot be used without a protective coating. Due to the native
oxide layer on the surface, AR2024 and AD2024 were more corrosion resistant
in 3.5% NaCl solution than AE2024, whose oxide layer was reduced during the
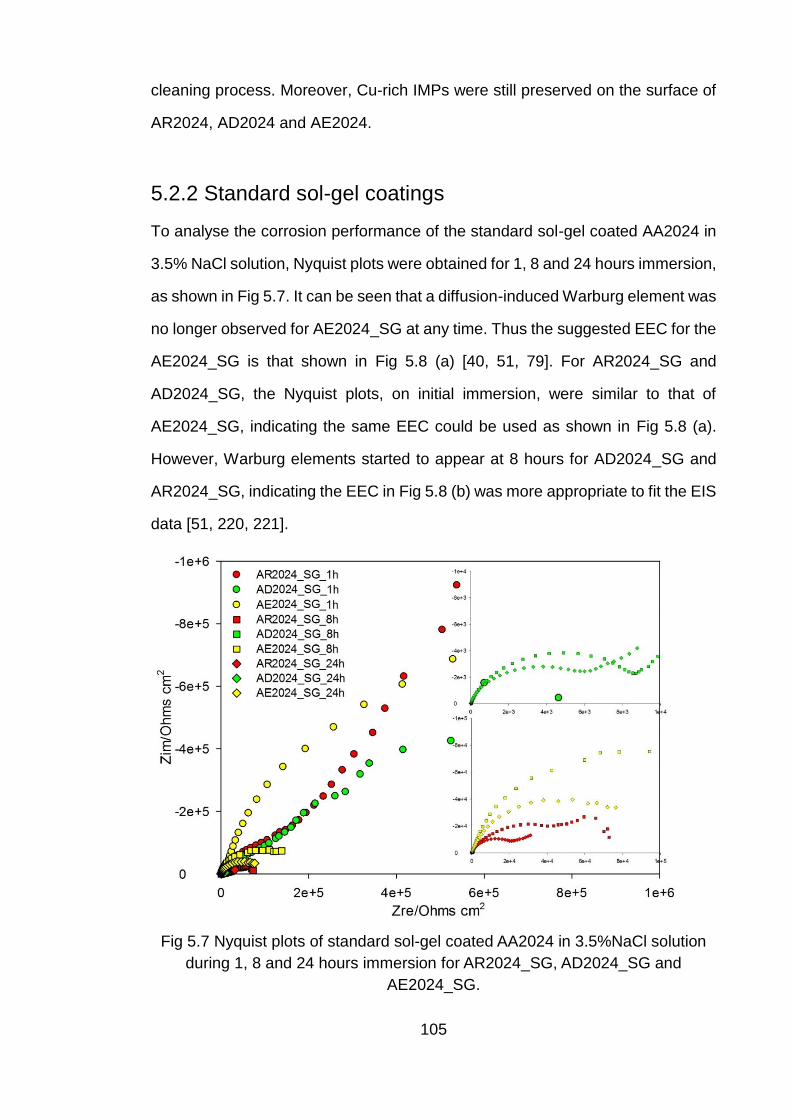
105
cleaning process. Moreover, Cu-rich IMPs were still preserved on the surface of
AR2024, AD2024 and AE2024.
5.2.2 Standard sol-gel coatings
To analyse the corrosion performance of the standard sol-gel coated AA2024 in
3.5% NaCl solution, Nyquist plots were obtained for 1, 8 and 24 hours immersion,
as shown in Fig 5.7. It can be seen that a diffusion-induced Warburg element was
no longer observed for AE2024_SG at any time. Thus the suggested EEC for the
AE2024_SG is that shown in Fig 5.8 (a) [40, 51, 79]. For AR2024_SG and
AD2024_SG, the Nyquist plots, on initial immersion, were similar to that of
AE2024_SG, indicating the same EEC could be used as shown in Fig 5.8 (a).
However, Warburg elements started to appear at 8 hours for AD2024_SG and
AR2024_SG, indicating the EEC in Fig 5.8 (b) was more appropriate to fit the EIS
data [51, 220, 221].
Fig 5.7 Nyquist plots of standard sol-gel coated AA2024 in 3.5%NaCl solution
during 1, 8 and 24 hours immersion for AR2024_SG, AD2024_SG and
AE2024_SG.
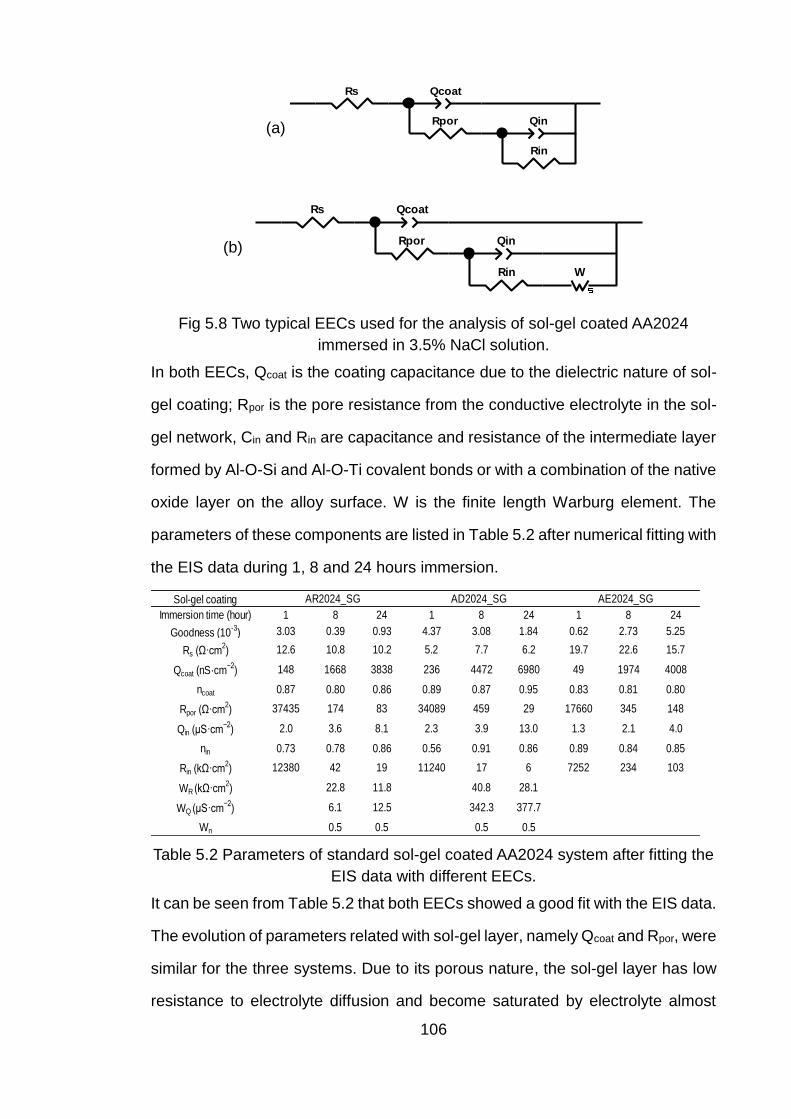
106
(a)
(b)
Fig 5.8 Two typical EECs used for the analysis of sol-gel coated AA2024
immersed in 3.5% NaCl solution.
In both EECs, Qcoat is the coating capacitance due to the dielectric nature of sol-
gel coating; Rpor is the pore resistance from the conductive electrolyte in the sol-
gel network, Cin and Rin are capacitance and resistance of the intermediate layer
formed by Al-O-Si and Al-O-Ti covalent bonds or with a combination of the native
oxide layer on the alloy surface. W is the finite length Warburg element. The
parameters of these components are listed in Table 5.2 after numerical fitting with
the EIS data during 1, 8 and 24 hours immersion.
Table 5.2 Parameters of standard sol-gel coated AA2024 system after fitting the
EIS data with different EECs.
It can be seen from Table 5.2 that both EECs showed a good fit with the EIS data.
The evolution of parameters related with sol-gel layer, namely Qcoat and Rpor, were
similar for the three systems. Due to its porous nature, the sol-gel layer has low
resistance to electrolyte diffusion and become saturated by electrolyte almost
Rs Qcoat
Rpor Qin
Rin
Element Freedom Value Error Error %
Rs Free(+) 21.36 N/A N/A
Qcoat-T Free(+) 1.0987E-5 N/A N/A
Qcoat-P Free(+) 0.71448 N/A N/A
Rpor Free(+) 74.16 N/A N/A
Qin-T Free(+) 2.6103E-5 N/A N/A
Qin-P Free(+) 0.87139 N/A N/A
Rin Free(+) 41222 N/A N/A
Data File:
Circuit Model File: C:\Users\Feng\Google 云端硬盘 \data\Fitting\Model\DIFFUSION\no diffusion paraelle.mdl
Mode: Run Fitting / All Data Points (1 - 1)
Maximum Iterations: 100
Optimization Iterations: 0
Type of Fitting: Complex
Type of Weighting: Calc-Modulus
Rs Qcoat
Rpor Qin
Rin W
Element Freedom Value Error Error %
Rs Free(+) 21.36 N/A N/A
Qcoat-T Free(+) 1.0987E-5 N/A N/A
Qcoat-P Free(+) 0.71448 N/A N/A
Rpor Free(+) 74.16 N/A N/A
Qin-T Free(+) 2.6103E-5 N/A N/A
Qin-P Free(+) 0.87139 N/A N/A
Rin Free(+) 41222 N/A N/A
W-R Fixed(X) 0 N/A N/A
W-T Fixed(X) 0 N/A N/A
W-P Fixed(X) 0.5 N/A N/A
Data File:
Circuit Model File: C:\Users\Feng\Google 云端硬盘 \data\Fitting\Model\DIFFUSION\no diffusion paraelle.mdl
Mode: Run Fitting / All Data Points (1 - 1)
Maximum Iterations: 100
Optimization Iterations: 0
Type of Fitting: Complex
Type of Weighting: Calc-Modulus
Sol-gel coating
Immersion time (hour) 1 8 24 1 8 24 1 8 24
Goodness (10-3
) 3.03 0.39 0.93 4.37 3.08 1.84 0.62 2.73 5.25
Rs (Ω·cm2) 12.6 10.8 10.2 5.2 7.7 6.2 19.7 22.6 15.7
Qcoat (nS·cm−2
) 148 1668 3838 236 4472 6980 49 1974 4008
ncoat 0.87 0.80 0.86 0.89 0.87 0.95 0.83 0.81 0.80
Rpor (Ω·cm2) 37435 174 83 34089 459 29 17660 345 148
Qin (μS·cm−2
) 2.0 3.6 8.1 2.3 3.9 13.0 1.3 2.1 4.0
nin 0.73 0.78 0.86 0.56 0.91 0.86 0.89 0.84 0.85
Rin (kΩ·cm2) 12380 42 19 11240 17 6 7252 234 103
WR (kΩ·cm2) 22.8 11.8 40.8 28.1
WQ (μS·cm−2
) 6.1 12.5 342.3 377.7
Wn 0.5 0.5 0.5 0.5
AR2024_SG AD2024_SG AE2024_SG
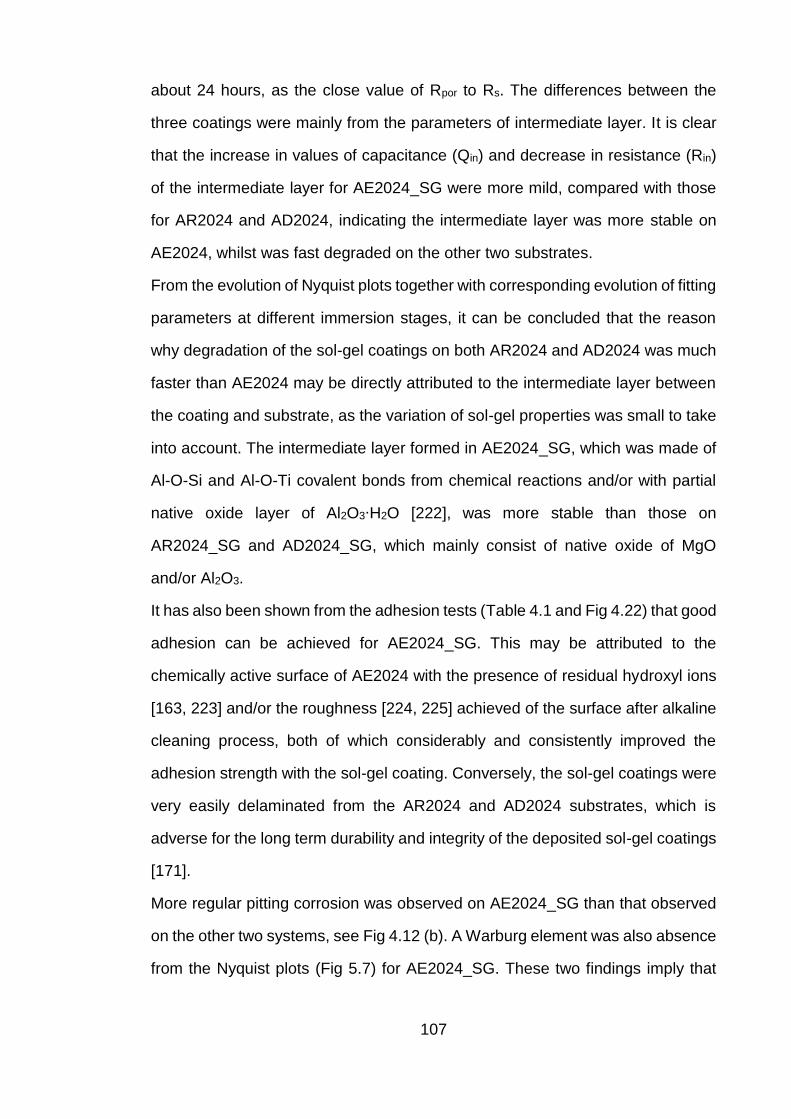
107
about 24 hours, as the close value of Rpor to Rs. The differences between the
three coatings were mainly from the parameters of intermediate layer. It is clear
that the increase in values of capacitance (Qin) and decrease in resistance (Rin)
of the intermediate layer for AE2024_SG were more mild, compared with those
for AR2024 and AD2024, indicating the intermediate layer was more stable on
AE2024, whilst was fast degraded on the other two substrates.
From the evolution of Nyquist plots together with corresponding evolution of fitting
parameters at different immersion stages, it can be concluded that the reason
why degradation of the sol-gel coatings on both AR2024 and AD2024 was much
faster than AE2024 may be directly attributed to the intermediate layer between
the coating and substrate, as the variation of sol-gel properties was small to take
into account. The intermediate layer formed in AE2024_SG, which was made of
Al-O-Si and Al-O-Ti covalent bonds from chemical reactions and/or with partial
native oxide layer of Al2O3∙H2O [222], was more stable than those on
AR2024_SG and AD2024_SG, which mainly consist of native oxide of MgO
and/or Al2O3.
It has also been shown from the adhesion tests (Table 4.1 and Fig 4.22) that good
adhesion can be achieved for AE2024_SG. This may be attributed to the
chemically active surface of AE2024 with the presence of residual hydroxyl ions
[163, 223] and/or the roughness [224, 225] achieved of the surface after alkaline
cleaning process, both of which considerably and consistently improved the
adhesion strength with the sol-gel coating. Conversely, the sol-gel coatings were
very easily delaminated from the AR2024 and AD2024 substrates, which is
adverse for the long term durability and integrity of the deposited sol-gel coatings
[171].
More regular pitting corrosion was observed on AE2024_SG than that observed
on the other two systems, see Fig 4.12 (b). A Warburg element was also absence
from the Nyquist plots (Fig 5.7) for AE2024_SG. These two findings imply that
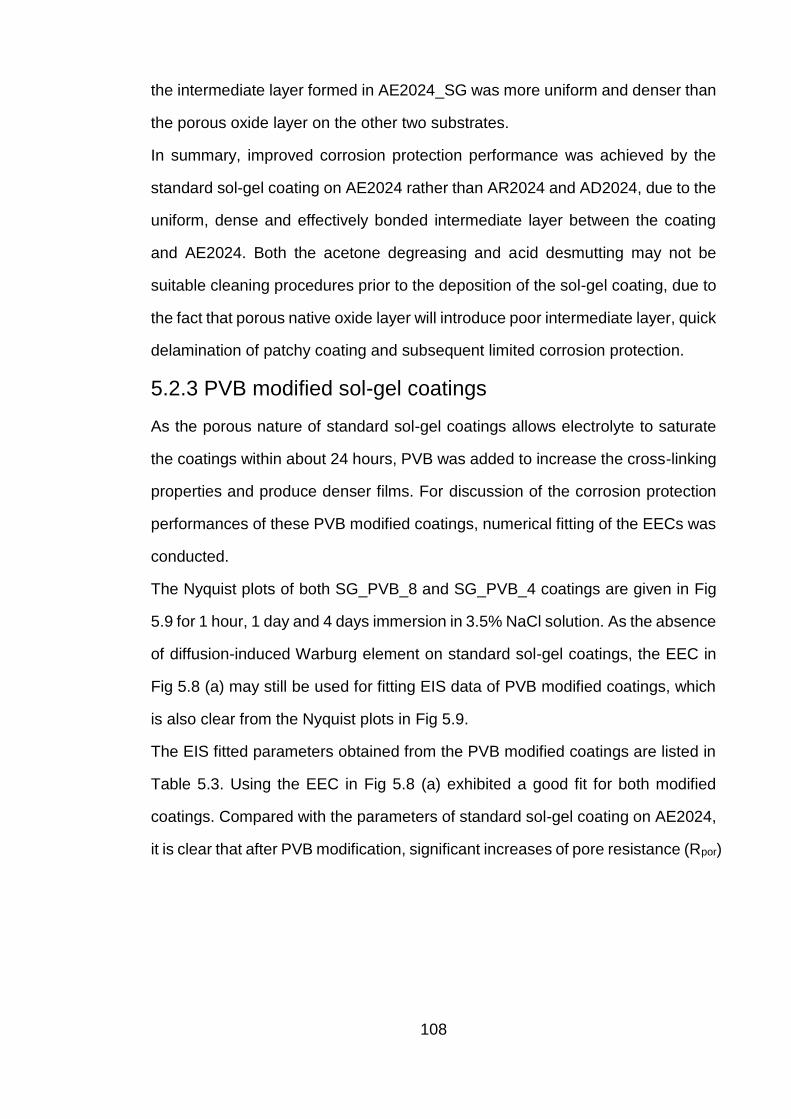
108
the intermediate layer formed in AE2024_SG was more uniform and denser than
the porous oxide layer on the other two substrates.
In summary, improved corrosion protection performance was achieved by the
standard sol-gel coating on AE2024 rather than AR2024 and AD2024, due to the
uniform, dense and effectively bonded intermediate layer between the coating
and AE2024. Both the acetone degreasing and acid desmutting may not be
suitable cleaning procedures prior to the deposition of the sol-gel coating, due to
the fact that porous native oxide layer will introduce poor intermediate layer, quick
delamination of patchy coating and subsequent limited corrosion protection.
5.2.3 PVB modified sol-gel coatings
As the porous nature of standard sol-gel coatings allows electrolyte to saturate
the coatings within about 24 hours, PVB was added to increase the cross-linking
properties and produce denser films. For discussion of the corrosion protection
performances of these PVB modified coatings, numerical fitting of the EECs was
conducted.
The Nyquist plots of both SG_PVB_8 and SG_PVB_4 coatings are given in Fig
5.9 for 1 hour, 1 day and 4 days immersion in 3.5% NaCl solution. As the absence
of diffusion-induced Warburg element on standard sol-gel coatings, the EEC in
Fig 5.8 (a) may still be used for fitting EIS data of PVB modified coatings, which
is also clear from the Nyquist plots in Fig 5.9.
The EIS fitted parameters obtained from the PVB modified coatings are listed in
Table 5.3. Using the EEC in Fig 5.8 (a) exhibited a good fit for both modified
coatings. Compared with the parameters of standard sol-gel coating on AE2024,
it is clear that after PVB modification, significant increases of pore resistance (Rpor)
109
and decrease of coating capacitance (Qcoat) were obtained for SG_PVB_4,
indicating that this modified coating was more resistant to electrolyte attack.
Fig 5.9 Nyquist plots of PVB modified sol-gel coated AA2024 in 3.5%NaCl
solution for 1 hour, 1 day and 4 days immersion.
However, for low ratio of PVB in SG_PVB_8, no improvement in the coating
capacitance were obtained and it seems that this coating was quickly saturated
by electrolyte within 24 hours, whilst SG_PVB_4 was still not saturated after 96
hours. With regard to the parameters of intermediate layer capacitance (Qin) and
resistance (Rin), which are related to the stability of intermediate layer, it was
found that no obvious improvement was achieved by SG_PVB_8, when
comparing the parameters of standard sol-gel coating. However, the values of Qin
and Rin in SG_PVB_4 were preserved at lower and higher level than those in
AE2024_SG, indicating that some improvement may be achieved by the addition
of PVB.
It may therefore be concluded that the improvement in corrosion protection
performance of PVB modified sol-gel coatings can be associated with both
denser sol-gel layers, which have higher resistance to the permeability of the
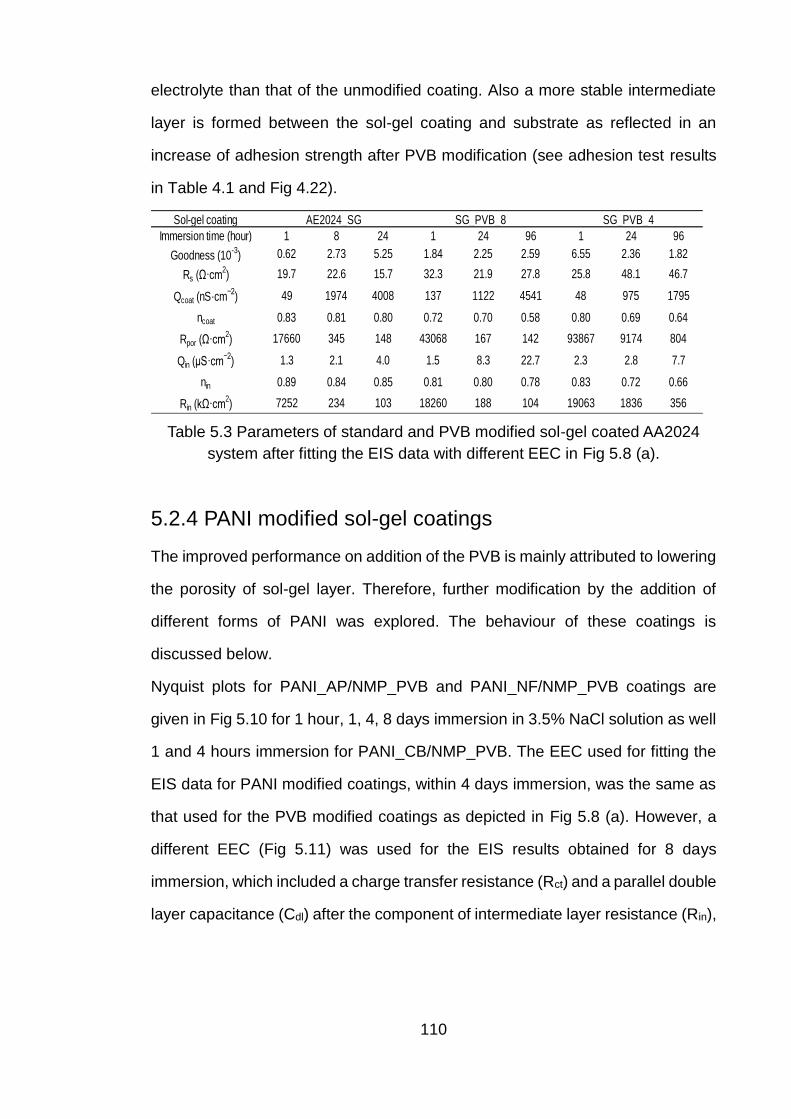
110
electrolyte than that of the unmodified coating. Also a more stable intermediate
layer is formed between the sol-gel coating and substrate as reflected in an
increase of adhesion strength after PVB modification (see adhesion test results
in Table 4.1 and Fig 4.22).
Table 5.3 Parameters of standard and PVB modified sol-gel coated AA2024
system after fitting the EIS data with different EEC in Fig 5.8 (a).
5.2.4 PANI modified sol-gel coatings
The improved performance on addition of the PVB is mainly attributed to lowering
the porosity of sol-gel layer. Therefore, further modification by the addition of
different forms of PANI was explored. The behaviour of these coatings is
discussed below.
Nyquist plots for PANI_AP/NMP_PVB and PANI_NF/NMP_PVB coatings are
given in Fig 5.10 for 1 hour, 1, 4, 8 days immersion in 3.5% NaCl solution as well
1 and 4 hours immersion for PANI_CB/NMP_PVB. The EEC used for fitting the
EIS data for PANI modified coatings, within 4 days immersion, was the same as
that used for the PVB modified coatings as depicted in Fig 5.8 (a). However, a
different EEC (Fig 5.11) was used for the EIS results obtained for 8 days
immersion, which included a charge transfer resistance (Rct) and a parallel double
layer capacitance (Cdl) after the component of intermediate layer resistance (Rin),
Sol-gel coating
Immersion time (hour) 1 8 24 1 24 96 1 24 96
Goodness (10-3
) 0.62 2.73 5.25 1.84 2.25 2.59 6.55 2.36 1.82
Rs (Ω·cm2) 19.7 22.6 15.7 32.3 21.9 27.8 25.8 48.1 46.7
Qcoat (nS·cm−2
) 49 1974 4008 137 1122 4541 48 975 1795
ncoat 0.83 0.81 0.80 0.72 0.70 0.58 0.80 0.69 0.64
Rpor (Ω·cm2) 17660 345 148 43068 167 142 93867 9174 804
Qin (μS·cm−2
) 1.3 2.1 4.0 1.5 8.3 22.7 2.3 2.8 7.7
nin 0.89 0.84 0.85 0.81 0.80 0.78 0.83 0.72 0.66
Rin (kΩ·cm2) 7252 234 103 18260 188 104 19063 1836 356
SG_PVB_8 SG_PVB_4AE2024_SG
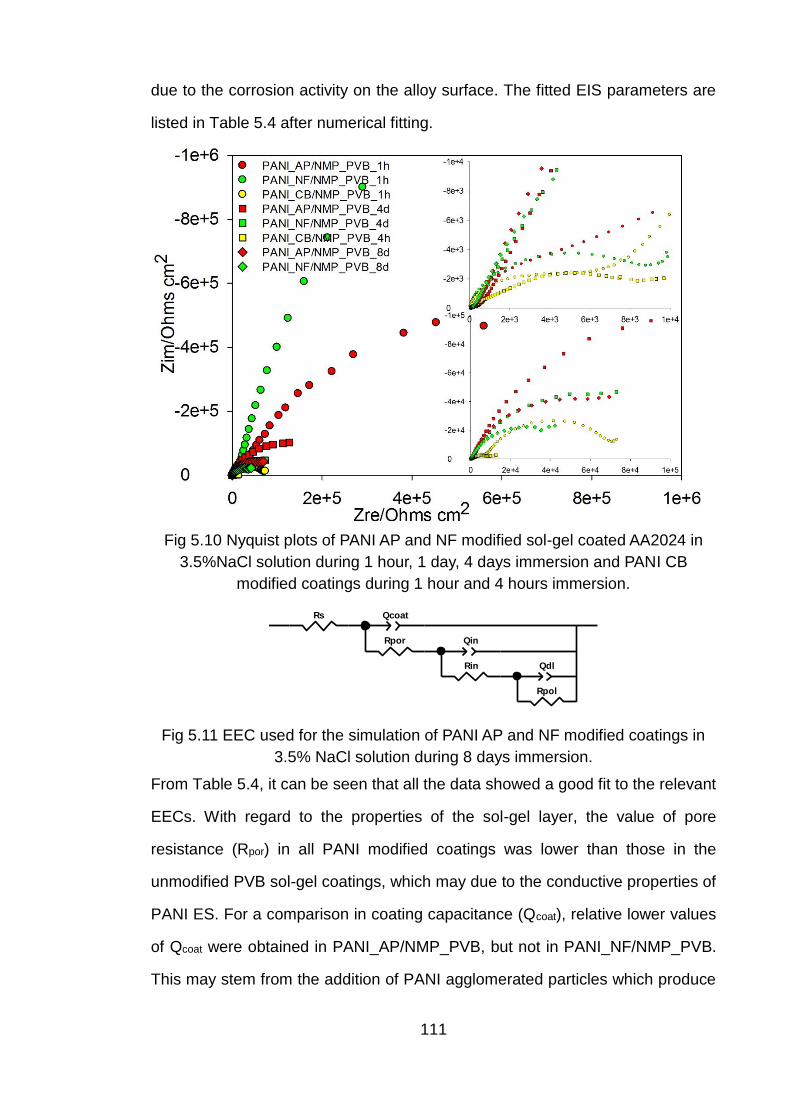
111
due to the corrosion activity on the alloy surface. The fitted EIS parameters are
listed in Table 5.4 after numerical fitting.
Fig 5.10 Nyquist plots of PANI AP and NF modified sol-gel coated AA2024 in
3.5%NaCl solution during 1 hour, 1 day, 4 days immersion and PANI CB
modified coatings during 1 hour and 4 hours immersion.
Fig 5.11 EEC used for the simulation of PANI AP and NF modified coatings in
3.5% NaCl solution during 8 days immersion.
From Table 5.4, it can be seen that all the data showed a good fit to the relevant
EECs. With regard to the properties of the sol-gel layer, the value of pore
resistance (Rpor) in all PANI modified coatings was lower than those in the
unmodified PVB sol-gel coatings, which may due to the conductive properties of
PANI ES. For a comparison in coating capacitance (Qcoat), relative lower values
of Qcoat were obtained in PANI_AP/NMP_PVB, but not in PANI_NF/NMP_PVB.
This may stem from the addition of PANI agglomerated particles which produce
Rs Qcoat
Rpor Qin
Rin Qdl
Rpol
Element Freedom Value Error Error %
Rs Fixed(X) 23 N/A N/A
Qcoat-T Free(+) 6.4046E-6 N/A N/A
Qcoat-P Free(+) 0.46983 N/A N/A
Rpor Free(+) 1.8513E7 N/A N/A
Qin-T Free(+) 0.00073269 N/A N/A
Qin-P Fixed(X) 0.9 N/A N/A
Rin Free(+) 3200 N/A N/A
Qdl-T Free(+) 0.1443 N/A N/A
Qdl-P Fixed(X) 0.961 N/A N/A
Rpol Free(+) 109.4 N/A N/A
Data File:
Circuit Model File: C:\Users\Feng\Google 云端硬盘 \data\Fitting\Model\DIFFUSION\no diffusion paraelle corrosion.mdl
Mode: Run Fitting / All Data Points (1 - 1)
Maximum Iterations: 100
Optimization Iterations: 0
Type of Fitting: Complex
Type of Weighting: Calc-Modulus
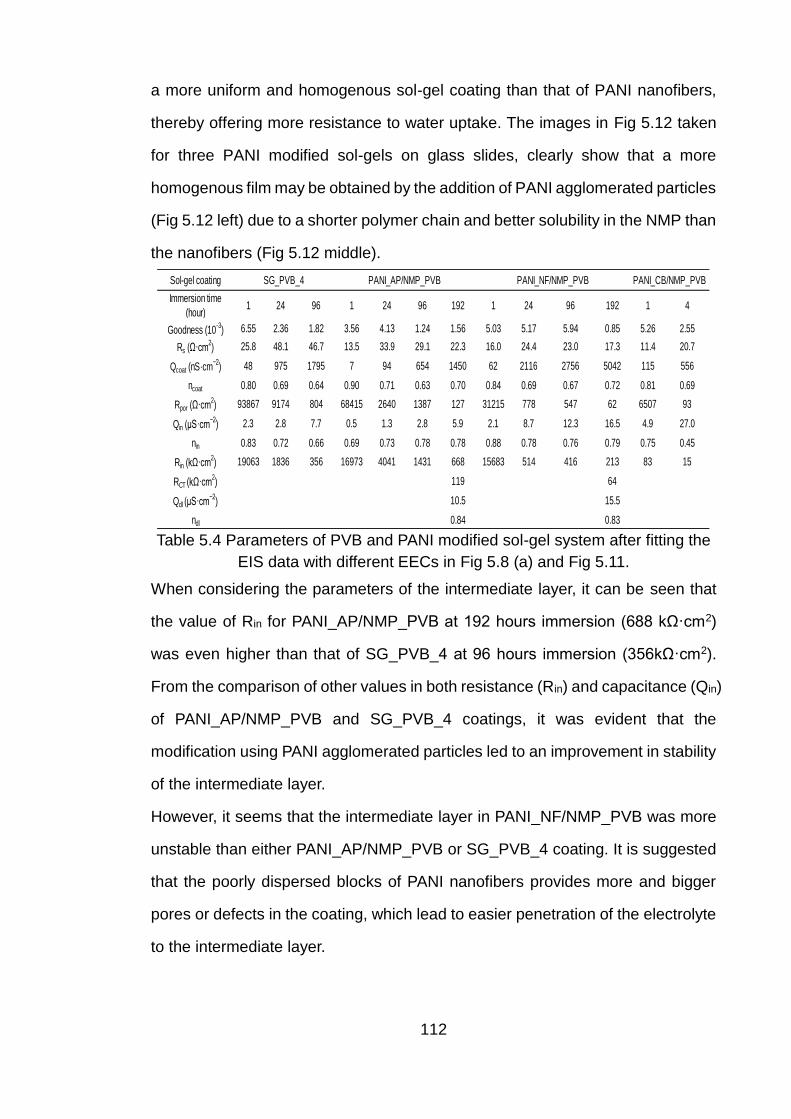
112
a more uniform and homogenous sol-gel coating than that of PANI nanofibers,
thereby offering more resistance to water uptake. The images in Fig 5.12 taken
for three PANI modified sol-gels on glass slides, clearly show that a more
homogenous film may be obtained by the addition of PANI agglomerated particles
(Fig 5.12 left) due to a shorter polymer chain and better solubility in the NMP than
the nanofibers (Fig 5.12 middle).
Table 5.4 Parameters of PVB and PANI modified sol-gel system after fitting the
EIS data with different EECs in Fig 5.8 (a) and Fig 5.11.
When considering the parameters of the intermediate layer, it can be seen that
the value of Rin for PANI_AP/NMP_PVB at 192 hours immersion (688 kΩ·cm2)
was even higher than that of SG_PVB_4 at 96 hours immersion (356kΩ·cm2).
From the comparison of other values in both resistance (Rin) and capacitance (Qin)
of PANI_AP/NMP_PVB and SG_PVB_4 coatings, it was evident that the
modification using PANI agglomerated particles led to an improvement in stability
of the intermediate layer.
However, it seems that the intermediate layer in PANI_NF/NMP_PVB was more
unstable than either PANI_AP/NMP_PVB or SG_PVB_4 coating. It is suggested
that the poorly dispersed blocks of PANI nanofibers provides more and bigger
pores or defects in the coating, which lead to easier penetration of the electrolyte
to the intermediate layer.
Sol-gel coating
Immersion time
(hour)1 24 96 1 24 96 192 1 24 96 192 1 4
Goodness (10-3
) 6.55 2.36 1.82 3.56 4.13 1.24 1.56 5.03 5.17 5.94 0.85 5.26 2.55
Rs (Ω·cm2) 25.8 48.1 46.7 13.5 33.9 29.1 22.3 16.0 24.4 23.0 17.3 11.4 20.7
Qcoat (nS·cm−2
) 48 975 1795 7 94 654 1450 62 2116 2756 5042 115 556
ncoat 0.80 0.69 0.64 0.90 0.71 0.63 0.70 0.84 0.69 0.67 0.72 0.81 0.69
Rpor (Ω·cm2) 93867 9174 804 68415 2640 1387 127 31215 778 547 62 6507 93
Qin (μS·cm−2
) 2.3 2.8 7.7 0.5 1.3 2.8 5.9 2.1 8.7 12.3 16.5 4.9 27.0
nin 0.83 0.72 0.66 0.69 0.73 0.78 0.78 0.88 0.78 0.76 0.79 0.75 0.45
Rin (kΩ·cm2) 19063 1836 356 16973 4041 1431 668 15683 514 416 213 83 15
RCT (kΩ·cm2) 119 64
Qdl (μS·cm−2
) 10.5 15.5
ndl 0.84 0.83
PANI_AP/NMP_PVB PANI_NF/NMP_PVB PANI_CB/NMP_PVBSG_PVB_4
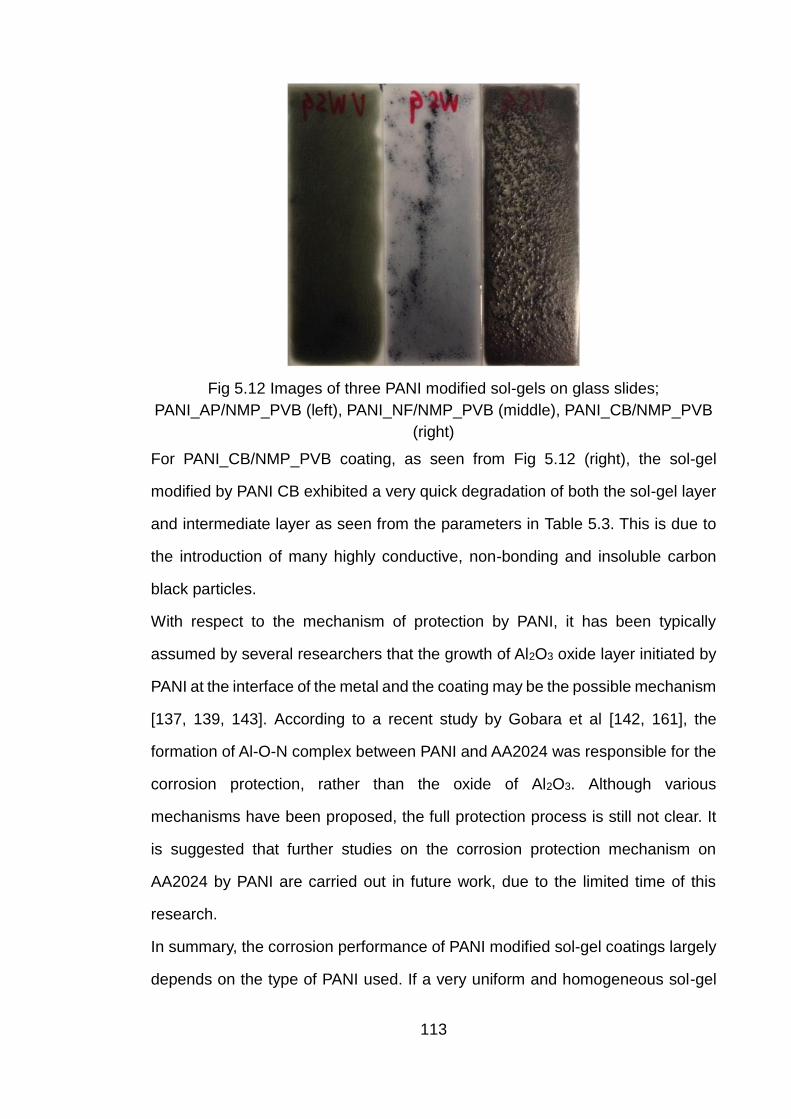
113
Fig 5.12 Images of three PANI modified sol-gels on glass slides;
PANI_AP/NMP_PVB (left), PANI_NF/NMP_PVB (middle), PANI_CB/NMP_PVB
(right)
For PANI_CB/NMP_PVB coating, as seen from Fig 5.12 (right), the sol-gel
modified by PANI CB exhibited a very quick degradation of both the sol-gel layer
and intermediate layer as seen from the parameters in Table 5.3. This is due to
the introduction of many highly conductive, non-bonding and insoluble carbon
black particles.
With respect to the mechanism of protection by PANI, it has been typically
assumed by several researchers that the growth of Al2O3 oxide layer initiated by
PANI at the interface of the metal and the coating may be the possible mechanism
[137, 139, 143]. According to a recent study by Gobara et al [142, 161], the
formation of Al-O-N complex between PANI and AA2024 was responsible for the
corrosion protection, rather than the oxide of Al2O3. Although various
mechanisms have been proposed, the full protection process is still not clear. It
is suggested that further studies on the corrosion protection mechanism on
AA2024 by PANI are carried out in future work, due to the limited time of this
research.
In summary, the corrosion performance of PANI modified sol-gel coatings largely
depends on the type of PANI used. If a very uniform and homogeneous sol-gel
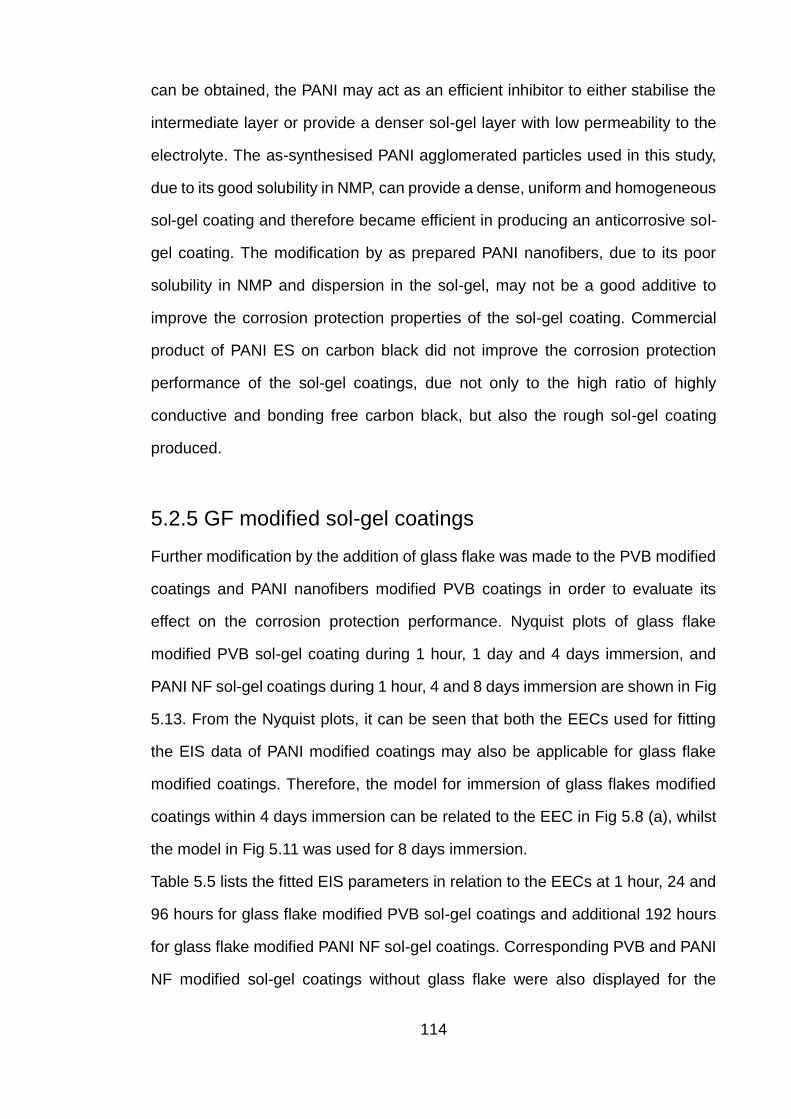
114
can be obtained, the PANI may act as an efficient inhibitor to either stabilise the
intermediate layer or provide a denser sol-gel layer with low permeability to the
electrolyte. The as-synthesised PANI agglomerated particles used in this study,
due to its good solubility in NMP, can provide a dense, uniform and homogeneous
sol-gel coating and therefore became efficient in producing an anticorrosive sol-
gel coating. The modification by as prepared PANI nanofibers, due to its poor
solubility in NMP and dispersion in the sol-gel, may not be a good additive to
improve the corrosion protection properties of the sol-gel coating. Commercial
product of PANI ES on carbon black did not improve the corrosion protection
performance of the sol-gel coatings, due not only to the high ratio of highly
conductive and bonding free carbon black, but also the rough sol-gel coating
produced.
5.2.5 GF modified sol-gel coatings
Further modification by the addition of glass flake was made to the PVB modified
coatings and PANI nanofibers modified PVB coatings in order to evaluate its
effect on the corrosion protection performance. Nyquist plots of glass flake
modified PVB sol-gel coating during 1 hour, 1 day and 4 days immersion, and
PANI NF sol-gel coatings during 1 hour, 4 and 8 days immersion are shown in Fig
5.13. From the Nyquist plots, it can be seen that both the EECs used for fitting
the EIS data of PANI modified coatings may also be applicable for glass flake
modified coatings. Therefore, the model for immersion of glass flakes modified
coatings within 4 days immersion can be related to the EEC in Fig 5.8 (a), whilst
the model in Fig 5.11 was used for 8 days immersion.
Table 5.5 lists the fitted EIS parameters in relation to the EECs at 1 hour, 24 and
96 hours for glass flake modified PVB sol-gel coatings and additional 192 hours
for glass flake modified PANI NF sol-gel coatings. Corresponding PVB and PANI
NF modified sol-gel coatings without glass flake were also displayed for the
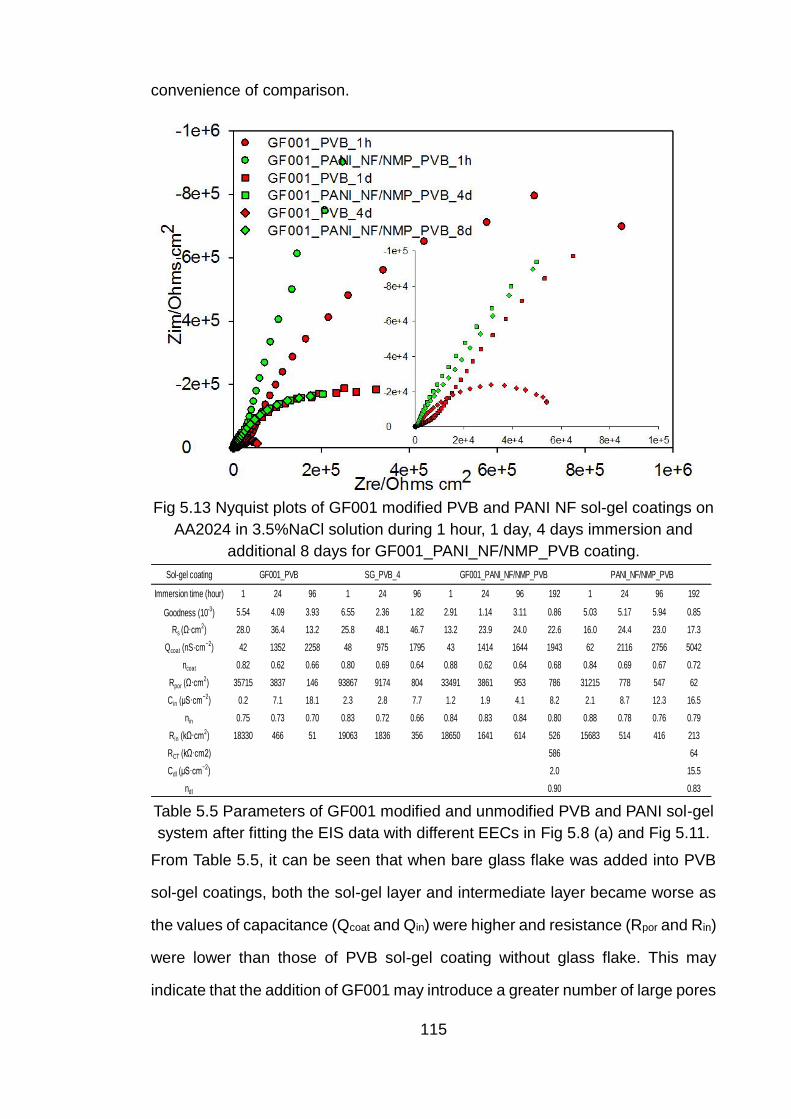
115
convenience of comparison.
Fig 5.13 Nyquist plots of GF001 modified PVB and PANI NF sol-gel coatings on
AA2024 in 3.5%NaCl solution during 1 hour, 1 day, 4 days immersion and
additional 8 days for GF001_PANI_NF/NMP_PVB coating.
Table 5.5 Parameters of GF001 modified and unmodified PVB and PANI sol-gel
system after fitting the EIS data with different EECs in Fig 5.8 (a) and Fig 5.11.
From Table 5.5, it can be seen that when bare glass flake was added into PVB
sol-gel coatings, both the sol-gel layer and intermediate layer became worse as
the values of capacitance (Qcoat and Qin) were higher and resistance (Rpor and Rin)
were lower than those of PVB sol-gel coating without glass flake. This may
indicate that the addition of GF001 may introduce a greater number of large pores
Sol-gel coating
Immersion time (hour) 1 24 96 1 24 96 1 24 96 192 1 24 96 192
Goodness (10-3) 5.54 4.09 3.93 6.55 2.36 1.82 2.91 1.14 3.11 0.86 5.03 5.17 5.94 0.85
Rs (Ω·cm2) 28.0 36.4 13.2 25.8 48.1 46.7 13.2 23.9 24.0 22.6 16.0 24.4 23.0 17.3
Qcoat (nS·cm−2) 42 1352 2258 48 975 1795 43 1414 1644 1943 62 2116 2756 5042
ncoat 0.82 0.62 0.66 0.80 0.69 0.64 0.88 0.62 0.64 0.68 0.84 0.69 0.67 0.72
Rpor (Ω·cm2) 35715 3837 146 93867 9174 804 33491 3861 953 786 31215 778 547 62
Cin (μS·cm−2) 0.2 7.1 18.1 2.3 2.8 7.7 1.2 1.9 4.1 8.2 2.1 8.7 12.3 16.5
nin 0.75 0.73 0.70 0.83 0.72 0.66 0.84 0.83 0.84 0.80 0.88 0.78 0.76 0.79
Rin (kΩ·cm2) 18330 466 51 19063 1836 356 18650 1641 614 526 15683 514 416 213
RCT (kΩ·cm2) 586 64
Cdl (μS·cm−2) 2.0 15.5
ndl 0.90 0.83
GF001_PANI_NF/NMP_PVB PANI_NF/NMP_PVBGF001_PVB SG_PVB_4
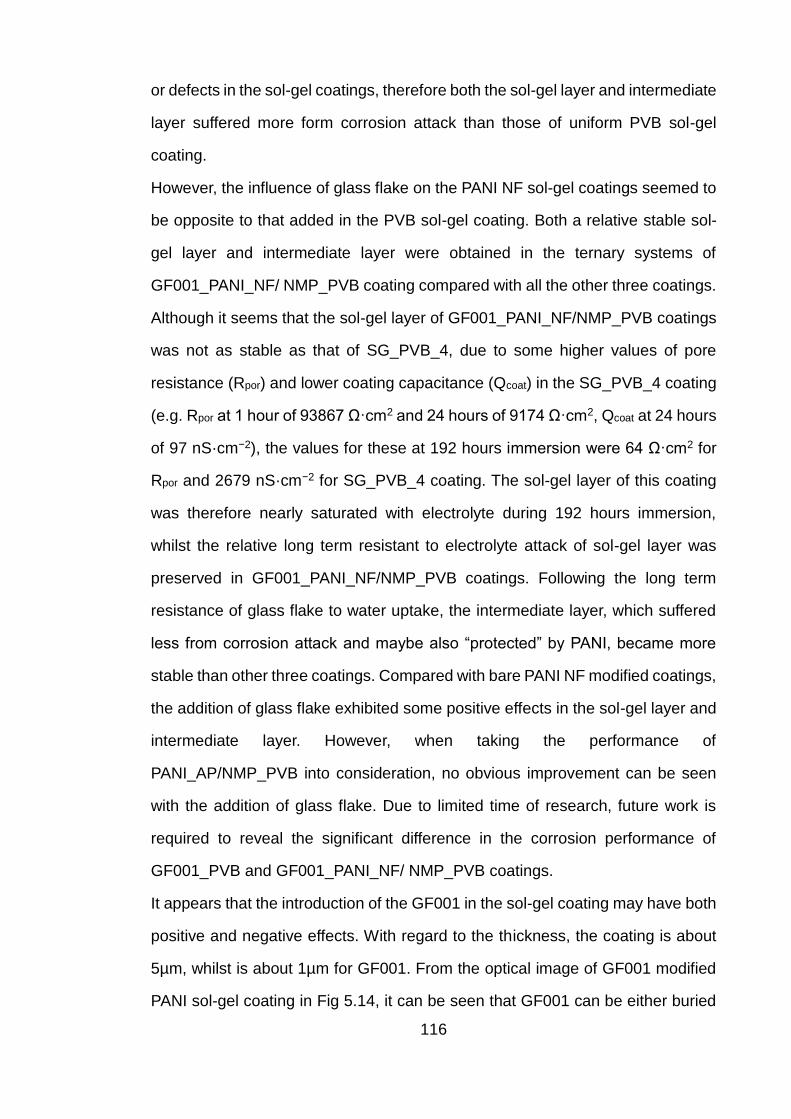
116
or defects in the sol-gel coatings, therefore both the sol-gel layer and intermediate
layer suffered more form corrosion attack than those of uniform PVB sol-gel
coating.
However, the influence of glass flake on the PANI NF sol-gel coatings seemed to
be opposite to that added in the PVB sol-gel coating. Both a relative stable sol-
gel layer and intermediate layer were obtained in the ternary systems of
GF001_PANI_NF/ NMP_PVB coating compared with all the other three coatings.
Although it seems that the sol-gel layer of GF001_PANI_NF/NMP_PVB coatings
was not as stable as that of SG_PVB_4, due to some higher values of pore
resistance (Rpor) and lower coating capacitance (Qcoat) in the SG_PVB_4 coating
(e.g. Rpor at 1 hour of 93867 Ω·cm2 and 24 hours of 9174 Ω·cm2, Qcoat at 24 hours
of 97 nS·cm−2), the values for these at 192 hours immersion were 64 Ω·cm2 for
Rpor and 2679 nS·cm−2 for SG_PVB_4 coating. The sol-gel layer of this coating
was therefore nearly saturated with electrolyte during 192 hours immersion,
whilst the relative long term resistant to electrolyte attack of sol-gel layer was
preserved in GF001_PANI_NF/NMP_PVB coatings. Following the long term
resistance of glass flake to water uptake, the intermediate layer, which suffered
less from corrosion attack and maybe also “protected” by PANI, became more
stable than other three coatings. Compared with bare PANI NF modified coatings,
the addition of glass flake exhibited some positive effects in the sol-gel layer and
intermediate layer. However, when taking the performance of
PANI_AP/NMP_PVB into consideration, no obvious improvement can be seen
with the addition of glass flake. Due to limited time of research, future work is
required to reveal the significant difference in the corrosion performance of
GF001_PVB and GF001_PANI_NF/ NMP_PVB coatings.
It appears that the introduction of the GF001 in the sol-gel coating may have both
positive and negative effects. With regard to the thickness, the coating is about
5µm, whilst is about 1µm for GF001. From the optical image of GF001 modified
PANI sol-gel coating in Fig 5.14, it can be seen that GF001 can be either buried
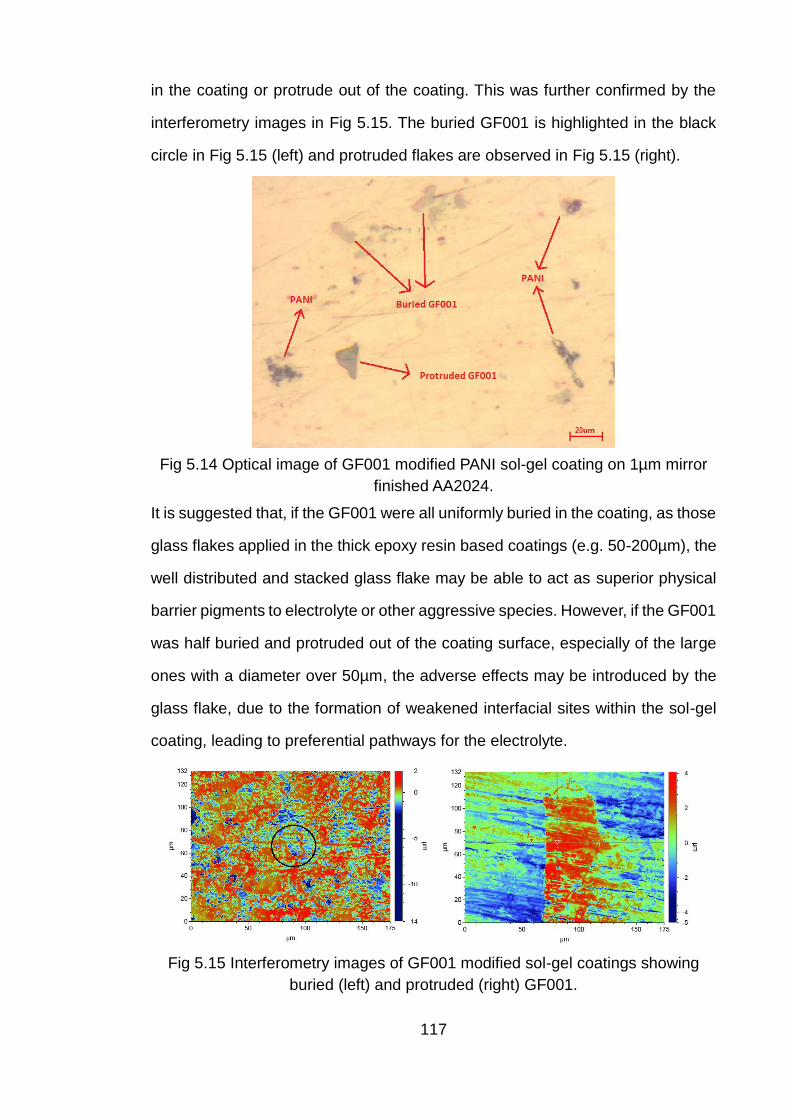
117
in the coating or protrude out of the coating. This was further confirmed by the
interferometry images in Fig 5.15. The buried GF001 is highlighted in the black
circle in Fig 5.15 (left) and protruded flakes are observed in Fig 5.15 (right).
Fig 5.14 Optical image of GF001 modified PANI sol-gel coating on 1µm mirror
finished AA2024.
It is suggested that, if the GF001 were all uniformly buried in the coating, as those
glass flakes applied in the thick epoxy resin based coatings (e.g. 50-200µm), the
well distributed and stacked glass flake may be able to act as superior physical
barrier pigments to electrolyte or other aggressive species. However, if the GF001
was half buried and protruded out of the coating surface, especially of the large
ones with a diameter over 50µm, the adverse effects may be introduced by the
glass flake, due to the formation of weakened interfacial sites within the sol-gel
coating, leading to preferential pathways for the electrolyte.
Fig 5.15 Interferometry images of GF001 modified sol-gel coatings showing
buried (left) and protruded (right) GF001.
118
It may therefore be concluded that, the modification of the sol-gel coating by glass
flake may not be able to efficiently improve the anticorrosive performance of the
coating. Due to the lack of bonding of the GF001 surface, small thickness ratio of
sol-gel coating: GF001 (5:1) and variations of the diameter of GF001 (10~200µm),
the properties of bare glass flake modified PVB sol-gel coatings lead to poor
corrosion protection performance. When glass flake was used together with PANI,
only limited improvement was obtained due to both the positive and negative
effects introduced by GF001 to the sol-gel coating. Thus, unless uniform sol-gel
coatings can be produced with glass flake buried, distributed or evenly stacked
within the sol-gel matrix, improvement of corrosion protection performance may
not be possible to obtain with coatings of this thickness.
119
Chapter 6 Conclusions and future work
6.1 Conclusions
This dissertation has reported on the corrosion protection of AA2024-T3 alloy by
various modified hybrid titania-containing sol-gel coatings. The modifications
were made by the addition of commercial products of polyvinyl butyral (PVB) and
glass flake (GF001) as well as the as-synthesised polyaniline (PANI) emeraldine
salt of agglomerated particles and nanofibers, along with commercial product of
PANI ES on carbon black. The corrosion protection performance of AA2024 alloy
coated with standard and modified sol-gel coatings were evaluated by
electrochemical impedance spectroscopy during immersion in 3.5% NaCl
solution. Important properties of the coatings, such as adhesion strength, surface
hydrophobicity, thermal stability and chemical bonding, were all assessed by
different techniques.
Based on the work in this study, the following conclusions may be drawn:
6.1.1 Preparation of materials
1. Alkaline etching followed by acid desmutting is effective in removing the native
oxide layer and Cu-rich intermetallic particles to produce a clean, uniform,
hydrophobic and chemical active surface of AA2024.
2. Pure, uniform PANI nanofibers can be synthesised via the chemical oxidative
polymerization of aniline by ammonia persulphate in aqueous 1M HNO3
solution via rapid-mixing method, whilst agglomerated particles of PANI can
be produced through a slow-mixing route.
3. A temperature of 120℃ for curing the standard sol-gel coating is also a
suitable cure temperature for all the modified coatings.
4. Modification of the sol-gel through addition of all the pigments influences the
hydrolysis and condensation processes of the standard sol-gels.
120
6.1.2 Properties of the sol-gel coatings
1. Modification by PANI increases the hydrophobicity of the sol-gel coating,
whereas PVB and GF001 cause the surface of the coating to be more
hydrophilic.
2. Excellent adhesion can be achieved between the alkaline cleaned AA2024
substrate and all sol-gel coating systems, whereas the coatings are poorly
bonded on the surface of acetone degreased or acid desmutted AA2024
substrates.
3. Standard PVB modified coatings are thermally unstable in comparison to a
standard sol-gel coating. However, modification by PANI or glass flake on
PVB coatings improves the thermal stability in comparison to the standard sol-
gel coating.
6.1.3 Corrosion performance
1. Increased corrosion protection performance of the coating can be directly
related to increased adhesion strength.
2. The standard sol-gel coating can only provide limited corrosion protection for
AA2024 alloy in 3.5% NaCl solution, due to the porous nature of the sol-gel
network.
3. Modification of the sol-gel by PVB is effective in improving the corrosion
protection. The optimum volume ratio of PVB (10% ethanol solution) versus
the standard sol was found to be 1:4.
4. The addition of PANI ES agglomerated particles is effective for the production
of a homogeneous, dense and uniform sol-gel coating providing a stable
intermediate layer and better corrosion protection performance. In
comparison PANI nanofibers offer no obvious improvement. The commercial
product of PANI ES on carbon black is not suitable for corrosion protection in
the sol-gel coatings, due to the high ratio of bond-free and conductive carbon
121
black, which leads to larger pores and defects in the sol-gel network.
5. Modification of the sol-gel by GF001 is not suitable for the production of thin
sol-gel coatings as more defects are introduced and poor corrosion resistance
results. However, when glass flake is used in combination with PANI,
improved corrosion protection performance can be achieved, but with greater
variations on the properties as the glass flake can be either buried in the sol-
gel matrix or protrude out of the coating surface.
122
6.2 Future work
Based on the results of the present study, the following suggestions for
future work are proposed below:
1. The influence of PVB on the degree of hydrolysis and condensation of the
standard sol-gel may be clarified from an XPS study.
2. Further improvement in corrosion protection performance of PANI
modified sol-gel coatings may be achieved by increasing the ratio of PANI
ES AP or using well dispersed PANI nanoparticles (e.g. using
dodecylbenzene sulphonic acid as a dopant).
3. To explore the mechanism of corrosion protection by PANI, the surface
oxide of AA2024 and oxidation state of PANI may need to be studied when
both materials directly interact with each other and are immersed in wet
conditions. A scratch corrosion test on PANI (EB and ES) only film on
AA2024 may also be possible to reveal the nature of the protection
mechanism.
4. Modification of GF001 prior to the addition in sol-gel, typically surface
cleaning or salinization, may be possible to enhance the chemical
interactions between the sol-gel and glass flake. The glass flake may also
be modified by PANI to produce GF-PANI composites before applied in
the sol-gel. Smaller (diameter less than 10µm) and thinner (thickness of
100 nm) glass flake may also provide uniform, dense thin films.
5. Use different ratios of PANI and GF001 to explore the interaction between
them and its influence on the corrosion performance of prepared coatings.
6. In-situ synthesized PANI-TiO2 nanoplate in the sol-gel may be a promising
pigment to improve the corrosion protection performance of the coatings.

123
References Uncategorized References
1. Ahmad, Z., Principles of corrosion engineering and corrosion control. 2006:
Butterworth-Heinemann.
2. Revie, R.W., Corrosion and corrosion control. 2008: John Wiley & Sons.
3. Marcus, P., Corrosion mechanisms in theory and practice. 2011: CRC Press.
4. Uhlig, H.H. and R.W. Revie, Uhlig's corrosion handbook. Vol. 51. 2011: John Wiley
& Sons.
5. Schweitzer, P.A., Fundamentals of metallic corrosion: atmospheric and media
corrosion of metals. 2006: CRC press.
6. Kaesche, H., Corrosion of metals: physicochemical principles and current
problems. 2003: Springer.
7. Schweitzer, P.A., Fundamentals of corrosion: mechanisms, causes, and
preventative methods. 2009: CRC Press.
8. McCafferty, E., Introduction to corrosion science. 2010: Springer.
9. Wessel, J.K., The handbook of advanced materials: enabling new designs. 2004:
John Wiley & Sons.
10. Cottis, R., Shreir's Corrosion. 2010: Elsevier Amsterdam.
11. Bardal, E., Corrosion and protection. 2004: Springer.
12. Cicek, V., Cathodic Protection: Industrial Solutions for Protecting Against
Corrosion. 2013: John Wiley & Sons.
13. Ghali, E., V.S. Sastri, and M. Elboujdaini, Corrosion prevention and protection:
practical solutions. 2007: John Wiley & Sons.
14. von Baeckmann, W., W. Schwenk, and W. Prinz, Handbook of Cathodic Corrosion
Protection. 1997: Gulf Professional Publishing.
15. Schweitzer, P.A., Corrosion of Linings & Coatings: Cathodic and Inhibitor
Protection and Corrosion Monitoring. 2006: CRC press.
16. Sastri, V.S., Green corrosion inhibitors: Theory and practice. Vol. 10. 2012: John
Wiley & Sons.
124
17. Sørensen, P.A., et al., Anticorrosive coatings: a review. Journal of Coatings
Technology and Research, 2009. 6(2): p. 135-176.
18. Wicks Jr, Z.W., et al., Organic coatings: science and technology. 2007: John Wiley
& Sons.
19. Forsgren, A., Corrosion control through organic coatings. 2006: CRC Press.
20. Vargel, C., Corrosion of aluminium. 2004: Elsevier.
21. Kaufman, J.G., Introduction to aluminum alloys and tempers. 2000: ASM
International.
22. Davis, J.R. and J.R. Davis, Aluminum and aluminum alloys. 1993: ASM
international.
23. Chen, G., M. Gao, and R. Wei, Microconstituent-induced pitting corrosion in
aluminum alloy 2024-T3. Corrosion, 1996. 52(1): p. 8-15.
24. Buchheit, R., et al., Local Dissolution Phenomena Associated with S Phase
(Al2CuMg) Particles in Aluminum Alloy 2024‐T3. Journal of the Electrochemical
Society, 1997. 144(8): p. 2621-2628.
25. Yasakau, K.A., et al., Mechanism of Corrosion Inhibition of AA2024 by Rare-Earth
Compounds. The Journal of Physical Chemistry B, 2006. 110(11): p. 5515-5528.
26. Davis, J.R., Corrosion of aluminum and aluminum alloys. 1999: ASM International.
27. Buchheit, R.G., M.A. Martinez, and L.P. Montes, Evidence for Cu Ion Formation by
Dissolution and Dealloying the Al2CuMg Intermetallic Compound in Rotating Ring‐
Disk Collection Experiments. Journal of The Electrochemical Society, 2000. 147(1): p.
119-124.
28. Buchheit, R., et al., The Electrochemical Characteristics of Bulk‐Synthesized
Al2CuMg. Journal of The Electrochemical Society, 1999. 146(12): p. 4424-4428.
29. Bocher, F., H.M. Flower, and M.P. Ryan, The Effect of Microstructure on Localized
Corrosion in Creep Age-Formable Aluminum Alloys: Identification of Intermetallic
Particles and Pit Initiation Sites. Journal of The Electrochemical Society, 2006. 153(12):
p. B551-B554.
30. Twite, R. and G. Bierwagen, Review of alternatives to chromate for corrosion
protection of aluminum aerospace alloys. Progress in organic coatings, 1998. 33(2): p.
91-100.
125
31. Schmutz, P. and G.S. Frankel, Characterization of AA2024‐T3 by Scanning
Kelvin Probe Force Microscopy. Journal of The Electrochemical Society, 1998. 145(7):
p. 2285-2295.
32. Campestrini, P., et al., Relation between microstructural aspects of AA2024 and its
corrosion behaviour investigated using AFM scanning potential technique. Corrosion
Science, 2000. 42(11): p. 1853-1861.
33. Zhang, W. and G.S. Frankel, Transitions between pitting and intergranular
corrosion in AA2024. Electrochimica Acta, 2003. 48(9): p. 1193-1210.
34. MacQueen, R., R. Miron, and R. Granata, Method for corrosion inhibitor
mechanism studies in epoxy coated aluminium. JCT, Journal of coatings technology,
1996. 68(857): p. 75-82.
35. Lamaka, S.V., et al., High effective organic corrosion inhibitors for 2024 aluminium
alloy. Electrochimica Acta, 2007. 52(25): p. 7231-7247.
36. Birbilis, N., et al., Inhibition of AA2024-T3 on a Phase-by-Phase Basis Using an
Environmentally Benign Inhibitor, Cerium Dibutyl Phosphate. Electrochemical and
Solid-State Letters, 2005. 8(11): p. C180-C183.
37. Domingues, L., et al., EIS on plasma-polymerised coatings used as pre-treatment
for aluminium alloys. Electrochimica Acta, 2002. 47(13-14): p. 2253-2258.
38. Fernandes, J.C.S., et al., Plasma-polymerised coatings used as pre-treatment for
aluminium alloys. Surface and Coatings Technology, 2002. 154(1): p. 8-13.
39. Wang, H. and R. Akid, A room temperature cured sol-gel anticorrosion pre-
treatment for Al 2024-T3 alloys. Corrosion Science, 2007. 49(12): p. 4491-4503.
40. Zheludkevich, M.L., et al., Corrosion protective properties of nanostructured sol-gel
hybrid coatings to AA2024-T3. Surface and Coatings Technology, 2006. 200(9): p.
3084-3094.
41. Shchukin, D.G., et al., Layer‐by‐Layer Assembled Nanocontainers for Self‐
Healing Corrosion Protection. Advanced Materials, 2006. 18(13): p. 1672-1678.
42. Green, W.J. and C.R. Hegedus, Combination primer/topcoat coating. 1989, Google
Patents.
43. Hu, J.-M., et al., Electrodeposition of silane films on aluminum alloys for corrosion
protection. Progress in Organic Coatings, 2007. 58(4): p. 265-271.
44. Arenas, M., et al., Synthesis and electrochemical evaluation of polypyrrole coatings
electrodeposited onto AA-2024 alloy. Progress in Organic Coatings, 2008. 62(1): p. 79-
86.
126
45. Tallman, D.E., et al., Electroactive conducting polymers for corrosion control.
Journal of Solid State Electrochemistry, 2001. 6(2): p. 73-84.
46. Tallman, D., Y. Pae, and G. Bierwagen, Conducting polymers and corrosion: part
2-polyaniline on aluminum alloys. Corrosion, 2000. 56(4): p. 401-410.
47. He, J., et al., Conducting Polymers and Corrosion III. A Scanning Vibrating
Electrode Study of Poly(3‐octyl pyrrole) on Steel and Aluminum. Journal of The
Electrochemical Society, 2000. 147(10): p. 3667-3672.
48. Mansfeld, F. and M.W. Kendig, Evaluation of Anodized Aluminum Surfaces with
Electrochemical Impedance Spectroscopy. Journal of The Electrochemical Society,
1988. 135(4): p. 828-833.
49. Liu, Z., et al., Fundamental understanding of the corrosion performance of laser-
melted metallic alloys. Surface and Coatings Technology, 2006. 200(18-19): p. 5514-
5525.
50. Raps, D., et al., Electrochemical study of inhibitor-containing organic-inorganic
hybrid coatings on AA2024. Corrosion Science, 2009. 51(5): p. 1012-1021.
51. Zheludkevich, M., et al., Nanostructured sol-gel coatings doped with cerium nitrate
as pre-treatments for AA2024-T3: Corrosion protection performance. Electrochimica
Acta, 2005. 51(2): p. 208-217.
52. Schem, M., et al., CeO< sub> 2</sub>-filled sol-gel coatings for corrosion
protection of AA2024-T3 aluminium alloy. Corrosion Science, 2009. 51(10): p. 2304-
2315.
53. Gonzalez, E., et al., A silanol-based nanocomposite coating for protection of AA-
2024 aluminium alloy. Electrochimica Acta, 2011. 56(22): p. 7586-7595.
54. Vreugdenhil, A., V. Balbyshev, and M. Donley, Nanostructured silicon sol-gel
surface treatments for Al 2024-T3 protection. Journal of Coatings Technology, 2001.
73(915): p. 35-43.
55. Voevodin, N., et al., An organically modified zirconate film as a corrosion-resistant
treatment for aluminum 2024-T3. Progress in Organic Coatings, 2001. 41(4): p. 287-
293.
56. Wen, J. and G.L. Wilkes, Organic/Inorganic Hybrid Network Materials by the
Sol−Gel Approach. Chemistry of Materials, 1996. 8(8): p. 1667-1681.
57. Hench, L.L. and J.K. West, The sol-gel process. Chemical Reviews, 1990. 90(1): p.
33-72.
127
58. Brinker, C.J. and G.W. Scherer, Sol-gel science: the physics and chemistry of sol-
gel processing. 1990: Gulf Professional Publishing.
59. Graham, T., XXXV.-On the properties of silicic acid and other analogous colloidal
substances. Journal of the Chemical Society, 1864. 17(0): p. 318-327.
60. ROY, R., Ceramics by the Solution-Sol-Gel Route. Science, 1987. 238(4834): p.
1664-1669.
61. Wang, D. and G.P. Bierwagen, Sol-gel coatings on metals for corrosion protection.
Progress in Organic Coatings, 2009. 64(4): p. 327-338.
62. Pierre, A.C., Introduction to sol-gel processing. Vol. 1. 1998: Springer.
63. Lerouge, F., G. Cerveau, and R.J. Corriu, Supramolecular self-organization in non-
crystalline hybrid organic-inorganic nanomaterials induced by van der Waals
interactions. New journal of chemistry, 2006. 30(10): p. 1364-1376.
64. Znaidi, L., Sol-gel-deposited ZnO thin films: A review. Materials Science and
Engineering: B, 2010. 174(1-3): p. 18-30.
65. Ciriminna, R., et al., The sol-gel route to advanced silica-based materials and
recent applications. Chem Rev, 2013. 113(8): p. 6592-620.
66. Wright, J.D. and N.A. Sommerdijk, Sol-gel materials: chemistry and applications.
Vol. 4. 2000: CRC press.
67. Zheludkevich, M.L., I.M. Salvado, and M.G.S. Ferreira, Sol-gel coatings for
corrosion protection of metals. Journal of Materials Chemistry, 2005. 15(48): p. 5099.
68. Wang, H. and R. Akid, Encapsulated cerium nitrate inhibitors to provide high-
performance anti-corrosion sol-gel coatings on mild steel. Corrosion Science, 2008.
50(4): p. 1142-1148.
69. Wang, H., R. Akid, and M. Gobara, Scratch-resistant anticorrosion sol-gel coating
for the protection of AZ31 magnesium alloy via a low temperature sol-gel route.
Corrosion Science, 2010. 52(8): p. 2565-2570.
70. Yuan, J. and S. Tsujikawa, Characterization of Sol‐Gel‐Derived TiO2 Coatings
and Their Photoeffects on Copper Substrates. Journal of the Electrochemical Society,
1995. 142(10): p. 3444-3450.
71. Atik, M., et al., Sol-gel thin films for corrosion protection. Ceramics International,
1995. 21(6): p. 403-406.
72. Guglielmi, M., Sol-gel coatings on metals. Journal of sol-gel science and
technology, 1997. 8(1-3): p. 443-449.
128
73. Chou, T., C. Chandrasekaran, and G. Cao, Sol-gel-derived hybrid coatings for
corrosion protection. Journal of Sol-Gel Science and Technology, 2003. 26(1-3): p.
321-327.
74. Fedrizzi, L., et al., The use of electrochemical techniques to study the corrosion
behaviour of organic coatings on steel pretreated with sol-gel zirconia films.
Electrochimica Acta, 2001. 46(24): p. 3715-3724.
75. Masalski, J., et al., Improvement in corrosion resistance of the 316l stainless steel
by means of Al< sub> 2</sub> O< sub> 3</sub> coatings deposited by the sol-gel
method. Thin Solid Films, 1999. 349(1): p. 186-190.
76. Shen, G., Y. Chen, and C. Lin, Corrosion protection of 316 L stainless steel by a
TiO< sub> 2</sub> nanoparticle coating prepared by sol-gel method. Thin Solid Films,
2005. 489(1): p. 130-136.
77. Zheludkevich, M., et al., Corrosion protective properties of nanostructured sol-gel
hybrid coatings to AA2024-T3. Surface and Coatings Technology, 2006. 200(9): p.
3084-3094.
78. Lamaka, S., et al., Novel hybrid sol-gel coatings for corrosion protection of AZ31B
magnesium alloy. Electrochimica Acta, 2008. 53(14): p. 4773-4783.
79. Poznyak, S.K., et al., Preparation and corrosion protective properties of
nanostructured titania-containing hybrid sol-gel coatings on AA2024. Progress in
Organic Coatings, 2008. 62(2): p. 226-235.
80. Ono, S., et al., Improvement of Corrosion Resistance of Metals by an
Environmentally Friendly Silica Coating Method. Journal of Sol-Gel Science and
Technology, 2004. 29(3): p. 147-153.
81. Lamaka, S.V., et al., Nanoporous titania interlayer as reservoir of corrosion
inhibitors for coatings with self-healing ability. Progress in Organic Coatings, 2007.
58(2-3): p. 127-135.
82. Yasakau, K.A., et al., Influence of sol-gel process parameters on the protection
properties of sol-gel coatings applied on AA2024. Surface and Coatings Technology,
2014. 246: p. 6-16.
83. Sánchez Majado, S., et al., Recubrimiento sol-gel con nanopartículas cerámicas
para la protección de un sustrato y procedimiento para su obtención. 2010.
84. Jiménez-Morales, A., et al., Organic-Inorganic Sol-Gel Coatings Modified with TiO2
Nanoparticles for Corrosion Protection of a Powder Metallurgical Aluminum Alloy.
Meeting Abstracts, 2012. MA2012-02(25): p. 2352.
129
85. Phillips, J., Bonds and bands in semiconductors. 2012: Elsevier.
86. Shirakawa, H., et al., Synthesis of electrically conducting organic polymers:
halogen derivatives of polyacetylene,(CH) x. J. Chem. Soc., Chem. Commun.,
1977(16): p. 578-580.
87. MacDiarmid, A.G., “Synthetic metals”: A novel role for organic polymers (Nobel
lecture). Angewandte Chemie International Edition, 2001. 40(14): p. 2581-2590.
88. Wan, M., Conducting polymers with micro or nanometer structure. 2008: Springer.
89. MacDiarmid, A.G., Synthetic metals: a novel role for organic polymers. Synthetic
Metals, 2001. 125(1): p. 11-22.
90. Leroux, F., et al., In Encyclopedia of Nanoscience and Nanotechnology; Nalwa,
HS, Ed. 2011, American Scientific Publishers: Stevenson Ranch, CA.
91. Letheby, H., XXIX.—On the production of a blue substance by the electrolysis of
sulphate of aniline. J. Chem. Soc., 1862. 15: p. 161-163.
92. Chiang, J.-C. and A.G. MacDiarmid, ‘Polyaniline’: protonic acid doping of the
emeraldine form to the metallic regime. Synthetic Metals, 1986. 13(1): p. 193-205.
93. MacDiarmid, A., et al., Polyaniline: a new concept in conducting polymers.
Synthetic Metals, 1987. 18(1): p. 285-290.
94. Epstein, A., et al., Insulator-to-metal transition in polyaniline. Synthetic Metals,
1987. 18(1): p. 303-309.
95. Li, D., J. Huang, and R.B. Kaner, Polyaniline nanofibers: a unique polymer
nanostructure for versatile applications. Accounts of chemical research, 2008. 42(1): p.
135-145.
96. Carenza, M. and G. Palma, Radiation-induced heterophase polymerizations.
Particle morphology of as-polymerized polyacrylonitrile. European Polymer Journal,
1985. 21(1): p. 41-47.
97. Marie, E., et al., Synthesis of polyaniline particles via inverse and direct
miniemulsion. Macromolecules, 2003. 36(11): p. 3967-3973.
98. Kuramoto, N. and A. Tomita, Chemical oxidative polymerization of
dodecylbenzenesulfonic acid aniline salt in chloroform. Synthetic Metals, 1997. 88(2):
p. 147-151.
99. Miras, M.C., C. Barbero, and O. Haas, Preparation of polyaniline by
electrochemical polymerization of aniline in acetonitrile solution. Synthetic Metals,
1991. 43(1-2): p. 3081-3084.
130
100. Dallas, P., et al., Characterization, magnetic and transport properties of
polyaniline synthesized through interfacial polymerization. Polymer, 2007. 48(11): p.
3162-3169.
101. Chen, J., et al., Novel interfacial polymerization for radially oriented polyaniline
nanofibers. Materials Letters, 2007. 61(6): p. 1419-1423.
102. Huang, J. and R.B. Kaner, A general chemical route to polyaniline nanofibers.
Journal of the American Chemical Society, 2004. 126(3): p. 851-855.
103. Huang, J. and R.B. Kaner, Nanofiber formation in the chemical polymerization
of aniline: a mechanistic study. Angew Chem Int Ed Engl, 2004. 43(43): p. 5817-21.
104. Qiang, J., et al., Polyaniline nanofibers synthesized by rapid mixing
polymerization. Synthetic Metals, 2008. 158(13): p. 544-547.
105. Zhang, X., W.J. Goux, and S.K. Manohar, Synthesis of polyaniline nanofibers
by “nanofiber seeding”. Journal of the American Chemical Society, 2004. 126(14): p.
4502-4503.
106. Xing, S., et al., Morphology and conductivity of polyaniline nanofibers prepared
by ‘seeding’polymerization. Polymer, 2006. 47(7): p. 2305-2313.
107. Guo, Q., et al., Chemical synthesis of cross-linked polyaniline by a novel
solvothermal metathesis reaction of p-dichlorobenzene with sodium amide. Polymer,
2005. 46(9): p. 3185-3189.
108. Zhang, L. and M. Wan, Self‐Assembly of Polyaniline—From Nanotubes to
Hollow Microspheres. Advanced Functional Materials, 2003. 13(10): p. 815-820.
109. Yang, C.H., et al., Molecular assembled self-doped polyaniline copolymer
ultra-thin films. Polymer, 2007. 48(11): p. 3237-3247.
110. Zhang, L. and M. Wan, Chiral polyaniline nanotubes synthesized via a self-
assembly process. Thin Solid Films, 2005. 477(1-2): p. 24-31.
111. Jing, X., et al., Polyaniline nanofibers prepared with ultrasonic irradiation.
Journal of Polymer Science Part A: Polymer Chemistry, 2006. 44(2): p. 1014-1019.
112. Jing, X., et al., Sonochemical synthesis of polyaniline nanofibers. Ultrasonics
Sonochemistry, 2007. 14(1): p. 75-80.
113. Delvaux, M., et al., Chemical and electrochemical synthesis of polyaniline
micro-and nano-tubules. Synthetic Metals, 2000. 113(3): p. 275-280.
114. Tang, Z., et al., Electrochemical synthesis of polyaniline nanoparticles.
Electrochemistry communications, 2000. 2(1): p. 32-35.
131
115. Bhadra, S., N.K. Singha, and D. Khastgir, Electrochemical synthesis of
polyaniline and its comparison with chemically synthesized polyaniline. Journal of
Applied Polymer Science, 2007. 104(3): p. 1900-1904.
116. Huang, J., et al., Mechanochemical route to the conducting polymer
polyaniline. Macromolecules, 2005. 38(2): p. 317-321.
117. Martin, C.R., Template synthesis of electronically conductive polymer
nanostructures. Accounts of Chemical Research, 1995. 28(2): p. 61-68.
118. Nickels, P., et al., Polyaniline nanowire synthesis templated by DNA.
Nanotechnology, 2004. 15(11): p. 1524.
119. Zhang, Z., et al., Synthesis of polyaniline with a hollow, octahedral morphology
by using a cuprous oxide template. Advanced Materials, 2005. 17(23): p. 2854-2857.
120. Pan, L., et al., Synthesis of polyaniline nanotubes with a reactive template of
manganese oxide. Advanced Materials, 2007. 19(3): p. 461-464.
121. Liu, W., et al., Enzymatically synthesized conducting polyaniline. Journal of the
American Chemical Society, 1999. 121(1): p. 71-78.
122. Liu, W., et al., Enzymatic synthesis of conducting polyaniline in micelle
solutions. Langmuir, 2002. 18(25): p. 9696-9704.
123. Cruz-Silva, R., et al., Enzymatic synthesis of colloidal polyaniline particles.
Polymer, 2006. 47(5): p. 1563-1568.
124. Cruz, G., et al., Synthesis of polyaniline films by plasma polymerization.
Synthetic metals, 1997. 88(3): p. 213-218.
125. Gong, X., et al., Plasma‐polymerized polyaniline films: Synthesis and
characterization. Journal of Polymer Science Part A: Polymer Chemistry, 1998. 36(4):
p. 633-643.
126. De Barros, R., W. De Azevedo, and F. De Aguiar, Photo-induced
polymerization of polyaniline. Materials characterization, 2003. 50(2): p. 131-134.
127. Khanna, P., et al., Synthesis of Ag/polyaniline nanocomposite via an in situ
photo-redox mechanism. Materials Chemistry and Physics, 2005. 92(1): p. 214-219.
128. Ćirić-Marjanović, G., Recent advances in polyaniline research: Polymerization
mechanisms, structural aspects, properties and applications. Synthetic Metals, 2013.
177: p. 1-47.
132
129. Stejskal, J., I. Sapurina, and M. Trchová, Polyaniline nanostructures and the
role of aniline oligomers in their formation. Progress in Polymer Science, 2010. 35(12):
p. 1420-1481.
130. Stejskal, J., P. Kratochvil, and A.D. Jenkins, The formation of polyaniline and
the nature of its structures. Polymer, 1996. 37(2): p. 367-369.
131. Tran, H.D., et al., The oxidation of aniline to produce “polyaniline”: a process
yielding many different nanoscale structures. Journal of Materials Chemistry, 2011.
21(11): p. 3534.
132. Huang, J. and R.B. Kaner, Nanofiber formation in the chemical polymerization
of aniline: a mechanistic study. Angewandte Chemie, 2004. 116(43): p. 5941-5945.
133. Li, D. and R.B. Kaner, Shape and aggregation control of nanoparticles: not
shaken, not stirred. Journal of the American Chemical Society, 2006. 128(3): p. 968-
975.
134. DeBerry, D.W., Modification of the electrochemical and corrosion behavior of
stainless steels with an electroactive coating. Journal of the Electrochemical society,
1985. 132(5): p. 1022-1026.
135. Tallman, D., Y. Pae, and G. Bierwagen, Conducting polymers and corrosion:
polyaniline on steel. Corrosion, 1999. 55(8): p. 779-786.
136. Racicot, R., R. Brown, and S.C. Yang, Corrosion protection of aluminum alloys
by double-strand polyaniline. Synthetic Metals, 1997. 85(1-3): p. 1263-1264.
137. Epstein, A.J., et al., Corrosion protection of aluminum and aluminum alloys by
polyanilines: A potentiodynamic and photoelectron spectroscopy study. Synthetic
Metals, 1999. 102(1-3): p. 1374-1376.
138. Jing, X., et al., Synthesis, structure, properties and applications of conducting
polyaniline. Acta Polymerica Sinica, 2005. 5: p. 655.
139. Williams, G. and H.N. McMurray, Polyaniline inhibition of filiform corrosion on
organic coated AA2024-T3. Electrochimica Acta, 2009. 54(17): p. 4245-4252.
140. Gupta, G., et al., Polyaniline-lignosulfonate/epoxy coating for corrosion
protection of AA2024-T3. Corrosion Science, 2013. 67: p. 256-267.
141. Kamaraj, K., et al., Electropolymerised polyaniline films as effective
replacement of carcinogenic chromate treatments for corrosion protection of aluminium
alloys. Synthetic Metals, 2012. 162(5-6): p. 536-542.
133
142. Akid, R., M. Gobara, and H. Wang, Corrosion protection performance of novel
hybrid polyaniline/sol-gel coatings on an aluminium 2024 alloy in neutral, alkaline and
acidic solutions. Electrochimica Acta, 2011. 56(5): p. 2483-2492.
143. Seegmiller, J.C., et al., Mechanism of action of corrosion protection coating for
AA2024-T3 based on poly (aniline)-poly (methylmethacrylate) blend. Journal of The
Electrochemical Society, 2005. 152(2): p. B45-B53.
144. Khanna, A.S., High-performance organic coatings. 2008: Elsevier.
145. Ghaffari, M., M. Ehsani, and H.A. Khonakdar, Morphology, rheological and
protective properties of epoxy/nano-glassflake systems. Progress in Organic Coatings,
2014. 77(1): p. 124-130.
146. González-Guzmán, J., et al., Resistance of metallic substrates protected by an
organic coating containing glass flakes. Progress in Organic Coatings, 2010. 68(3): p.
240-243.
147. Nematollahi, M., et al., Comparison between the effect of nanoglass flake and
montmorillonite organoclay on corrosion performance of epoxy coating. Corrosion
Science, 2010. 52(5): p. 1809-1817.
148. Ehsani, M., H.A. Khonakdar, and A. Ghadami, Assessment of morphological,
thermal, and viscoelastic properties of epoxy vinyl ester coating composites: Role of
glass flake and mixing method. Progress in Organic Coatings, 2013. 76(1): p. 238-243.
149. Sathiyanarayanan, S., S. Syed Azim, and G. Venkatachari, Corrosion
protection coating containing polyaniline glass flake composite for steel. Electrochimica
Acta, 2008. 53(5): p. 2087-2094.
150. Feng, Z., et al., Influence of surface pretreatments on the corrosion protection
of sol-gel coated AA2024-T3 aluminium alloy. Surface and Interface Analysis, 2013.
45(10): p. 1452-1456.
151. See Supplemental Material at http://www.wilsonsmetals.com/ for QQ-A-250/4
AA2024-T3 alloy (Date of reference : 2014/08/01).
152. See Supplemental Material at http://www.q-lab.com/ for QQ-A-250/4 AA2024-
T3 alloy (Date of reference: 2014/08/01).
153. Huang, W.-S., B.D. Humphrey, and A.G. MacDiarmid, Polyaniline, a novel
conducting polymer. Morphology and chemistry of its oxidation and reduction in
aqueous electrolytes. Journal of the Chemical Society, Faraday Transactions 1:
Physical Chemistry in Condensed Phases, 1986. 82(8): p. 2385-2400.
134
154. YENER, F. and O. JIRSAK, Improving performance of polyvinyl butyral
electrospinning. Proceedings of Nanocon, 2011: p. 21-23.
155. See Supplemental Material at http://www.glassflake.com/ for GF001 glass
flake (Date of reference: 2014/08/01).
156. Test Methods for Measuring Adhesion by Tape Test. 2009, ASTM
International.
157. See Supplemental information at http://www.elcometer.com/ for Elcometer 107
Cross Hatch Cutter (Date of reference: 2014/08/01).
158. Álvarez, P., et al., The electrochemical behaviour of sol-gel hybrid coatings
applied on AA2024-T3 alloy: Effect of the metallic surface treatment. Progress in
Organic Coatings, 2010. 69(2): p. 175-183.
159. Huang, J. and R.B. Kaner, The intrinsic nanofibrillar morphology of polyaniline.
Chem Commun (Camb), 2006(4): p. 367-76.
160. Zheludkevich, M.L., et al., On the application of electrochemical impedance
spectroscopy to study the self-healing properties of protective coatings.
Electrochemistry Communications, 2007. 9(10): p. 2622-2628.
161. Mostafa, M., Hybrid sol-gel/polyaniline coating for the corrosion protection of
AA2024. 2009, Sheffield Hallam University.
162. López, D.A., S.N. Simison, and S.R. de Sánchez, Inhibitors performance in
CO2 corrosion: EIS studies on the interaction between their molecular structure and
steel microstructure. Corrosion Science, 2005. 47(3): p. 735-755.
163. Franquet, A., H. Terryn, and J. Vereecken, Study of the effect of different
aluminium surface pretreatments on the deposition of thin non-functional silane
coatings. Surface and Interface Analysis, 2004. 36(8): p. 681-684.
164. Daoud, W.A., J.H. Xin, and X. Tao, Superhydrophobic Silica Nanocomposite
Coating by a Low‐Temperature Process. Journal of the American Ceramic Society,
2004. 87(9): p. 1782-1784.
165. Schmidt, H., S. Langenfeld, and R. Naß, A new corrosion protection coating
system for pressure-cast aluminium automotive parts. Materials & Design, 1997. 18(4-
6): p. 309-313.
166. Szczygieł, B. and M. Kołodziej, Composite Ni/Al2O3 coatings and their
corrosion resistance. Electrochimica Acta, 2005. 50(20): p. 4188-4195.
135
167. Rincon Troconis, B.C. and G.S. Frankel, Effect of Roughness and Surface
Topography on Adhesion of PVB to AA2024-T3 using the Blister Test. Surface and
Coatings Technology, 2013. 236(0): p. 531-539.
168. Sun, Y.-K. and I.-H. Oh, Synthesis of LiNiO 2 powders by a sol-gel method.
Journal of materials science letters, 1997. 16(1): p. 30-32.
169. Zhang, X., et al., Preparation and characterization of polyvinyl butyral/silica
hybrid antireflective coating: effect of PVB on moisture-resistance and hydrophobicity.
Journal of sol-gel science and technology, 2010. 53(1): p. 79-84.
170. Agrafiotis, C., et al., Evaluation of sol-gel methods for the synthesis of doped-
ceria environmental catalysis systems. Part I: preparation of coatings. Journal of the
European Ceramic Society, 2002. 22(1): p. 15-25.
171. Nelson, K., et al., Characterisation of aluminium alloys after HNO3/HF-NaOH-
HNO3/HF pretreatment. Materials science and technology, 2001. 17(10): p. 1211-1221.
172. Wu, H., et al., Biomimetic nanofiber patterns with controlled wettability. Soft
Matter, 2008. 4(12): p. 2429-2433.
173. Zhu, Y., et al., Chemical Dual‐Responsive Wettability of Superhydrophobic
PANI‐PAN Coaxial Nanofibers. Macromolecular rapid communications, 2007. 28(10):
p. 1135-1141.
174. Joshi, S., W.G. Fahrenholtz, and M.J. O’Keefe, Effect of alkaline cleaning and
activation on aluminum alloy 7075-T6. Applied Surface Science, 2011. 257(6): p. 1859-
1863.
175. Holub, K.J. and L.J. Matienzo, Magnesium diffusion in several aluminum
alloys. Applications of Surface Science, 1981. 9(1-4): p. 22-38.
176. Gospodinova, N. and L. Terlemezyan, Conducting polymers prepared by
oxidative polymerization: polyaniline. Progress in Polymer Science, 1998. 23(8): p.
1443-1484.
177. Wei, Y., et al., A study of the mechanism of aniline polymerization. Journal of
Polymer Science Part A: Polymer Chemistry, 1989. 27(7): p. 2385-2396.
178. Zhang, D. and Y. Wang, Synthesis and applications of one-dimensional nano-
structured polyaniline: An overview. Materials Science and Engineering: B, 2006.
134(1): p. 9-19.
179. Hoebbel, D., M. Nacken, and H. Schmidt, A NMR study on the hydrolysis,
condensation and epoxide ring-opening reaction in sols and gels of the system
136
glycidoxypropyltrimethoxysilane-water-titaniumtetraethoxide. Journal of sol-gel science
and technology, 1998. 12(3): p. 169-179.
180. Chan, C.-K., et al., Effects of heat treatment on the properties of poly (methyl
methacrylate)/silica hybrid materials prepared by sol-gel process. Polymer, 2001.
42(9): p. 4189-4196.
181. Poznyak, S., et al., Preparation and corrosion protective properties of
nanostructured titania-containing hybrid sol-gel coatings on AA2024. Progress in
Organic Coatings, 2008. 62(2): p. 226-235.
182. José Velasco, M.a., et al., DSC and FT-IR analysis of the drying process of
titanium alkoxide derived precipitates. Thermochimica Acta, 1999. 326(1-2): p. 91-97.
183. Li, G., et al., Fabrication and adhesive properties of thin organosilane films
coated on low carbon steel substrates. Surface and Coatings Technology, 2007.
201(24): p. 9571-9578.
184. Fedel, M., et al., Influence of formulation and application parameters on the
performances of a sol-gel/clay nanocomposite on the corrosion resistance of hot-dip
galvanized steel. Part II. Effect of curing temperature and time. Surface and Coatings
Technology, (0).
185. Song, J. and W. Van Ooij, Bonding and corrosion protection mechanisms of γ-
APS and BTSE silane films on aluminum substrates. Journal of adhesion science and
technology, 2003. 17(16): p. 2191-2221.
186. Bertoluzza, A., et al., Raman and infrared spectra on silica gel evolving toward
glass. Journal of Non-Crystalline Solids, 1982. 48(1): p. 117-128.
187. Fidalgo, A. and L.M. Ilharco, The defect structure of sol-gel-derived
silica/polytetrahydrofuran hybrid films by FTIR. Journal of Non-Crystalline Solids, 2001.
283(1-3): p. 144-154.
188. Tanner, P., B. Yan, and H. Zhang, Preparation and luminescence properties of
sol-gel hybrid materials incorporated with europium complexes. Journal of materials
science, 2000. 35(17): p. 4325-4328.
189. Liu, Z. and R.J. Davis, Investigation of the structure of microporous Ti-Si
mixed oxides by X-ray, UV reflectance, FT-Raman, and FT-IR spectroscopies. The
Journal of Physical Chemistry, 1994. 98(4): p. 1253-1261.
190. Jeon, H.-J., S.-C. Yi, and S.-G. Oh, Preparation and antibacterial effects of Ag-
SiO< sub> 2</sub> thin films by sol-gel method. Biomaterials, 2003. 24(27): p. 4921-
4928.

137
191. Grill, A. and D.A. Neumayer, Structure of low dielectric constant to extreme
low dielectric constant SiCOH films: Fourier transform infrared spectroscopy
characterization. Journal of Applied Physics, 2003. 94(10): p. 6697-6707.
192. Ardhyananta, H., et al., Effect of pendant group of polysiloxanes on the
thermal and mechanical properties of polybenzoxazine hybrids. Polymer, 2009. 50(25):
p. 5959-5969.
193. Sharma, R.K., S. Das, and A. Maitra, Surface modified ormosil nanoparticles.
Journal of Colloid and Interface Science, 2004. 277(2): p. 342-346.
194. Binder, A., A. Heel, and G. Kasper, Deposition of Palladium Nanodots of
Controlled Size and Density onto Surface‐Modified SiO2 Particles by an Atmospheric
Pressure CVS/MOCVD Process. Chemical Vapor Deposition, 2007. 13(1): p. 48-54.
195. Peri, J., Oxygen exchange between carbon dioxide (oxygen-18) and acidic
oxide and zeolite catalysts. The Journal of Physical Chemistry, 1975. 79(15): p. 1582-
1588.
196. Wei, Y., D. Yang, and L. Tang, Synthesis of new polyacrylonitrile‐silica hybrid
sol‐gel materials and their thermal properties. Die Makromolekulare Chemie, Rapid
Communications, 1993. 14(5): p. 273-278.
197. Jha, P., P.R. Arya, and A. Ganguli, Dielectric properties of lead zirconium
titanates with nanometer size grains synthesized by the citrate precursor route.
Materials chemistry and physics, 2003. 82(2): p. 355-361.
198. Suzuki, M., et al., Novel dumbbell-form low-molecular-weight gelators based
on L-lysine: their hydrogelation and organogelation properties. New journal of
chemistry, 2005. 29(11): p. 1439-1444.
199. Sayin, S., E. Akoz, and M. Yilmaz, Enhanced catalysis and enantioselective
resolution of racemic naproxen methyl ester by lipase encapsulated within iron oxide
nanoparticles coated with calix [8] arene valeric acid complexes. Organic &
biomolecular chemistry, 2014. 12(34): p. 6634-6642.
200. Cohn, D., et al., PEO-PPO-PEO-based poly (ether ester urethane) s as
degradable reverse thermo-responsive multiblock copolymers. Biomaterials, 2006.
27(9): p. 1718-1727.
201. Gnyba, M., et al., Raman investigation of sol-gel-derived hybrid polymers for
optoelectronics. Optoelectronics Review, 2002(2): p. 137-144.
202. GNYBA, M., M. KOZANECKI, and P. WIERZBA, Spectroscopic Studies of Sol-
Gel Derived Thin-Film Structures for Integrated Optics. Molecular and Quantum
Acoustics, 2005. 26: p. 81.

138
203. Itagaki, Y., et al., Development of porphyrin dispersed sol-gel films as HCl
sensitive optochemical gas sensor. Sensors and Actuators B: Chemical, 2006. 117(1):
p. 302-307.
204. Chen, Y.C., C.C. Tsai, and Y.D. Lee, Preparation and properties of silylated
PTFE/SiO2 organic-inorganic hybrids via sol-gel process. Journal of Polymer Science
Part A: Polymer Chemistry, 2004. 42(7): p. 1789-1807.
205. Mehner, A., et al., Mechanical and chemical properties of thick hybrid sol-gel
silica coatings from acid and base catalyzed sols. Journal of Sol-Gel Science and
Technology, 2010. 54(3): p. 355-362.
206. Carturan, G., et al., Hybrid gels as host matrices of perfumed essences.
Journal of Sol-Gel Science and Technology, 1997. 8(1-3): p. 1115-1119.
207. Yang, X., et al., Direct synthesis and characterization of bifunctional Me-Zr-
MCM-41. Materials Letters, 2009. 63(20): p. 1754-1756.
208. Ha, T.-J., et al., The improvement of mechanical and dielectric properties of
ordered mesoporous silica film using TEOS-MTES mixed silica precursor. Ceramics
International, 2008. 34(4): p. 947-951.
209. Yunsheng, Z., et al., Synthesis and heavy metal immobilization behaviors of
slag based geopolymer. Journal of hazardous materials, 2007. 143(1): p. 206-213.
210. Aguiar, H., et al., Structural study of sol-gel silicate glasses by IR and Raman
spectroscopies. Journal of Non-Crystalline Solids, 2009. 355(8): p. 475-480.
211. Çetin, N.S., et al., New transesterification reaction between acetylated wood
and tetramethoxysilane: A feasibility study. European Polymer Journal, 2005. 41(11): p.
2704-2710.
212. Koç, K., F.Z. Tepehan, and G.G. Tepehan, Characterization of MPS capped
CdS quantum dots and formation of self-assembled quantum dots thin films on a
glassy substrate. Chalcogenide Lett, 2011. 8: p. 239-247.
213. Trasferetti, B., C. Davanzo, and M. Bica de Moraes, Infrared and Raman
studies on films of organosiloxane networks produced by PECVD. Macromolecules,
2004. 37(2): p. 459-466.
214. Shu, Z., X. Jiao, and D. Chen, Synthesis and photocatalytic properties of
flower-like zirconia nanostructures. CrystEngComm, 2012. 14(3): p. 1122-1127.
215. Zhang, Y., et al., Mullite fibres prepared by sol-gel method using polyvinyl
butyral. Journal of the European Ceramic Society, 2009. 29(6): p. 1101-1107.
139
216. Erkov, V., et al., Si-TiO< sub> 2</sub> interface evolution at prolonged
annealing in low vacuum or N< sub> 2</sub> O ambient. Applied surface science,
2000. 166(1): p. 51-56.
217. Joseph, J. and E.D. Jemmis, Red-, blue-, or no-shift in hydrogen bonds: a
unified explanation. Journal of the American Chemical Society, 2007. 129(15): p. 4620-
4632.
218. Zheludkevich, M.L., et al., Triazole and thiazole derivatives as corrosion
inhibitors for AA2024 aluminium alloy. Corrosion Science, 2005. 47(12): p. 3368-3383.
219. Hsu, C. and F. Mansfeld, Technical note: concerning the conversion of the
constant phase element parameter Y0 into a capacitance. Corrosion, 2001. 57(9): p.
747-748.
220. Shi, H., F. Liu, and E. Han, Corrosion behaviour of sol-gel coatings doped with
cerium salts on 2024-T3 aluminum alloy. Materials Chemistry and Physics, 2010.
124(1): p. 291-297.
221. Conde, A., A. Durán, and J.J. de Damborenea, Polymeric sol-gel coatings as
protective layers of aluminium alloys. Progress in Organic Coatings, 2003. 46(4): p.
288-296.
222. Luo, C., Role of Microstructure on Corrosion Control of AA2024-T3 Aluminium
Alloy. 2011.
223. De Rosa, R., et al., Surface analysis of various methods of preparing Al 2024-
T3 surfaces for painting. Corrosion, 2000. 56(4): p. 395-400.
224. Hughes, A., et al., Study of deoxidation of 2024-T3 with various acids.
Materials science and technology, 2001. 17(12): p. 1642-1652.
225. Mittal, K.L., Adhesion aspects of polymeric coatings. 1983: Plenum press.