The Corrosion Inhibition of AA6082 Aluminium Alloy by ... - MDPI
15
coatings Article The Corrosion Inhibition of AA6082 Aluminium Alloy by Certain Azoles in Chloride Solution: Electrochemistry and Surface Analysis Klodian Xhanari 1,2 and Matjaž Finšgar 1, * 1 Faculty of Chemistry and Chemical Engineering, University of Maribor, Smetanova ulica 17, Maribor 2000, Slovenia; [email protected] 2 Faculty of Natural Sciences, University of Tirana, Boulevard “Zogu I”, Tirana 1001, Albania * Correspondence: matjaz.fi[email protected] Received: 15 May 2019; Accepted: 10 June 2019; Published: 13 June 2019 Abstract: The corrosion inhibition effect of five azole compounds on the corrosion of an AA6082 aluminium alloy in 5 wt.% NaCl solution at 25 and 50 ◦ C was investigated using weight loss and electrochemical measurements. Only 2-mercaptobenzothiazole (MBT) showed a corrosion inhibition effect at both temperatures and was further studied in detail, including with the addition of potassium iodide as a possible intensifier. Surface analysis of the MBT surface layer was performed by means of attenuated total reflectance Fourier transform infrared spectroscopy, X-ray photoelectron spectroscopy, and time-of-flight secondary ion mass spectrometry techniques. The hydrophobicity of the MBT surface layer was also investigated. Keywords: 2-mercaptobenzothiazole; aluminium alloy; AA6082; corrosion inhibitor; chloride solution; automotive industry 1. Introduction The AA6xxx series aluminium alloys (also known as Al–Mg–Si alloys) are heat-treatable wrought alloys, which, in addition to their high thermal and electrical conductivity and low specific weight, possess moderately high strength [1,2]. These properties, combined with their good formability and high resistance to general corrosion, make these alloys very suitable for industrial use, especially in the automotive and aerospace industries [3,4]. However, intergranular corrosion is one of the most reported forms of corrosion for AA6xxx series aluminium alloys [5–11]. The authors reported a close connection between the amount of Cu present in the alloys and their susceptibility to intergranular corrosion. The Cu content is also related to the pitting corrosion susceptibility of these alloys in chloride-containing solutions [3]. Due to the fact that the AA6082 aluminium alloy is used to fabricate hot extruded automotive parts [3,4], the corrosion resistance of this alloy in chloride-containing solutions has been reported in several studies. Cicolin et al. [12] reported that an increase in chloride concentration (from 0.01 to 1.00 M NaCl) made the AA6082 aluminium alloy more susceptible to pitting than to intergranular corrosion. The same behaviour was also observed when increasing the solution’s pH or the amount of dissolved oxygen. The effect of pH on the stress corrosion cracking of the AA6082 aluminium alloy in a 0.3 M NaCl solution was also studied by Panagopoulos et al. [13]. The authors reported higher corrosion susceptibility in basic and acid solutions, while a higher resistance was observed for neutral solutions. Trdan and Grum [14] used electrochemical measurements to study the influence of laser shock peening (LSP) treatment on the corrosion resistance of AA6082-T651 aluminium alloy immersed in a 0.6 M NaCl solution. The passivity region of the AA6082-T651 aluminium alloy samples increased after LSP treatment. Moreover, the LSP-treated samples showed a repassivation ability. Coatings 2019, 9, 380; doi:10.3390/coatings9060380 www.mdpi.com/journal/coatings
-
Upload
khangminh22 -
Category
Documents
-
view
3 -
download
0
Transcript of The Corrosion Inhibition of AA6082 Aluminium Alloy by ... - MDPI
coatings
Article
The Corrosion Inhibition of AA6082 AluminiumAlloy by Certain Azoles in Chloride Solution:Electrochemistry and Surface Analysis
Klodian Xhanari 1,2 and Matjaž Finšgar 1,*1 Faculty of Chemistry and Chemical Engineering, University of Maribor, Smetanova ulica 17, Maribor 2000,
Slovenia; [email protected] Faculty of Natural Sciences, University of Tirana, Boulevard “Zogu I”, Tirana 1001, Albania* Correspondence: [email protected]
Received: 15 May 2019; Accepted: 10 June 2019; Published: 13 June 2019
Abstract: The corrosion inhibition effect of five azole compounds on the corrosion of an AA6082aluminium alloy in 5 wt.% NaCl solution at 25 and 50 C was investigated using weight loss andelectrochemical measurements. Only 2-mercaptobenzothiazole (MBT) showed a corrosion inhibitioneffect at both temperatures and was further studied in detail, including with the addition of potassiumiodide as a possible intensifier. Surface analysis of the MBT surface layer was performed by means ofattenuated total reflectance Fourier transform infrared spectroscopy, X-ray photoelectron spectroscopy,and time-of-flight secondary ion mass spectrometry techniques. The hydrophobicity of the MBTsurface layer was also investigated.
Keywords: 2-mercaptobenzothiazole; aluminium alloy; AA6082; corrosion inhibitor; chloridesolution; automotive industry
1. Introduction
The AA6xxx series aluminium alloys (also known as Al–Mg–Si alloys) are heat-treatable wroughtalloys, which, in addition to their high thermal and electrical conductivity and low specific weight,possess moderately high strength [1,2]. These properties, combined with their good formability andhigh resistance to general corrosion, make these alloys very suitable for industrial use, especially in theautomotive and aerospace industries [3,4]. However, intergranular corrosion is one of the most reportedforms of corrosion for AA6xxx series aluminium alloys [5–11]. The authors reported a close connectionbetween the amount of Cu present in the alloys and their susceptibility to intergranular corrosion.The Cu content is also related to the pitting corrosion susceptibility of these alloys in chloride-containingsolutions [3]. Due to the fact that the AA6082 aluminium alloy is used to fabricate hot extrudedautomotive parts [3,4], the corrosion resistance of this alloy in chloride-containing solutions has beenreported in several studies. Cicolin et al. [12] reported that an increase in chloride concentration (from0.01 to 1.00 M NaCl) made the AA6082 aluminium alloy more susceptible to pitting than to intergranularcorrosion. The same behaviour was also observed when increasing the solution’s pH or the amount ofdissolved oxygen. The effect of pH on the stress corrosion cracking of the AA6082 aluminium alloyin a 0.3 M NaCl solution was also studied by Panagopoulos et al. [13]. The authors reported highercorrosion susceptibility in basic and acid solutions, while a higher resistance was observed for neutralsolutions. Trdan and Grum [14] used electrochemical measurements to study the influence of lasershock peening (LSP) treatment on the corrosion resistance of AA6082-T651 aluminium alloy immersedin a 0.6 M NaCl solution. The passivity region of the AA6082-T651 aluminium alloy samples increasedafter LSP treatment. Moreover, the LSP-treated samples showed a repassivation ability.
Coatings 2019, 9, 380; doi:10.3390/coatings9060380 www.mdpi.com/journal/coatings
Coatings 2019, 9, 380 2 of 15
Recently, we reported on the influence of chloride concentration (1 and 5 wt.% NaCl solution)and temperature (25 and 50 C) on the corrosion behaviour of the AA6082 aluminium alloy inchloride-containing solutions [15]. A corrosion rate increase was observed when increasing the chlorideconcentration and temperature. Both general and pitting corrosion were more pronounced at thehighest temperature (50 C). Moreover, the corrosion of the AA6082 aluminium alloy samples underthe above-mentioned conditions followed kinetic-controlled processes [15].
Surface modification by either laser shock peening without ablative coating [14] or polyvinylalcohol fibrous coating [16], as well as by the application of a titania coating [17], was employed tomitigate the corrosion of AA6082 aluminium alloys in chloride-containing solutions. In addition,sodium molybdate dehydrate was used by Panagopoulos et al. [18] as a corrosion inhibitor for theAA6082 aluminium alloy in a 0.01 M NaCl solution. Although a large number of organic compounds andnatural products have been employed as corrosion inhibitors for aluminium alloys in acid, basic, andchloride-containing solutions [19–21], the literature is scarce regarding the use of organic compoundsas corrosion inhibitors for the AA6082 aluminium alloy. Azole compounds, mainly derivatives ofimidazole and benzotriazole, have shown good corrosion inhibition effects in chloride-containingsolutions, mostly for copper [22–31] and, in a few cases, for steel [32–35]. Moreover, several azolecompounds have been used as corrosion inhibitors, mostly for pure aluminium and the AA2024aluminium alloy in chloride-containing solutions [36–40]. Hitherto, to the best of our knowledge,there have been no reports in the literature on the use of azole compounds as corrosion inhibitors forthe AA6082 aluminium alloy in chloride-containing solutions.
In this work, electrochemical impedance spectroscopy (EIS) measurements were firstused to evaluate the effectiveness of five azole compounds, i.e., 2-mercaptobenzothiazole(MBT), 2-mercaptobenzoxazole (MBO), 2-mercaptobenzimidazole (MBI), benzotriazole (BTA), and3-amino-1H-1,2,4-triazole (3-AT), as corrosion inhibitors for the AA6082 aluminium alloy during 10 hof immersion in 5 wt.% NaCl solution at 50 C, with and without the addition of KI as a possibleintensifier. The corrosion inhibition effectiveness of the above-mentioned compounds was tested at50 C, a common temperature employed in the automotive industry. According to the internationalstandard ISO 9227 [41], the neutral salt spray tests should be performed at 35 ± 2 C. However,the same standard states that the cooper-accelerated acetic salt spray tests should be performed at50 ± 2 C. In this work, the inhibition effect of the studied azole compounds in the corrosion of AA6082aluminium alloy samples in 5 wt.% NaCl solution was first studied at 50 C to simulate an even morecorrosive environment and test the worst-case scenario. Next, only the compounds found to showa corrosion inhibition effect at 50 C were tested at 25 C [41], with and without the addition of KI,using electrochemical techniques (including open circuit potential, potentiodynamic curve, and EISmeasurements) and the weight loss method. The adsorption of the effective azole compound wasconfirmed by attenuated total reflectance Fourier transform infrared spectroscopy (ATR-FTIR), X-rayphotoelectron spectroscopy (XPS), and time-of-flight secondary ion mass spectrometry (ToF-SIMS)measurements. Finally, contact angle measurements were performed on AA6082 aluminium alloysamples immersed in 5 wt.% NaCl solution at 25 C.
2. Materials and Methods
2.1. Sample Preparation
The AA6082 aluminium alloy with the composition given in Table 1 was supplied by RochollGmbH, Aglasterhausen, Germany. Rectangle-shaped samples (50 by 20 by 1 mm) were used forthe weight loss measurements, while disc-shaped samples (diameter 15 mm) were used for theelectrochemical and surface characterization measurements [15,22,28,33].
Coatings 2019, 9, 380 3 of 15
Table 1. Chemical composition of AA6082 aluminium alloy as specified by the supplier.
Element Si Fe Cu Mn Mg Cr Zn Ti Al
Content (wt.%) 0.90 0.35 0.07 0.45 0.90 0.04 0.05 0.02 balance
Prior to performing weight loss tests, the samples were first cleaned ultrasonically in a 50 vol.%acetone/50 vol.% ultrapure water bath and then dried under a stream of air. The samples used forthe electrochemical measurements were first ground with different SiC papers (320, 500, 800, 1000,2400, and 4000 grit), supplied by Struers (Ballerup, Denmark), and then rinsed with ultrapure water(resistivity of 18.2 MΩ cm at 25 C) obtained by means of the Milli-Q system (Millipore Corporation,Burlington, MA, USA). Finally, the samples were ultrasonically cleaned in a 50 vol.% acetone/50 vol.%ultrapure water bath and then dried under a stream of air.
2.2. Solution Preparation
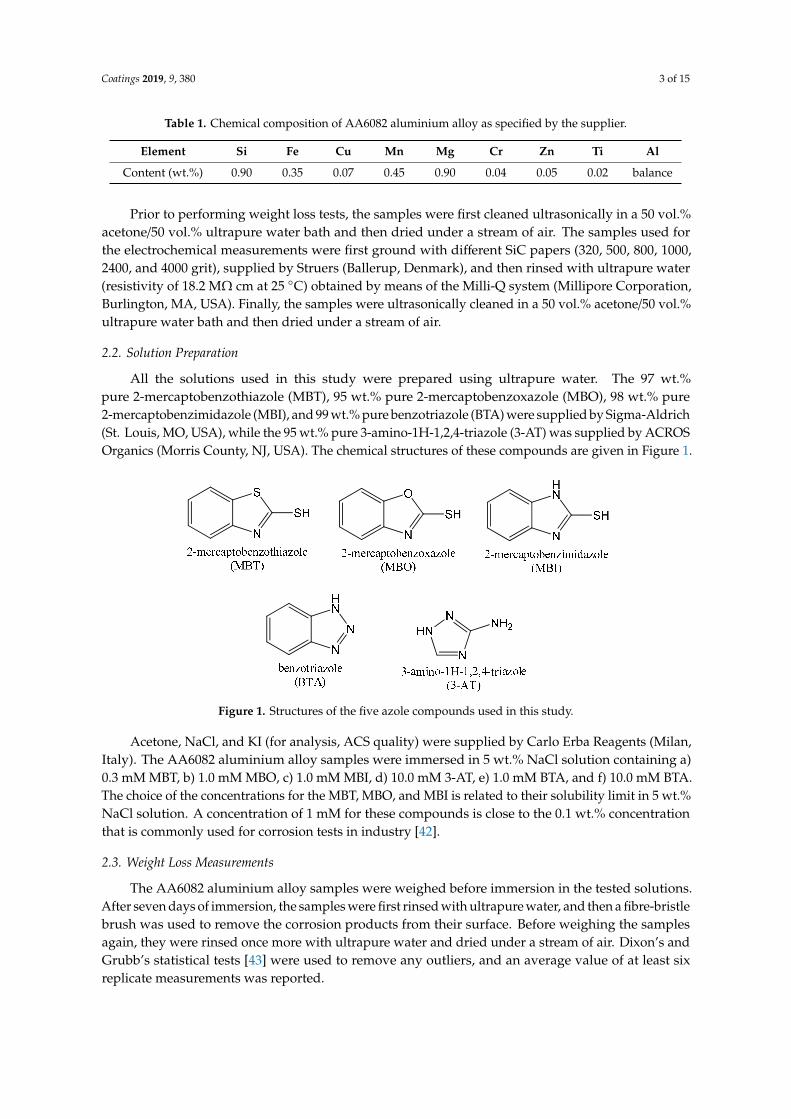
All the solutions used in this study were prepared using ultrapure water. The 97 wt.%pure 2-mercaptobenzothiazole (MBT), 95 wt.% pure 2-mercaptobenzoxazole (MBO), 98 wt.% pure2-mercaptobenzimidazole (MBI), and 99 wt.% pure benzotriazole (BTA) were supplied by Sigma-Aldrich(St. Louis, MO, USA), while the 95 wt.% pure 3-amino-1H-1,2,4-triazole (3-AT) was supplied by ACROSOrganics (Morris County, NJ, USA). The chemical structures of these compounds are given in Figure 1.
Coatings 2019, 9, x FOR PEER REVIEW 3 of 15
Table 1. Chemical composition of AA6082 aluminium alloy as specified by the supplier.
Element Si Fe Cu Mn Mg Cr Zn Ti Al Content (wt.%) 0.90 0.35 0.07 0.45 0.90 0.04 0.05 0.02 balance
Prior to performing weight loss tests, the samples were first cleaned ultrasonically in a 50 vol.% acetone/50 vol.% ultrapure water bath and then dried under a stream of air. The samples used for the electrochemical measurements were first ground with different SiC papers (320, 500, 800, 1000, 2400, and 4000 grit), supplied by Struers (Ballerup, Denmark), and then rinsed with ultrapure water (resistivity of 18.2 MΩ cm at 25 °C) obtained by means of the Milli-Q system (Millipore Corporation, Burlington, MA, USA). Finally, the samples were ultrasonically cleaned in a 50 vol.% acetone/50 vol.% ultrapure water bath and then dried under a stream of air.
2.2. Solution Preparation
All the solutions used in this study were prepared using ultrapure water. The 97 wt.% pure 2-mercaptobenzothiazole (MBT), 95 wt.% pure 2-mercaptobenzoxazole (MBO), 98 wt.% pure 2-mercaptobenzimidazole (MBI), and 99 wt.% pure benzotriazole (BTA) were supplied by Sigma-Aldrich (St. Louis, MO, USA), while the 95 wt.% pure 3-amino-1H-1,2,4-triazole (3-AT) was supplied by ACROS Organics (Morris County, NJ, USA). The chemical structures of these compounds are given in Figure 1.
Figure 1. Structures of the five azole compounds used in this study.
Acetone, NaCl, and KI (for analysis, ACS quality) were supplied by Carlo Erba Reagents (Milan, Italy). The AA6082 aluminium alloy samples were immersed in 5 wt.% NaCl solution containing a) 0.3 mM MBT, b) 1.0 mM MBO, c) 1.0 mM MBI, d) 10.0 mM 3-AT, e) 1.0 mM BTA, and f) 10.0 mM BTA. The choice of the concentrations for the MBT, MBO, and MBI is related to their solubility limit in 5 wt.% NaCl solution. A concentration of 1 mM for these compounds is close to the 0.1 wt.% concentration that is commonly used for corrosion tests in industry [42].
2.3. Weight Loss Measurements
The AA6082 aluminium alloy samples were weighed before immersion in the tested solutions. After seven days of immersion, the samples were first rinsed with ultrapure water, and then a fibre-bristle brush was used to remove the corrosion products from their surface. Before weighing the samples again, they were rinsed once more with ultrapure water and dried under a stream of air. Dixon’s and Grubb’s statistical tests [43] were used to remove any outliers, and an average value of at least six replicate measurements was reported.
Figure 1. Structures of the five azole compounds used in this study.
Acetone, NaCl, and KI (for analysis, ACS quality) were supplied by Carlo Erba Reagents (Milan,Italy). The AA6082 aluminium alloy samples were immersed in 5 wt.% NaCl solution containing a)0.3 mM MBT, b) 1.0 mM MBO, c) 1.0 mM MBI, d) 10.0 mM 3-AT, e) 1.0 mM BTA, and f) 10.0 mM BTA.The choice of the concentrations for the MBT, MBO, and MBI is related to their solubility limit in 5 wt.%NaCl solution. A concentration of 1 mM for these compounds is close to the 0.1 wt.% concentrationthat is commonly used for corrosion tests in industry [42].
2.3. Weight Loss Measurements
The AA6082 aluminium alloy samples were weighed before immersion in the tested solutions.After seven days of immersion, the samples were first rinsed with ultrapure water, and then a fibre-bristlebrush was used to remove the corrosion products from their surface. Before weighing the samplesagain, they were rinsed once more with ultrapure water and dried under a stream of air. Dixon’s andGrubb’s statistical tests [43] were used to remove any outliers, and an average value of at least sixreplicate measurements was reported.
Coatings 2019, 9, 380 4 of 15
2.4. Electrochemical Measurements
The AA6082 aluminium alloy samples immersed in 5 wt.% NaCl solution with each of theazole compounds were subjected to electrochemical measurements under stagnant conditions at 25and 50 C. The working electrode consisted of the AA6082 aluminium alloy sample (prepared asdescribed above) embedded in a Teflon holder (PAR, Cambridge, UK) with a 1 cm2 area exposed to thesolution [15,22,28,33]. A saturated calomel electrode, SCE (0.244 V vs. SHE, the standard hydrogenelectrode), and a graphite rod were used as the reference and the counter electrode, respectively.A Gamry 600TM potentiostat/galvanostat controlled by a Gamry Framework electrochemical program(Gamry Instruments, Warminster, PA, USA) was used to perform all the electrochemical measurements.The results obtained were analysed using the Gamry EChem Analyst 6.30 software.
The EIS spectra were recorded at the open circuit potential (Eoc), in the frequency range from 1 MHzto 10 mHz, using a signal with a 10 mV (peak to peak) amplitude and 10 points/decade [15,22,28,33].The EIS measurements were performed in sequence after 1, 3, 5, 7, and 10 h of immersion in 5 wt.%NaCl solution with and without different azole compounds. The Eoc was determined from the timeof immersion in sequence before each of the EIS measurements and just before the potentiodynamiccurve measurements. The potentiodynamic curves were recorded after 11 h of immersion, startingfrom −0.250 V vs. Eoc and continuing in the anodic direction with a potential scan rate of 0.1 mV s−1.At least three replicate measurements were performed for all the electrochemical techniques anda representative curve is given in each case.
2.5. Surface Analysis
The samples prepared with the same procedure as the electrochemical measurements weresubjected to surface analysis after immersion in 5 wt.% NaCl solution with and without the presenceof the azole compounds. The ATR-FTIR, XPS, ToF-SIMS, and contact angle measurements were usedto characterize the surface of the AA6082 aluminium alloy samples after immersion. The ATR-FTIRand contact angle measurements were performed after 31 days of immersion, while for the XPS (PHI5600, Physical Electronics, Inc., Chanhassen, MN, USA) and ToF-SIMS (ToF-SIMS 5, ION-TOF, Münster,Germany) measurements, a 1 h immersion time was used. A Shimadzu IRAffinity-1 (Kyoto, Japan)spectrometer was used for the ATR-FTIR measurements. The instrumental setup for the XPS andToF-SIMS measurements were the same as reported previously [44]. The hydrophobicity of the AA6082aluminium alloy samples after immersion in 5 wt.% NaCl solutions containing the most effective azolecompound (higher corrosion inhibition effectiveness) with and without the addition of 0.1 wt.% KI wastested using an OCA 35 Dataphysic contact angle analyser (Filderstadt, Germany), with the respectivesoftware (SCA 20). The average value of at least three replicate contact angle measurements obtained atdifferent spots of the sample’s surface was reported (outliers were checked with Dixon’s and Grubb’sstatistical tests, and any present outliers were removed from the calculation of the average value [43]).
3. Results and Discussion
3.1. Electrochemical Measurements
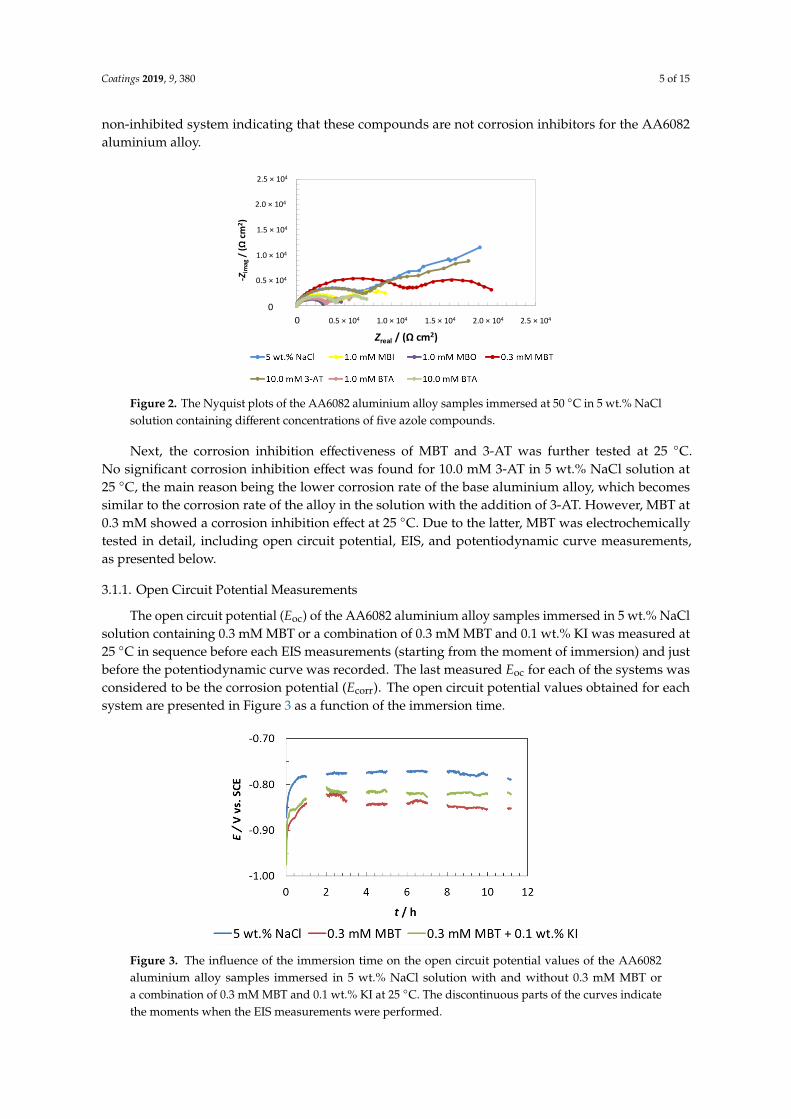
The AA6082 aluminium alloy samples immersed in 5 wt.% NaCl solution containing the MBI,MBO, MBT, 3-AT, and BTA azole compounds, as described above, were first tested by means of EISmeasurements at 50 C to simulate the worst-case corrosion scenario and to select the best candidatesfor lower temperature studies. The Nyquist plots of the AA6082 aluminium alloy samples immersedin 5 wt.% NaCl solution with different amounts of the studied azole compounds (Figure 2) obtained at50 C indicated that only MBT and 3-AT showed a corrosion inhibition effect. However, the parametersobtained from the EIS fitting procedure showed that the addition of MBT and 3-AT resulted in onlya slight increase in the corrosion resistivity of the AA6082 aluminium alloy samples (the corrosioninhibition effectiveness calculated based on fitted Rp values as described below was found to be lowerthan 25%). For all the other azole compounds lower Rp values were obtained compared with the
Coatings 2019, 9, 380 5 of 15
non-inhibited system indicating that these compounds are not corrosion inhibitors for the AA6082aluminium alloy.
Coatings 2019, 9, x FOR PEER REVIEW 5 of 15
described below was found to be lower than 25%). For all the other azole compounds lower Rp
values were obtained compared with the non-inhibited system indicating that these compounds are
not corrosion inhibitors for the AA6082 aluminium alloy.
Figure 2. The Nyquist plots of the AA6082 aluminium alloy samples immersed at 50 °C in 5 wt.%
NaCl solution containing different concentrations of five azole compounds.
Next, the corrosion inhibition effectiveness of MBT and 3-AT was further tested at 25 °C. No
significant corrosion inhibition effect was found for 10.0 mM 3-AT in 5 wt.% NaCl solution at 25 °C,
the main reason being the lower corrosion rate of the base aluminium alloy, which becomes similar
to the corrosion rate of the alloy in the solution with the addition of 3-AT. However, MBT at 0.3 mM
showed a corrosion inhibition effect at 25 °C. Due to the latter, MBT was electrochemically tested in
detail, including open circuit potential, EIS, and potentiodynamic curve measurements, as
presented below.
3.1.1. Open Circuit Potential Measurements
The open circuit potential (Eoc) of the AA6082 aluminium alloy samples immersed in 5 wt.%
NaCl solution containing 0.3 mM MBT or a combination of 0.3 mM MBT and 0.1 wt.% KI was
measured at 25 °C in sequence before each EIS measurements (starting from the moment of
immersion) and just before the potentiodynamic curve was recorded. The last measured Eoc for each
of the systems was considered to be the corrosion potential (Ecorr). The open circuit potential values
obtained for each system are presented in Figure 3 as a function of the immersion time.
Figure 3. The influence of the immersion time on the open circuit potential values of the AA6082
aluminium alloy samples immersed in 5 wt.% NaCl solution with and without 0.3 mM MBT or a
combination of 0.3 mM MBT and 0.1 wt.% KI at 25 °C. The discontinuous parts of the curves
indicate the moments when the EIS measurements were performed.
0.0E+00
5.0E+03
1.0E+04
1.5E+04
2.0E+04
2.5E+04
0.0E+00 5.0E+03 1.0E+04 1.5E+04 2.0E+04 2.5E+04
-Zim
ag/
(Ωcm
2)
Zreal / (Ω cm2)
0
1.0 × 10⁴
1.5 × 10⁴
2.0 × 10⁴
0 0.5 × 10⁴ 1.0 × 10⁴ 1.5 × 10⁴ 2.0 × 10⁴ 2.5 × 10⁴
0.5 × 10⁴
2.5 × 10⁴
Figure 2. The Nyquist plots of the AA6082 aluminium alloy samples immersed at 50 C in 5 wt.% NaClsolution containing different concentrations of five azole compounds.
Next, the corrosion inhibition effectiveness of MBT and 3-AT was further tested at 25 C.No significant corrosion inhibition effect was found for 10.0 mM 3-AT in 5 wt.% NaCl solution at25 C, the main reason being the lower corrosion rate of the base aluminium alloy, which becomessimilar to the corrosion rate of the alloy in the solution with the addition of 3-AT. However, MBT at0.3 mM showed a corrosion inhibition effect at 25 C. Due to the latter, MBT was electrochemicallytested in detail, including open circuit potential, EIS, and potentiodynamic curve measurements,as presented below.
3.1.1. Open Circuit Potential Measurements
The open circuit potential (Eoc) of the AA6082 aluminium alloy samples immersed in 5 wt.% NaClsolution containing 0.3 mM MBT or a combination of 0.3 mM MBT and 0.1 wt.% KI was measured at25 C in sequence before each EIS measurements (starting from the moment of immersion) and justbefore the potentiodynamic curve was recorded. The last measured Eoc for each of the systems wasconsidered to be the corrosion potential (Ecorr). The open circuit potential values obtained for eachsystem are presented in Figure 3 as a function of the immersion time.
Coatings 2019, 9, x FOR PEER REVIEW 5 of 15
described below was found to be lower than 25%). For all the other azole compounds lower Rp values were obtained compared with the non-inhibited system indicating that these compounds are not corrosion inhibitors for the AA6082 aluminium alloy.
Figure 2. The Nyquist plots of the AA6082 aluminium alloy samples immersed at 50 °C in 5 wt.% NaCl solution containing different concentrations of five azole compounds.
Next, the corrosion inhibition effectiveness of MBT and 3-AT was further tested at 25 °C. No significant corrosion inhibition effect was found for 10.0 mM 3-AT in 5 wt.% NaCl solution at 25 °C, the main reason being the lower corrosion rate of the base aluminium alloy, which becomes similar to the corrosion rate of the alloy in the solution with the addition of 3-AT. However, MBT at 0.3 mM showed a corrosion inhibition effect at 25 °C. Due to the latter, MBT was electrochemically tested in detail, including open circuit potential, EIS, and potentiodynamic curve measurements, as presented below.
3.1.1. Open Circuit Potential Measurements
The open circuit potential (Eoc) of the AA6082 aluminium alloy samples immersed in 5 wt.% NaCl solution containing 0.3 mM MBT or a combination of 0.3 mM MBT and 0.1 wt.% KI was measured at 25 °C in sequence before each EIS measurements (starting from the moment of immersion) and just before the potentiodynamic curve was recorded. The last measured Eoc for each of the systems was considered to be the corrosion potential (Ecorr). The open circuit potential values obtained for each system are presented in Figure 3 as a function of the immersion time.
Figure 3. The influence of the immersion time on the open circuit potential values of the AA6082 aluminium alloy samples immersed in 5 wt.% NaCl solution with and without 0.3 mM MBT or a combination of 0.3 mM MBT and 0.1 wt.% KI at 25 °C. The discontinuous parts of the curves indicate the moments when the EIS measurements were performed.
Figure 3. The influence of the immersion time on the open circuit potential values of the AA6082aluminium alloy samples immersed in 5 wt.% NaCl solution with and without 0.3 mM MBT ora combination of 0.3 mM MBT and 0.1 wt.% KI at 25 C. The discontinuous parts of the curves indicatethe moments when the EIS measurements were performed.

Coatings 2019, 9, 380 6 of 15
Figure 3 shows that for the non-inhibited AA6082 aluminium alloy samples immersed in 5 wt.%NaCl solution the Eoc moved to more positive potentials from the moment of immersion until the firsthour, and then no significant changes were observed (a steady state was achieved). For this system,Ecorr was found to be −0.789 V. The addition of 0.3 mM MBT to 5 wt.% NaCl solution resulted in a shiftof the Eoc to slightly more negative potentials compared with the non-inhibited system. The Eoc wasfirst transferred to more positive potentials in the first hour of immersion and then slightly shiftedto more negative potentials from the first to the third hour of immersion. For the inhibited system,a steady state was reached after 3 h of immersion. The Ecorr for this system was found to be −0.852 V.
The steady state for the AA6082 aluminium alloy samples immersed in 5 wt.% NaCl solutioncontaining 0.3 mM MBT with the addition of 0.1 wt.% KI was also achieved after 1 h of immersion.No significant shift was observed when comparing the open circuit potential curves for the inhibitedsystem with and without the addition of 0.1 wt.% KI. This is reflected also in the Ecorr value, which was−0.821 V for the inhibited system containing 0.1 wt.% KI.
The shift to more negative potentials when 0.3 mM MBT or a combination of 0.3 mM MBT and0.1 wt.% KI were added to 5 wt.% NaCl solution indicates that MBT primarily inhibits the cathodicreaction of the corrosion couple, i.e., the reduction of the dissolved oxygen in the solution and thehydrogen evolution (which is most likely not intensive since for the 5 wt.% NaCl solution containing0.3 mM MBT the pH was 5.07, while no significant change of the pH (pH = 5.11) was measured when0.1 wt.% KI was added to the solution).
3.1.2. EIS Measurements
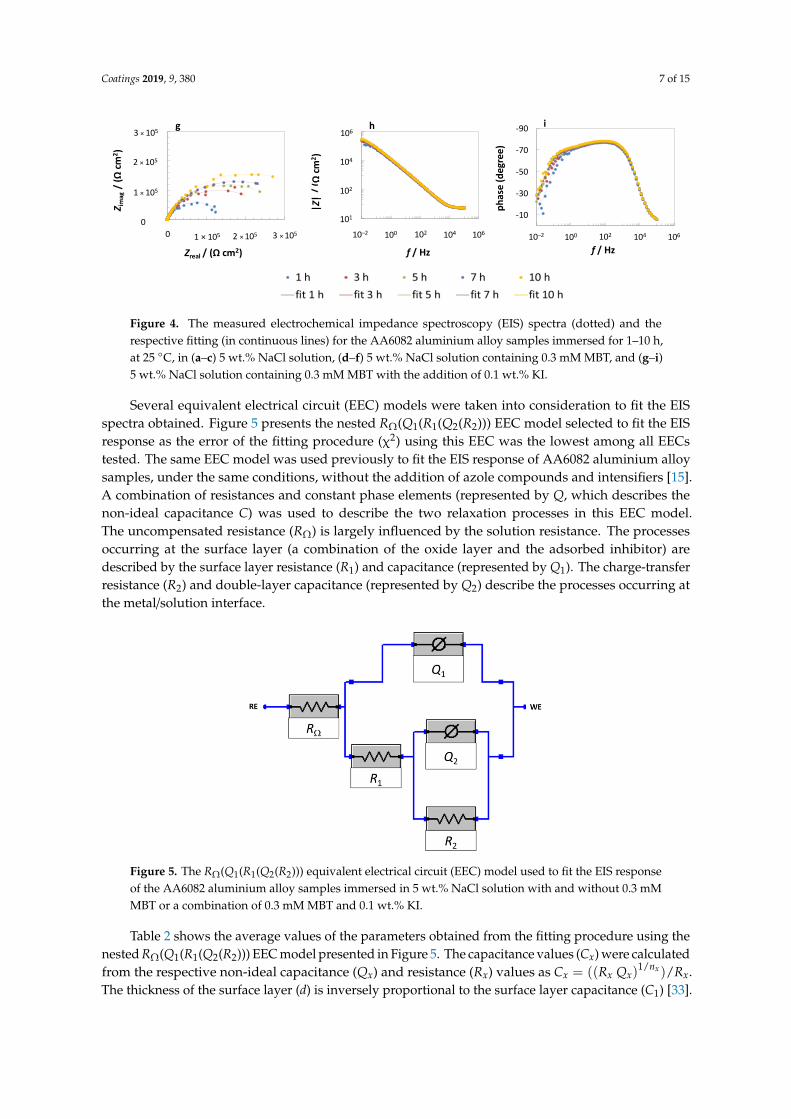
Figure 4 presents the EIS response of the AA6082 aluminium alloy samples after 1–10 h ofimmersion at 25 C in 5 wt.% NaCl solution (Figure 4a–c), in 5 wt.% NaCl solution containing 0.3 mMMBT (Figure 4d–f), and in 5 wt.% NaCl solution containing 0.3 mM MBT with the addition of 0.1 wt.%KI (Figure 4g–i). The two distinctive patterns observed in the Bode modulus plot (Figure 4b,e) in thehigh and middle frequency regions and the respective behaviour of the systems associated with thosepatterns have previously been described in detail [15,22,28,33].
Coatings 2019, 9, x FOR PEER REVIEW 6 of 15
Figure 3 shows that for the non-inhibited AA6082 aluminium alloy samples immersed in 5 wt.%
NaCl solution the Eoc moved to more positive potentials from the moment of immersion until the
first hour, and then no significant changes were observed (a steady state was achieved). For this
system, Ecorr was found to be −0.789 V. The addition of 0.3 mM MBT to 5 wt.% NaCl solution
resulted in a shift of the Eoc to slightly more negative potentials compared with the non-inhibited
system. The Eoc was first transferred to more positive potentials in the first hour of immersion and
then slightly shifted to more negative potentials from the first to the third hour of immersion. For
the inhibited system, a steady state was reached after 3 h of immersion. The Ecorr for this system was
found to be −0.852 V.
The steady state for the AA6082 aluminium alloy samples immersed in 5 wt.% NaCl solution
containing 0.3 mM MBT with the addition of 0.1 wt.% KI was also achieved after 1 h of immersion.
No significant shift was observed when comparing the open circuit potential curves for the
inhibited system with and without the addition of 0.1 wt.% KI. This is reflected also in the Ecorr
value, which was –0.821 V for the inhibited system containing 0.1 wt.% KI.
The shift to more negative potentials when 0.3 mM MBT or a combination of 0.3 mM MBT and
0.1 wt.% KI were added to 5 wt.% NaCl solution indicates that MBT primarily inhibits the cathodic
reaction of the corrosion couple, i.e., the reduction of the dissolved oxygen in the solution and the
hydrogen evolution (which is most likely not intensive since for the 5 wt.% NaCl solution
containing 0.3 mM MBT the pH was 5.07, while no significant change of the pH (pH = 5.11) was
measured when 0.1 wt.% KI was added to the solution).
3.1.2. EIS Measurements
Figure 4 presents the EIS response of the AA6082 aluminium alloy samples after 1–10 h of
immersion at 25 °C in 5 wt.% NaCl solution (Figure 4a–c), in 5 wt.% NaCl solution containing 0.3 mM
MBT (Figure 4d–f), and in 5 wt.% NaCl solution containing 0.3 mM MBT with the addition of 0.1 wt.%
KI (Figure 4g–i). The two distinctive patterns observed in the Bode modulus plot (Figure 4b,e) in
the high and middle frequency regions and the respective behaviour of the systems associated with
those patterns have previously been described in detail [15,22,28,33].
0.0E+00
1.0E+05
2.0E+05
3.0E+05
0.0E+00 1.0E+05 2.0E+05 3.0E+05
Z im
ag/
(Ωcm
2)
Zreal / (Ω cm2)
0
1 × 10⁵
2 × 10⁵
3 × 10⁵
1.0E+00
1.0E+02
1.0E+04
1.0E+06
1.0E-021.0E+001.0E+021.0E+041.0E+06
|Z|
/ (Ω
cm2)
f / Hz
-90
-70
-50
-30
-10
1.0E-02 1.0E+00 1.0E+02 1.0E+04 1.0E+06
ph
ase
(deg
ree)
f / Hz
d e f
0.0E+00
1.0E+05
2.0E+05
3.0E+05
0.0E+00 1.0E+05 2.0E+05 3.0E+05
Z im
ag/
(Ωcm
2)
Zreal / (Ω cm2)
0
0 1 × 10⁵ 2 ×10⁵ 3 ×10⁵
1.0E+00
1.0E+02
1.0E+04
1.0E+06
1.0E-021.0E+001.0E+021.0E+041.0E+06
|Z|
/ (Ω
cm2)
f / Hz
|Z|
/ (Ω
cm2)
-90
-70
-50
-30
-10
1.0E-02 1.0E+00 1.0E+02 1.0E+04 1.0E+06
ph
ase
(d
egre
e)
f / Hz
g h i
101
106
102
104
101
106
102
104
10–2 100 102 104 106
10–2 100 102 104 106 10–2 100 102 104 106
10–2 100 102 104 106
0.0E+00
2.0E+04
4.0E+04
6.0E+04
0.0E+00 2.0E+04 4.0E+04 6.0E+04
Z im
ag/
(Ωcm
2)
Zreal / (Ω cm2)
0 2 × 10⁴ 4 × 10⁴ 6 × 10⁴
0
4 × 10⁴
6 × 10⁴
2 × 10⁴
1.0E+00
1.0E+02
1.0E+04
1.0E+06
1.0E-021.0E+001.0E+021.0E+041.0E+06
|Z|
/ (Ω
cm2)
f / Hz
-90
-70
-50
-30
-10
1.0E-02 1.0E+00 1.0E+02 1.0E+04 1.0E+06
ph
ase
(deg
ree)
f / Hz
a b c
101
106
102
104
10–2 100 102 104 106 10–2 100 102 104 106
3 × 1050 1 × 10⁵ 2 × 10⁵
0
1 × 10⁵
2 × 10⁵
3 × 10⁵ Figure 4. Cont.
Coatings 2019, 9, 380 7 of 15Coatings 2019, 9, x FOR PEER REVIEW 7 of 15
Figure 4. The measured electrochemical impedance spectroscopy (EIS) spectra (dotted) and the
respective fitting (in continuous lines) for the AA6082 aluminium alloy samples immersed for 1–10 h, at
25 °C, in (a–c) 5 wt.% NaCl solution, (d–f) 5 wt.% NaCl solution containing 0.3 mM MBT, and (g–i)
5 wt.% NaCl solution containing 0.3 mM MBT with the addition of 0.1 wt.% KI.
Several equivalent electrical circuit (EEC) models were taken into consideration to fit the EIS
spectra obtained. Figure 5 presents the nested RΩ(Q1(R1(Q2(R2))) EEC model selected to fit the EIS
response as the error of the fitting procedure (χ2) using this EEC was the lowest among all EECs
tested. The same EEC model was used previously to fit the EIS response of AA6082 aluminium
alloy samples, under the same conditions, without the addition of azole compounds and intensifiers
[15]. A combination of resistances and constant phase elements (represented by Q, which describes
the non-ideal capacitance C) was used to describe the two relaxation processes in this EEC model.
The uncompensated resistance (RΩ) is largely influenced by the solution resistance. The processes
occurring at the surface layer (a combination of the oxide layer and the adsorbed inhibitor) are
described by the surface layer resistance (R1) and capacitance (represented by Q1). The
charge-transfer resistance (R2) and double-layer capacitance (represented by Q2) describe the
processes occurring at the metal/solution interface.
Figure 5. The RΩ(Q1(R1(Q2(R2))) equivalent electrical circuit (EEC) model used to fit the EIS response
of the AA6082 aluminium alloy samples immersed in 5 wt.% NaCl solution with and without 0.3 mM
MBT or a combination of 0.3 mM MBT and 0.1 wt.% KI.
Table 2 shows the average values of the parameters obtained from the fitting procedure using
the nested RΩ(Q1(R1(Q2(R2))) EEC model presented in Figure 5. The capacitance values (Cx) were
calculated from the respective non-ideal capacitance (Qx) and resistance (Rx) values as 𝐶𝑥 =
((𝑅𝑥 𝑄𝑥 )1/𝑛𝑥)/𝑅𝑥 . The thickness of the surface layer (d) is inversely proportional to the surface layer
capacitance (C1) [33].
The C1 values of the AA6082 aluminium alloy samples immersed in 5 wt.% NaCl solution
decreased with an increase in immersion time for both systems, i.e., with and without the addition
0.0E+00
1.0E+05
2.0E+05
3.0E+05
0.0E+00 1.0E+05 2.0E+05 3.0E+05
Z im
ag/
(Ωcm
2)
Zreal / (Ω cm2)
0
1 × 10⁵
2 × 10⁵
3 × 10⁵
1.0E+00
1.0E+02
1.0E+04
1.0E+06
1.0E-021.0E+001.0E+021.0E+041.0E+06
|Z|
/ (Ω
cm2)
f / Hz
-90
-70
-50
-30
-10
1.0E-02 1.0E+00 1.0E+02 1.0E+04 1.0E+06
ph
ase
(deg
ree)
f / Hz
d e f
0.0E+00
1.0E+05
2.0E+05
3.0E+05
0.0E+00 1.0E+05 2.0E+05 3.0E+05
Z im
ag/
(Ωcm
2)
Zreal / (Ω cm2)
0
0 1 × 10⁵ 2 ×10⁵ 3 ×10⁵
1.0E+00
1.0E+02
1.0E+04
1.0E+06
1.0E-021.0E+001.0E+021.0E+041.0E+06
|Z|
/ (Ω
cm2)
f / Hz
|Z|
/ (Ω
cm2)
-90
-70
-50
-30
-10
1.0E-02 1.0E+00 1.0E+02 1.0E+04 1.0E+06
ph
ase
(d
egre
e)
f / Hz
g h i
101
106
102
104
101
106
102
104
10–2 100 102 104 106
10–2 100 102 104 106 10–2 100 102 104 106
10–2 100 102 104 106
0.0E+00
2.0E+04
4.0E+04
6.0E+04
0.0E+00 2.0E+04 4.0E+04 6.0E+04
Z im
ag/
(Ωcm
2)
Zreal / (Ω cm2)
0 2 × 10⁴ 4 × 10⁴ 6 × 10⁴
0
4 × 10⁴
6 × 10⁴
2 × 10⁴
1.0E+00
1.0E+02
1.0E+04
1.0E+06
1.0E-021.0E+001.0E+021.0E+041.0E+06
|Z|
/ (Ω
cm2)
f / Hz
-90
-70
-50
-30
-10
1.0E-02 1.0E+00 1.0E+02 1.0E+04 1.0E+06
ph
ase
(deg
ree)
f / Hz
a b c
101
106
102
104
10–2 100 102 104 106 10–2 100 102 104 106
3 × 1050 1 × 10⁵ 2 × 10⁵
0
1 × 10⁵
2 × 10⁵
3 × 10⁵
Figure 4. The measured electrochemical impedance spectroscopy (EIS) spectra (dotted) and therespective fitting (in continuous lines) for the AA6082 aluminium alloy samples immersed for 1–10 h,at 25 C, in (a–c) 5 wt.% NaCl solution, (d–f) 5 wt.% NaCl solution containing 0.3 mM MBT, and (g–i)5 wt.% NaCl solution containing 0.3 mM MBT with the addition of 0.1 wt.% KI.
Several equivalent electrical circuit (EEC) models were taken into consideration to fit the EISspectra obtained. Figure 5 presents the nested RΩ(Q1(R1(Q2(R2))) EEC model selected to fit the EISresponse as the error of the fitting procedure (χ2) using this EEC was the lowest among all EECstested. The same EEC model was used previously to fit the EIS response of AA6082 aluminium alloysamples, under the same conditions, without the addition of azole compounds and intensifiers [15].A combination of resistances and constant phase elements (represented by Q, which describes thenon-ideal capacitance C) was used to describe the two relaxation processes in this EEC model.The uncompensated resistance (RΩ) is largely influenced by the solution resistance. The processesoccurring at the surface layer (a combination of the oxide layer and the adsorbed inhibitor) aredescribed by the surface layer resistance (R1) and capacitance (represented by Q1). The charge-transferresistance (R2) and double-layer capacitance (represented by Q2) describe the processes occurring atthe metal/solution interface.
Coatings 2019, 9, x FOR PEER REVIEW 7 of 15
Figure 4. The measured electrochemical impedance spectroscopy (EIS) spectra (dotted) and the respective fitting (in continuous lines) for the AA6082 aluminium alloy samples immersed for 1–10 h, at 25 °C, in (a–c) 5 wt.% NaCl solution, (d–f) 5 wt.% NaCl solution containing 0.3 mM MBT, and (g–i) 5 wt.% NaCl solution containing 0.3 mM MBT with the addition of 0.1 wt.% KI.
Several equivalent electrical circuit (EEC) models were taken into consideration to fit the EIS spectra obtained. Figure 5 presents the nested RΩ(Q1(R1(Q2(R2))) EEC model selected to fit the EIS response as the error of the fitting procedure (χ2) using this EEC was the lowest among all EECs tested. The same EEC model was used previously to fit the EIS response of AA6082 aluminium alloy samples, under the same conditions, without the addition of azole compounds and intensifiers [15]. A combination of resistances and constant phase elements (represented by Q, which describes the non-ideal capacitance C) was used to describe the two relaxation processes in this EEC model. The uncompensated resistance (RΩ) is largely influenced by the solution resistance. The processes occurring at the surface layer (a combination of the oxide layer and the adsorbed inhibitor) are described by the surface layer resistance (R1) and capacitance (represented by Q1). The charge-transfer resistance (R2) and double-layer capacitance (represented by Q2) describe the processes occurring at the metal/solution interface.
Figure 5. The RΩ(Q1(R1(Q2(R2))) equivalent electrical circuit (EEC) model used to fit the EIS response of the AA6082 aluminium alloy samples immersed in 5 wt.% NaCl solution with and without 0.3 mM MBT or a combination of 0.3 mM MBT and 0.1 wt.% KI.
Table 2 shows the average values of the parameters obtained from the fitting procedure using the nested RΩ(Q1(R1(Q2(R2))) EEC model presented in Figure 5. The capacitance values (Cx) were calculated from the respective non-ideal capacitance (Qx) and resistance (Rx) values as 𝐶 𝑅 𝑄 / /𝑅 . The thickness of the surface layer (d) is inversely proportional to the surface layer capacitance (C1) [33].
The C1 values of the AA6082 aluminium alloy samples immersed in 5 wt.% NaCl solution decreased with an increase in immersion time for both systems, i.e., with and without the addition
Figure 5. The RΩ(Q1(R1(Q2(R2))) equivalent electrical circuit (EEC) model used to fit the EIS responseof the AA6082 aluminium alloy samples immersed in 5 wt.% NaCl solution with and without 0.3 mMMBT or a combination of 0.3 mM MBT and 0.1 wt.% KI.
Table 2 shows the average values of the parameters obtained from the fitting procedure using thenested RΩ(Q1(R1(Q2(R2))) EEC model presented in Figure 5. The capacitance values (Cx) were calculatedfrom the respective non-ideal capacitance (Qx) and resistance (Rx) values as Cx = ((Rx Qx)
1/nx)/Rx.The thickness of the surface layer (d) is inversely proportional to the surface layer capacitance (C1) [33].

Coatings 2019, 9, 380 8 of 15
The C1 values of the AA6082 aluminium alloy samples immersed in 5 wt.% NaCl solutiondecreased with an increase in immersion time for both systems, i.e., with and without the additionof 0.1 wt.% KI (Table 2). This resulted in an increase in the surface layer thickness with increasingimmersion time, as more of the inhibitor is adsorbed on the surface of the AA6082 aluminiumalloy samples.
Table 2. The parameters obtained from fitting the EIS response of the AA6082 aluminium alloy samplesimmersed in 5 wt.% NaCl solution containing 0.3 mM MBT or a combination of 0.3 mM MBT and0.1 wt.% KI, after 1–10 h of immersion, at 25 C. In addition, the fitted parameters from the EIS spectraof the AA6082 aluminium samples in 5 wt.% NaCl solution, previously reported in [15], are givenfor comparison. Units: χ2 [×10−3], RΩ [Ω cm2], R1, R2, and Rp [kΩ cm2], Q1 and Q2 [µΩ−1 cm−2 sn],and C1 and C2 [µF cm−2].
Immersion Time [h] χ2 RΩ Q1 n1 R1 C1 Q2 n2 R2 C2 Rp
5 wt.% NaCl solution
1 0.84 5.90 217.00 0.69 39.70 581.50 17.2 0.86 43.30 16.46 56.163 0.98 5.84 276.00 0.85 48.00 440.16 16.8 0.86 52.30 16.45 100.305 0.61 5.69 396.00 0.99 46.40 401.84 16.5 0.86 50.80 15.96 97.207 0.22 5.65 340.00 0.84 58.70 593.76 15.3 0.86 48.10 14.56 106.80
10 0.24 5.60 325.00 0.83 73.00 607.62 14.7 0.86 45.00 13.77 118.00
5 wt.% NaCl solution containing 0.3 mM MBT
1 1.26 5.74 16.18 0.87 28.59 14.49 5.66 0.84 138.03 5.41 166.623 1.10 5.72 14.79 0.88 22.29 12.68 5.47 0.75 233.97 5.95 256.265 1.02 5.68 14.35 0.88 23.52 12.39 5.24 0.76 297.87 6.03 321.397 0.91 5.67 13.95 0.88 21.79 11.92 5.21 0.75 344.60 6.33 366.39
10 0.86 5.58 13.49 0.89 17.25 11.20 5.31 0.76 348.75 6.45 366.00
5 wt.% NaCl solution containing 0.3 mM MBT with the addition of 0.1 wt.% KI
1 2.52 5.47 14.89 0.88 21.26 12.70 6.24 0.84 113.00 5.83 134.263 1.68 5.56 12.71 0.89 10.52 9.87 6.07 0.69 251.30 7.34 261.825 1.30 5.59 12.28 0.89 14.11 9.91 5.86 0.72 299.30 7.33 313.417 1.15 5.59 11.90 0.90 12.26 9.50 5.91 0.70 338.50 8.01 350.76
10 1.28 5.60 11.58 0.90 12.84 9.32 5.85 0.70 407.40 8.52 420.24
5 wt.% NaCl solution containing 0.3 mM MBT with the addition of 1.0 wt.% KI
1 2.93 5.05 17.9 0.87 14.86 14.80 5.50 0.87 81.80 4.86 96.663 2.45 5.03 15.6 0.88 7.65 11.79 6.23 0.76 177.20 6.43 184.855 2.50 5.02 14.5 0.89 5.94 10.65 6.48 0.74 257.20 7.74 263.147 2.49 5.03 14.0 0.89 5.84 10.33 6.74 0.74 305.20 8.72 311.04
10 2.48 5.04 13.3 0.90 5.35 9.80 6.89 0.73 363.50 9.69 368.85
The polarization resistance (Rp) values, calculated as the sum of all resistances (Table 2), excludingRΩ, are presented in Figure 6 as a function of the immersion time. The Rp values obtained for theAA6082 aluminium alloy samples immersed in a 5 wt.% NaCl solution, containing 0.3 mM MBT,with and without the addition of 0.1 wt.% KI, at 25 C, are compared with the Rp values of thesame samples, under the same conditions, immersed only in 5 wt.% NaCl solution, as reportedpreviously [15]. A higher Rp value indicates the lower susceptibility of the AA6082 aluminium alloysample to general corrosion. Figure 6 shows that at all immersion times a more resistive system isobtained with the addition of 0.3 mM MBT compared with the system containing no corrosion inhibitor.For the system containing 0.3 mM MBT, a continuous increase in Rp values is observed for up to 7 h ofimmersion, and then after 10 h of immersion the resistivity of the system does not significantly change(Figure 6). The same trend in the change of Rp values with increasing immersion time was found for thesystem containing 0.3 mM MBT with the addition of 0.1 wt.% KI for up to 7 h of immersion. However,the resistivity of this system increased from 7 to 10 h of immersion. For this system, the highest Rp
value was obtained after 10 h of immersion. Table 2 and Figure 6 show that the addition of 0.1 wt.%KI to the inhibited system has no significant influence on the Rp values obtained from fitting the EISresponse from the first to the seventh hour of immersion, while only a slight increase of the the Rp

Coatings 2019, 9, 380 9 of 15
value is observed after 10 h of immersion. The increase of the KI concentration from 0.1 to 1.0 wt.% didnot further improve the corrosion resistance of the AA6082 aluminium samples immersed in 5 wt.%NaCl solution containing 0.3 mM MBT. Figure 6 shows that lower Rp values compared to both theinhibited systems with and without 0.1 wt.% KI addition were obtained from the first to the seventhhour of immersion.
Coatings 2019, 9, x FOR PEER REVIEW 9 of 15
resistance of the AA6082 aluminium samples immersed in 5 wt.% NaCl solution containing 0.3 mM
MBT. Figure 6 shows that lower Rp values compared to both the inhibited systems with and
without 0.1 wt.% KI addition were obtained from the first to the seventh hour of immersion.
Figure 6. The variation of Rp values with increasing immersion time for the AA6082 aluminium
alloy samples immersed for 1–10 h at 25 °C in 5 wt.% NaCl solution with or without 0.3 mM MBT or
0.3 mM MBT and the addition of either 0.1 or 1.0 wt.% KI.
The corrosion inhibition effectiveness of the inhibited systems, with or without the addition of
0.1 and 1.0 wt.% KI, after 10 h of immersion at 25 °C were calculated from the Rp values presented in
Table 2. The corrosion inhibition effectiveness for the system containing 0.3 mM MBT was 67.76%,
while the addition of 0.1 wt.% KI to the 0.3 mM MBT slightly increased the corrosion inhibition
effectiveness to 71.92%. The non-significant difference in the Rp values of the inhibited samples with
and without 1.0 wt.% KI addition is also reflected in the corrosion inhibition effectiveness value. The
corrosion inhibition effectiveness of the samples immersed in 5 wt.% NaCl solution containing 0.3 mM
MBT with 1.0 wt.% KI addition was 68.01%.
3.1.3. Potentiodynamic Curve Measurements
The potentiodynamic curves of the AA6082 aluminium alloy samples after 11 h of immersion
in 5 wt.% NaCl solution with or without 0.3 mM MBT or 0.3 mM MBT and the addition of 0.1 wt.%
KI are presented in Figure 7. The same as found in the open circuit potential measurements for Ecorr,
the Eoc of the AA6082 aluminium alloy samples shifted to more negative potentials upon the
addition of 0.3 mM MBT or 0.3 mM MBT and 0.1 wt.% KI. The latter explains that 0.3 mM MBT and
a combination of 0.3 mM MBT and 0.1 wt.% KI primarily inhibit the cathodic reaction of the
corrosion couple, acting as a cathodic-type corrosion inhibitor (the same was concluded above by
means of open circuit potential measurements). Figure 7 shows that for the inhibited samples (both
with and without the addition of KI), the corrosion current density shifted to lower values
compared with the non-inhibited sample. For the non-inhibited samples, the breakdown potential,
Ebd (the potential at which a sudden increase in the current density is observed), is not clearly
expressed, whereas for both additions, the Ebd is expressed. Moreover, based on the increased
Ebd−Eoc potential difference upon the addition of either 0.3 mM MBT or a combination of 0.3 mM
MBT and 0.1 wt.% KI, the localized corrosion of the AA6082 aluminium alloy samples was
mitigated compared with the non-inhibited sample [45].
0.0E+00
1.0E+05
2.0E+05
3.0E+05
4.0E+05
5.0E+05
0 2 4 6 8 10 12
Rp
/ (Ω
cm2)
Immersion time / h
1 × 10⁵
2 × 10⁵
3 × 10⁵
4 × 10⁵
5 × 10⁵
0
Figure 6. The variation of Rp values with increasing immersion time for the AA6082 aluminium alloysamples immersed for 1–10 h at 25 C in 5 wt.% NaCl solution with or without 0.3 mM MBT or 0.3 mMMBT and the addition of either 0.1 or 1.0 wt.% KI.
The corrosion inhibition effectiveness of the inhibited systems, with or without the addition of0.1 and 1.0 wt.% KI, after 10 h of immersion at 25 C were calculated from the Rp values presented inTable 2. The corrosion inhibition effectiveness for the system containing 0.3 mM MBT was 67.76%,while the addition of 0.1 wt.% KI to the 0.3 mM MBT slightly increased the corrosion inhibitioneffectiveness to 71.92%. The non-significant difference in the Rp values of the inhibited samples withand without 1.0 wt.% KI addition is also reflected in the corrosion inhibition effectiveness value. Thecorrosion inhibition effectiveness of the samples immersed in 5 wt.% NaCl solution containing 0.3 mMMBT with 1.0 wt.% KI addition was 68.01%.
3.1.3. Potentiodynamic Curve Measurements
The potentiodynamic curves of the AA6082 aluminium alloy samples after 11 h of immersion in5 wt.% NaCl solution with or without 0.3 mM MBT or 0.3 mM MBT and the addition of 0.1 wt.% KI arepresented in Figure 7. The same as found in the open circuit potential measurements for Ecorr, the Eoc ofthe AA6082 aluminium alloy samples shifted to more negative potentials upon the addition of 0.3 mMMBT or 0.3 mM MBT and 0.1 wt.% KI. The latter explains that 0.3 mM MBT and a combination of0.3 mM MBT and 0.1 wt.% KI primarily inhibit the cathodic reaction of the corrosion couple, acting asa cathodic-type corrosion inhibitor (the same was concluded above by means of open circuit potentialmeasurements). Figure 7 shows that for the inhibited samples (both with and without the addition ofKI), the corrosion current density shifted to lower values compared with the non-inhibited sample.For the non-inhibited samples, the breakdown potential, Ebd (the potential at which a sudden increasein the current density is observed), is not clearly expressed, whereas for both additions, the Ebd isexpressed. Moreover, based on the increased Ebd−Eoc potential difference upon the addition of either0.3 mM MBT or a combination of 0.3 mM MBT and 0.1 wt.% KI, the localized corrosion of the AA6082aluminium alloy samples was mitigated compared with the non-inhibited sample [45].

Coatings 2019, 9, 380 10 of 15Coatings 2019, 9, x FOR PEER REVIEW 10 of 15
Figure 7. Potentiodynamic curves for the AA6082 aluminium alloy samples after 11 h of immersion at 25 °C in 5 wt.% NaCl solution containing 0.3 mM MBT or a combination of 0.3 mM MBT and 0.1 wt.% KI.
3.2. Weight Loss Measurements
The AA6082 aluminium alloy samples were immersed for 7 days at 25 °C in 5 wt.% NaCl solution containing 0.3 mM MBT, with and without the addition of KI as an intensifier. After the immersion time and cleaning procedure as described above, the AA6082 aluminium alloy samples showed a higher mass than before immersion, due to the inability to remove the corrosion products from the surface of the AA6082 aluminium alloy samples, even though corrosion products were visible on the surface. A cleaning procedure in acids was not performed as this could also remove the base aluminium alloy, resulting in misleading results. Similar strongly attached corrosion products were also found when the samples were immersed for 30 days and 180 days at 25 °C or 7 days at 50 °C. Therefore, for the present corrosion inhibition research weight loss measurements are not appropriate for evaluating the corrosion effectiveness of the tested corrosion inhibitors.
3.3. Surface Analysis
The AA6082 aluminium alloy samples prepared as described in Section 2.1 were subjected to surface characterization, including ATR-FTIR, XPS, ToF-SIMS, and contact angle measurements.
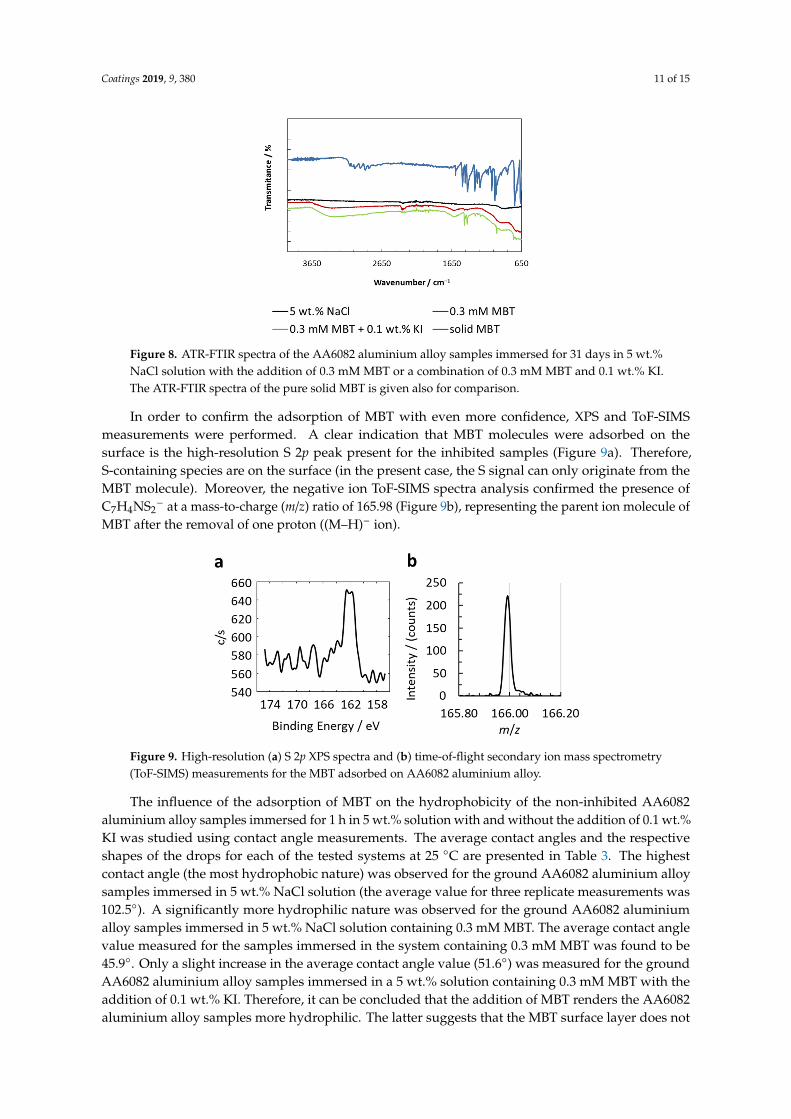
ATR-FTIR spectra are presented in Figure 8. In the spectra for the non-inhibited and the inhibited (with and without the addition of KI) samples, two peaks were observed at 2360 and 2336 cm−1, which are connected with the asymmetric stretching of CO2 [46]. Several other peaks were found in the inhibited samples. It was previously reported [47] that the peak at 1463 cm–1 is attributed to the C–N stretching vibrations. Rai et al. [48] attributed the peak at 1428 cm–1 to the vibrations of the C–N–H group in MBT. The peak observed at 1318 cm–1 has been previously attributed to the aromatic C–H in-plane bending modes [49,50]. Li et al. [51] reported that the peak at 1242 cm–1 is attributable to C–C stretching vibrations, while the peak at 1011 cm–1 is attributable to the bending C–C–C vibrations. Meanwhile, Rai et al. [48] attributed the peak at 1015 cm–1 not only to the C–C–C bending vibrations, but also to the C–S stretching vibrations. In addition, the ATR-FTIR spectra of the pure solid MBT chemical (powder) is also presented in Figure 8 for comparison. All the peaks presented above for the inhibited samples are also found in the spectra of the pure solid MBT. Because no characteristic peaks related to the adsorption of organic compounds were observed for the non-inhibited AA6082 aluminium alloy sample, and because of the peaks found on the inhibited samples, it can be concluded that MBT was adsorbed on the aluminium alloy samples. Moreover, the addition of 0.1 wt.% KI increased the amount of the adsorbed MBT on the surface as more signal was obtained for the latter compared to the system containing only MBT.
Figure 7. Potentiodynamic curves for the AA6082 aluminium alloy samples after 11 h of immersionat 25 C in 5 wt.% NaCl solution containing 0.3 mM MBT or a combination of 0.3 mM MBT and0.1 wt.% KI.
3.2. Weight Loss Measurements
The AA6082 aluminium alloy samples were immersed for 7 days at 25 C in 5 wt.% NaCl solutioncontaining 0.3 mM MBT, with and without the addition of KI as an intensifier. After the immersion timeand cleaning procedure as described above, the AA6082 aluminium alloy samples showed a highermass than before immersion, due to the inability to remove the corrosion products from the surface ofthe AA6082 aluminium alloy samples, even though corrosion products were visible on the surface.A cleaning procedure in acids was not performed as this could also remove the base aluminium alloy,resulting in misleading results. Similar strongly attached corrosion products were also found whenthe samples were immersed for 30 days and 180 days at 25 C or 7 days at 50 C. Therefore, for thepresent corrosion inhibition research weight loss measurements are not appropriate for evaluating thecorrosion effectiveness of the tested corrosion inhibitors.
3.3. Surface Analysis
The AA6082 aluminium alloy samples prepared as described in Section 2.1 were subjected tosurface characterization, including ATR-FTIR, XPS, ToF-SIMS, and contact angle measurements.
ATR-FTIR spectra are presented in Figure 8. In the spectra for the non-inhibited and the inhibited(with and without the addition of KI) samples, two peaks were observed at 2360 and 2336 cm−1,which are connected with the asymmetric stretching of CO2 [46]. Several other peaks were found in theinhibited samples. It was previously reported [47] that the peak at 1463 cm−1 is attributed to the C–Nstretching vibrations. Rai et al. [48] attributed the peak at 1428 cm−1 to the vibrations of the C–N–Hgroup in MBT. The peak observed at 1318 cm−1 has been previously attributed to the aromatic C–Hin-plane bending modes [49,50]. Li et al. [51] reported that the peak at 1242 cm−1 is attributable to C–Cstretching vibrations, while the peak at 1011 cm−1 is attributable to the bending C–C–C vibrations.Meanwhile, Rai et al. [48] attributed the peak at 1015 cm−1 not only to the C–C–C bending vibrations,but also to the C–S stretching vibrations. In addition, the ATR-FTIR spectra of the pure solid MBTchemical (powder) is also presented in Figure 8 for comparison. All the peaks presented above forthe inhibited samples are also found in the spectra of the pure solid MBT. Because no characteristicpeaks related to the adsorption of organic compounds were observed for the non-inhibited AA6082aluminium alloy sample, and because of the peaks found on the inhibited samples, it can be concludedthat MBT was adsorbed on the aluminium alloy samples. Moreover, the addition of 0.1 wt.% KIincreased the amount of the adsorbed MBT on the surface as more signal was obtained for the lattercompared to the system containing only MBT.
Coatings 2019, 9, 380 11 of 15Coatings 2019, 9, x FOR PEER REVIEW 11 of 15
Figure 8. ATR-FTIR spectra of the AA6082 aluminium alloy samples immersed for 31 days in 5 wt.% NaCl solution with the addition of 0.3 mM MBT or a combination of 0.3 mM MBT and 0.1 wt.% KI. The ATR-FTIR spectra of the pure solid MBT is given also for comparison.
In order to confirm the adsorption of MBT with even more confidence, XPS and ToF-SIMS measurements were performed. A clear indication that MBT molecules were adsorbed on the surface is the high-resolution S 2p peak present for the inhibited samples (Figure 9a). Therefore, S-containing species are on the surface (in the present case, the S signal can only originate from the MBT molecule). Moreover, the negative ion ToF-SIMS spectra analysis confirmed the presence of C7H4NS2¯ at a mass-to-charge (m/z) ratio of 165.98 (Figure 9b), representing the parent ion molecule of MBT after the removal of one proton ((M–H)− ion).
Figure 9. High-resolution (a) S 2p XPS spectra and (b) time-of-flight secondary ion mass spectrometry (ToF-SIMS) measurements for the MBT adsorbed on AA6082 aluminium alloy.
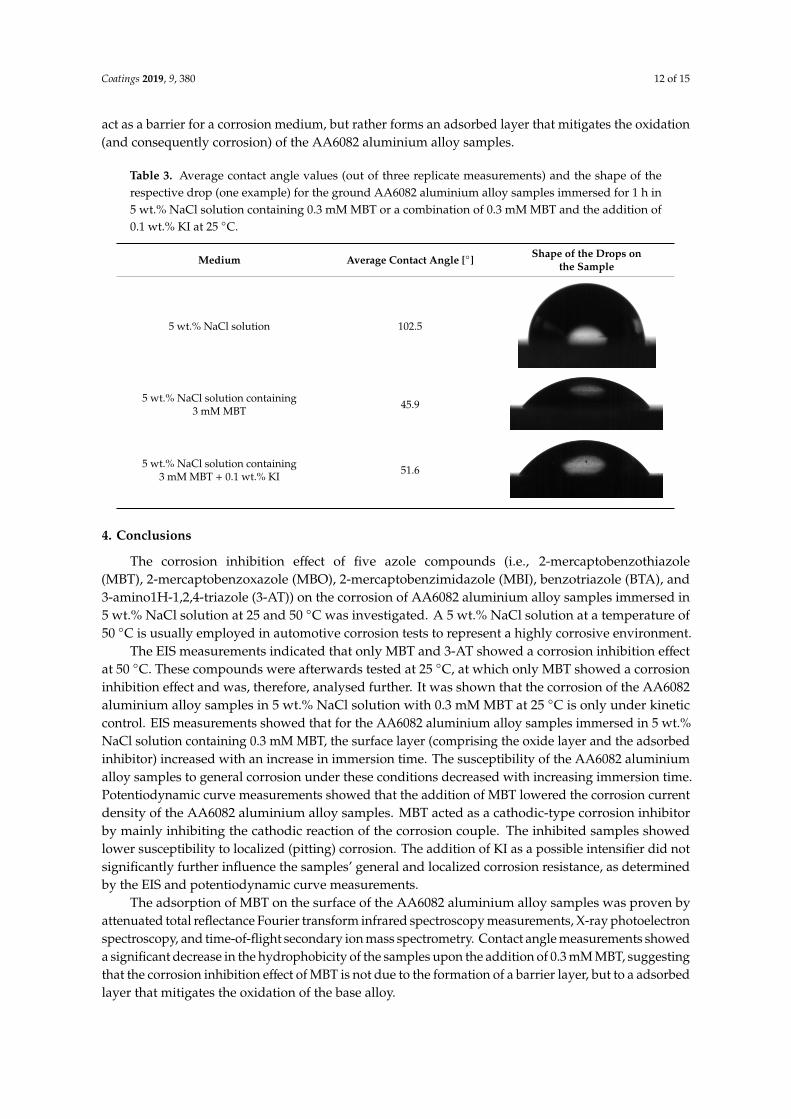
The influence of the adsorption of MBT on the hydrophobicity of the non-inhibited AA6082 aluminium alloy samples immersed for 1 h in 5 wt.% solution with and without the addition of 0.1 wt.% KI was studied using contact angle measurements. The average contact angles and the respective shapes of the drops for each of the tested systems at 25 °C are presented in Table 3. The highest contact angle (the most hydrophobic nature) was observed for the ground AA6082 aluminium alloy samples immersed in 5 wt.% NaCl solution (the average value for three replicate measurements was 102.5°). A significantly more hydrophilic nature was observed for the ground AA6082 aluminium alloy samples immersed in 5 wt.% NaCl solution containing 0.3 mM MBT. The average contact angle value measured for the samples immersed in the system containing 0.3 mM MBT was found to be 45.9°. Only a slight increase in the average contact angle value (51.6°) was measured for the ground AA6082 aluminium alloy samples immersed in a 5 wt.% solution containing 0.3 mM MBT with the addition of 0.1 wt.% KI. Therefore, it can be concluded that the addition of MBT renders the AA6082 aluminium alloy samples more hydrophilic. The latter suggests that the MBT
Figure 8. ATR-FTIR spectra of the AA6082 aluminium alloy samples immersed for 31 days in 5 wt.%NaCl solution with the addition of 0.3 mM MBT or a combination of 0.3 mM MBT and 0.1 wt.% KI.The ATR-FTIR spectra of the pure solid MBT is given also for comparison.
In order to confirm the adsorption of MBT with even more confidence, XPS and ToF-SIMSmeasurements were performed. A clear indication that MBT molecules were adsorbed on thesurface is the high-resolution S 2p peak present for the inhibited samples (Figure 9a). Therefore,S-containing species are on the surface (in the present case, the S signal can only originate from theMBT molecule). Moreover, the negative ion ToF-SIMS spectra analysis confirmed the presence ofC7H4NS2
− at a mass-to-charge (m/z) ratio of 165.98 (Figure 9b), representing the parent ion molecule ofMBT after the removal of one proton ((M–H)− ion).
Coatings 2019, 9, x FOR PEER REVIEW 11 of 15
Figure 8. ATR-FTIR spectra of the AA6082 aluminium alloy samples immersed for 31 days in 5 wt.% NaCl solution with the addition of 0.3 mM MBT or a combination of 0.3 mM MBT and 0.1 wt.% KI. The ATR-FTIR spectra of the pure solid MBT is given also for comparison.
In order to confirm the adsorption of MBT with even more confidence, XPS and ToF-SIMS measurements were performed. A clear indication that MBT molecules were adsorbed on the surface is the high-resolution S 2p peak present for the inhibited samples (Figure 9a). Therefore, S-containing species are on the surface (in the present case, the S signal can only originate from the MBT molecule). Moreover, the negative ion ToF-SIMS spectra analysis confirmed the presence of C7H4NS2¯ at a mass-to-charge (m/z) ratio of 165.98 (Figure 9b), representing the parent ion molecule of MBT after the removal of one proton ((M–H)− ion).
Figure 9. High-resolution (a) S 2p XPS spectra and (b) time-of-flight secondary ion mass spectrometry (ToF-SIMS) measurements for the MBT adsorbed on AA6082 aluminium alloy.
The influence of the adsorption of MBT on the hydrophobicity of the non-inhibited AA6082 aluminium alloy samples immersed for 1 h in 5 wt.% solution with and without the addition of 0.1 wt.% KI was studied using contact angle measurements. The average contact angles and the respective shapes of the drops for each of the tested systems at 25 °C are presented in Table 3. The highest contact angle (the most hydrophobic nature) was observed for the ground AA6082 aluminium alloy samples immersed in 5 wt.% NaCl solution (the average value for three replicate measurements was 102.5°). A significantly more hydrophilic nature was observed for the ground AA6082 aluminium alloy samples immersed in 5 wt.% NaCl solution containing 0.3 mM MBT. The average contact angle value measured for the samples immersed in the system containing 0.3 mM MBT was found to be 45.9°. Only a slight increase in the average contact angle value (51.6°) was measured for the ground AA6082 aluminium alloy samples immersed in a 5 wt.% solution containing 0.3 mM MBT with the addition of 0.1 wt.% KI. Therefore, it can be concluded that the addition of MBT renders the AA6082 aluminium alloy samples more hydrophilic. The latter suggests that the MBT
Figure 9. High-resolution (a) S 2p XPS spectra and (b) time-of-flight secondary ion mass spectrometry(ToF-SIMS) measurements for the MBT adsorbed on AA6082 aluminium alloy.
The influence of the adsorption of MBT on the hydrophobicity of the non-inhibited AA6082aluminium alloy samples immersed for 1 h in 5 wt.% solution with and without the addition of 0.1 wt.%KI was studied using contact angle measurements. The average contact angles and the respectiveshapes of the drops for each of the tested systems at 25 C are presented in Table 3. The highestcontact angle (the most hydrophobic nature) was observed for the ground AA6082 aluminium alloysamples immersed in 5 wt.% NaCl solution (the average value for three replicate measurements was102.5). A significantly more hydrophilic nature was observed for the ground AA6082 aluminiumalloy samples immersed in 5 wt.% NaCl solution containing 0.3 mM MBT. The average contact anglevalue measured for the samples immersed in the system containing 0.3 mM MBT was found to be45.9. Only a slight increase in the average contact angle value (51.6) was measured for the groundAA6082 aluminium alloy samples immersed in a 5 wt.% solution containing 0.3 mM MBT with theaddition of 0.1 wt.% KI. Therefore, it can be concluded that the addition of MBT renders the AA6082aluminium alloy samples more hydrophilic. The latter suggests that the MBT surface layer does not
Coatings 2019, 9, 380 12 of 15
act as a barrier for a corrosion medium, but rather forms an adsorbed layer that mitigates the oxidation(and consequently corrosion) of the AA6082 aluminium alloy samples.
Table 3. Average contact angle values (out of three replicate measurements) and the shape of therespective drop (one example) for the ground AA6082 aluminium alloy samples immersed for 1 h in5 wt.% NaCl solution containing 0.3 mM MBT or a combination of 0.3 mM MBT and the addition of0.1 wt.% KI at 25 C.
Medium Average Contact Angle [] Shape of the Drops onthe Sample
5 wt.% NaCl solution 102.5
Coatings 2019, 9, x FOR PEER REVIEW 12 of 15
surface layer does not act as a barrier for a corrosion medium, but rather forms an adsorbed layer that mitigates the oxidation (and consequently corrosion) of the AA6082 aluminium alloy samples.
Table 3. Average contact angle values (out of three replicate measurements) and the shape of the respective drop (one example) for the ground AA6082 aluminium alloy samples immersed for 1 h in 5 wt.% NaCl solution containing 0.3 mM MBT or a combination of 0.3 mM MBT and the addition of 0.1 wt.% KI at 25 °C.
Medium Average Contact Angle [°] Shape of the Drops on the Sample
5 wt.% NaCl solution 102.5
5 wt.% NaCl solution containing 3 mM MBT
45.9
5 wt.% NaCl solution containing 3 mM MBT + 0.1 wt.% KI
51.6
4. Conclusions
The corrosion inhibition effect of five azole compounds (i.e., 2-mercaptobenzothiazole (MBT), 2-mercaptobenzoxazole (MBO), 2-mercaptobenzimidazole (MBI), benzotriazole (BTA), and 3-amino1H-1,2,4-triazole (3-AT)) on the corrosion of AA6082 aluminium alloy samples immersed in 5 wt.% NaCl solution at 25 and 50 °C was investigated. A 5 wt.% NaCl solution at a temperature of 50 °C is usually employed in automotive corrosion tests to represent a highly corrosive environment.
The EIS measurements indicated that only MBT and 3-AT showed a corrosion inhibition effect at 50 °C. These compounds were afterwards tested at 25 °C, at which only MBT showed a corrosion inhibition effect and was, therefore, analysed further. It was shown that the corrosion of the AA6082 aluminium alloy samples in 5 wt.% NaCl solution with 0.3 mM MBT at 25 °C is only under kinetic control. EIS measurements showed that for the AA6082 aluminium alloy samples immersed in 5 wt.% NaCl solution containing 0.3 mM MBT, the surface layer (comprising the oxide layer and the adsorbed inhibitor) increased with an increase in immersion time. The susceptibility of the AA6082 aluminium alloy samples to general corrosion under these conditions decreased with increasing immersion time. Potentiodynamic curve measurements showed that the addition of MBT lowered the corrosion current density of the AA6082 aluminium alloy samples. MBT acted as a cathodic-type corrosion inhibitor by mainly inhibiting the cathodic reaction of the corrosion couple. The inhibited samples showed lower susceptibility to localized (pitting) corrosion. The addition of KI as a possible intensifier did not significantly further influence the samples’ general and localized corrosion resistance, as determined by the EIS and potentiodynamic curve measurements.
The adsorption of MBT on the surface of the AA6082 aluminium alloy samples was proven by attenuated total reflectance Fourier transform infrared spectroscopy measurements, X-ray photoelectron spectroscopy, and time-of-flight secondary ion mass spectrometry. Contact angle measurements showed a significant decrease in the hydrophobicity of the samples upon the addition of 0.3 mM MBT, suggesting that the corrosion inhibition effect of MBT is not due to the formation of a barrier layer, but to a adsorbed layer that mitigates the oxidation of the base alloy.
5 wt.% NaCl solution containing3 mM MBT 45.9
Coatings 2019, 9, x FOR PEER REVIEW 12 of 15
surface layer does not act as a barrier for a corrosion medium, but rather forms an adsorbed layer that mitigates the oxidation (and consequently corrosion) of the AA6082 aluminium alloy samples.
Table 3. Average contact angle values (out of three replicate measurements) and the shape of the respective drop (one example) for the ground AA6082 aluminium alloy samples immersed for 1 h in 5 wt.% NaCl solution containing 0.3 mM MBT or a combination of 0.3 mM MBT and the addition of 0.1 wt.% KI at 25 °C.
Medium Average Contact Angle [°] Shape of the Drops on the Sample
5 wt.% NaCl solution 102.5
5 wt.% NaCl solution containing 3 mM MBT
45.9
5 wt.% NaCl solution containing 3 mM MBT + 0.1 wt.% KI
51.6
4. Conclusions
The corrosion inhibition effect of five azole compounds (i.e., 2-mercaptobenzothiazole (MBT), 2-mercaptobenzoxazole (MBO), 2-mercaptobenzimidazole (MBI), benzotriazole (BTA), and 3-amino1H-1,2,4-triazole (3-AT)) on the corrosion of AA6082 aluminium alloy samples immersed in 5 wt.% NaCl solution at 25 and 50 °C was investigated. A 5 wt.% NaCl solution at a temperature of 50 °C is usually employed in automotive corrosion tests to represent a highly corrosive environment.
The EIS measurements indicated that only MBT and 3-AT showed a corrosion inhibition effect at 50 °C. These compounds were afterwards tested at 25 °C, at which only MBT showed a corrosion inhibition effect and was, therefore, analysed further. It was shown that the corrosion of the AA6082 aluminium alloy samples in 5 wt.% NaCl solution with 0.3 mM MBT at 25 °C is only under kinetic control. EIS measurements showed that for the AA6082 aluminium alloy samples immersed in 5 wt.% NaCl solution containing 0.3 mM MBT, the surface layer (comprising the oxide layer and the adsorbed inhibitor) increased with an increase in immersion time. The susceptibility of the AA6082 aluminium alloy samples to general corrosion under these conditions decreased with increasing immersion time. Potentiodynamic curve measurements showed that the addition of MBT lowered the corrosion current density of the AA6082 aluminium alloy samples. MBT acted as a cathodic-type corrosion inhibitor by mainly inhibiting the cathodic reaction of the corrosion couple. The inhibited samples showed lower susceptibility to localized (pitting) corrosion. The addition of KI as a possible intensifier did not significantly further influence the samples’ general and localized corrosion resistance, as determined by the EIS and potentiodynamic curve measurements.
The adsorption of MBT on the surface of the AA6082 aluminium alloy samples was proven by attenuated total reflectance Fourier transform infrared spectroscopy measurements, X-ray photoelectron spectroscopy, and time-of-flight secondary ion mass spectrometry. Contact angle measurements showed a significant decrease in the hydrophobicity of the samples upon the addition of 0.3 mM MBT, suggesting that the corrosion inhibition effect of MBT is not due to the formation of a barrier layer, but to a adsorbed layer that mitigates the oxidation of the base alloy.
5 wt.% NaCl solution containing3 mM MBT + 0.1 wt.% KI 51.6
Coatings 2019, 9, x FOR PEER REVIEW 12 of 15
surface layer does not act as a barrier for a corrosion medium, but rather forms an adsorbed layer that mitigates the oxidation (and consequently corrosion) of the AA6082 aluminium alloy samples.
Table 3. Average contact angle values (out of three replicate measurements) and the shape of the respective drop (one example) for the ground AA6082 aluminium alloy samples immersed for 1 h in 5 wt.% NaCl solution containing 0.3 mM MBT or a combination of 0.3 mM MBT and the addition of 0.1 wt.% KI at 25 °C.
Medium Average Contact Angle [°] Shape of the Drops on the Sample
5 wt.% NaCl solution 102.5
5 wt.% NaCl solution containing 3 mM MBT
45.9
5 wt.% NaCl solution containing 3 mM MBT + 0.1 wt.% KI
51.6
4. Conclusions
The corrosion inhibition effect of five azole compounds (i.e., 2-mercaptobenzothiazole (MBT), 2-mercaptobenzoxazole (MBO), 2-mercaptobenzimidazole (MBI), benzotriazole (BTA), and 3-amino1H-1,2,4-triazole (3-AT)) on the corrosion of AA6082 aluminium alloy samples immersed in 5 wt.% NaCl solution at 25 and 50 °C was investigated. A 5 wt.% NaCl solution at a temperature of 50 °C is usually employed in automotive corrosion tests to represent a highly corrosive environment.
The EIS measurements indicated that only MBT and 3-AT showed a corrosion inhibition effect at 50 °C. These compounds were afterwards tested at 25 °C, at which only MBT showed a corrosion inhibition effect and was, therefore, analysed further. It was shown that the corrosion of the AA6082 aluminium alloy samples in 5 wt.% NaCl solution with 0.3 mM MBT at 25 °C is only under kinetic control. EIS measurements showed that for the AA6082 aluminium alloy samples immersed in 5 wt.% NaCl solution containing 0.3 mM MBT, the surface layer (comprising the oxide layer and the adsorbed inhibitor) increased with an increase in immersion time. The susceptibility of the AA6082 aluminium alloy samples to general corrosion under these conditions decreased with increasing immersion time. Potentiodynamic curve measurements showed that the addition of MBT lowered the corrosion current density of the AA6082 aluminium alloy samples. MBT acted as a cathodic-type corrosion inhibitor by mainly inhibiting the cathodic reaction of the corrosion couple. The inhibited samples showed lower susceptibility to localized (pitting) corrosion. The addition of KI as a possible intensifier did not significantly further influence the samples’ general and localized corrosion resistance, as determined by the EIS and potentiodynamic curve measurements.
The adsorption of MBT on the surface of the AA6082 aluminium alloy samples was proven by attenuated total reflectance Fourier transform infrared spectroscopy measurements, X-ray photoelectron spectroscopy, and time-of-flight secondary ion mass spectrometry. Contact angle measurements showed a significant decrease in the hydrophobicity of the samples upon the addition of 0.3 mM MBT, suggesting that the corrosion inhibition effect of MBT is not due to the formation of a barrier layer, but to a adsorbed layer that mitigates the oxidation of the base alloy.
4. Conclusions
The corrosion inhibition effect of five azole compounds (i.e., 2-mercaptobenzothiazole(MBT), 2-mercaptobenzoxazole (MBO), 2-mercaptobenzimidazole (MBI), benzotriazole (BTA), and3-amino1H-1,2,4-triazole (3-AT)) on the corrosion of AA6082 aluminium alloy samples immersed in5 wt.% NaCl solution at 25 and 50 C was investigated. A 5 wt.% NaCl solution at a temperature of50 C is usually employed in automotive corrosion tests to represent a highly corrosive environment.
The EIS measurements indicated that only MBT and 3-AT showed a corrosion inhibition effectat 50 C. These compounds were afterwards tested at 25 C, at which only MBT showed a corrosioninhibition effect and was, therefore, analysed further. It was shown that the corrosion of the AA6082aluminium alloy samples in 5 wt.% NaCl solution with 0.3 mM MBT at 25 C is only under kineticcontrol. EIS measurements showed that for the AA6082 aluminium alloy samples immersed in 5 wt.%NaCl solution containing 0.3 mM MBT, the surface layer (comprising the oxide layer and the adsorbedinhibitor) increased with an increase in immersion time. The susceptibility of the AA6082 aluminiumalloy samples to general corrosion under these conditions decreased with increasing immersion time.Potentiodynamic curve measurements showed that the addition of MBT lowered the corrosion currentdensity of the AA6082 aluminium alloy samples. MBT acted as a cathodic-type corrosion inhibitorby mainly inhibiting the cathodic reaction of the corrosion couple. The inhibited samples showedlower susceptibility to localized (pitting) corrosion. The addition of KI as a possible intensifier did notsignificantly further influence the samples’ general and localized corrosion resistance, as determinedby the EIS and potentiodynamic curve measurements.
The adsorption of MBT on the surface of the AA6082 aluminium alloy samples was proven byattenuated total reflectance Fourier transform infrared spectroscopy measurements, X-ray photoelectronspectroscopy, and time-of-flight secondary ion mass spectrometry. Contact angle measurements showeda significant decrease in the hydrophobicity of the samples upon the addition of 0.3 mM MBT, suggestingthat the corrosion inhibition effect of MBT is not due to the formation of a barrier layer, but to a adsorbedlayer that mitigates the oxidation of the base alloy.
Coatings 2019, 9, 380 13 of 15
In this study, MBT was, therefore, shown to be a corrosion inhibitor for AA6082 aluminium alloyin 5 wt.% NaCl solution. An appropriate agent that can increase the solubility of this compound willbe needed to further increase its corrosion inhibition effectiveness. Furthermore, some other intensifiershould be employed to increase the performance of MBT. Therefore, future studies should be orientedtowards corrosion inhibitor formulation design based on MBT as a corrosion inhibitor in such mixtures.
Author Contributions: Conceptualization, M.F.; Methodology, M.F. and K.X.; Software, M.F. and K.X.; Validation,M.F. and K.X.; Formal Analysis, M.F. and K.X.; Investigation, K.X. and M.F.; Resources, M.F.; Data Curation,K.X. and M.F.; Writing—Original Draft Preparation, K.X. and M.F.; Writing—Review and Editing, K.X. and M.F.;Visualization, M.F. and K.X.; Supervision, M.F.; Project Administration, M.F.; Funding Acquisition, M.F.
Funding: This research was funded by the Slovenian Research Agency (P2-0032).
Conflicts of Interest: The authors declare no conflict of interest.
References
1. Davis, J.R. Corrosion: Understanding the Basics; ASM International: Novelty, OH, USA, 2000.2. Revie, R.W. Uhlig’s Corrosion Handbook, 3rd ed.; John Willey & Sons Inc.: New York, NY, USA, 2011.3. Davis, J.R. Corrosion of Aluminium and Aluminium Alloys; ASM International: Novelty, OH, USA, 1999.4. Poznak, A.; Freiberg, D.; Sanders, P. Chapter 10—Automotive wrought aluminium alloys. In Fundamentals of
Aluminium Metallurgy; Lumley, R.N., Ed.; Woodhead Publishing: Sawston, UK, 2018; pp. 333–386.5. Larsen, M.H.; Walmsley, J.C.; Lunder, O.; Mathiesen, R.H.; Nisancioglu, K. Intergranular corrosion of
copper-containing AA6xxx AlMgSi aluminum alloys. J. Electrochem. Soc. 2008, 155, C550–C556. [CrossRef]6. Zhan, H.; Mol, J.M.C.; Hannour, F.; Zhuang, L.; Terryn, H.; de Wit, J.H.W. The influence of copper content on
intergranular corrosion of model AlMgSi(Cu) alloys. Mater. Corros. 2008, 59, 670–675. [CrossRef]7. Svenningsen, G.; Lein, J.E.; Bjørgum, A.; Nordlien, J.H.; Yu, Y.; Nisancioglu, K. Effect of low copper content
and heat treatment on intergranular corrosion of model AlMgSi alloys. Corros. Sci. 2006, 48, 226–242.[CrossRef]
8. Zou, Y.; Liu, Q.; Jia, Z.; Xing, Y.; Ding, L.; Wang, X. The intergranular corrosion behavior of 6000-series alloyswith different Mg/Si and Cu content. Appl. Surf. Sci. 2017, 405, 489–496. [CrossRef]
9. Kairy, S.K.; Rometsch, P.A.; Diao, K.; Nie, J.F.; Davies, C.H.J.; Birbilis, N. Exploring the electrochemistry of6xxx series aluminium alloys as a function of Si to Mg ratio, Cu content, ageing conditions and microstructure.Electrochim. Acta 2016, 190, 92–103. [CrossRef]
10. Liang, W.J.; Rometsch, P.A.; Cao, L.F.; Birbilis, N. General aspects related to the corrosion of 6xxx seriesaluminium alloys: Exploring the influence of Mg/Si ratio and Cu. Corros. Sci. 2013, 76, 119–128. [CrossRef]
11. Deepa, P.; Padmalatha, R. Corrosion behaviour of 6063 aluminium alloy in acidic and in alkaline media.Arab. J. Chem. 2017, 10, S2234–S2244. [CrossRef]
12. Cicolin, D.; Trueba, M.; Trasatti, S.P. Effect of chloride concentration, pH and dissolved oxygen, on therepassivation of 6082-T6 Al alloy. Electrochim. Acta 2014, 124, 27–35. [CrossRef]
13. Panagopoulos, C.N.; Georgiou, E.; Giannakopoulos, K.I.; Orfanos, P.G. Effect of pH on stress corrosioncracking of 6082 Al alloy. Metals 2018, 8, 578. [CrossRef]
14. Trdan, U.; Grum, J. Evaluation of corrosion resistance of AA6082-T651 aluminium alloy after laser shockpeening by means of cyclic polarisation and EIS methods. Corros. Sci. 2012, 59, 324–333. [CrossRef]
15. Xhanari, K.; Finšgar, M. Electrochemical analysis of AA6082 aluminium alloy in chloride media. Int. J.Electrochem. Sci. 2017, 12, 5845–5853. [CrossRef]
16. Firouzi, A.; Del Gaudio, C.; lamastra, F.R.; Montesperelli, G.; Bianco, A. Electrospun polymeric coatings onaluminum alloy as a straightforward approach for corrosion protection. J. Appl. Polym. Sci. 2015, 132, 41250.[CrossRef]
17. Mori, S.; Lamastra, F.R.; Kaciulis, S.; Soltani, P.; Montesperelli, G. Low-temperature titania coatings foraluminium corrosion protection. Corros. Eng. Sci. Technol. 2018, 53, 44–53. [CrossRef]
18. Panagopoulos, C.N.; Georgiou, E.P.; Gavras, A.G. Corrosion and wear of 6082 aluminum alloy. Tribol. Int.2009, 42, 886–889. [CrossRef]
19. Xhanari, K.; Finšgar, M. Organic corrosion inhibitors for aluminium and its alloys in acid solutions: A review.RSC Adv. 2016, 6, 62833–62857. [CrossRef]
Coatings 2019, 9, 380 14 of 15
20. Xhanari, K.; Finšgar, M. Organic corrosion inhibitors for aluminum and its alloys in chloride and alkalinesolutions: A review. Arab. J. Chem. 2016, in press. [CrossRef]
21. Xhanari, K.; Finsgar, M.; Knez Hrncic, M.; Maver, U.; Knez, Z.; Seiti, B. Green corrosion inhibitors foraluminium and its alloys: A review. RSC Adv. 2017, 7, 27299–27330. [CrossRef]
22. Xhanari, K.; Finsgar, M. The first electrochemical and surface analysis of 2-aminobenzimidazole as a corrosioninhibitor for copper in chloride solution. New J. Chem. 2017, 41, 7151–7161. [CrossRef]
23. Finšgar, M. 2-mercaptobenzimidazole as a copper corrosion inhibitor: Part I. Long-term immersion,3D-profilometry, and electrochemistry. Corros. Sci. 2013, 72, 82–89. [CrossRef]
24. Finšgar, M. Electrochemical analysis of 4-methyl-2-phenyl-imidazole adsorbed on Cu. Int. J. Electrochem. Sci.2016, 11, 6775–6790. [CrossRef]
25. Finšgar, M.; Merl, D.K. 2-Mercaptobenzoxazole as a copper corrosion inhibitor in chloride solution:Electrochemistry, 3D-profilometry, and XPS surface analysis. Corros. Sci. 2014, 80, 82–95. [CrossRef]
26. Finšgar, M.; Merl, D.K. An electrochemical, long-term immersion, and XPS study of 2-mercaptobenzothiazoleas a copper corrosion inhibitor in chloride solution. Corros. Sci. 2014, 83, 164–175. [CrossRef]
27. Finšgar, M.; Lesar, A.; Kokalj, A.; Milošev, I. A comparative electrochemical and quantum chemical calculationstudy of BTAH and BTAOH as copper corrosion inhibitors in near neutral chloride solution. Electrochim.Acta 2008, 53, 8287–8297. [CrossRef]
28. Finšgar, M.; Xhanari, K. Electrochemical and surface analysis of 2-phenylimidazole adsorbed on copper fromchloride solution. Coatings 2018, 8, 234. [CrossRef]
29. Huang, H.; Wang, Z.; Gong, Y.; Gao, F.; Luo, Z.; Zhang, S.; Li, H. Water soluble corrosion inhibitors for copperin 3.5 wt % sodium chloride solution. Corros. Sci. 2017, 123, 339–350. [CrossRef]
30. Curkovic, H.O.; Stupnisek-Lisac, E.; Takenouti, H. The influence of pH value on the efficiency of imidazolebased corrosion inhibitors of copper. Corros. Sci. 2010, 52, 398–405. [CrossRef]
31. Petrovic Mihajlovic, M.B.; Radovanovic, M.B.; Tasic, Ž.Z.; Antonijevic, M.M. Imidazole based compounds ascopper corrosion inhibitors in seawater. J. Mol. Liquids 2017, 225, 127–136. [CrossRef]
32. Mennucci, M.M.; Banczek, E.P.; Rodrigues, P.R.P.; Costa, I. Evaluation of benzotriazole as corrosion inhibitorfor carbon steel in simulated pore solution. Cem. Concr. Compos. 2009, 31, 418–424. [CrossRef]
33. Finšgar, M.; Petovar, B.; Xhanari, K.; Maver, U. The corrosion inhibition of certain azoles on steel in chloridemedia: Electrochemistry and surface analysis. Corros. Sci. 2016, 111, 370–381. [CrossRef]
34. Sabet Bokati, K.; Dehghanian, C.; Yari, S. Corrosion inhibition of copper, mild steel and galvanically coupledcopper-mild steel in artificial sea water in presence of 1H-benzotriazole, sodium molybdate and sodiumphosphate. Corros. Sci. 2017, 126, 272–285. [CrossRef]
35. Abd El Haleem, S.M.; Abd El Wanees, S.; Bahgat, A. Environmental factors affecting the corrosion behaviourof reinforcing steel. VI. Benzotriazole and its derivatives as corrosion inhibitors of steel. Corros. Sci. 2014, 87,321–333. [CrossRef]
36. Sherif, E.-S.M. Electrochemical investigations on the corrosion inhibition of aluminum by3-amino-1,2,4-triazole-5-thiol in naturally aerated stagnant seawater. J. Ind. Eng. Chem. 2013, 19, 1884–1889.[CrossRef]
37. Zor, S.; Sagdinç, S. Experimental and theoretical study of sulfathiazole as environmentally friendly inhibitoron aluminum corrosion in NaCl. Prot. Met. Phys. Chem. Surf. 2014, 50, 244–253. [CrossRef]
38. Harvey, T.G.; Hardin, S.G.; Hughes, A.E.; Muster, T.H.; White, P.A.; Markley, T.A.; Corrigan, P.A.; Mardel, J.;Garcia, S.J.; Mol, J.M.C.; et al. The effect of inhibitor structure on the corrosion of AA2024 and AA7075.Corros. Sci. 2011, 53, 2184–2190. [CrossRef]
39. Lamaka, S.V.; Zheludkevich, M.L.; Yasakau, K.A.; Montemor, M.F.; Ferreira, M.G.S. High effective organiccorrosion inhibitors for 2024 aluminium alloy. Electrochim. Acta 2007, 52, 7231–7247. [CrossRef]
40. Coelho, L.B.; Cossement, D.; Olivier, M.-G. Benzotriazole and cerium chloride as corrosion inhibitors forAA2024-T3: An EIS investigation supported by SVET and ToF-SIMS analysis. Corros. Sci. 2018, 130, 177–189.[CrossRef]
41. ISO 9227:2006(E) Corrosion Tests in Artificial Atmospheres—Salt Spray Tests; ISO: Geneva, Switzerland, 2006.42. Finšgar, M.; Jackson, J. Application of corrosion inhibitors for steels in acidic media for the oil and gas
industry: A review. Corros. Sci. 2014, 86, 17–41. [CrossRef]43. Massart, D.L.; Vandeginste, B.G.M.; Buydens, L.M.C.; Jong, S.D.; Lewi, P.J.; Smeyers-Verbeke, J. Handbook of
Chemometrics and Qualimetrics: Part A; Elsevier Science: Amsterdam, The Netherlands, 1997; p. 112.

Coatings 2019, 9, 380 15 of 15
44. Kovac, J.; Finšgar, M. Analysis of the thermal stability of very thin surface layers of corrosion inhibitors bytime-of-flight secondary ion mass spectrometry. J. Am. Soc. Mass Spectrom. 2018, 29, 2305–2316. [CrossRef]
45. Finšgar, M.; Milošev, I. Corrosion behaviour of stainless steels in aqueous solutions of methanesulfonic acid.Corros. Sci. 2010, 52, 2430–2438. [CrossRef]
46. Gerakines, P.A.; Schutte, W.A.; Greenberg, J.M.; van Dishoeck, E.F. The infrared band atrengths of H2O, COand CO2 in laboratory simulations of astrophysical ice mixtures. Astron. Astrophys. 1995, 296, 810–818.
47. Güllüoglu, M.T.; Erdogdu, Y.; Karpagam, J.; Sundaraganesan, N.; Yurdakul, S. DFT, FT-Raman, FT-IR andFT-NMR studies of 4-phenylimidazole. J. Mol. Struct. 2011, 990, 14–20. [CrossRef]
48. Rai, A.K.; Singh, R.; Singh, K.N.; Singh, V.B. FTIR, Raman spectra and ab initio calculations of2-mercaptobenzothiazole. Spectrochim. Acta Part A Mol. Biomol. Spectrosc. 2006, 63, 483–490. [CrossRef][PubMed]
49. Sudha, S.; Karabacak, M.; Kurt, M.; Cinar, M.; Sundaraganesan, N. Molecular structure, vibrationalspectroscopic, first-order hyperpolarizability and HOMO, LUMO studies of 2-aminobenzimidazole.Spectrochim. Acta Part A Mol. Biomol. Spectrosc. 2011, 84, 184–195. [CrossRef] [PubMed]
50. Erdogdu, Y.; Eskioglu, B.; Güllüoglu, M.T. Theoretical investigations on the molecular structure andvibrational spectral analysis of 4-methyl 2-phenylimidazole. Opt. Spectrosc. 2012, 113, 596–606. [CrossRef]
51. Li, X.; Tang, Z.; Zhang, X. Molecular structure, IR spectra of 2-mercaptobenzothiazole and2-mercaptobenzoxazole by density functional theory and ab initio Hartree–Fock calculations. Spectrochim.Acta Part A Mol. Biomol. Spectrosc. 2009, 74, 168–173. [CrossRef] [PubMed]
© 2019 by the authors. Licensee MDPI, Basel, Switzerland. This article is an open accessarticle distributed under the terms and conditions of the Creative Commons Attribution(CC BY) license (http://creativecommons.org/licenses/by/4.0/).