Wear behaviour of cemented carbide tools in dry machining of aluminium alloy
13
Wear 259 (2005) 1177–1189 Wear behaviour of cemented carbide tools in dry machining of aluminium alloy G. List a , M. Nouari a,∗ , D. G´ ehin a , S. Gomez b , J.P. Manaud b , Y. Le Petitcorps b , F. Girot a a Laboratoire Mat´ eriaux Endommagement Fiabilit´ e Ing´ enierie des Proc´ ed´ es, ENSAM CER Bordeaux, Esplanade des, Arts et M´ etiers, 33405 Talence Cedex, France b Institut de Chimie de la Mati` ere Condens´ ee de Bordeaux—CNRS. 87, Avenue du Docteur Albert Schweitzer, 33608 Pessac Cedex, France Received 28 July 2004; received in revised form 21 January 2005; accepted 3 February 2005 Available online 13 May 2005 Abstract Several causes of tool wear have been investigated in dry machining of aluminium alloy with cemented carbide insert; some of the most important are: adhesion and diffusion. The formation of built-up edge (BUE) and adhesive layer on the tool rake face degrades on the one hand, the shape and efficiency of cutting tool and on the other hand, the surface quality and dimensional accuracy of the finished product. This paper describes tool wear mechanisms in dry machining of a usual aluminium–copper alloy (2024) with an uncoated cemented carbide tool (WC–Co). Orthogonal cutting tests were performed using an instrumented planer machine. The morphology of chips, cutting forces and contact lengths were analyzed for several cutting conditions. The tool–chip interface temperature and the average pressure were calculated by conducting calibration–cutting experiments in conjunction with FEM simulations. This allowed to define the contact parameters associated with different cutting conditions on the tool rake face. High-speed camera movies (CCD), white light interferometry, scanning electron microscopy (SEM) equipped with energy dispersive X-ray spectrometer (EDS) and Auger electron spectroscopy (AES) were investigated to show the development of the built-up edge and the adhesive layer on the tool rake face during machining process. The results confirmed that the wear mechanisms involve the activation of the chemical and the diffusional phenomenon. © 2004 Elsevier B.V. All rights reserved. Keywords: Dry machining; FEM simulation; Tool wear; Built-up edge; Built-up layer; Diffusion 1. Introduction During the cutting process, the tool removes a part of the workpiece by a process of intense plastic deformation at high strain rate within the primary and secondary shear zones; see Fig. 1. Thus, the cutting face is subjected to a high tempera- ture and a great pressure. Dry machining seriously increases tool damage because these contact conditions become very severe. In dry machining of aluminium alloy, the tool wear is mainly caused by the formation of an adhesive layer and a built-up edge (BUE), which affect the quality of the gen- erated surface [1–4]. According to previous works [5–10], ∗ Corresponding author. Tel.: +33 5 56 84 54 48; fax: +33 5 56 84 53 66. E-mail address: [email protected] (M. Nouari). the various types of tool wear depend on the nature of the tool, the workpiece material, the cutting conditions and the machining operation (turning, milling, drilling, ...). At low cutting speeds, the tool–chip interface tempera- ture (cutting temperature) is relatively low and abrasion wear dominates when the tribological conditions are essentially sliding [11,12]. At these low temperatures, there is not yet thermal softening and the cutting forces are important. Built- up edge can appear, aiming at increasing of the rake angle in order to facilitate the chip formation. And when the cut- ting speed is augmented, the formation of a built-up layer (BUL) at the contact zone is also observed. Adhesion wear is caused by the mechanical removal of the tool material when the adhesive junctions are broken. This attrition process can dramatically deteriorate the tool rake face. If the cutting speed is more important, the temperature will be higher and adhe- 0043-1648/$ – see front matter © 2004 Elsevier B.V. All rights reserved. doi:10.1016/j.wear.2005.02.056
Transcript of Wear behaviour of cemented carbide tools in dry machining of aluminium alloy
Wear 259 (2005) 1177–1189
Wear behaviour of cemented carbide tools indry machining of aluminium alloy
G. Lista, M. Nouaria,∗, D. Gehina, S. Gomezb, J.P. Manaudb, Y. Le Petitcorpsb, F. Girota
a Laboratoire Materiaux Endommagement Fiabilit´e Ingenierie des Proc´edes, ENSAM CER Bordeaux,Esplanade des, Arts et M´etiers, 33405 Talence Cedex, France
b Institut de Chimie de la Mati`ere Condens´ee de Bordeaux—CNRS. 87, Avenue du Docteur Albert Schweitzer, 33608 Pessac Cedex, France
Received 28 July 2004; received in revised form 21 January 2005; accepted 3 February 2005Available online 13 May 2005
Abstract
Several causes of tool wear have been investigated in dry machining of aluminium alloy with cemented carbide insert; some of the mostimportant are: adhesion and diffusion. The formation of built-up edge (BUE) and adhesive layer on the tool rake face degrades on the onehand, the shape and efficiency of cutting tool and on the other hand, the surface quality and dimensional accuracy of the finished product.T ted carbidet forces andc alculated byc ssociatedw electronm stigated tos nfirmed thatt©
K
1
wsFttsiae
(
f thethe
era-ear
tiallyyetuilt-angleut-
ayerar ishen
s caneed
dhe-
0d
his paper describes tool wear mechanisms in dry machining of a usual aluminium–copper alloy (2024) with an uncoated cemenool (WC–Co). Orthogonal cutting tests were performed using an instrumented planer machine. The morphology of chips, cuttingontact lengths were analyzed for several cutting conditions. The tool–chip interface temperature and the average pressure were conducting calibration–cutting experiments in conjunction with FEM simulations. This allowed to define the contact parameters aith different cutting conditions on the tool rake face. High-speed camera movies (CCD), white light interferometry, scanningicroscopy (SEM) equipped with energy dispersive X-ray spectrometer (EDS) and Auger electron spectroscopy (AES) were inve
how the development of the built-up edge and the adhesive layer on the tool rake face during machining process. The results cohe wear mechanisms involve the activation of the chemical and the diffusional phenomenon.
2004 Elsevier B.V. All rights reserved.
eywords:Dry machining; FEM simulation; Tool wear; Built-up edge; Built-up layer; Diffusion
. Introduction
During the cutting process, the tool removes a part of theorkpiece by a process of intense plastic deformation at hightrain rate within the primary and secondary shear zones; seeig. 1. Thus, the cutting face is subjected to a high tempera-
ure and a great pressure. Dry machining seriously increasesool damage because these contact conditions become veryevere. In dry machining of aluminium alloy, the tool wears mainly caused by the formation of an adhesive layer and
built-up edge (BUE), which affect the quality of the gen-rated surface[1–4]. According to previous works[5–10],
∗ Corresponding author. Tel.: +33 5 56 84 54 48; fax: +33 5 56 84 53 66.E-mail address:[email protected]
M. Nouari).
the various types of tool wear depend on the nature otool, the workpiece material, the cutting conditions andmachining operation (turning, milling, drilling,. . .).
At low cutting speeds, the tool–chip interface tempture (cutting temperature) is relatively low and abrasion wdominates when the tribological conditions are essensliding [11,12]. At these low temperatures, there is notthermal softening and the cutting forces are important. Bup edge can appear, aiming at increasing of the rakein order to facilitate the chip formation. And when the cting speed is augmented, the formation of a built-up l(BUL) at the contact zone is also observed. Adhesion wecaused by the mechanical removal of the tool material wthe adhesive junctions are broken. This attrition procesdramatically deteriorate the tool rake face. If the cutting spis more important, the temperature will be higher and a
043-1648/$ – see front matter © 2004 Elsevier B.V. All rights reserved.oi:10.1016/j.wear.2005.02.056

1178 G. List et al. / Wear 259 (2005) 1177–1189
Fig. 1. Definition of cutting parameters and deformation zones in orthogonalcutting configuration.
sion wear effect will be attenuated. A thin adhesive layeris obtained and it facilitates the chip sliding by decreasingthe friction between tool and chip. But at very high temper-ature, chemical wear takes place and chemical species candiffuse from the tool surface towards the chip and vice versa.This chemical diffusion change the contact conditions andfacilitates the tool failure. This can involve a very differentperformance of the machining, which will evolve more orless quickly in time.
In spite of the large amount of data and knowledge thathave been accumulated, wear mechanisms are still not fullyunderstood. In the present paper, our investigations were fo-cused on the wear mechanisms, which take place on the toolrake face when machining aluminium alloys 2024 under drycutting condition. These mechanisms can lead to the forma-tion of a significant aluminium deposit on the tool rake face,which is appeared as a BUE and/or a BUL[4,5]. To control thephysico-chemical phenomena, which occur at the interfaceand lead to the damage, the contact parameters like temperature and pressure on the tool–chip interface must be identified.However, it is very difficult to measure experimentally theseparameters with accuracy[13,14]. That is why, we propose inthis study to use finite element modeling. Orthogonal cuttingconfiguration (Fig. 1) is chosen because it is the only process,which is really controlled from a numerical and experimental
point of view. The results so obtained will allow relating thewear mechanisms not only to the cutting parameters (rake an-gleα, cutting speedVc, uncut chip thicknesst1) but also to thetribological parameters (friction, temperature and pressure).In Section2, the method to validate the numerical model isdescribed using a special device for the observation of chipformation with a planer machine. Indeed, this configurationfacilitates the visualization by CCD camera since the toolremains motionless during the cutting process. The compar-ison between experimental trends and numerical simulationsenables us to identify the tribological parameters. In Section3, wear tests were carried out on a CNC lathe under differ-ent cutting times and conditions. In the last sections, worntool surfaces are analyzed by different techniques (scanningelectron microscopy–energy dispersive X-ray spectrometer(SEM–EDS), Auger electron spectroscopy (AES) and op-tical profilometry) to identify wear mechanisms. Two wearcases are distinguished: (1) wear at low cutting conditions(Section4) and (2) wear at severe cutting conditions (Sec-tion 5). The objective is to establish a relationship betweencontact parameters and tool wear behaviour.
2. Determination of tribological parameters
In machining, it is very difficult to obtain complete infor-m ntalt narys natet ry or-t lysiss tion,t pletei zoneb cha-n
2
2lan-
n ed ona the
l cuttin
Fig. 2. Inserts and tools for orthogona-
ation about tribological parameters only via experimeests. For that reason, the main objective of this prelimitudy is to develop a methodology in order to determihese parameters. In this section, we describe preliminahogonal cutting tests coupled with Finite Elements anao as to be able to predict tribological parameters as fricool–chip interface temperature and pressure. The comnformation about phenomena that occur in the contactetween tool and chip is essential to identify wear meisms during the machining process.
.1. Experimental set-up
.1.1. Cutting tool and workpiece materialsTo obtain an ideal orthogonal cutting configuration, p
ing operation was selected. Cutting tests were performplaner machine GSP 2108 R.20 which allows to vary
g: (a) insert dimensions and (b) tool holders.

G. List et al. / Wear 259 (2005) 1177–1189 1179
Fig. 3. SEM image of a polished surface inside the carbide (6 wt.% Co) tool.
cutting velocity between 6 and 60 m/min. Uncoated carbideinserts (K4 geometry type, see Sandwik catalogue) are usedas cutting tools. Special tool holders were manufactured forthe planer machine, each one offering a different rake angleα (0◦, 15◦ and 30◦); seeFig. 2b. Clearance angle is obtainedby grinding the flank face of the insert and the tools had acutting edge radius of 0.01 mm. The clearance angle is keptconstant to 12◦ for all tools and all cutting conditions.
The inserts consist of WC tungsten carbide with cobalt asbinder. The chemical analysis on a polished surface insidethe tool (Fig. 3) gives a composition with 6 wt.% of cobaltand no mixed carbide has been detected (TiC, TaC, NbC, VC,. . .). The Co binder is uniformly distributed and WC grains
Table 1Physical properties for the tool material
ρ (g/cm3) 15E (Gpa) 630ν 0.23K (W/m K) 100Cp (J/kg K) 240
have sizes varying from 1 to 5�m. Physical properties ofthe carbide tool used for numerical simulations are shown inTable 1.
The carbide insert rake face is not reground and contrary tothe bulk material, the rake face presents an inhomogeneousstate regarding the chemical composition and morphology.SEM observations show very concentrated areas with WCgrains (Fig. 4a) close to very Co binder rich areas (Fig. 4b).Thus, the surface roughness is relatively important on the rakeface with aRa of 0.5�m andRt of 5�m. The workpiece is a2024–T351 aluminium alloy bar with a T section; seeFig. 5.The cutting length given by the bar length (about 1.5 m) pro-vides a sufficient cutting time to reach the stationary regimeof the cutting process (1.5 s for a cutting speed of 60 m/min).The depth of cut (w = 4 mm) is given by the width of the bar.2024–T351 is a precipitation hardened aluminium alloy withthe chemical composition presented inTable 2.
Thermal conductivity, density and heat capacity are, re-spectively, 120 W/m K, 2780 kg/m3 and 856 J/kg K. This alu-minium alloy is characterized by a significant elements con-
: (a) W
Fig. 4. SEM images of the tool rake faceFig. 5. Orthogonal cutting configuration: (a) workpie
C grains rich zone and (b) Co binder rich zone.
ce dimensions and (b) cutting tool and workpiece.
1180 G. List et al. / Wear 259 (2005) 1177–1189
Table 2Chemical composition (wt.%) of 2024–T351 aluminium alloy
Al BalancedCr Maximum 0.1Cu 3.8–4.9Fe Maximum 0.5Mg 1.2–1.8Mn 0.3–0.9Si Maximum 0.5Ti Maximum 0.15Zn Maximum 0.25
tent of copper and magnesium. The last one leads to the pre-cipitation of Al2CuMg phase.
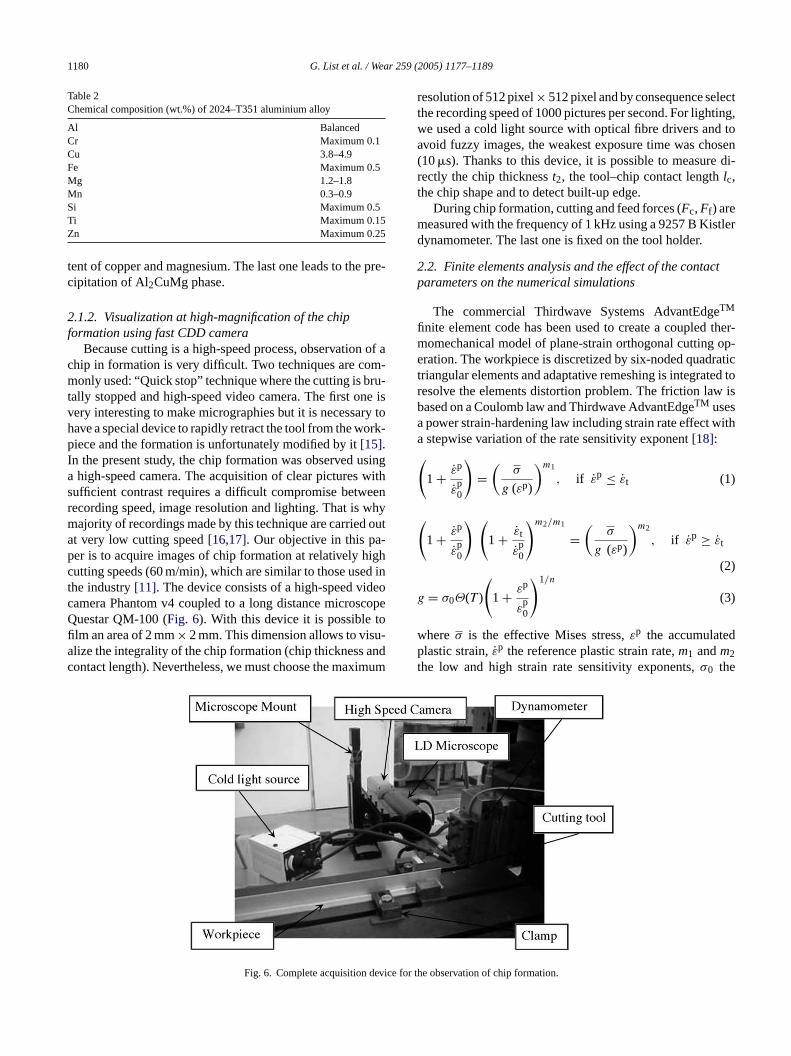
2.1.2. Visualization at high-magnification of the chipformation using fast CDD camera
Because cutting is a high-speed process, observation of achip in formation is very difficult. Two techniques are com-monly used: “Quick stop” technique where the cutting is bru-tally stopped and high-speed video camera. The first one isvery interesting to make micrographies but it is necessary tohave a special device to rapidly retract the tool from the work-piece and the formation is unfortunately modified by it[15].In the present study, the chip formation was observed usinga high-speed camera. The acquisition of clear pictures withsufficient contrast requires a difficult compromise betweenrecording speed, image resolution and lighting. That is whymajority of recordings made by this technique are carried outat very low cutting speed[16,17]. Our objective in this pa-per is to acquire images of chip formation at relatively highcutting speeds (60 m/min), which are similar to those used inthe industry[11]. The device consists of a high-speed videocamera Phantom v4 coupled to a long distance microscopeQuestar QM-100 (Fig. 6). With this device it is possible tofilm an area of 2 mm× 2 mm. This dimension allows to visu-alize the integrality of the chip formation (chip thickness andc imum
resolution of 512 pixel× 512 pixel and by consequence selectthe recording speed of 1000 pictures per second. For lighting,we used a cold light source with optical fibre drivers and toavoid fuzzy images, the weakest exposure time was chosen(10�s). Thanks to this device, it is possible to measure di-rectly the chip thicknesst2, the tool–chip contact lengthlc,the chip shape and to detect built-up edge.
During chip formation, cutting and feed forces (Fc,Ff ) aremeasured with the frequency of 1 kHz using a 9257 B Kistlerdynamometer. The last one is fixed on the tool holder.
2.2. Finite elements analysis and the effect of the contactparameters on the numerical simulations
The commercial Thirdwave Systems AdvantEdgeTM
finite element code has been used to create a coupled ther-momechanical model of plane-strain orthogonal cutting op-eration. The workpiece is discretized by six-noded quadratictriangular elements and adaptative remeshing is integrated toresolve the elements distortion problem. The friction law isbased on a Coulomb law and Thirdwave AdvantEdgeTM usesa power strain-hardening law including strain rate effect witha stepwise variation of the rate sensitivity exponent[18]:(
1 + εp
εp0
)=(
σ
g (εp)
)m1
, if εp ≤ εt (1)
(
g
w dpt
vice fo
ontact length). Nevertheless, we must choose the max
Fig. 6. Complete acquisition de
1 + εp
εp0
) (1 + εt
εp0
)m2/m1
=(
σ
g (εp)
)m2
, if εp ≥ εt
(2)
= σ0Θ(T )
(1 + εp
εp0
)1/n
(3)
hereσ is the effective Mises stress,εp the accumulatelastic strain,εp the reference plastic strain rate,m1 andm2
he low and high strain rate sensitivity exponents,σ0 the
r the observation of chip formation.

G. List et al. / Wear 259 (2005) 1177–1189 1181
Fig. 7. Effect of the friction coefficient on the contact parameters for a same cutting condition:Vc = 60 m/min,α = 15◦, t1 = 0.1 mm,w = 4 mm. (a) Tool–chipinterface temperature distribution and (b) tool–chip interface pressure distribution.
yield stress at a reference temperatureT0, n the hardeningexponent andΘ is the thermal softening function.
The main parameters which affect the simulation resultsare the friction coefficientµ and the material data[19,20].The formulation for material modeling proposed by Advant-Edge is particularly adapted for machining simulation. In-deed, in the primary and secondary shear zones very highstrain rates are achieved, while the remainder of the chip andworkpiece deform at moderate strain rates. Workpiece ma-terial data used for simulation are the data proposed by thecode. The tool material properties entered the code are givenin Table 1. Friction coefficient is another simulation param-eter, which drastically influences the results. It is known fora long time that friction at the tool–chip interface controlsthe deformation in the primary and secondary shear zone[21–23]and by consequence the stress and temperature distri-butions. For example,Fig. 7a shows that both magnitude andshape temperature profile is modified by the friction value.In particular, the contact length (detected by the brutal fallof the temperature) increases when the friction coefficientincreases too. Both cutting forceFc and feed forceFf arealso influenced by the friction value. By increasing the valueof µ, we also increase the values of the force components(Fig. 8a).
By tuning the friction coefficient value, a good agreementbetween experiments and simulations can be found for sev-eral variables. The cutting forceFc, the feed forceFf , the chipthicknesst2 and the contact lengthlc are the retained metricsfor the model validation. To choose the best friction value,several simulations were conducted until obtaining the bestcompromise betweenFc, Ff , t2, lc and the chip shape, seeFigs 9a and 10a.
2.3. Identification of the cutting temperature and thecontact pressure at the tool–chip interface
The experimental and predicted results (with the selectedfriction coefficient) are compared inTable 3. All tests wereconducted without lubrication. Force components are mea-sured at an instant of the cutting when the BUE does notoccur (detected thanks to films). The values of the retainedfriction coefficients range between 0.7 and 0.9. These valuesare great compared with other material as steel[20]. Thatmay mean that for aluminium alloy the contact is closer to asticking contact (seizure) than to a sliding contact. Note thatwhen the BUE occurs during all the cutting length (indicatedin theTable 3) it becomes impossible to make a comparison.Indeed, BUE changes in a significant way the nature of the
F r the fF (b) cor
ig. 8. Influence of friction coefficient on the force components underiction coefficient effect on the cutting forceFc and the feed forceFf and
ollowing cutting conditions:Vc = 60 m/min,α = 15◦, t1 = 0.1 mm,w = 4 mm. (a)responding experimental results.

1182 G. List et al. / Wear 259 (2005) 1177–1189
Fig. 9. High-speed video recording of the chip formation in orthogonal cutting and the corresponding FE simulation with the temperature field,Vc = 60 m/min,α = 15◦, t1 = 0.1 mm,w = 4 mm. The simulation boundary lines are reproduced on the video image.
Fig. 10. High-speed video recording of the chip formation in orthogonal cutting, and the corresponding FE simulations with the temperature field,Vc = 60 m/min,α = 30◦, t1 = 0.05 mm,w = 4 mm. The simulation boundary lines are reproduced on the video image.
contact and the tool geometry. However, for these particularcases, simulations were also carried out withµ = 0.8.
The needed parameters to characterize the contact are themaximum temperatureTmax at the tool–chip interface andthe average pressurePav around the location whereTmax isreached. We observe thatTmax strongly increases with the
feed but it is less sensitive to the rake angle variation (even ifTmaxdecreases with an increase inα). Concerning the contactpressure, the variation ofPav is not linear with the uncut chipthicknesst1. The shift oft1 from 0.05 to 0.1 mm implies anincrease in pressure, but between 0.1 and 0.3 mm the pressureconsiderably reduces (due to the temperature dependence of
Table 3Simulations and experimental results
Test Cutting conditions Experiments Simulations
Vc
(m/min)α (◦) t1
(mm)Fc (N) Ff (N) t2
(mm)lc(mm)
BUE Fc (N) Ff (N) t2(mm)
lc(mm)
µ Tmax
(◦C)Pav
(MPa)
1 60 0 0.05 250 150 0.08 0.06 Yes 330 240 0.16 0.19 0.8 160 2002 60 0 0.1 500 300 0.22 0.14 Yes 550 350 0.25 0.32 0.8 190 4003 60 0 0.3 1200 600 0.50 0.6 No 1200 600 0.52 0.56 0.7 245 3004 60 15 0.05 250 125 0.08 0.12 No 260 125 0.12 0.16 0.8 148 4505 60 15 0.1 450 200 0.18 0.25 No 450 190 0.21 0.23 0.8 180 5006 60 15 0.3 1200 400 0.48 0.6 No 1050 350 0.51 0.55 0.8 230 2007 60 30 0.05 250 100 0.09 0.12 No 220 80 0.09 0.09 0.9 145 3008 60 30 0.1 400 100 0.18 0.25 No 360 80 0.17 0.18 0.8 158 4009 60 30 0.3 1100 125 0.42 0.46 No 940 100 0.46 0.42 0.9 225 200

G. List et al. / Wear 259 (2005) 1177–1189 1183
Fig. 11. Orthogonal cutting for wear tests: (a) CNC lathe SOMAB 500 and (b) workpiece and tool.
the mechanical behaviour). Moreover, the pressure is largerfor the weak rake angles in spite of a higher temperature (forthe same value oft1). Note that contact conditions are simu-lated without taking into account the tool wear process. Wemust consider these contact conditions as the conditions ex-isting at the beginning of the cutting and which initiate wearmechanisms. When the cutting tool is damaged, the condi-tions at the tool–chip interface can be appreciably modified.
3. Experimental set up for wear tests
3.1. Wear tests
Planning operation is not adapted for wear experimentsbecause of the short cutting time. Wear tests were then con-ducted in turning operation under a SOMAB T500 CNC ma-chining center (Fig. 11a). To simulate the planning operation,special specimens were prepared (Fig. 11b).
The operation is similar to disk turning with the feed di-rection perpendicular to the cylinder axis. The cutting speedcontinues to be constant along the cutting edge, and thanks tothe numerical command it is still constant in spite of the re-duction of the workpiece diameter. The only difference withthe planning configuration is that the uncut chip thicknesst1is transformed in feed ratef (mm/rev). The cutting tools useda
on-d heres con-t ed in
the same way than in Section2. The results of the interfaceparameters obtained by the numerical simulations are givenin Table 4, wherex is the position (from the cutting edge) ofthe maximum temperatureTmax.
Temperature profiles (Fig. 12a) show thatTmax is notreached at the cutting edge but only at a certain distance,which is different according to the cutting conditions. Thecombination of a low cutting speed and a weak feed placesTmaxvery close to the cutting edge. For the cutting conditions,whereVc and f are important,Tmax is then located aroundthe middle of the contact zone. Contrary to the temperature,the pressure is maximal near the cutting edge. It starts at avery elevated value and decreases far from the cutting edge(Fig. 12b). These trends were confirmed by several authors inthe case of the aluminium material[14]; seeFig. 12c. More-over, the pressure value (at the neighbourhood of the positionx) decreases at the same time when the temperature increases.The study of temperature and pressure distributions must leadto better understand the wear mechanisms, which occur dur-ing machining. The profiles can also help us to choose the lo-cation where the surface examinations will be carried out. Forexample, if we choose a zone at the neighbourhood of positionx where the temperature is maximal, there will be a greaterprobability of finding chemically activated phenomena.
3
3ctron
m ical
TD sed in w
T m) T )
11
111
111 2
re the same ones as in planning tests.Wear tests were performed under different cutting c
itions and cutting times. Higher cutting speeds wereelected to reach higher temperature. To calculate theact parameters (temperature and pressure), we proce
able 4etermination of contact parameters for different cutting conditions u
est Vc (m/min) α (◦) f (mm/rev) Cutting time (min) x (m
0 30 0 0.1 140.051 30 0 0.1 28
2 60 15 0.1 70.073 60 15 0.1 14
4 60 15 0.1 21
5 60 0 0.3 7 0.36 180 0 0.1 7 0.17 360 0 0.1 7 0.1
.2. Apparatus for tool surface examination
.2.1. Surface topography analysisTo investigate the surface topography, a scanning ele
icroscope “JEOL JSM-6360 A” was used with chem
ear tests
max (◦C) (simulation) Pav (MPa) (simulation) lc (mm) (simulation
155 300 0.47
180 500 0.25
245 300 0.6265 300 0.25310 200 0.23

1184 G. List et al. / Wear 259 (2005) 1177–1189
Fig. 12. Temperature and pressure distributions along the rake face: (a) numerical results for temperature, (b) numerical results for pressure and (c) experimentalresults from[14], Vc = 35 m/min,α = 0◦.
Fig. 13. SEM images of a polished tool section after a cutting time of 7 min. The cutting conditions are:Vc = 60 m/min,α = 15◦, f= 0.1 mm/rev,w = 4 mm. Thetool was cut in two pieces by wire electro erosion (perpendicularly to the rake face) and polished. (a) Observation of the built-up edge and (b) detail of theasperities.
Ffe
ig. 14. Depth concentrations profiles at a distance of 100�m from the cutti= 0.1 mm/rev,α = 15◦ andw = 4 mm. (a) Concentration gradients of Al, W aments.
ng edge, the cutting conditions are: cutting time = 7 min,Vc = 60 m/min,nd O chemical species and (b) concentration gradients of Al, Cu and Co el-

G. List et al. / Wear 259 (2005) 1177–1189 1185
analysis by energy dispersive X-ray spectroscopy. The SEMoffers a great magnification, a good depth of field and a goodresolution but does not allow the absolute dimensions mea-surement in the vertical direction. We also used the opticalprofiler “Veeco Wyko NT 1100” to analyze the worn tool sur-faces. White light interferometry is an optical and non-contacttechnique, which permits measuring relief and surface rough-ness with a great accuracy (Ra: �m–nm). White light passesthrough a beam splitter, which directs the light to the surfacesample and to a reference mirror. When these two surfaces re-flect the light, a pattern of interference is formed (“fringes”).The analyzed surfaces are vertically scanned (from the topdownwards) such that all points pass through the focal po-sition. A calculator determines the height starting from theposition of the sample and the position of the fringes. Verticalheights from a few nanometers up to several millimeters canbe measured with an acquisition rate from a few seconds to afew minutes. Analyzed zones extend from 70�m2 (magnifi-cation,G= 75) to 2 mm2 (G= 2.5). It is important to note thatthe vertical resolution is independent of the selected magni-fication. White light interferometry is very interesting for theobservation of worn tool surfaces because it allows to identifyand characterize wear manifestations such as craters havinglow depth[24] or material deposit with several hundreds ofmicrons height.
3ined
q -rays lume
of 1�m3. Before any observation or analysis, tools arepreliminary degreased with ultra pure acetone. Moreover,the Auger electron spectroscopy data were acquired on a VGMICROLAB VG 310-F with a vertical resolution of 10 nm.Elementary chemical and semi-quantitative analysis of a sur-face can be done with an excellent spatial resolution (circularbeam of 50 nm in diameter). Thanks to an ionic sputtering(with Ar+ ions beam and a minimum sputtering rate of 2A/s)depth concentration profiles can be obtained from the samplesurface (with stuck aluminium) to the inside of sample.
4. Identification of tool wear mechanisms at lowcutting conditions (tests 10–14)
When soft materials such as aluminum are machined, theworkpiece material bonds to the cutting tool. The most spec-tacular shape of the sticking material is the built-up edge. Theformation of this one appears like the main damage mecha-nism under low cutting conditions (see tests 10–14 inTable 4).These conditions are characterized by the combination of thelowest temperatures (155–180◦C) and the highest pressures(300–500 MPa) at the tool–chip interface.
Fig. 13a shows SEM section view of a built-up edgeformed on the tool rake face after a cutting time of 7 min.It shows clearly that the BUE creates new tool geometry witht ighc e as-p WCg at
F lowing( ce obt
F of thef
.2.2. Chemical analysisThe chemical composition of the sample was determ
uantitatively at the worn surface using dispersive Xpectroscopy. The punctual analyzed zone is a vo
ig. 15. Observation of the built-up edge which formed under the fola) SEM photography of the rake face and (b) 3D profile of the rake fa
ig. 16. Two-dimensional profiles of the built-up edge in the middle◦
= 0.1 mm/rev and cutting time = 14 min and (b)Vc = 60 m/min,α = 15 , f= 0.1 mmhe inferior part in the prolongation of the flank face. The hontact pressure leads to adhesion by interlocking of therities. For the tool surface, asperities come from therains as shown inFig. 13b. After the cutting, the pressure
condition conditions:Vc = 60 m/min,α = 15◦, t1 = 0.1 mm, cutting time = 7 min.ained by white light interferometry.
rake face (according the A–B line fromFig. 15b. (a)Vc = 30 m/min,α = 0◦,
/rev and cutting time = 14 min.
1186 G. List et al. / Wear 259 (2005) 1177–1189
Table 5Measurement by optical interferometer of maximal heighth of aluminiumdeposit (BUE) on the rake face, for all conditionsf= 0.1 mm/rev
Test Vc (m/min) α (◦) Cutting time (min) h (�m)
10 30 0 14 65011 30 0 28 55012 60 15 7 25013 60 15 14 38014 60 15 21 330
the rake face is relaxed and the BUE can be easily removedfrom the tool.
Thus, the adhesion of the BUE seems to be principallyachieved in mechanical way. But to complete the knowledgeof the adhesion mechanism, Auger depth profiles were car-ried out at a distance of 100�m behind the cutting edge.Before analysis, the BUE was removed with pliers and onlythe aluminium present at the bottom of the asperities remains.The depth–concentration profiles obtained inFig. 14a and bdo not put in evidence an intermixing zone but only an inter-face zone (about 300 nm) due to the depth resolution of themicroprobe. No diffusion of chemical elements from the Almachined to the WC–Co tool or vice versa is observed. Thiscan be explained by the non-sufficient temperature, which ac-tivates the diffusion process. However, we cannot exclude thatunder the pressure action, AlxCoy intermetallic compoundscan be formed and can favorite micro welding between thetool and the BUE surface. Moreover, the profile indicatesthe presence of oxygen atoms, so both the BUE and the toolcan have an oxidized surface. Metal–oxide or oxide–oxidebonding is also possible[25,26].
Three-dimensional views of the rake faces were obtainedby optical profilometer, seeFig. 15, and geometries ofthe built-up edge were characterized from the 2D profile(Fig. 16). For the inserts with a rake angle equal to 0◦, theBUE adds to the rake angle approximately 30◦. In a similarw sab
ora shr tting
Table 6Chemical composition of 2024 aluminium alloy (supplier data) and built-upedge (wt.%)
Element 2024 aluminium alloy Built-up edge
Al Balanced 91.5Cu 3.8–4.9 4.5Mg 1.2–1.8 1Mn 0.3–0.9 0.6Fe <0.5 0.2Si <0.5 0.5O – 0.2W – 1.5Co – 0
time. Indeed, the build-up edge is very unstable, and it isperiodically washed away by the cutting action[27].
The chemical analysis show that the built-up edgecomposition is similar to that of the 2024 aluminium alloy(workpiece material) (seeTable 6). Nevertheless, tungstenwas detected (about 1.5 wt.%) at the external surface of theBUE. Tungsten may come from the tool (rake and/or flankface) by abrasion mechanism. Moreover, the concentrationof Mg elements is less important in the built-up edge than inthe alloy. Mg may oxide during machining and forms withoxygen MgO.
5. Identification of tool wear mechanisms at severecutting conditions (tests 15–17)
In machining, the increase in temperature is due to thematerial removal. Another important source of temperatureoperates; this additional heat source is the dissipated fric-tional energy. At severe enough cutting conditions (high cut-ting speeds and/or large feed rates), the combination of thematerial removal (shear energy) and the friction energy leadsto the maximum temperature on the tool rake face. This ex-plains the change of the tool–wear mode when changing fromlow to severe cutting conditions.
5
ntedc ear
F g condi d(
ay for the inserts with the rake angle of 15◦, the BUE addpproximately 15◦ to the rake face (Fig. 16b). Ultimately, inoth cases the tool cuts with a rake angle of 30◦.
The maximum heighth of BUE were also measured fll conditions, seeTable 5. But we cannot really establielationship between the maximum height and the cu
ig. 17. SEM image of the uncoated WC–Co tool rake face, the cuttinb) zoom on tool–chip contact zone.
.1. Built-up layer
Thin built-up layers were formed on uncoated cemearbide tools during turning of 2024 aluminium alloy for w
tions are:Vc = 60 m/min,f= 0.3 mm/rev, cutting time = 7 min. (a) Global view an

G. List et al. / Wear 259 (2005) 1177–1189 1187
Table 7Chemical composition (wt.%) of the built-up layers.
Elements Vc = 60 m/min,f= 0.3 mm/rev
Vc = 180 m/min,f= 0.1 mm/rev
Vc = 360 m/min,f= 0.1 mm/rev
Al 48 35 34Cu 24 12 6Mg 4 6 2W 14 27 26Co 7 7 20O 3 13 11Mn 0 0 1
tests 15, 16 and 17 (seeTable 4). They correspond to severecutting conditions range. The preliminary study presented inSection3 shows that the maximum temperatures and the av-erage pressures for these are respectively: (245◦C, 300 MPa),(265◦C, 300 MPa) and (310◦C, 200 MPa). Concerning tests16 and 17, an increase in the maximum temperature (about45◦C) is noted. The only difference between these two testsis the cutting speed (180 and 360 m/min), this means thatvelocity strongly influences the cutting temperature. The in-vestigations put in evidence that the wear mechanisms aresimilar in the three tests cases.Fig. 17a illustrates a SEMimage of the tool rake face after a cutting time of 7 min at60 m/min andf= 0.3 mm/rev. Immediately, behind the cuttingedge a bright contrast area with 600�m of width is found; itcorresponds to the tool–chip contact zone (contact lengthlc).Beyond this zone, a thin layer of the bonded aluminium canbe seen.Fig. 17b shows that the built-up layer covers a largepart of the contact area and a thin grey layer above the WCgrains is observed. For each test, a global chemical analysisusing EDS technique (analyzed area of 20�m2) was carriedout and the results are presented inTable 7.
According to these results, we notice a thin layer ofAl2Cu on the tool surface (grey layer on the bright WCgrains, seeFig. 17b). As said before, under severe cuttingconditions high temperature and pressure are reached. Theprecipitates of AlCu contained in the 2024 aluminium alloya itatesr the
chip and then come into contact with the tool whereas thesoft Al is removed. The formation of the adherent layerconstituted of the Al2Cu precipitates is similar to the oneby inclusionary deposits when machining Ca–S stainlesssteel[28,29]. Indeed, a glass-like adhering layer (gehlenite)was found on the rake face of the WC–TiC–Co tool. Theauthors explain this phenomenon by an extrusion processof the viscous non-metallic inclusions onto the tool surfacesunder the effect of the high pressure and high temperature.The extrusion mechanism of the Al2Cu precipitate which ispresent in the 2024 aluminium alloy is probably very closeto the extrusion mechanism of non-metallic inclusion in theCa–S steel. However, the overall formation mechanism ofthe adhering layer is still not fully understood.
5.2. Diffusion mechanism
Diffusion is a thermal activated process and several au-thors showed that reducing the tool temperature enhancesthe tool resistance to the diffusion wear mechanisms[30–32].Under dry cutting conditions, the contact temperature can bemuch more increased. Diffusion wear mechanism is char-acterized by a smooth worn surface with no plastic defor-mation. To put in evidence the diffusion mechanism in thedry machining case of Al/WC–Co, some tools correspond-i ique.B ffer-e ems,w madeo ariesf llyc grains about5 mayb ) andt
givet re-s le
F e cuttif , Co an d O ele-m
2re deposited at the tool surface. These hard precipemain on the surface of the machined material or
ig. 18. Depth concentrations profiles at a distance of 200�m from th= 0.3 mm/rev,α = 0◦ andw = 4 mm. (a) Concentration gradients of Alents.
ng to tests 15, 16 and 17 were examined by AES technefore analysing the depth–concentration profiles of dint chemical species, it is important to note some problhich can influence the results. The analyzed tools aref WC grains with Co binder phase, the mean grain size v
rom 1 to 5�m, seeFig. 4, and this material is chemicaonsidered as being heterogeneous. So regarding to theize and the boundary dimension, the analysis area (0 nm) remains small. Moreover, the sputtered mattere redeposited in the bottom of the crater (analyzed area
he results may be altered.The tools which were examined for tests 15 and 17
he diffusion profiles of different chemical species shownpectively inFigs. 18 and 19. The concentration–depth profi
ng edge, the cutting conditions are: cutting time = 7 min,Vc = 60 m/min,d Cu chemical species and (b) concentration gradients of Al, W an

1188 G. List et al. / Wear 259 (2005) 1177–1189
Fig. 19. Depth concentrations profiles at a distance of 100�m from the cutting edge, the cutting conditions are: cutting time = 7 min,Vc = 360 m/min,f= 0.1 mm/rev,α = 0◦ andw = 4 mm.
was carried out respectively at a distance of 200 and 100�mbehind the cutting edge (middle of the contact zone with thechip: bright contrast zone), from the Al2Cu layer to the insideof the tool. It is interesting to note the diffusion-dominatednature of the profiles in the two tests. These profiles show adecreasing concentration of workpiece chemical species (Al,Cu) according to the depth.
Fig. 18 (test 15) presents the concentration evolution ofthe elements Al, Cu, W, Co and O. The last one is diffused toa depth of approximately 1400 nm. This high concentrationof oxygen detected in Al implies the oxidation process duringthe cutting operation because of the presence of air. On thesurface, there is a thin layer of Al2Cu (about 400 nm of width).At the tool–chip interface, no reaction occurs between Al andW. However, the atoms of aluminium migrate inside the tooltowards the Co binder phase. The interface zone where Al isdetected with Co has a width of 600 nm. Indeed, the simulatedtemperature and pressure for test 15 are, respectively, 245◦Cand 300 MPa, and under these contact conditions Al formsmore easily compounds with Co, than with W (cementedcarbide WC is very stable). Vovk et al.[33] also studied theinterface of thin layers of Co/Al and concluded that in a firsttime the formation of the phase equilibrium diagram Al9Co2takes place, and then a solid solution AlCo forms inside theCo layer by transport through the grain boundaries (at 450◦Cduring 5 min).
aturea ce area )a t thes oft thet ol.T entsA -f lcp pro-c toole ow-
ever, a migration towards the Co binder phase of Al happens.There is an interface zone in the tool side over 750 nm whereAl is present with the Co element. In fact, Al reacts with Cobinder phase, which is present around the WC grains; it isthe most easy thermodynamic reaction. For all wear tests, nocrater is formed by diffusion mechanism on the tool rake face.The formed adherent layer (Al2Cu) on the tool surface at thecontact zone plays the role of a protective diffusion barrierstopping the diffusion process from Al-chip to WC/Co-tool,and vice versa. Consequently, diffusion is reduced. This hasbeen noticed in the case of test 17 (Vc = 360 m/min), whichcorresponds to the formation of a larger adhesive layer.
6. Conclusion
The proposed study allows a better knowledge of the toolwear mechanisms during machining of aluminium alloy withuncoated cemented carbide.Fig. 20summarizes the relation-ship between wear mechanisms, cutting conditions and tri-bological parameters. The most important wear mechanisms
F ttinga
In the case of test 17, the simulated maximum tempernd average pressure reached at the tool–chip interfabout 310◦C (at a distance of 100�m from the cutting edgend 200 MPa. The Auger depth profile was carried out aame distance (100�m) behind the cutting edge (middlehe contact zone with the chip: bright contrast zone) fromhin layer of Al2Cu on the surface to the inside of the tohe depth–concentration profiles obtained for the eleml, Cu, W, Co and O are presented inFig. 19. On the tool sur
ace, we found a thin and bright layer of Al2Cu, its chemicaomposition is homogeneous over a 3.5�m width. As in therevious case, we also notice at the interface an oxidationess, which occurs during machining. No diffusion of thelements (W and Co) towards the Al layer is observed. H
ig. 20. Schematic view of tool wear mechanisms as a function of cund tribological conditions.

G. List et al. / Wear 259 (2005) 1177–1189 1189
are: built-up edge, adherent layer and diffusion. At low cut-ting conditions, the built-up edges are formed on the tool rakeface and take over the function of the cutting edge. The in-terface temperature is low and the adhesion of BUE is prin-cipally achieved in mechanical way. Continuous sliding ofBUE fragments between tool and chip causes an increasingtool wear. These particles coming off with the chip materialcan be a cause of abrasion on the tool rake face. At low cut-ting speed, as the adhesion mechanism is more mechanicalthan physical, the use of large rake angle and polished toolsurface can be suggested. At severe cutting conditions, tem-perature is higher; mechanisms of tool wear involve chemicalaction and diffusion. On the one hand, aluminium elementsdiffuse into the tool through the Co binder phase. No diffu-sion of tool chemical species towards the chip was detected.On the other hand, a thin built-up layer is formed on thetool surface. It is mainly constituted of the workpiece mate-rial precipitates. When the built-up layer thickness is impor-tant, as observed under the largest cutting speed, the diffusionmechanism change from a dynamic process to a static pro-cess[28,29]. Then, it becomes very interesting to explorethe use of large cutting speeds to machine aluminium alloybecause the adherent layer facilitates the sliding of the chipand represents for the tool a protection against the diffusionwear.
A
rcha heh n-d A-I S)a
R
al innol.
u-4.andys,
lez,UE. J.
car-
Part
Partteel
[8] E.M. Trent, Metal cutting and the tribology of seizure: II. Movementof work material over the tool in metal cutting, Wear 128 (1988)47–64.
[9] E.M. Trent, Metal Cutting, third ed., Butterworth-Heinemann, 1991.[10] E.M. Trent, P.K. Wright, Metal Cutting, fourth ed., Butterworth-
Heinemann, 2000.[11] H.O. Gekonde, S.V. Subramanian, Influence of phase transformation
on tool crater wear, in: Proceedings of the first French and GermanConference on High Speed Machining, University of Metz, 1997,pp. 49–62.
[12] O. Gekonde, S.V. Subramanian, Tribology of tool–chip interface andtool wear mechanisms, Surf. Coat. Technol. 149 (2002) 151–160.
[13] R. Komanduri, Z.B. Hou, A review of the experimental techniquesfor measurement of heat and temperatures generated in some man-ufacturing processes and tribology, Tribol. Int. 34 (2001) 653–682.
[14] L.C. Lee, X.D. Liu, K.Y. Lam, Determination of stress distributionon the tool rake face using a composite tool, Int. J. Mach. ToolsManuf. 35 (1995) 373–382.
[15] S.P.F.C. Jaspers, J.H. Dautzenberg, Material behaviour in metal cut-ting: strains, strain rates and temperatures in chip formation, J. Mater.Process. Technol. 121 (2002) 123–135.
[16] R.K. Kountanya, W.J. Endres, A High magnification experimentalstudy of orthogonal cutting with edge-honed tools, in: ASME In-ternational Mechanical Engineering Congress and Exposition, NewYork, NY, 2001, pp. 1–8.
[17] L.N. Payton, J.T. Black, Orthogonal machining of copper with ahardness gradient, Trans. N. Am. Manuf. Res. Inst. XXIX (2001)243–250.
[18] T.D. Marusich, M. Ortiz, Modeling and simulation of high speedmachining, Int. J. Numer. Meth. Eng. 38 (1995) 3675–3694.
[19] T. Ozel, Modeling of hard part machining: effect of insert edge141
[ ing, Int.
[ onal
[ rob-
[ toing,
[ ure-
[ ng.
[ hip
[ uilt-Tool
[ tionteel,
[ yers
[ nn.
[ ools555.
[ d un-8–82.
[ obe03)
cknowledgements
Authors wish to thank the French Ministry of reseand the “Region Aquitaine” for their financial assistance. Telp provided by Michel LAHAYE from the Institute of Coensed Matter Chemistry of Bordeaux (CNRS-CECAM
CMCB) in performing Auger electron spectroscopy (AEnalysis is gratefully acknowledged.
eferences
[1] D.U. Braga, A.E. Diniz, G.W.A. Miranda, N.L. Coppini, Usingminimum quantity of lubricant (MQL) and a diamond coated toothe drilling of aluminum-silicon alloys, J. Mater. Process. Tech122 (2002) 127–138.
[2] J.F. Kelly, M.G. Cotterell, Minimal lubrication machining of alminium alloys, J. Mater. Process. Technol. 120 (2002) 327–33
[3] M. Nouari, G. List, F. Girot, D. Coupard, Experimental analysisoptimisation of tool wear in dry machining of aluminium alloWear 255 (2003) 1359–1368.
[4] M.S. Carrilero, J.M.S. Sola, J.M. Sanchez, M. Alvarez, A. GonzaJ.M. Marcos, A SEM and EDS insight into the BUL and Bdifferences in the turning process of AA2024 Al–Cu Alloy, IntMach. Tools Manuf. 42 (2002) 215–220.
[5] E.M. Trent, M. Met, Some factors affecting wear on cementedbide tools, Inst. Mech. Eng. 1 (1952) 64–75.
[6] E.M. Trent, Cutting steel and iron with cemented carbide tools.I: An analysis of tool wear, J. Iron Steel Inst. (1963) 847–855.
[7] E.M. Trent, Cutting steel and iron with cemented carbide tools.II: Conditions of seizure at the tool–work interface, J. Iron SInst. (1963) 923–932.
preparation in CBN cutting tools, J. Mater. Process. Technol.(2003) 284–293.
20] H. Bil, S.E. Kilic, A.E. Tekkaya, A comparison of orthogonal cuttdata from experiments with three different finite element modelsJ. Mach. Tools Manuf. 44 (2004) 933–944.
21] E. Merchant, Mechanics of the metal cutting process: orthogcutting, J. Appl. Phys. (1945) 318–324.
22] E.H. Lee, B.W. Shaffer, The theory of plasticity applied to the plem of machining, J. Appl. Phys. 18 (1951) 405–413.
23] P.L.B. Oxley, Mechanics of Machining: An Analytical ApproachAssessing Machinability, Ellis Horwood in Mechanical EngineerChichester, UK, 1989.
24] A. Devillez, S. Lesko, W. Mozer, Cutting tool crater wear measment with white light interferometry, Wear 256 (2004) 56–65.
25] N. Basu, V.K. Sarin, Oxidation behavior of WC–Co, Mater. Sci. EA 209 (1996) 206–212.
26] S. Raman, A. Longstreet, D. Guha, A fractal view of tool–cinterfacial friction in machining, Wear 253 (2002) 1111–1120.
27] K. Hoshi, T. Hoshi, On the metal-cutting mechanism with the bup edge, in: Proceedings of the nineth International MachineDesign Research Conference, 1968, pp. 1099–1111.
28] X.D. Fang, D. Zhang, An investigation of adhering layer formaduring tool wear progression in turning of free-cutting stainless sWear 197 (1996) 169–178.
29] H.S. Qi, B. Mills, On the formation mechanism of adherent laon cutting tool, Wear 198 (1996) 192–196.
30] A. Battacharyya, A. Ghosh, Diffusion wear of cutting tools, AC.I.R.P. XVI (1968) 369–375.
31] Y. Naherheim, E.M. Trent, Diffusion wear of cemented carbide twhen cutting steel at high speeds, Metal Technol. (1977) 548–
32] P.A. Dearnley, Rake and flank wear mechanisms of coated ancoated cemented carbides, J. Eng. Mater. Technol. 107 (1985) 6
33] V. Vovk, G. Schmitz, R. Kirchheim, Three-dimensional atom prinvestigation of Co/Al thin film reaction, Microelectr. Eng. 70 (20533–538.