
Microstructure modifications induced by a laser surface treatment in an AA7449 aluminium alloy
12
Materials Science and Engineering A 528 (2011) 2736–2747 Contents lists available at ScienceDirect Materials Science and Engineering A journal homepage: www.elsevier.com/locate/msea Microstructure modifications induced by a laser surface treatment in an AA7449 aluminium alloy G. Fribourg a , A. Deschamps a,∗ , Y. Bréchet a , G. Mylonas b , G. Labeas b , U. Heckenberger c , M. Perez d a SIMAP, INPGrenoble-CNRS-UJF, BP 75, 38402 St Martin d’Hères Cedex, France b Laboratory of Technology and Strength of Materials (LTSM), Department of Mechanical Engineering and Aeronautics, University of Patras, Panepistimioupolis, Rion, 26500 Patras, Greece c EADS Deutschland GmbH, EADS Innovation Works, IW-MS, 81663 Munich, Germany d Université de Lyon, INSA Lyon, MATEIS, UMR CNRS 5510, 7, avenue Jean-Capelle, 69621 Villeurbanne Cedex, France article info Article history: Received 22 October 2010 Received in revised form 6 December 2010 Accepted 6 December 2010 Available online 10 December 2010 Keywords: Laser surface treatment Al–Zn–Mg–Cu Precipitation Modelling abstract This work investigates the modification of the precipitate microstructure induced by laser surface treat- ments in an AA7449 aluminium alloy in T7651 temper. Microhardness maps in the cross-section below the laser lines, as well as maps of the precipitate size and volume fraction obtained by Small-Angle X-ray Scattering, show that a significant precipitate dissolution and coarsening has been induced by the laser treatment. Integrated modelling is carried out to quantify this effect, including a thermal finite element model, a size class precipitation model and a precipitation hardening model. The precipitation model is calibrated using separate reversion experiments, and then coupled to the thermal and mechanical models, allowing a quantitative description of the modification of the microstructure. © 2010 Elsevier B.V. All rights reserved. 1. Introduction Laser surface treatments for aluminium alloys have experienced extensive development in the past 10 years, aiming at modifying the shape and properties of aluminium components, particularly in the aerospace industry. Three types of laser treatments have emerged as practically viable. The first is Laser Shock Peening (LSP), sometimes simply called Laser Peening [1–8]. It consists of sending very short athermal laser pulses (a few tens of ns) that induce a shock wave in the material and result in significant com- pressive surface internal stresses, which may notably improve the fatigue resistance of the alloys. The second is Laser Surface Melt- ing, which aims at melting a small depth of the alloy (typically 10–300 m) in order to obtain a solute-rich microstructure and improve the stress corrosion cracking performance of the material [9,10]. A third technique, which has received less attention, is Laser Beam Forming, which uses the laser operation as a tool for mod- ifying the component shape, by the plastic flow that follows the non-uniform thermal dilatation of the material [11–15]. Such treat- ments, where the material stays in the solid state, provide an attractive solution for correcting the distortion of aerospace com- ∗ Corresponding author. E-mail address: [email protected] (A. Deschamps). ponents, which is often found in thin walls after machining of thick plates, due to the presence of quench induced internal stresses [16]. Laser Beam Forming (LBF) is a complex process, where the shape modification of the alloy is the result of highly inhomogeneous, non-isothermal temperature paths, and depends in detail on the thermo-mechanical response of the material in a wide range of temperatures and strain rates. The temperature field induced by such laser treatments has been modelled by Hu and co-workers [13] and Ji and Wu [11]. More recently, Labeas [15] has included the mechanical response of the material to reach a thermo-mechanical description of the process. However there is little evaluation in the literature of the effect that this laser treatment may have on the alloy’s fine scale microstructure, and on the related in-use prop- erties. Chan and Liang [12] and Geiger and co-workers [14] have reviewed the influence of LBF on microstructure in aluminium alloys of the 6000 series (AA6013 and AA6082). They indicate changes in dislocation density, grain structure, and precipitate structure. No study is available on the microstructure modifications in 7000 series aluminium alloys, although they are direct potential candidates for part distortion correction in aerospace components. High strength 7000 series aluminium alloys gain their mechan- ical properties essentially by precipitation hardening [17]. It is known that the precipitates present in peak strength tempers of these alloys are very sensitive to a sudden heat input, which can be for instance met in MIG welding [18], friction stir welding [19] or electron beam welding [20]. Due to the sudden increase of tempera- 0921-5093/$ – see front matter © 2010 Elsevier B.V. All rights reserved. doi:10.1016/j.msea.2010.12.018
-
Upload
grenoble-inp -
Category
Documents
-
view
1 -
download
0
Transcript of Microstructure modifications induced by a laser surface treatment in an AA7449 aluminium alloy

Ma
Ga
b
Pc
d
a
ARRAA
KLAPM
1
etie(sipfi1i[
Binma
0d
Materials Science and Engineering A 528 (2011) 2736–2747
Contents lists available at ScienceDirect
Materials Science and Engineering A
journa l homepage: www.e lsev ier .com/ locate /msea
icrostructure modifications induced by a laser surface treatment in an AA7449luminium alloy
. Fribourga, A. Deschampsa,∗, Y. Brécheta, G. Mylonasb, G. Labeasb, U. Heckenbergerc, M. Perezd
SIMAP, INPGrenoble-CNRS-UJF, BP 75, 38402 St Martin d’Hères Cedex, FranceLaboratory of Technology and Strength of Materials (LTSM), Department of Mechanical Engineering and Aeronautics, University of Patras,anepistimioupolis, Rion, 26500 Patras, GreeceEADS Deutschland GmbH, EADS Innovation Works, IW-MS, 81663 Munich, GermanyUniversité de Lyon, INSA Lyon, MATEIS, UMR CNRS 5510, 7, avenue Jean-Capelle, 69621 Villeurbanne Cedex, France
r t i c l e i n f o
rticle history:eceived 22 October 2010eceived in revised form 6 December 2010
a b s t r a c t
This work investigates the modification of the precipitate microstructure induced by laser surface treat-ments in an AA7449 aluminium alloy in T7651 temper. Microhardness maps in the cross-section belowthe laser lines, as well as maps of the precipitate size and volume fraction obtained by Small-Angle X-ray
ccepted 6 December 2010vailable online 10 December 2010
eywords:aser surface treatmentl–Zn–Mg–Curecipitation
Scattering, show that a significant precipitate dissolution and coarsening has been induced by the lasertreatment. Integrated modelling is carried out to quantify this effect, including a thermal finite elementmodel, a size class precipitation model and a precipitation hardening model. The precipitation modelis calibrated using separate reversion experiments, and then coupled to the thermal and mechanicalmodels, allowing a quantitative description of the modification of the microstructure.
© 2010 Elsevier B.V. All rights reserved.
odelling. Introduction
Laser surface treatments for aluminium alloys have experiencedxtensive development in the past 10 years, aiming at modifyinghe shape and properties of aluminium components, particularlyn the aerospace industry. Three types of laser treatments havemerged as practically viable. The first is Laser Shock PeeningLSP), sometimes simply called Laser Peening [1–8]. It consists ofending very short athermal laser pulses (a few tens of ns) thatnduce a shock wave in the material and result in significant com-ressive surface internal stresses, which may notably improve theatigue resistance of the alloys. The second is Laser Surface Melt-ng, which aims at melting a small depth of the alloy (typically0–300 �m) in order to obtain a solute-rich microstructure and
mprove the stress corrosion cracking performance of the material9,10].
A third technique, which has received less attention, is Laseream Forming, which uses the laser operation as a tool for mod-
fying the component shape, by the plastic flow that follows theon-uniform thermal dilatation of the material [11–15]. Such treat-ents, where the material stays in the solid state, provide an
ttractive solution for correcting the distortion of aerospace com-
∗ Corresponding author.E-mail address: [email protected] (A. Deschamps).
921-5093/$ – see front matter © 2010 Elsevier B.V. All rights reserved.oi:10.1016/j.msea.2010.12.018
ponents, which is often found in thin walls after machining of thickplates, due to the presence of quench induced internal stresses [16].
Laser Beam Forming (LBF) is a complex process, where the shapemodification of the alloy is the result of highly inhomogeneous,non-isothermal temperature paths, and depends in detail on thethermo-mechanical response of the material in a wide range oftemperatures and strain rates. The temperature field induced bysuch laser treatments has been modelled by Hu and co-workers[13] and Ji and Wu [11]. More recently, Labeas [15] has included themechanical response of the material to reach a thermo-mechanicaldescription of the process. However there is little evaluation in theliterature of the effect that this laser treatment may have on thealloy’s fine scale microstructure, and on the related in-use prop-erties. Chan and Liang [12] and Geiger and co-workers [14] havereviewed the influence of LBF on microstructure in aluminiumalloys of the 6000 series (AA6013 and AA6082). They indicatechanges in dislocation density, grain structure, and precipitatestructure. No study is available on the microstructure modificationsin 7000 series aluminium alloys, although they are direct potentialcandidates for part distortion correction in aerospace components.
High strength 7000 series aluminium alloys gain their mechan-
ical properties essentially by precipitation hardening [17]. It isknown that the precipitates present in peak strength tempers ofthese alloys are very sensitive to a sudden heat input, which can befor instance met in MIG welding [18], friction stir welding [19] orelectron beam welding [20]. Due to the sudden increase of tempera-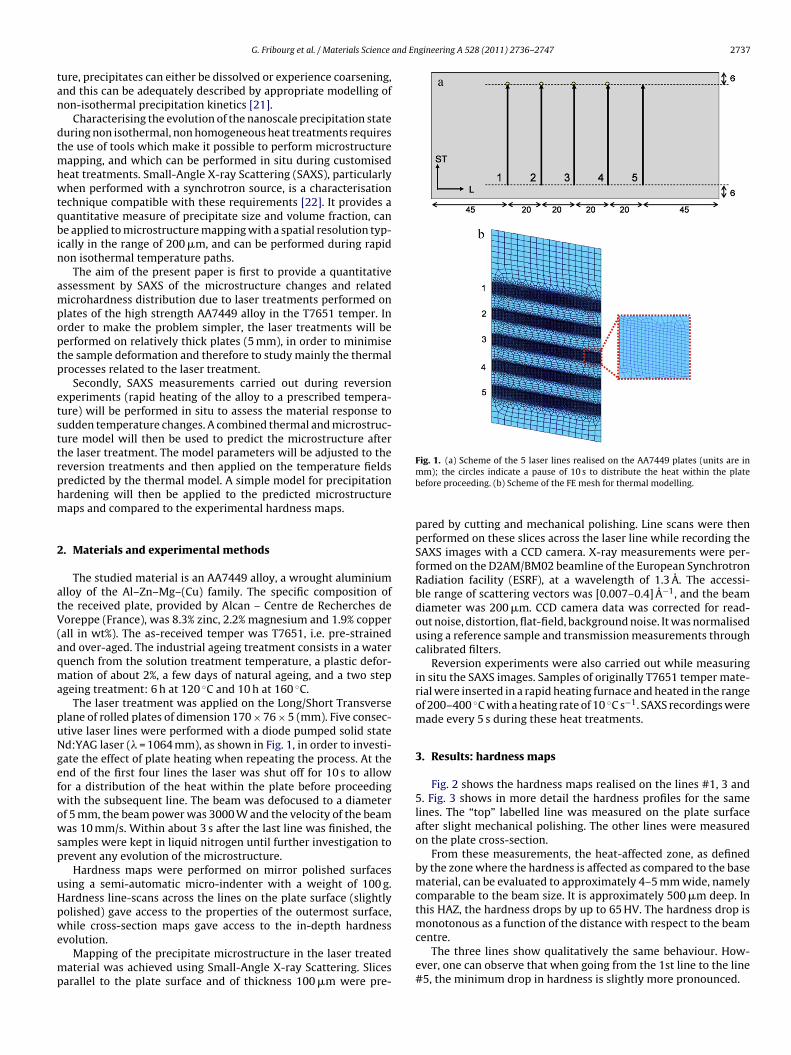
and Engineering A 528 (2011) 2736–2747 2737
tan
dtmhwtqbin
ampoptp
etsttrphm
2
atV(aqma
puNgefwowsp
uHpwe
mp
G. Fribourg et al. / Materials Science
ure, precipitates can either be dissolved or experience coarsening,nd this can be adequately described by appropriate modelling ofon-isothermal precipitation kinetics [21].
Characterising the evolution of the nanoscale precipitation stateuring non isothermal, non homogeneous heat treatments requireshe use of tools which make it possible to perform microstructure
apping, and which can be performed in situ during customisedeat treatments. Small-Angle X-ray Scattering (SAXS), particularlyhen performed with a synchrotron source, is a characterisation
echnique compatible with these requirements [22]. It provides auantitative measure of precipitate size and volume fraction, cane applied to microstructure mapping with a spatial resolution typ-
cally in the range of 200 �m, and can be performed during rapidon isothermal temperature paths.
The aim of the present paper is first to provide a quantitativessessment by SAXS of the microstructure changes and relatedicrohardness distribution due to laser treatments performed on
lates of the high strength AA7449 alloy in the T7651 temper. Inrder to make the problem simpler, the laser treatments will beerformed on relatively thick plates (5 mm), in order to minimisehe sample deformation and therefore to study mainly the thermalrocesses related to the laser treatment.
Secondly, SAXS measurements carried out during reversionxperiments (rapid heating of the alloy to a prescribed tempera-ure) will be performed in situ to assess the material response toudden temperature changes. A combined thermal and microstruc-ure model will then be used to predict the microstructure afterhe laser treatment. The model parameters will be adjusted to theeversion treatments and then applied on the temperature fieldsredicted by the thermal model. A simple model for precipitationardening will then be applied to the predicted microstructureaps and compared to the experimental hardness maps.
. Materials and experimental methods
The studied material is an AA7449 alloy, a wrought aluminiumlloy of the Al–Zn–Mg–(Cu) family. The specific composition ofhe received plate, provided by Alcan – Centre de Recherches deoreppe (France), was 8.3% zinc, 2.2% magnesium and 1.9% copper
all in wt%). The as-received temper was T7651, i.e. pre-strainednd over-aged. The industrial ageing treatment consists in a wateruench from the solution treatment temperature, a plastic defor-ation of about 2%, a few days of natural ageing, and a two step
geing treatment: 6 h at 120 ◦C and 10 h at 160 ◦C.The laser treatment was applied on the Long/Short Transverse
lane of rolled plates of dimension 170 × 76 × 5 (mm). Five consec-tive laser lines were performed with a diode pumped solid stated:YAG laser (� = 1064 mm), as shown in Fig. 1, in order to investi-ate the effect of plate heating when repeating the process. At thend of the first four lines the laser was shut off for 10 s to allowor a distribution of the heat within the plate before proceedingith the subsequent line. The beam was defocused to a diameter
f 5 mm, the beam power was 3000 W and the velocity of the beamas 10 mm/s. Within about 3 s after the last line was finished, the
amples were kept in liquid nitrogen until further investigation torevent any evolution of the microstructure.
Hardness maps were performed on mirror polished surfacessing a semi-automatic micro-indenter with a weight of 100 g.ardness line-scans across the lines on the plate surface (slightlyolished) gave access to the properties of the outermost surface,
hile cross-section maps gave access to the in-depth hardnessvolution.Mapping of the precipitate microstructure in the laser treated
aterial was achieved using Small-Angle X-ray Scattering. Slicesarallel to the plate surface and of thickness 100 �m were pre-
Fig. 1. (a) Scheme of the 5 laser lines realised on the AA7449 plates (units are inmm); the circles indicate a pause of 10 s to distribute the heat within the platebefore proceeding. (b) Scheme of the FE mesh for thermal modelling.
pared by cutting and mechanical polishing. Line scans were thenperformed on these slices across the laser line while recording theSAXS images with a CCD camera. X-ray measurements were per-formed on the D2AM/BM02 beamline of the European SynchrotronRadiation facility (ESRF), at a wavelength of 1.3 A. The accessi-ble range of scattering vectors was [0.007–0.4] A−1, and the beamdiameter was 200 �m. CCD camera data was corrected for read-out noise, distortion, flat-field, background noise. It was normalisedusing a reference sample and transmission measurements throughcalibrated filters.
Reversion experiments were also carried out while measuringin situ the SAXS images. Samples of originally T7651 temper mate-rial were inserted in a rapid heating furnace and heated in the rangeof 200–400 ◦C with a heating rate of 10 ◦C s−1. SAXS recordings weremade every 5 s during these heat treatments.
3. Results: hardness maps
Fig. 2 shows the hardness maps realised on the lines #1, 3 and5. Fig. 3 shows in more detail the hardness profiles for the samelines. The “top” labelled line was measured on the plate surfaceafter slight mechanical polishing. The other lines were measuredon the plate cross-section.
From these measurements, the heat-affected zone, as definedby the zone where the hardness is affected as compared to the basematerial, can be evaluated to approximately 4–5 mm wide, namelycomparable to the beam size. It is approximately 500 �m deep. Inthis HAZ, the hardness drops by up to 65 HV. The hardness drop ismonotonous as a function of the distance with respect to the beam
centre.The three lines show qualitatively the same behaviour. How-ever, one can observe that when going from the 1st line to the line#5, the minimum drop in hardness is slightly more pronounced.

2738 G. Fribourg et al. / Materials Science and Engineering A 528 (2011) 2736–2747
Fig. 2. Microhardness maps of the cross sections below the surface of lines 1 (top), 3 (middle) and 5 (bottom). Note that the longitudinal and vertical scales are different.
Fig. 3. Hardness profiles realised at different depths below the sample surface for the lines #1, 3 and 5.
G. Fribourg et al. / Materials Science and Engineering A 528 (2011) 2736–2747 2739
F laser lv er mav
4
ccmaAuiobcldttinsbp
mcsoz
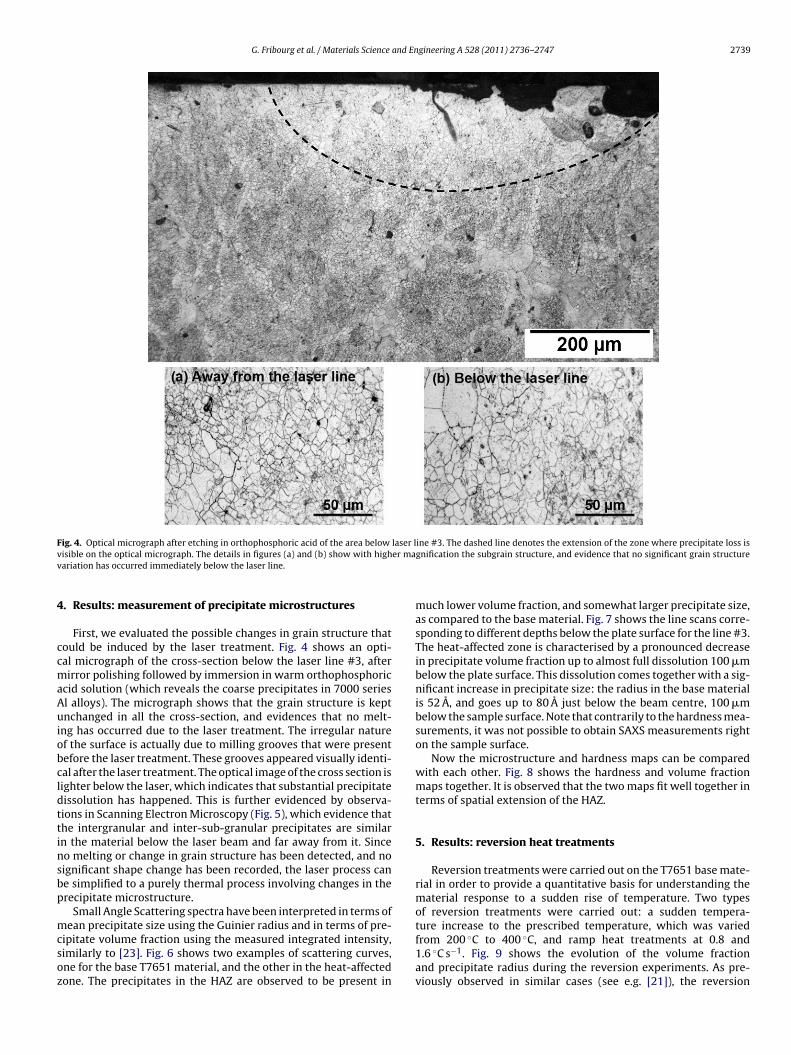
ig. 4. Optical micrograph after etching in orthophosphoric acid of the area belowisible on the optical micrograph. The details in figures (a) and (b) show with highariation has occurred immediately below the laser line.
. Results: measurement of precipitate microstructures
First, we evaluated the possible changes in grain structure thatould be induced by the laser treatment. Fig. 4 shows an opti-al micrograph of the cross-section below the laser line #3, afterirror polishing followed by immersion in warm orthophosphoric
cid solution (which reveals the coarse precipitates in 7000 seriesl alloys). The micrograph shows that the grain structure is keptnchanged in all the cross-section, and evidences that no melt-
ng has occurred due to the laser treatment. The irregular naturef the surface is actually due to milling grooves that were presentefore the laser treatment. These grooves appeared visually identi-al after the laser treatment. The optical image of the cross section isighter below the laser, which indicates that substantial precipitateissolution has happened. This is further evidenced by observa-ions in Scanning Electron Microscopy (Fig. 5), which evidence thathe intergranular and inter-sub-granular precipitates are similarn the material below the laser beam and far away from it. Sinceo melting or change in grain structure has been detected, and noignificant shape change has been recorded, the laser process cane simplified to a purely thermal process involving changes in therecipitate microstructure.
Small Angle Scattering spectra have been interpreted in terms of
ean precipitate size using the Guinier radius and in terms of pre-ipitate volume fraction using the measured integrated intensity,imilarly to [23]. Fig. 6 shows two examples of scattering curves,ne for the base T7651 material, and the other in the heat-affectedone. The precipitates in the HAZ are observed to be present in
ine #3. The dashed line denotes the extension of the zone where precipitate loss isgnification the subgrain structure, and evidence that no significant grain structure
much lower volume fraction, and somewhat larger precipitate size,as compared to the base material. Fig. 7 shows the line scans corre-sponding to different depths below the plate surface for the line #3.The heat-affected zone is characterised by a pronounced decreasein precipitate volume fraction up to almost full dissolution 100 �mbelow the plate surface. This dissolution comes together with a sig-nificant increase in precipitate size: the radius in the base materialis 52 A, and goes up to 80 A just below the beam centre, 100 �mbelow the sample surface. Note that contrarily to the hardness mea-surements, it was not possible to obtain SAXS measurements righton the sample surface.
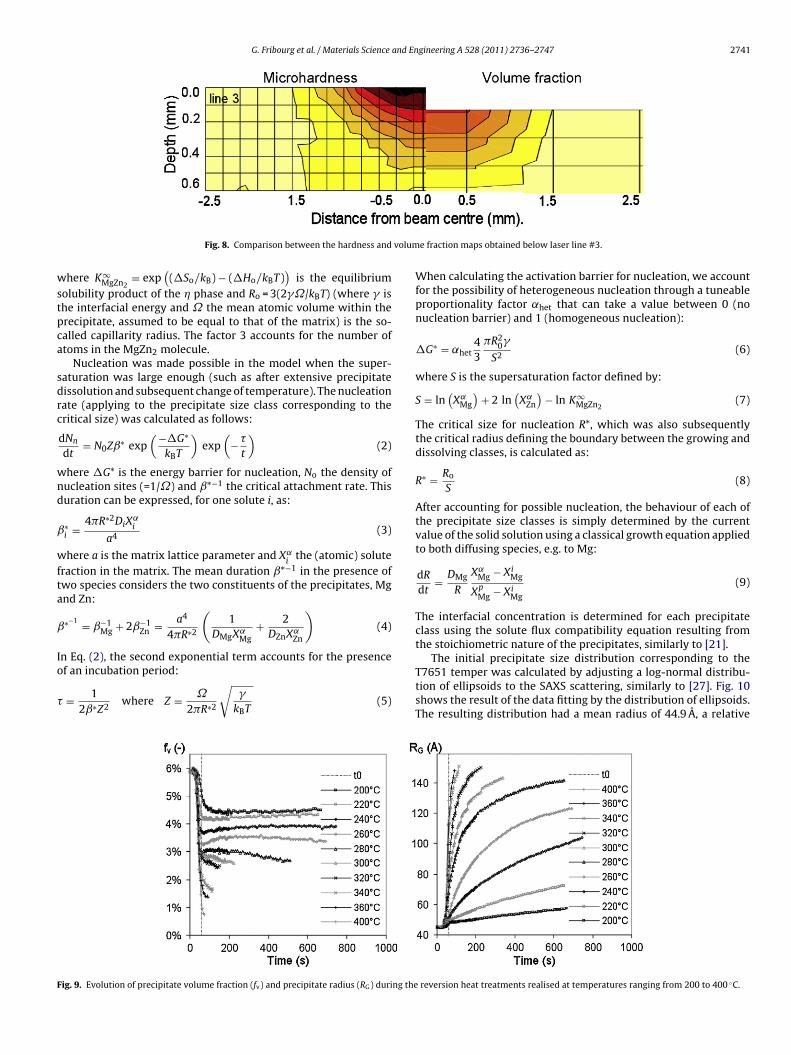
Now the microstructure and hardness maps can be comparedwith each other. Fig. 8 shows the hardness and volume fractionmaps together. It is observed that the two maps fit well together interms of spatial extension of the HAZ.
5. Results: reversion heat treatments
Reversion treatments were carried out on the T7651 base mate-rial in order to provide a quantitative basis for understanding thematerial response to a sudden rise of temperature. Two typesof reversion treatments were carried out: a sudden tempera-
ture increase to the prescribed temperature, which was variedfrom 200 ◦C to 400 ◦C, and ramp heat treatments at 0.8 and1.6 ◦C s−1. Fig. 9 shows the evolution of the volume fractionand precipitate radius during the reversion experiments. As pre-viously observed in similar cases (see e.g. [21]), the reversion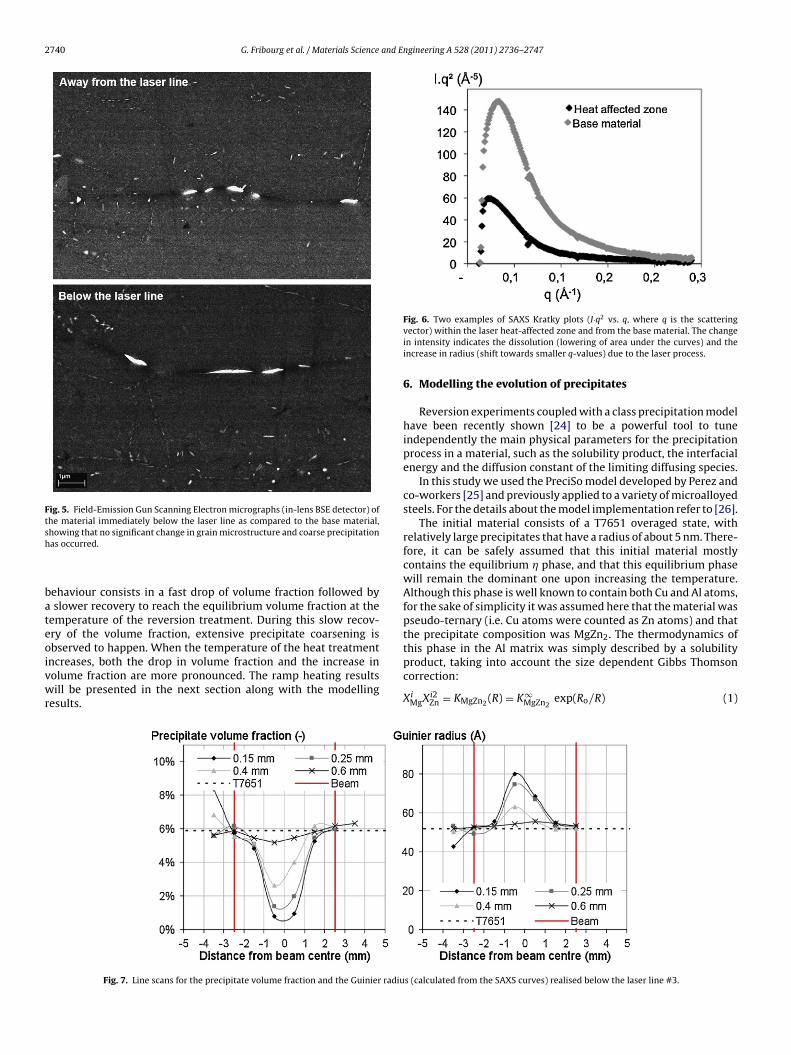
2740 G. Fribourg et al. / Materials Science and Engineering A 528 (2011) 2736–2747
Fig. 5. Field-Emission Gun Scanning Electron micrographs (in-lens BSE detector) ofthe material immediately below the laser line as compared to the base material,sh
bateoivwr
this phase in the Al matrix was simply described by a solubilityproduct, taking into account the size dependent Gibbs Thomson
howing that no significant change in grain microstructure and coarse precipitationas occurred.
ehaviour consists in a fast drop of volume fraction followed byslower recovery to reach the equilibrium volume fraction at the
emperature of the reversion treatment. During this slow recov-ry of the volume fraction, extensive precipitate coarsening isbserved to happen. When the temperature of the heat treatmentncreases, both the drop in volume fraction and the increase in
olume fraction are more pronounced. The ramp heating resultsill be presented in the next section along with the modellingesults.
Fig. 7. Line scans for the precipitate volume fraction and the Guinier radiu
Fig. 6. Two examples of SAXS Kratky plots (I·q2 vs. q, where q is the scatteringvector) within the laser heat-affected zone and from the base material. The changein intensity indicates the dissolution (lowering of area under the curves) and theincrease in radius (shift towards smaller q-values) due to the laser process.
6. Modelling the evolution of precipitates
Reversion experiments coupled with a class precipitation modelhave been recently shown [24] to be a powerful tool to tuneindependently the main physical parameters for the precipitationprocess in a material, such as the solubility product, the interfacialenergy and the diffusion constant of the limiting diffusing species.
In this study we used the PreciSo model developed by Perez andco-workers [25] and previously applied to a variety of microalloyedsteels. For the details about the model implementation refer to [26].
The initial material consists of a T7651 overaged state, withrelatively large precipitates that have a radius of about 5 nm. There-fore, it can be safely assumed that this initial material mostlycontains the equilibrium � phase, and that this equilibrium phasewill remain the dominant one upon increasing the temperature.Although this phase is well known to contain both Cu and Al atoms,for the sake of simplicity it was assumed here that the material waspseudo-ternary (i.e. Cu atoms were counted as Zn atoms) and thatthe precipitate composition was MgZn2. The thermodynamics of
correction:
XiMgXi2
Zn = KMgZn2 (R) = K∞MgZn2
exp(Ro/R) (1)
s (calculated from the SAXS curves) realised below the laser line #3.
G. Fribourg et al. / Materials Science and Engineering A 528 (2011) 2736–2747 2741
volum
wstpca
sdrc
wnd
ˇ
wfta
ˇ
Io
�
F
Fig. 8. Comparison between the hardness and
here K∞MgZn2
= exp(
(�So/kB) − (�Ho/kBT))
is the equilibriumolubility product of the � phase and Ro = 3(2�˝/kBT) (where � ishe interfacial energy and ˝ the mean atomic volume within therecipitate, assumed to be equal to that of the matrix) is the so-alled capillarity radius. The factor 3 accounts for the number oftoms in the MgZn2 molecule.
Nucleation was made possible in the model when the super-aturation was large enough (such as after extensive precipitateissolution and subsequent change of temperature). The nucleationate (applying to the precipitate size class corresponding to theritical size) was calculated as follows:
dNn
dt= N0Zˇ∗ exp
(−�G∗
kBT
)exp
(−�
t
)(2)
here �G* is the energy barrier for nucleation, No the density ofucleation sites (=1/˝) and ˇ*−1 the critical attachment rate. Thisuration can be expressed, for one solute i, as:
∗i = 4�R∗2DiX
˛i
a4(3)
here a is the matrix lattice parameter and X˛i
the (atomic) soluteraction in the matrix. The mean duration ˇ*−1 in the presence ofwo species considers the two constituents of the precipitates, Mgnd Zn:
∗−1 = ˇ−1Mg + 2ˇ−1
Zn = a4
4�R∗2
(1
DMgX˛Mg
+ 2DZnX˛
Zn
)(4)
n Eq. (2), the second exponential term accounts for the presencef an incubation period:
= 12ˇ∗Z2
where Z = ˝
2�R∗2
√�
kBT(5)
ig. 9. Evolution of precipitate volume fraction (fv) and precipitate radius (RG) during the
e fraction maps obtained below laser line #3.
When calculating the activation barrier for nucleation, we accountfor the possibility of heterogeneous nucleation through a tuneableproportionality factor ˛het that can take a value between 0 (nonucleation barrier) and 1 (homogeneous nucleation):
�G∗ = ˛het43
�R20�
S2(6)
where S is the supersaturation factor defined by:
S = ln(
X˛Mg
)+ 2 ln
(X˛
Zn
)− ln K∞
MgZn2(7)
The critical size for nucleation R*, which was also subsequentlythe critical radius defining the boundary between the growing anddissolving classes, is calculated as:
R∗ = Ro
S(8)
After accounting for possible nucleation, the behaviour of each ofthe precipitate size classes is simply determined by the currentvalue of the solid solution using a classical growth equation appliedto both diffusing species, e.g. to Mg:
dR
dt= DMg
R
X˛Mg − Xi
Mg
XpMg − Xi
Mg
(9)
The interfacial concentration is determined for each precipitateclass using the solute flux compatibility equation resulting fromthe stoichiometric nature of the precipitates, similarly to [21].
The initial precipitate size distribution corresponding to theT7651 temper was calculated by adjusting a log-normal distribu-tion of ellipsoids to the SAXS scattering, similarly to [27]. Fig. 10shows the result of the data fitting by the distribution of ellipsoids.The resulting distribution had a mean radius of 44.9 A, a relative
reversion heat treatments realised at temperatures ranging from 200 to 400 ◦C.
2742 G. Fribourg et al. / Materials Science and Engineering A 528 (2011) 2736–2747
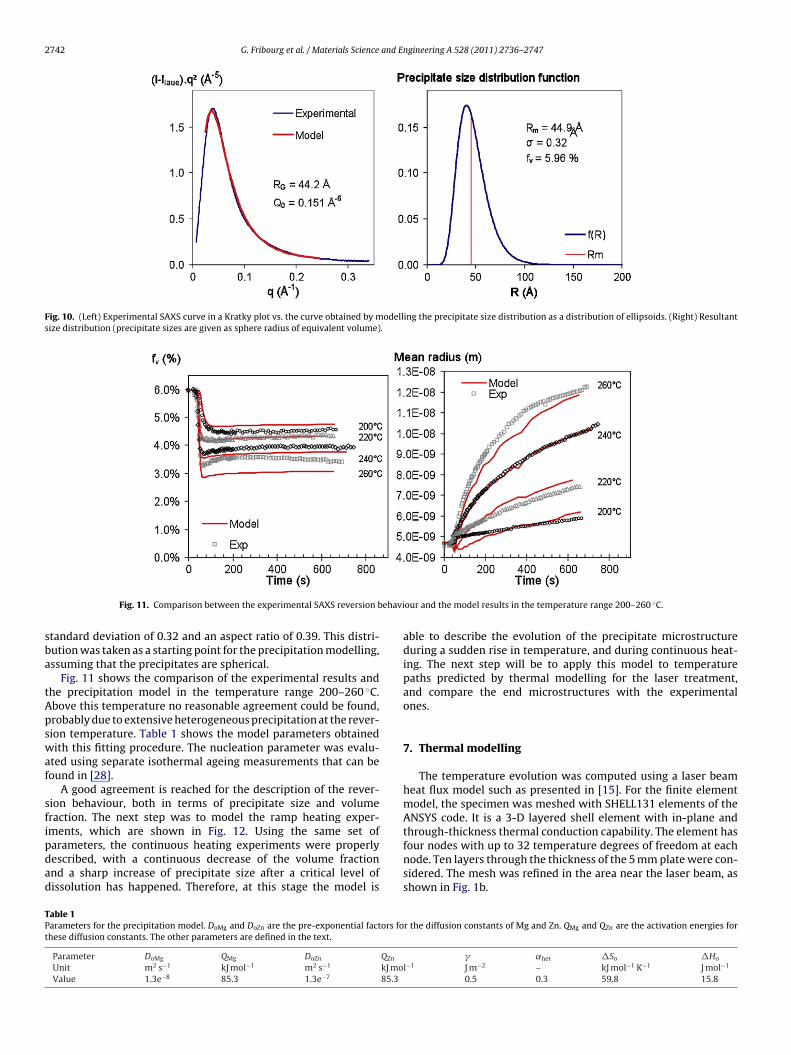
Fig. 10. (Left) Experimental SAXS curve in a Kratky plot vs. the curve obtained by modelling the precipitate size distribution as a distribution of ellipsoids. (Right) Resultantsize distribution (precipitate sizes are given as sphere radius of equivalent volume).
ehavi
sba
tApswaf
sfipdad
TPt
Fig. 11. Comparison between the experimental SAXS reversion b
tandard deviation of 0.32 and an aspect ratio of 0.39. This distri-ution was taken as a starting point for the precipitation modelling,ssuming that the precipitates are spherical.
Fig. 11 shows the comparison of the experimental results andhe precipitation model in the temperature range 200–260 ◦C.bove this temperature no reasonable agreement could be found,robably due to extensive heterogeneous precipitation at the rever-ion temperature. Table 1 shows the model parameters obtainedith this fitting procedure. The nucleation parameter was evalu-
ted using separate isothermal ageing measurements that can beound in [28].
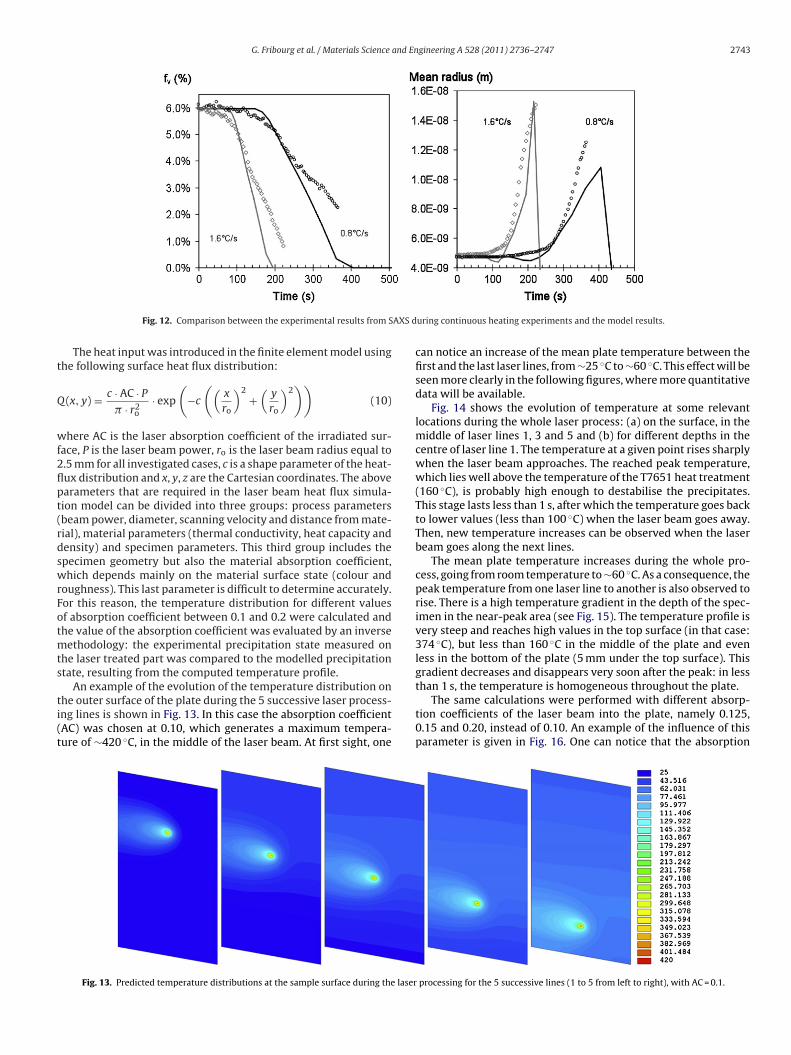
A good agreement is reached for the description of the rever-ion behaviour, both in terms of precipitate size and volumeraction. The next step was to model the ramp heating exper-
ments, which are shown in Fig. 12. Using the same set ofarameters, the continuous heating experiments were properlyescribed, with a continuous decrease of the volume fractionnd a sharp increase of precipitate size after a critical level ofissolution has happened. Therefore, at this stage the model isable 1arameters for the precipitation model. DoMg and DoZn are the pre-exponential factors fohese diffusion constants. The other parameters are defined in the text.
Parameter DoMg QMg DoZn QZn
Unit m2 s−1 kJ mol−1 m2 s−1 kJ moValue 1.3e−8 85.3 1.3e−7 85.3
our and the model results in the temperature range 200–260 ◦C.
able to describe the evolution of the precipitate microstructureduring a sudden rise in temperature, and during continuous heat-ing. The next step will be to apply this model to temperaturepaths predicted by thermal modelling for the laser treatment,and compare the end microstructures with the experimentalones.
7. Thermal modelling
The temperature evolution was computed using a laser beamheat flux model such as presented in [15]. For the finite elementmodel, the specimen was meshed with SHELL131 elements of theANSYS code. It is a 3-D layered shell element with in-plane and
through-thickness thermal conduction capability. The element hasfour nodes with up to 32 temperature degrees of freedom at eachnode. Ten layers through the thickness of the 5 mm plate were con-sidered. The mesh was refined in the area near the laser beam, asshown in Fig. 1b.r the diffusion constants of Mg and Zn. QMg and QZn are the activation energies for
� ˛het �So �Ho
l−1 J m−2 – kJ mol−1 K−1 J mol−1
0.5 0.3 59.8 15.8
G. Fribourg et al. / Materials Science and Engineering A 528 (2011) 2736–2747 2743
AXS d
t
Q
wf2flpt(rdswrFotmts
ti(t
Fig. 12. Comparison between the experimental results from S
The heat input was introduced in the finite element model usinghe following surface heat flux distribution:
(x, y) = c · AC · P
� · r2o
· exp
(−c
((x
ro
)2+
(y
ro
)2))
(10)
here AC is the laser absorption coefficient of the irradiated sur-ace, P is the laser beam power, ro is the laser beam radius equal to.5 mm for all investigated cases, c is a shape parameter of the heat-ux distribution and x, y, z are the Cartesian coordinates. The abovearameters that are required in the laser beam heat flux simula-ion model can be divided into three groups: process parametersbeam power, diameter, scanning velocity and distance from mate-ial), material parameters (thermal conductivity, heat capacity andensity) and specimen parameters. This third group includes thepecimen geometry but also the material absorption coefficient,hich depends mainly on the material surface state (colour and
oughness). This last parameter is difficult to determine accurately.or this reason, the temperature distribution for different valuesf absorption coefficient between 0.1 and 0.2 were calculated andhe value of the absorption coefficient was evaluated by an inverse
ethodology: the experimental precipitation state measured onhe laser treated part was compared to the modelled precipitationtate, resulting from the computed temperature profile.
An example of the evolution of the temperature distribution onhe outer surface of the plate during the 5 successive laser process-ng lines is shown in Fig. 13. In this case the absorption coefficientAC) was chosen at 0.10, which generates a maximum tempera-ure of ∼420 ◦C, in the middle of the laser beam. At first sight, one
Fig. 13. Predicted temperature distributions at the sample surface during the laser
uring continuous heating experiments and the model results.
can notice an increase of the mean plate temperature between thefirst and the last laser lines, from ∼25 ◦C to ∼60 ◦C. This effect will beseen more clearly in the following figures, where more quantitativedata will be available.
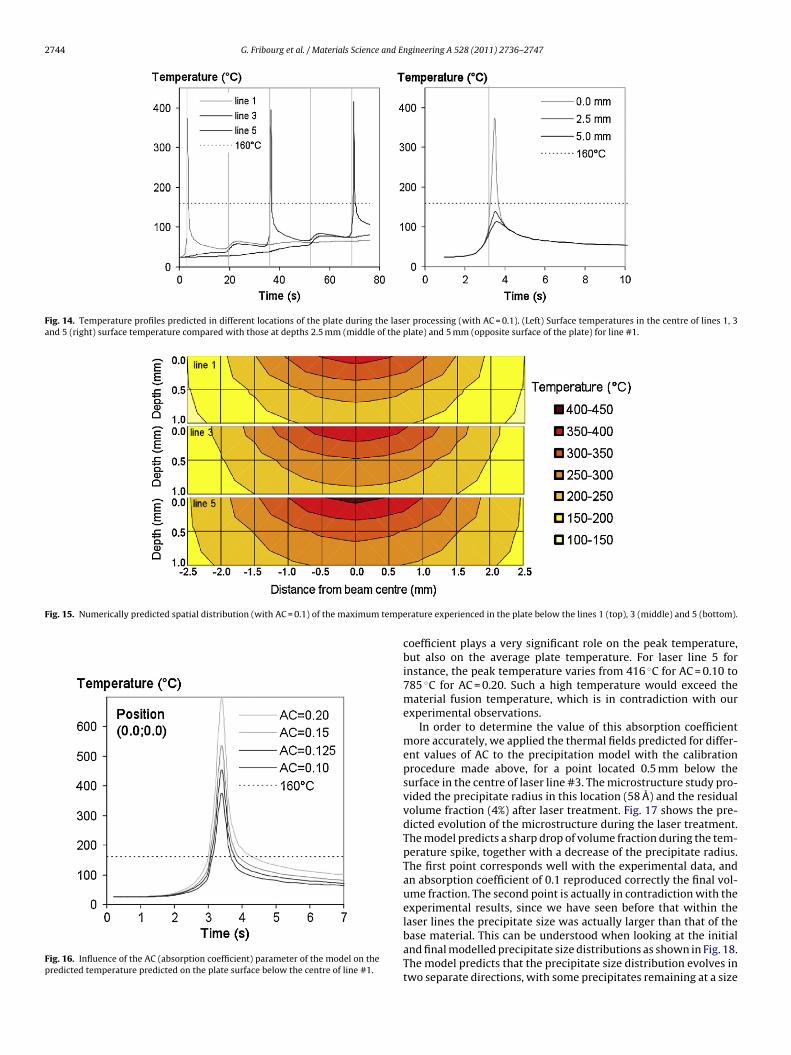
Fig. 14 shows the evolution of temperature at some relevantlocations during the whole laser process: (a) on the surface, in themiddle of laser lines 1, 3 and 5 and (b) for different depths in thecentre of laser line 1. The temperature at a given point rises sharplywhen the laser beam approaches. The reached peak temperature,which lies well above the temperature of the T7651 heat treatment(160 ◦C), is probably high enough to destabilise the precipitates.This stage lasts less than 1 s, after which the temperature goes backto lower values (less than 100 ◦C) when the laser beam goes away.Then, new temperature increases can be observed when the laserbeam goes along the next lines.
The mean plate temperature increases during the whole pro-cess, going from room temperature to ∼60 ◦C. As a consequence, thepeak temperature from one laser line to another is also observed torise. There is a high temperature gradient in the depth of the spec-imen in the near-peak area (see Fig. 15). The temperature profile isvery steep and reaches high values in the top surface (in that case:374 ◦C), but less than 160 ◦C in the middle of the plate and evenless in the bottom of the plate (5 mm under the top surface). Thisgradient decreases and disappears very soon after the peak: in less
than 1 s, the temperature is homogeneous throughout the plate.The same calculations were performed with different absorp-tion coefficients of the laser beam into the plate, namely 0.125,0.15 and 0.20, instead of 0.10. An example of the influence of thisparameter is given in Fig. 16. One can notice that the absorption
processing for the 5 successive lines (1 to 5 from left to right), with AC = 0.1.
2744 G. Fribourg et al. / Materials Science and Engineering A 528 (2011) 2736–2747
Fig. 14. Temperature profiles predicted in different locations of the plate during the laser processing (with AC = 0.1). (Left) Surface temperatures in the centre of lines 1, 3and 5 (right) surface temperature compared with those at depths 2.5 mm (middle of the plate) and 5 mm (opposite surface of the plate) for line #1.
Fig. 15. Numerically predicted spatial distribution (with AC = 0.1) of the maximum tempe
Fig. 16. Influence of the AC (absorption coefficient) parameter of the model on thepredicted temperature predicted on the plate surface below the centre of line #1.
rature experienced in the plate below the lines 1 (top), 3 (middle) and 5 (bottom).
coefficient plays a very significant role on the peak temperature,but also on the average plate temperature. For laser line 5 forinstance, the peak temperature varies from 416 ◦C for AC = 0.10 to785 ◦C for AC = 0.20. Such a high temperature would exceed thematerial fusion temperature, which is in contradiction with ourexperimental observations.
In order to determine the value of this absorption coefficientmore accurately, we applied the thermal fields predicted for differ-ent values of AC to the precipitation model with the calibrationprocedure made above, for a point located 0.5 mm below thesurface in the centre of laser line #3. The microstructure study pro-vided the precipitate radius in this location (58 A) and the residualvolume fraction (4%) after laser treatment. Fig. 17 shows the pre-dicted evolution of the microstructure during the laser treatment.The model predicts a sharp drop of volume fraction during the tem-perature spike, together with a decrease of the precipitate radius.The first point corresponds well with the experimental data, andan absorption coefficient of 0.1 reproduced correctly the final vol-ume fraction. The second point is actually in contradiction with theexperimental results, since we have seen before that within the
laser lines the precipitate size was actually larger than that of thebase material. This can be understood when looking at the initialand final modelled precipitate size distributions as shown in Fig. 18.The model predicts that the precipitate size distribution evolves intwo separate directions, with some precipitates remaining at a size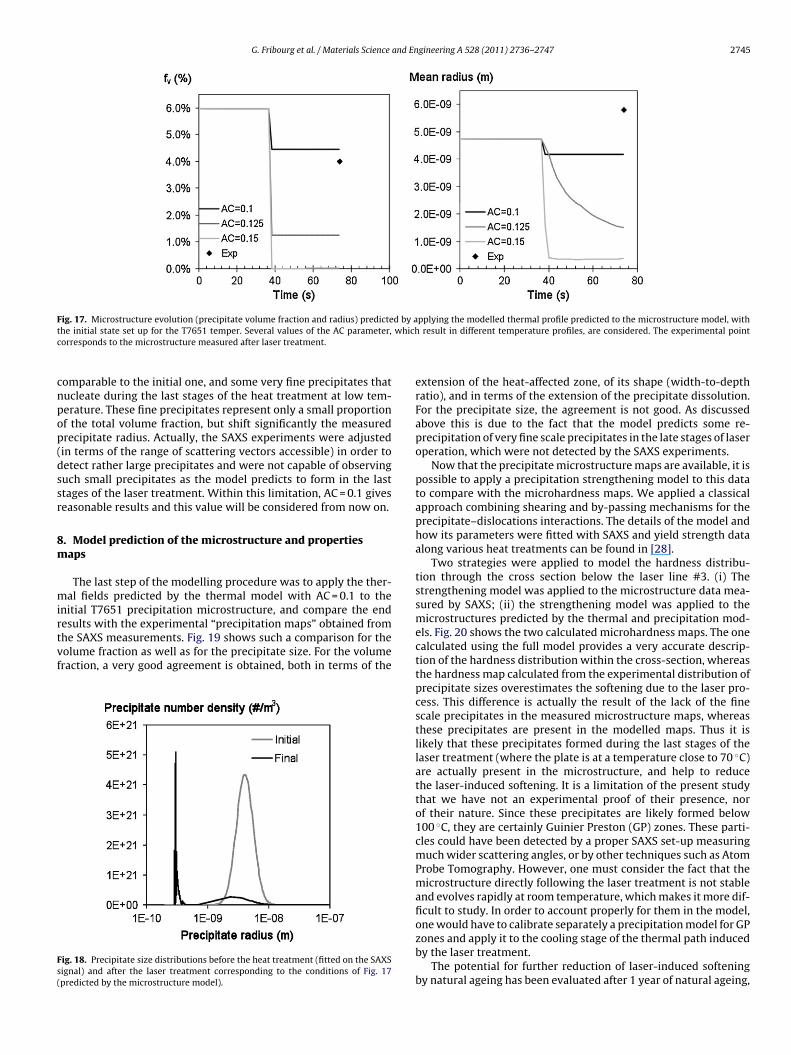
G. Fribourg et al. / Materials Science and Engineering A 528 (2011) 2736–2747 2745
F d by at whichc
cnpop(dssr
8m
mirtvf
Fs(
ig. 17. Microstructure evolution (precipitate volume fraction and radius) predictehe initial state set up for the T7651 temper. Several values of the AC parameter,orresponds to the microstructure measured after laser treatment.
omparable to the initial one, and some very fine precipitates thatucleate during the last stages of the heat treatment at low tem-erature. These fine precipitates represent only a small proportionf the total volume fraction, but shift significantly the measuredrecipitate radius. Actually, the SAXS experiments were adjustedin terms of the range of scattering vectors accessible) in order toetect rather large precipitates and were not capable of observinguch small precipitates as the model predicts to form in the lasttages of the laser treatment. Within this limitation, AC = 0.1 giveseasonable results and this value will be considered from now on.
. Model prediction of the microstructure and propertiesaps
The last step of the modelling procedure was to apply the ther-al fields predicted by the thermal model with AC = 0.1 to the
nitial T7651 precipitation microstructure, and compare the end
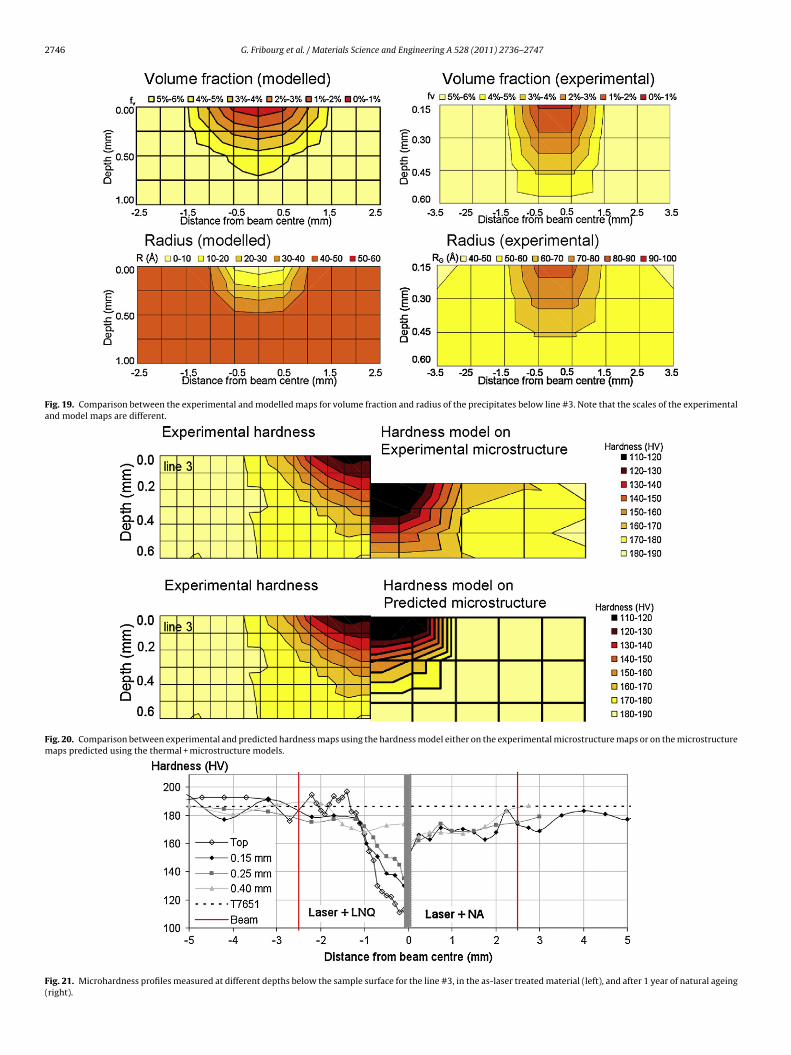
esults with the experimental “precipitation maps” obtained fromhe SAXS measurements. Fig. 19 shows such a comparison for theolume fraction as well as for the precipitate size. For the volumeraction, a very good agreement is obtained, both in terms of theig. 18. Precipitate size distributions before the heat treatment (fitted on the SAXSignal) and after the laser treatment corresponding to the conditions of Fig. 17predicted by the microstructure model).
pplying the modelled thermal profile predicted to the microstructure model, withresult in different temperature profiles, are considered. The experimental point
extension of the heat-affected zone, of its shape (width-to-depthratio), and in terms of the extension of the precipitate dissolution.For the precipitate size, the agreement is not good. As discussedabove this is due to the fact that the model predicts some re-precipitation of very fine scale precipitates in the late stages of laseroperation, which were not detected by the SAXS experiments.
Now that the precipitate microstructure maps are available, it ispossible to apply a precipitation strengthening model to this datato compare with the microhardness maps. We applied a classicalapproach combining shearing and by-passing mechanisms for theprecipitate–dislocations interactions. The details of the model andhow its parameters were fitted with SAXS and yield strength dataalong various heat treatments can be found in [28].
Two strategies were applied to model the hardness distribu-tion through the cross section below the laser line #3. (i) Thestrengthening model was applied to the microstructure data mea-sured by SAXS; (ii) the strengthening model was applied to themicrostructures predicted by the thermal and precipitation mod-els. Fig. 20 shows the two calculated microhardness maps. The onecalculated using the full model provides a very accurate descrip-tion of the hardness distribution within the cross-section, whereasthe hardness map calculated from the experimental distribution ofprecipitate sizes overestimates the softening due to the laser pro-cess. This difference is actually the result of the lack of the finescale precipitates in the measured microstructure maps, whereasthese precipitates are present in the modelled maps. Thus it islikely that these precipitates formed during the last stages of thelaser treatment (where the plate is at a temperature close to 70 ◦C)are actually present in the microstructure, and help to reducethe laser-induced softening. It is a limitation of the present studythat we have not an experimental proof of their presence, norof their nature. Since these precipitates are likely formed below100 ◦C, they are certainly Guinier Preston (GP) zones. These parti-cles could have been detected by a proper SAXS set-up measuringmuch wider scattering angles, or by other techniques such as AtomProbe Tomography. However, one must consider the fact that themicrostructure directly following the laser treatment is not stableand evolves rapidly at room temperature, which makes it more dif-ficult to study. In order to account properly for them in the model,
one would have to calibrate separately a precipitation model for GPzones and apply it to the cooling stage of the thermal path inducedby the laser treatment.The potential for further reduction of laser-induced softeningby natural ageing has been evaluated after 1 year of natural ageing,
2746 G. Fribourg et al. / Materials Science and Engineering A 528 (2011) 2736–2747
Fig. 19. Comparison between the experimental and modelled maps for volume fraction and radius of the precipitates below line #3. Note that the scales of the experimentaland model maps are different.
Fig. 20. Comparison between experimental and predicted hardness maps using the hardness model either on the experimental microstructure maps or on the microstructuremaps predicted using the thermal + microstructure models.
Fig. 21. Microhardness profiles measured at different depths below the sample surface for the line #3, in the as-laser treated material (left), and after 1 year of natural ageing(right).
and En
astliwaon
9
spAaemtm
(
[[[[
[[[
[[[
[
[[[
[[
[
G. Fribourg et al. / Materials Science
s shown in Fig. 21. The hardness at three distances from the plateurface were measured in the naturally aged plate, and comparedo the values measured on samples kept in liquid nitrogen after theaser treatment until the hardness measurements. The natural age-ng actually provides a substantial amount of hardness recovery,
hich is consistent with the discussion on the hardness immedi-tely after the laser treatment. After one year, the maximum levelf observed softening is only of about 30 HV against 80 HV beforeatural ageing.
. Discussion and conclusions
The present study aimed at reaching a comprehensive under-tanding of the effect of a thermal laser treatment on therecipitate microstructure and resulting properties of a T7651A7449 aluminium alloy. By mapping the microstructure andpplying successive models for the temperature fields, their influ-nce on the precipitate microstructure and the link between thisicrostructure and the properties, it has been possible to assess
he extension of the heat-affected zone and to gain insight into theechanisms prevailing during the laser treatment:
(i) The very short temperature spike caused by the laser treatmentinduces mostly precipitate dissolution, however several lowertemperature processes have been shown to be influential to thematerial response. When multiple passes are performed on asingle plate, the average temperature of the plate increasessubstantially, which causes a rise in the peak temperatureexperienced during the last passes (and in turn increases theamount of precipitate dissolution). But it also causes the pre-cipitation of new very fine particles (probably GP zones) in thedissolved zones of the first passes; additional work is neces-sary to assess the exact nature and characteristics (size, volumefraction, hardening potential) of these fine particles.
(ii) The investigated laser treatment results in a very significantprecipitate dissolution in the first 500 �m below the surface,together with a modification of the precipitate size. Althoughthe very small precipitates that form during the late stagesof the laser treatment and during natural ageing compen-sate partly the mechanical loss, this microstructure changeshould not be overlooked when applying such treatments tocorrect part distortions in aerospace components. Its influenceon various properties such as buckling, fracture toughness orcorrosion resistance should be assessed.
iii) The microstructure and properties maps can be reproduced bya fully integrated model including thermal modelling and pre-
cipitation modelling. One limitation of the current integratedmodel is that it does not account properly for the precipita-tion of the fine GP zones upon cooling. Within this limitation,such an integrated model can be a useful tool for processoptimisation.[
[
gineering A 528 (2011) 2736–2747 2747
Acknowledgements
Dr. F. Bley and the staff of BM02-D2AM beamline is thanked fortechnical help with the experiments. This work was carried out inthe COMPACT project which is a collaboration between Airbus UK(Project Co-ordinator), Alcan – Centre de Recherches de Voreppe,Limerick University, University of Bristol, Enabling Process Tech-nologies, University of Hannover, EADS Germany, University ofPatras, Alenia Aeronautica, Ultra RS, Institut Polytechnique deGrenoble and the University of Sheffield. The project was jointlyfunded by the European Union Framework 6 initiative and theproject partners. One of the authors (AD) wishes to acknowledgethe support of the European Research Council for support in theframework of the NEMOLight Marie Curie International OutgoingFellowship within the 7th European Community Framework Pro-gramme. Partial support of “Agence Nationale de la Recherche” onCONTRAPRECI project 06-BLAN-0205 is gratefully acknowledged.
References
[1] J.E. Rankin, M.R. Hill, L.A. Hackel, Mater. Sci. Eng. A349 (2003) 279–291.[2] O. Hatamleh, J. Lyons, R. Forman, Int. J. Fatigue 29 (2007) 421–434.[3] O. Hatamleh, Mater. Sci. Eng. A492 (2008) 168–176.[4] O. Hatamleh, Int. J. Fatigue 31 (2009) 974–988.[5] O. Hatamleh, M. Hill, S. Forth, D. Garcia, Mater. Sci. Eng. A519 (2009) 61–69.[6] O. Hatamleh, P.M. Singh, H. Garmestani, J. Mater. Eng. Perform. 18 (2009)
406–413.[7] A.T. DeWald, M.R. Hill, J. Strain Anal. Eng. 44 (2009) 1–11.[8] C.A. Rodopoulos, A.T. Kermanidis, E. Statnikov, V. Vityazev, O. Korolkov, J. Mater.
Eng. Perform. 16 (2007) 30–34.[9] J. Noordhuis, J.T.M. Dehosson, Acta Metall. Mater. 41 (1993) 1989–1998.10] T.M. Yue, L.J. Yan, C.P. Chan, Appl. Surf. Sci. 252 (2006) 5026–5034.11] Z. Ji, S.C. Wu, J. Mater. Process. Technol. 74 (1998) 89–95.12] K.C. Chan, J. Liang, J. Mater. Process. Technol. 100 (2000) 214–218.13] Z. Hu, M. Labudovic, H. Wang, R. Kovacevic, Int. J. Mach. Tool. Manuf. 41 (2001)
589–607.14] M. Geiger, M. Merklein, M. Pitz, J. Mater. Process. Technol. 151 (2004) 3–11.15] G.N. Labeas, J. Mater. Process. Technol. 207 (2008) 248–257.16] F. Heymes, B. Commet, B. DuBost, P. Lassince, P. Lequeu, G.M. Raynaud, in:
T. Bains, D.S. MacKenzie (Eds.), 1st International Non-Ferrous Processing andTechnology Conference, ASM International, OH, USA, 1997, pp. 249–255.
17] J. Lendvai, Mater. Sci. Forum 217–222 (1996) 43–56.18] M. Nicolas, A. Deschamps, Metall. Mater. Trans. 35A (2004) 1437–1448.19] M. Dumont, A. Steuwer, A. Deschamps, M. Peel, P.J. Withers, Acta Mater. 54
(2006) 4793–4801.20] A. Deschamps, S. Ringeval, G. Texier, L. Delfaut-Durut, Mater. Sci. Eng. A517
(2009) 361–368.21] M. Nicolas, A. Deschamps, Acta Mater. 51 (2003) 6077–6094.22] G. Kostorz, J. Appl. Crystallogr. 24 (1991) 444–456.23] M. Dumont, W. Lefebvre, B. Doisneau Cottignies, A. Deschamps, Acta Mater. 53
(2005) 2881–2892.24] A. Deschamps, M. Perez, C. R. Phys. 11 (2010) 236–244.25] M. Perez, E. Courtois, D. Acevedo, T. Epicier, P. Maugis, Philos. Mag. Lett. 87
(2007) 645–656.26] M. Perez, M. Dumont, D. Acevedoreyes, Acta Mater. 56 (2008) 2119–2132.
27] F. Perrard, A. Deschamps, F. Bley, P. Donnadieu, P. Maugis, J. Appl. Crystallogr.39 (2006) 473–482.28] G. Fribourg, Precipitation and Plasticity Couplings in a 7xxx Aluminium
Alloy: Application to Thermomechanical Treatments for Distortion Correctionof Aerospace Components, PhD Thesis, Institut Polytechnique de Grenoble,France, 2009.