Structural factor in Zn alloy electrodeposit corrosion
12
Ž . Applied Surface Science 153 1999 53–64 www.elsevier.nlrlocaterapsusc Structural factor in Zn alloy electrodeposit corrosion R. Ramanauskas ) Institute of Chemistry, Vilnius 2600, Lithuania Department of Applied Physics, CINVESTAV IPN, 97310 Merida, Mexico Received 15 April 1999; accepted 1 August 1999 Abstract AFM, XRD, XPS analyses were performed to characterize Zn, Zn–Co, Zn–Fe and Zn–Ni electrodeposit topography, texture, lattice imperfections, as well superficial corrosion product film composition and properties. The difference in the coatings’ corrosion resistance manifested when a passivating oxide film formed on the metal surface. Higher values of diffraction line integral breadth for Zn–Co and Zn–Ni alloys were detected, which implied a greater number of lattice imperfections for the samples. Besides, a higher surface activity for oxide film formation for the same surfaces was Ž . observed. It was suggested that the metal structural parameters lattice imperfection and texture were responsible for the oxide films’ properties, which determined the coatings’ corrosion resistance. An amorphous structure and a higher amount of hydrated Zn oxide in the corrosion product film reduced Zn–Co and Zn–Ni corrosion rates when compared to that of Zn and Zn–Fe. q 1999 Elsevier Science B.V. All rights reserved. Keywords: Zn electrodeposits; Structural parameters; Corrosion; Oxide films 1. Introduction The focus of electrochemical surface science is the correlation of electrode surface structure with electrochemical reactivity. However, insufficient at- tention to this problem has been centred in the area of metal corrosion. Metal dissolution is known to occur mainly at surface active sites where atoms are weakly bonded to the crystal surface. The number of such active sites and hence, their relative importance in relation to the corrosion reaction rate, is dependent Ž . upon the surface crystallography nanometer level Ž . w x and surface topography 10–100 nm level 1,2 . Crystal structural features can affect metal corrosion ) Corresponding author. Tel.: q370-2-610067; fax: q370-2- 617-018; e-mail: [email protected] wx behaviour in two quite distinct ways 3 . The first one may be considered to happen when the corrosion Ž . process occurs under conditions of active film-free dissolution and the rate-controlling step takes place at the metal surface. The next one is related to the presence of a thin passive, or thick protective film on the surface. The crystal structure is expected to affect thickness, composition, porosity, adhesion, strength and solubility of these surface films, and hence, the corrosion behaviour of the filmed metal surface. Electrodeposited Zn alloys with Fe group metals significantly extend the steel corrosion protection period with respect to conventional Zn coatings. Certain differences between Zn and Zn alloy elec- trodeposit corrosion behaviour in natural conditions and in some aqueous solutions were reported in our w x recent studies 4–6 . In spite of various investiga- 0169-4332r99r$ - see front matter q 1999 Elsevier Science B.V. All rights reserved. Ž . PII: S0169-4332 99 00334-7
-
Upload
independent -
Category
Documents
-
view
1 -
download
0
Transcript of Structural factor in Zn alloy electrodeposit corrosion
Ž .Applied Surface Science 153 1999 53–64www.elsevier.nlrlocaterapsusc
Structural factor in Zn alloy electrodeposit corrosion
R. Ramanauskas )
Institute of Chemistry, Vilnius 2600, LithuaniaDepartment of Applied Physics, CINVESTAV IPN, 97310 Merida, Mexico
Received 15 April 1999; accepted 1 August 1999
Abstract
AFM, XRD, XPS analyses were performed to characterize Zn, Zn–Co, Zn–Fe and Zn–Ni electrodeposit topography,texture, lattice imperfections, as well superficial corrosion product film composition and properties. The difference in thecoatings’ corrosion resistance manifested when a passivating oxide film formed on the metal surface. Higher values ofdiffraction line integral breadth for Zn–Co and Zn–Ni alloys were detected, which implied a greater number of latticeimperfections for the samples. Besides, a higher surface activity for oxide film formation for the same surfaces was
Ž .observed. It was suggested that the metal structural parameters lattice imperfection and texture were responsible for theoxide films’ properties, which determined the coatings’ corrosion resistance. An amorphous structure and a higher amount ofhydrated Zn oxide in the corrosion product film reduced Zn–Co and Zn–Ni corrosion rates when compared to that of Zn andZn–Fe. q 1999 Elsevier Science B.V. All rights reserved.
Keywords: Zn electrodeposits; Structural parameters; Corrosion; Oxide films
1. Introduction
The focus of electrochemical surface science isthe correlation of electrode surface structure withelectrochemical reactivity. However, insufficient at-tention to this problem has been centred in the areaof metal corrosion. Metal dissolution is known tooccur mainly at surface active sites where atoms areweakly bonded to the crystal surface. The number ofsuch active sites and hence, their relative importancein relation to the corrosion reaction rate, is dependent
Ž .upon the surface crystallography nanometer levelŽ . w xand surface topography 10–100 nm level 1,2 .
Crystal structural features can affect metal corrosion
) Corresponding author. Tel.: q370-2-610067; fax: q370-2-617-018; e-mail: [email protected]
w xbehaviour in two quite distinct ways 3 . The firstone may be considered to happen when the corrosion
Ž .process occurs under conditions of active film-freedissolution and the rate-controlling step takes placeat the metal surface. The next one is related to thepresence of a thin passive, or thick protective film onthe surface. The crystal structure is expected to affectthickness, composition, porosity, adhesion, strengthand solubility of these surface films, and hence, thecorrosion behaviour of the filmed metal surface.
Electrodeposited Zn alloys with Fe group metalssignificantly extend the steel corrosion protectionperiod with respect to conventional Zn coatings.Certain differences between Zn and Zn alloy elec-trodeposit corrosion behaviour in natural conditionsand in some aqueous solutions were reported in our
w xrecent studies 4–6 . In spite of various investiga-
0169-4332r99r$ - see front matter q 1999 Elsevier Science B.V. All rights reserved.Ž .PII: S0169-4332 99 00334-7
( )R. RamanauskasrApplied Surface Science 153 1999 53–6454
w xtions in the field of Zn alloy corrosion 7–12 , thenature of the inhibition phenomenon has not beenfully understood.
In order to establish the chemical compositionrstructure–reactivity relationship for metals in aggres-sive environments it is essential to characterize thesurface from the chemical and structural points ofview. Thus, surface topography, texture, crystal lat-tice imperfections, superficial film composition andproperties are required to be both examined andevaluated. In general, the use of a number of tech-niques is necessary to obtain a complete understand-
Ž .ing of the corrosion process. X-ray diffraction XRDwith grazing incidence geometry enables informationto be obtained, on the coatings’ texture and latticeimperfection both for the bulk phase and from the
w xsuperficial layer 4 . As atomic force microscopyŽ .AFM can image the insulating layers, it is therefore
w xappropriate for corrosion studies 13–16 . X-ray pho-Ž .toelectronspectroscopy XPS is suitable for superfi-
cial layer composition determination. All these men-tioned techniques were applied in this work.
The present investigation was aimed to find evi-dence that there is a fundamental link between elec-trodeposited Zn and Zn alloy compositionrstructureparameters, their surface activity and their corrosionbehaviour in certain environments.
2. Experimental
Ž . Ž .Zn, Zn–Co 0.6% , Zn–Fe 0.4% and Zn–NiŽ .12% coatings of 10 mm thickness were electrode-posited on low-carbon steel samples which had beenpreviously polished mechanically to a bright mirrorfinish using 0.3 mm alumina powder. Alkaline
Žcyanide-free plating solutions contained ZnO 10y1 . Ž y1 .gl , NaOH 100 gl , organic additives and the
ions of alloying elements. The plating bath detailcompositions and operating conditions have been
w xpreviously given 4–6 . All coating deposition tech-nologies have industrial applications.
AFM studies were carried out with an AFMŽ .AutoProbe CP Park Scientific Instruments at atmo-
spheric pressure and room temperature in contactmode. Images were obtained with the same micro-lever; thus the obtained root-mean-squared rough-
Ž .ness R parameters can be compared for differentrms
samples.Surface analysis was performed in a combined
Ž .AESrXPS system Perkin-Elmer 560 , including adouble-pass cylindrical mirror analyzer and a differ-entially pumped raster ion gun, with the base pres-sure ;5=10y9 Torr. In XPS the X-ray source was
Ž .operated using Al K 1486.6 eV radiation. Bind-a
ing energy calibration was based on C 1s at 284.6eV. Surface cleaning during measurements was car-ried out by Arq sputtering with the beam energy of 4keV and a beam current of 0.36 mA cmy2 .
An X-ray diffractometer with a grazing incidentŽ .geometry Siemens, model D 5000 , Cu monochro-
˚ Ž .matic radiation ls1.5406 A 35 mA and 40 kVwith a 0.018 step and 4.8 s per step counter time wasused to determine the coatings’ texture and to iden-tify the composition of the corrosion product films.The X-ray incidence angle was 58 in compositionstudies and it was chosen until the highest intensityof the diffraction maxima of the corrosion productswas obtained and when the peaks corresponding to
Ž .the substrate Fe appeared. For the coating texturestudies a 108 X-ray beam inclination was applied.The quantitative method for determining the degree
w xof crystallographic texture 4,17 was used.All electrochemical measurements were made us-
ing a standard three-electrode system with a Ptcounter electrode, a saturated calomel reference elec-trode and a GAMRY CMSr100 corrosion measuringsystem.
Atmospheric field tests were carried out under theconditions of the humid tropical climate of Yucatan,Mexico. The samples were exposed in marine andurban test sites. More detailed test-site characteriza-tion and monitoring procedures are given elsewherew x6 .
3. Results
3.1. Zn electrodeposit characterisation
3.1.1. AFM studiesAFM images of investigated coatings are pre-
sented in Fig. 1a–d. After electrodeposition Zn andlow alloyed Zn coating surfaces appeared finelygrained with pyramidal-shaped crystals. For Zn and
Ž .Zn–Co samples Fig. 1a–b the crystal diameter
( )R. RamanauskasrApplied Surface Science 153 1999 53–64 55
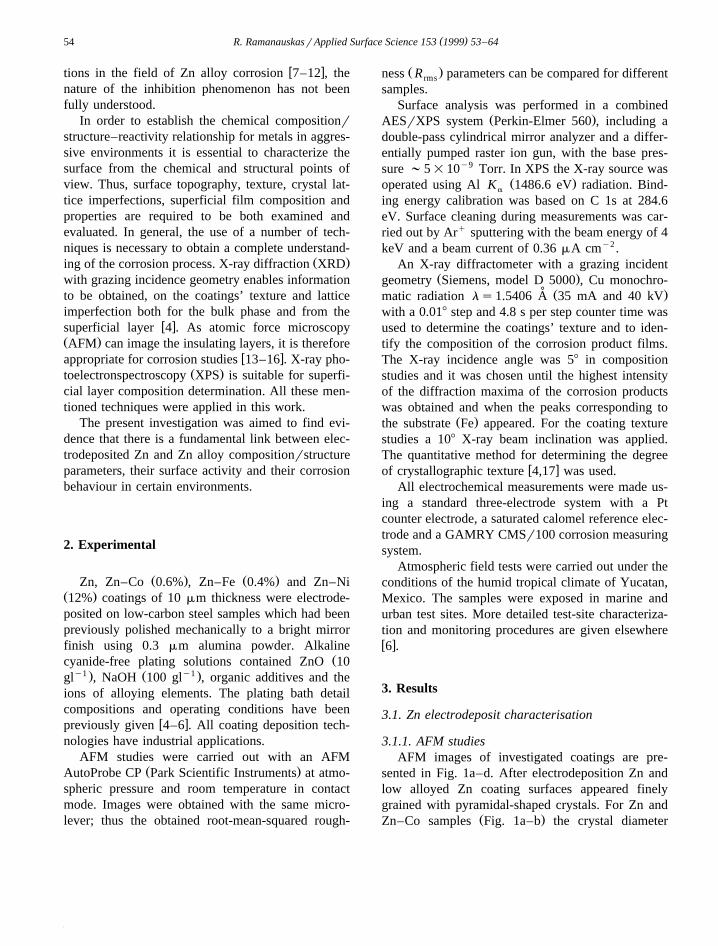
Ž . Ž . Ž . Ž .Fig. 1. AFM images of Zn and Zn alloy electrodeposits: a Zn, b Zn–Co, c Zn–Fe, d Zn–Ni.
ranged between 25 and 75 nm, whilst for Zn–FeŽ .Fig. 1c it ranged from 50 to 100 nm. Furthermore,all these coatings were bright, compared to Zn–Ni,which were dull in appearance. The latter samples
Žpossessed a nodular fine-grained morphology Fig..1d , with the grain size of the order 1–2 mm. The
terrace-stepped structure was observed for Zn–Nisample. In addition, its surface was rougher. The
Ž .root-mean-squared roughness R of the latterrms
sample was 78 nm, while for the other investigatedcoatings this parameter varied between 7 and 16 nm.
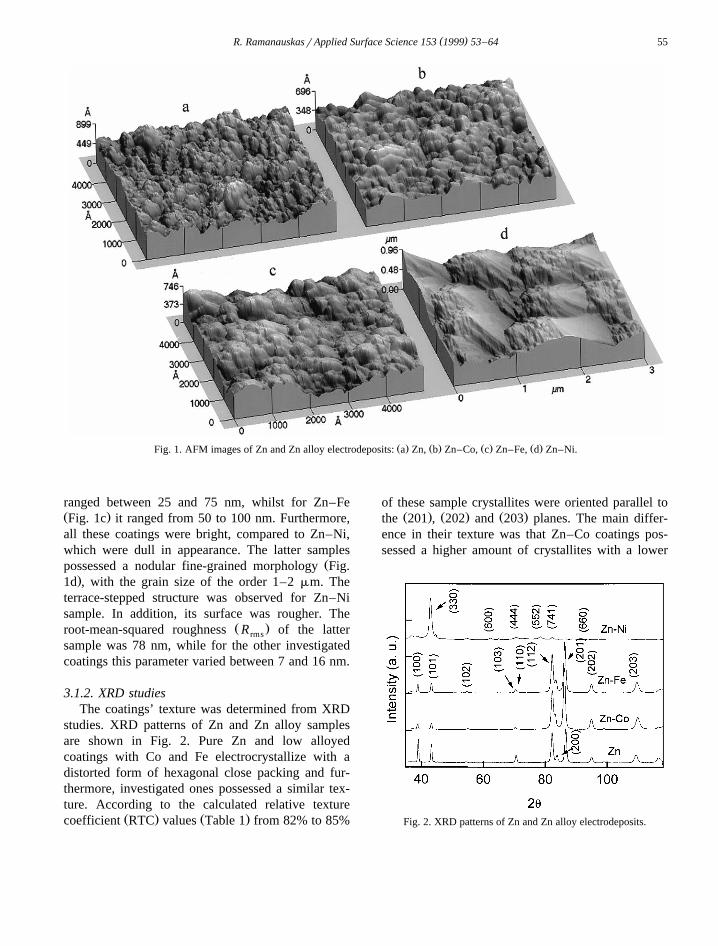
3.1.2. XRD studiesThe coatings’ texture was determined from XRD
studies. XRD patterns of Zn and Zn alloy samplesare shown in Fig. 2. Pure Zn and low alloyedcoatings with Co and Fe electrocrystallize with adistorted form of hexagonal close packing and fur-thermore, investigated ones possessed a similar tex-ture. According to the calculated relative texture
Ž . Ž .coefficient RTC values Table 1 from 82% to 85%
of these sample crystallites were oriented parallel toŽ . Ž . Ž .the 201 , 202 and 203 planes. The main differ-
ence in their texture was that Zn–Co coatings pos-sessed a higher amount of crystallites with a lower
Fig. 2. XRD patterns of Zn and Zn alloy electrodeposits.
( )R. RamanauskasrApplied Surface Science 153 1999 53–6456
Table 1Ž . Ž . Ž .Relative texture coefficient RTC and integral breadth b of diffraction lines of Zn and low alloyed Zn coatings hexagonal close packing
Ž .Plane hkl 2Q Zn Zn–Co Zn–Fe
Ž . Ž . Ž . Ž . Ž . Ž .RTC % b deg RTC % b deg RTC % b deg
Ž .100 39.06 2.2 0.34 1.6 0.37 2.8 0.37Ž .110 70.05 3.9 0.79 13 0.89 5.7 0.80Ž .200 83.76 17 0.39 28.2 0.49 7.4 0.41Ž .201 86.57 17.9 0.70 12.9 0.76 18.2 0.75Ž .202 94.82 24.1 0.70 23.9 0.88 27.4 0.79Ž .203 109.16 26.4 1.05 16.7 1.25 29.4 1.10
Ž . Ž .index 110 orientation 13% , meanwhile for Zn andZn–Fe it varied only between 3% and 5%.
Zn–Ni coatings consisted of a g-Zn Ni phase,21 5
which had a body-centred cubic crystal system. Ap-proximately 43% of these sample crystallites were
Ž .orientated parallel to 110 and 18% of them parallelŽ . Ž .to 100 planes Table 2 .The integral breadth of diffraction lines was mea-
Ž .sured Tables 1 and 2 . The introduction of alloyingmetal in the Zn matrix increased the integral breadthof all diffraction lines for low alloyed Zn–Co andZn–Fe samples. Furthermore, from the previouslymentioned coatings, Zn–Co alloy had the highestvalues of this parameter. As Zn–Ni possess a differ-ent crystal lattice symmetry it is inappropriate tocompare directly this parameter for all investigatedcoatings; nevertheless, it should be mentioned thatfor Zn–Ni samples the measured values for integralbreadth were even higher when compared to Zn–Cocoatings.
3.1.3. XPS studiesXPS analysis was carried out to determine the
composition of investigated electrodeposits. Fig. 3
Table 2Ž . Ž .Relative texture coefficient RTC and integral breadth b of
Ž .diffraction lines of Zn–Ni coatings body-centred cubic packing
Ž . Ž . Ž .Plane hkl 2Q RTC % b deg
Ž .330 42.85 25.4 0.91Ž .600 62.26 18.6 1.27Ž .444 73.26 10.3 1.99Ž .552 78.69 16.5 0.73Ž .741 89.36 10.8 1.10Ž .660 94.26 14.4 1.07
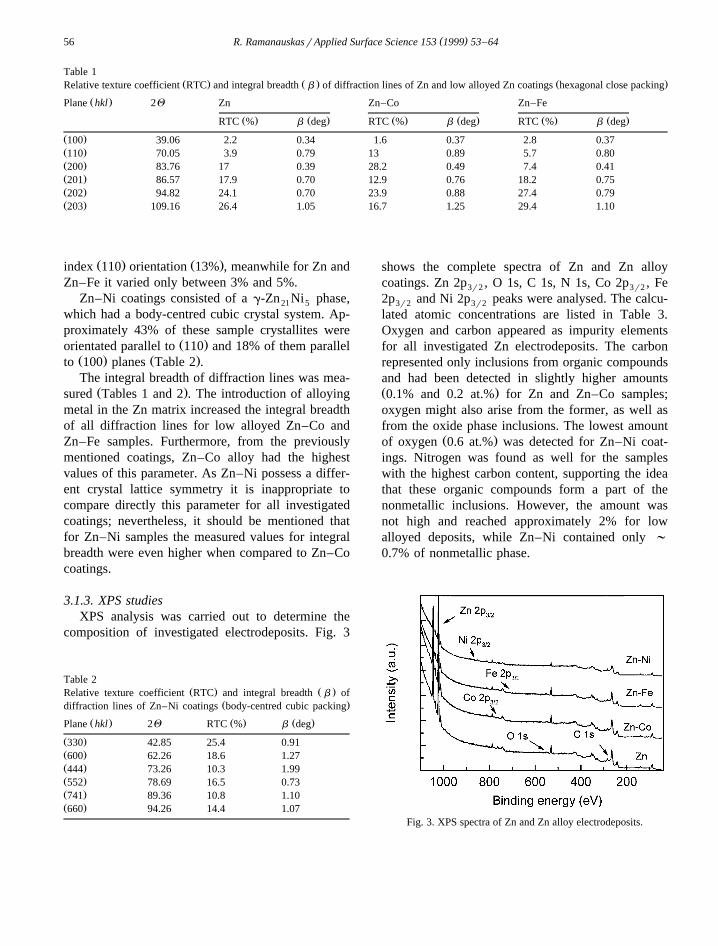
shows the complete spectra of Zn and Zn alloycoatings. Zn 2p , O 1s, C 1s, N 1s, Co 2p , Fe3r2 3r2
2p and Ni 2p peaks were analysed. The calcu-3r2 3r2
lated atomic concentrations are listed in Table 3.Oxygen and carbon appeared as impurity elementsfor all investigated Zn electrodeposits. The carbonrepresented only inclusions from organic compoundsand had been detected in slightly higher amountsŽ .0.1% and 0.2 at.% for Zn and Zn–Co samples;oxygen might also arise from the former, as well asfrom the oxide phase inclusions. The lowest amount
Ž .of oxygen 0.6 at.% was detected for Zn–Ni coat-ings. Nitrogen was found as well for the sampleswith the highest carbon content, supporting the ideathat these organic compounds form a part of thenonmetallic inclusions. However, the amount wasnot high and reached approximately 2% for lowalloyed deposits, while Zn–Ni contained only ;
0.7% of nonmetallic phase.
Fig. 3. XPS spectra of Zn and Zn alloy electrodeposits.
( )R. RamanauskasrApplied Surface Science 153 1999 53–64 57
Table 3Ž . Ž .Composition at.% of Zn and Zn alloy coatings XPS data
Sample Zn 2p O 1s C 1s N 1s Co 2p Fe 2p Ni 2p3r2 3r2 3r2 3r2
Zn 98.0 1.8 0.1 0.05 – – –Zn–Co 97.3 1.7 0.2 0.2 0.6 – –Zn–Fe 97.8 1.7 0.05 – – 0.4 –Zn–Ni 88.4 0.6 0.07 – – – 10.9
In addition, the presence of Na was also detectedin the investigated coatings by SIMS and direct
w xcurrent plasma emission spectroscopy 18 , however,its concentration varied from 0.05 to 0.12 wt.%.
3.2. Corrosion behaÕiour
3.2.1. Aqueous solutionsŽ .The active film-free metal dissolution takes place
Ž . w xin 1 M NH SO solution 19 . Meanwhile, Zn4 2 4
corrosion in near neutral, uncomplexing solutionsoccurs with oxiderhydroxide film formation. There
w x yis evidence 20 that in unbuffered Cl media thisfilm is somewhat porous, and therefore, not of passi-vating type, while in HCOy containing Cly solu-3
tion, the oxide film is supposed to be more compact,adherent and less soluble, thus exhibiting a passivat-
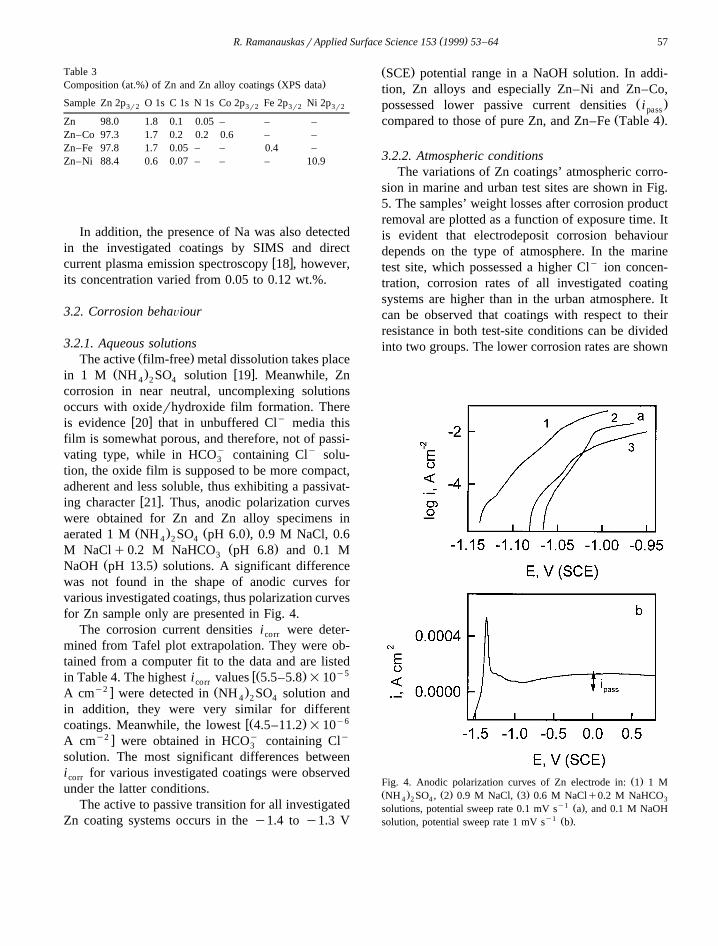
w xing character 21 . Thus, anodic polarization curveswere obtained for Zn and Zn alloy specimens in
Ž . Ž .aerated 1 M NH SO pH 6.0 , 0.9 M NaCl, 0.64 2 4Ž .M NaClq0.2 M NaHCO pH 6.8 and 0.1 M3
Ž .NaOH pH 13.5 solutions. A significant differencewas not found in the shape of anodic curves forvarious investigated coatings, thus polarization curvesfor Zn sample only are presented in Fig. 4.
The corrosion current densities i were deter-corr
mined from Tafel plot extrapolation. They were ob-tained from a computer fit to the data and are listed
wŽ . y5in Table 4. The highest i values 5.5–5.8 =10corry2 x Ž .A cm were detected in NH SO solution and4 2 4
in addition, they were very similar for differentwŽ . y6coatings. Meanwhile, the lowest 4.5–11.2 =10
y2 x y yA cm were obtained in HCO containing Cl3
solution. The most significant differences betweeni for various investigated coatings were observedcorr
under the latter conditions.The active to passive transition for all investigated
Zn coating systems occurs in the y1.4 to y1.3 V
Ž .SCE potential range in a NaOH solution. In addi-tion, Zn alloys and especially Zn–Ni and Zn–Co,
Ž .possessed lower passive current densities ipassŽ .compared to those of pure Zn, and Zn–Fe Table 4 .
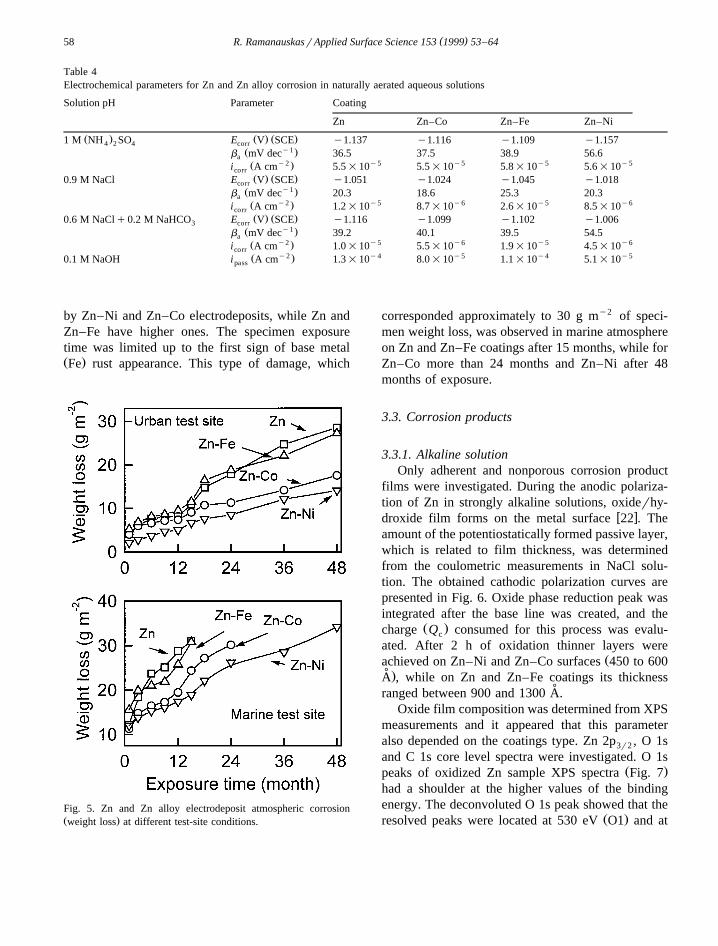
3.2.2. Atmospheric conditionsThe variations of Zn coatings’ atmospheric corro-
sion in marine and urban test sites are shown in Fig.5. The samples’ weight losses after corrosion productremoval are plotted as a function of exposure time. Itis evident that electrodeposit corrosion behaviourdepends on the type of atmosphere. In the marinetest site, which possessed a higher Cly ion concen-tration, corrosion rates of all investigated coatingsystems are higher than in the urban atmosphere. Itcan be observed that coatings with respect to theirresistance in both test-site conditions can be dividedinto two groups. The lower corrosion rates are shown
Ž .Fig. 4. Anodic polarization curves of Zn electrode in: 1 1 MŽ . Ž . Ž .NH SO , 2 0.9 M NaCl, 3 0.6 M NaClq0.2 M NaHCO4 2 4 3
y1 Ž .solutions, potential sweep rate 0.1 mV s a , and 0.1 M NaOHy1 Ž .solution, potential sweep rate 1 mV s b .
( )R. RamanauskasrApplied Surface Science 153 1999 53–6458
Table 4Electrochemical parameters for Zn and Zn alloy corrosion in naturally aerated aqueous solutions
Solution pH Parameter Coating
Zn Zn–Co Zn–Fe Zn–Ni
Ž . Ž . Ž .1 M NH SO E V SCE y1.137 y1.116 y1.109 y1.1574 2 4 corry1Ž .b mV dec 36.5 37.5 38.9 56.6a
y2 y5 y5 y5 y5Ž .i A cm 5.5=10 5.5=10 5.8=10 5.6=10corrŽ . Ž .0.9 M NaCl E V SCE y1.051 y1.024 y1.045 y1.018corr
y1Ž .b mV dec 20.3 18.6 25.3 20.3ay2 y5 y6 y5 y6Ž .i A cm 1.2=10 8.7=10 2.6=10 8.5=10corr
Ž . Ž .0.6 M NaClq0.2 M NaHCO E V SCE y1.116 y1.099 y1.102 y1.0063 corry1Ž .b mV dec 39.2 40.1 39.5 54.5a
y2 y5 y6 y5 y6Ž .i A cm 1.0=10 5.5=10 1.9=10 4.5=10corry2 y4 y5 y4 y5Ž .0.1 M NaOH i A cm 1.3=10 8.0=10 1.1=10 5.1=10pass
by Zn–Ni and Zn–Co electrodeposits, while Zn andZn–Fe have higher ones. The specimen exposuretime was limited up to the first sign of base metalŽ .Fe rust appearance. This type of damage, which
Fig. 5. Zn and Zn alloy electrodeposit atmospheric corrosionŽ .weight loss at different test-site conditions.
corresponded approximately to 30 g my2 of speci-men weight loss, was observed in marine atmosphereon Zn and Zn–Fe coatings after 15 months, while forZn–Co more than 24 months and Zn–Ni after 48months of exposure.
3.3. Corrosion products
3.3.1. Alkaline solutionOnly adherent and nonporous corrosion product
films were investigated. During the anodic polariza-tion of Zn in strongly alkaline solutions, oxiderhy-
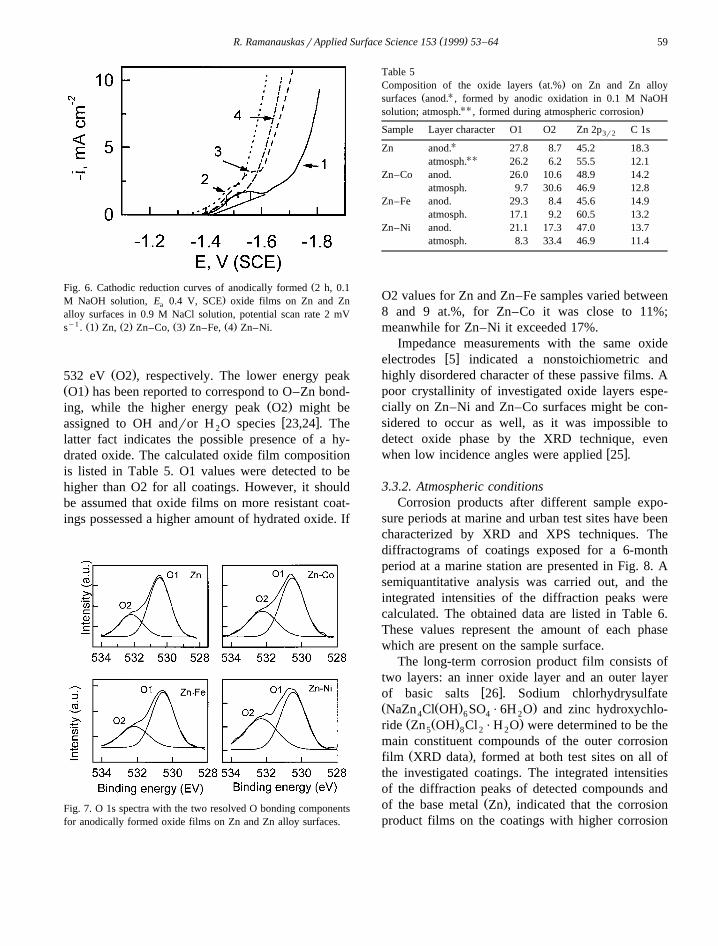
w xdroxide film forms on the metal surface 22 . Theamount of the potentiostatically formed passive layer,which is related to film thickness, was determinedfrom the coulometric measurements in NaCl solu-tion. The obtained cathodic polarization curves arepresented in Fig. 6. Oxide phase reduction peak wasintegrated after the base line was created, and the
Ž .charge Q consumed for this process was evalu-c
ated. After 2 h of oxidation thinner layers wereŽachieved on Zn–Ni and Zn–Co surfaces 450 to 600
˚ .A , while on Zn and Zn–Fe coatings its thickness˚ranged between 900 and 1300 A.
Oxide film composition was determined from XPSmeasurements and it appeared that this parameteralso depended on the coatings type. Zn 2p , O 1s3r2
and C 1s core level spectra were investigated. O 1sŽ .peaks of oxidized Zn sample XPS spectra Fig. 7
had a shoulder at the higher values of the bindingenergy. The deconvoluted O 1s peak showed that the
Ž .resolved peaks were located at 530 eV O1 and at
( )R. RamanauskasrApplied Surface Science 153 1999 53–64 59
ŽFig. 6. Cathodic reduction curves of anodically formed 2 h, 0.1.M NaOH solution, E 0.4 V, SCE oxide films on Zn and Zna
alloy surfaces in 0.9 M NaCl solution, potential scan rate 2 mVy1 Ž . Ž . Ž . Ž .s . 1 Zn, 2 Zn–Co, 3 Zn–Fe, 4 Zn–Ni.
Ž .532 eV O2 , respectively. The lower energy peakŽ .O1 has been reported to correspond to O–Zn bond-
Ž .ing, while the higher energy peak O2 might bew xassigned to OH andror H O species 23,24 . The2
latter fact indicates the possible presence of a hy-drated oxide. The calculated oxide film compositionis listed in Table 5. O1 values were detected to behigher than O2 for all coatings. However, it shouldbe assumed that oxide films on more resistant coat-ings possessed a higher amount of hydrated oxide. If
Fig. 7. O 1s spectra with the two resolved O bonding componentsfor anodically formed oxide films on Zn and Zn alloy surfaces.
Table 5Ž .Composition of the oxide layers at.% on Zn and Zn alloy
Ž Usurfaces anod. , formed by anodic oxidation in 0.1 M NaOHUU .solution; atmosph. , formed during atmospheric corrosion
Sample Layer character O1 O2 Zn 2p C 1s3r2
UZn anod. 27.8 8.7 45.2 18.3UUatmosph. 26.2 6.2 55.5 12.1
Zn–Co anod. 26.0 10.6 48.9 14.2atmosph. 9.7 30.6 46.9 12.8
Zn–Fe anod. 29.3 8.4 45.6 14.9atmosph. 17.1 9.2 60.5 13.2
Zn–Ni anod. 21.1 17.3 47.0 13.7atmosph. 8.3 33.4 46.9 11.4
O2 values for Zn and Zn–Fe samples varied between8 and 9 at.%, for Zn–Co it was close to 11%;meanwhile for Zn–Ni it exceeded 17%.
Impedance measurements with the same oxidew xelectrodes 5 indicated a nonstoichiometric and
highly disordered character of these passive films. Apoor crystallinity of investigated oxide layers espe-cially on Zn–Ni and Zn–Co surfaces might be con-sidered to occur as well, as it was impossible todetect oxide phase by the XRD technique, even
w xwhen low incidence angles were applied 25 .
3.3.2. Atmospheric conditionsCorrosion products after different sample expo-
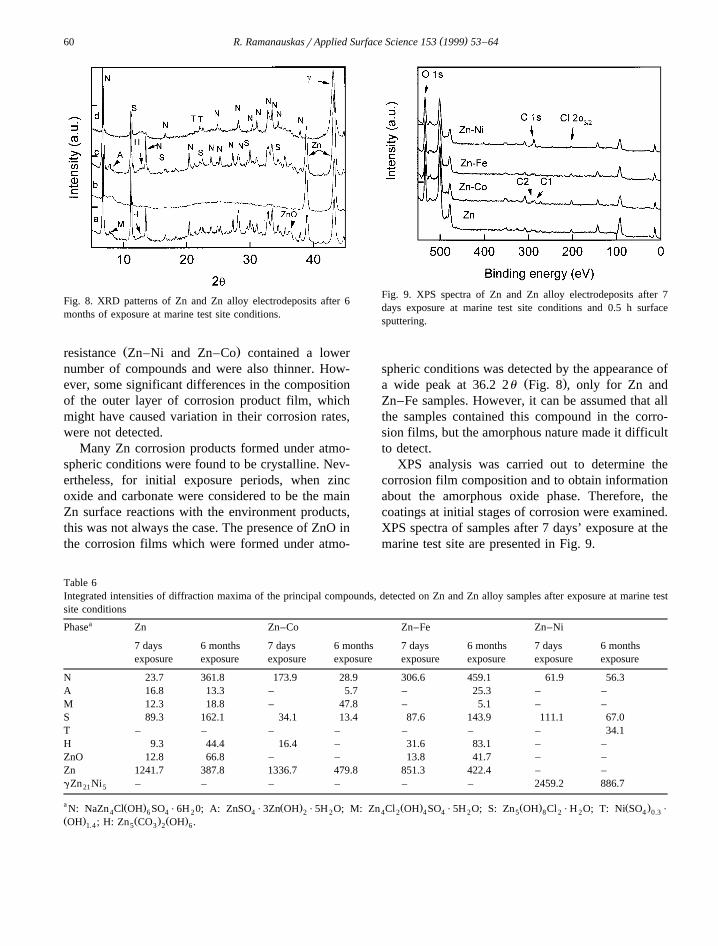
sure periods at marine and urban test sites have beencharacterized by XRD and XPS techniques. Thediffractograms of coatings exposed for a 6-monthperiod at a marine station are presented in Fig. 8. Asemiquantitative analysis was carried out, and theintegrated intensities of the diffraction peaks werecalculated. The obtained data are listed in Table 6.These values represent the amount of each phasewhich are present on the sample surface.
The long-term corrosion product film consists oftwo layers: an inner oxide layer and an outer layer
w xof basic salts 26 . Sodium chlorhydrysulfateŽ Ž . .NaZn Cl OH SO P6H O and zinc hydroxychlo-4 6 4 2
Ž Ž . .ride Zn OH Cl PH O were determined to be the5 8 2 2
main constituent compounds of the outer corrosionŽ .film XRD data , formed at both test sites on all of
the investigated coatings. The integrated intensitiesof the diffraction peaks of detected compounds and
Ž .of the base metal Zn , indicated that the corrosionproduct films on the coatings with higher corrosion
( )R. RamanauskasrApplied Surface Science 153 1999 53–6460
Fig. 8. XRD patterns of Zn and Zn alloy electrodeposits after 6months of exposure at marine test site conditions.
Ž .resistance Zn–Ni and Zn–Co contained a lowernumber of compounds and were also thinner. How-ever, some significant differences in the compositionof the outer layer of corrosion product film, whichmight have caused variation in their corrosion rates,were not detected.
Many Zn corrosion products formed under atmo-spheric conditions were found to be crystalline. Nev-ertheless, for initial exposure periods, when zincoxide and carbonate were considered to be the mainZn surface reactions with the environment products,this was not always the case. The presence of ZnO inthe corrosion films which were formed under atmo-
Fig. 9. XPS spectra of Zn and Zn alloy electrodeposits after 7days exposure at marine test site conditions and 0.5 h surfacesputtering.
spheric conditions was detected by the appearance ofŽ .a wide peak at 36.2 2u Fig. 8 , only for Zn and
Zn–Fe samples. However, it can be assumed that allthe samples contained this compound in the corro-sion films, but the amorphous nature made it difficultto detect.
XPS analysis was carried out to determine thecorrosion film composition and to obtain informationabout the amorphous oxide phase. Therefore, thecoatings at initial stages of corrosion were examined.XPS spectra of samples after 7 days’ exposure at themarine test site are presented in Fig. 9.
Table 6Integrated intensities of diffraction maxima of the principal compounds, detected on Zn and Zn alloy samples after exposure at marine testsite conditions
aPhase Zn Zn–Co Zn–Fe Zn–Ni
7 days 6 months 7 days 6 months 7 days 6 months 7 days 6 monthsexposure exposure exposure exposure exposure exposure exposure exposure
N 23.7 361.8 173.9 28.9 306.6 459.1 61.9 56.3A 16.8 13.3 – 5.7 – 25.3 – –M 12.3 18.8 – 47.8 – 5.1 – –S 89.3 162.1 34.1 13.4 87.6 143.9 111.1 67.0T – – – – – – – 34.1H 9.3 44.4 16.4 – 31.6 83.1 – –ZnO 12.8 66.8 – – 13.8 41.7 – –Zn 1241.7 387.8 1336.7 479.8 851.3 422.4 – –gZn Ni – – – – – – 2459.2 886.721 5
a Ž . Ž . Ž . Ž . Ž .N: NaZn Cl OH SO P6H 0; A: ZnSO P3Zn OH P5H O; M: Zn Cl OH SO P5H O; S: Zn OH Cl PH O; T: Ni SO P4 6 4 2 4 2 2 4 2 4 4 2 5 8 2 2 4 0.3Ž . Ž . Ž .OH ; H: Zn CO OH .1.4 5 3 2 6
( )R. RamanauskasrApplied Surface Science 153 1999 53–64 61
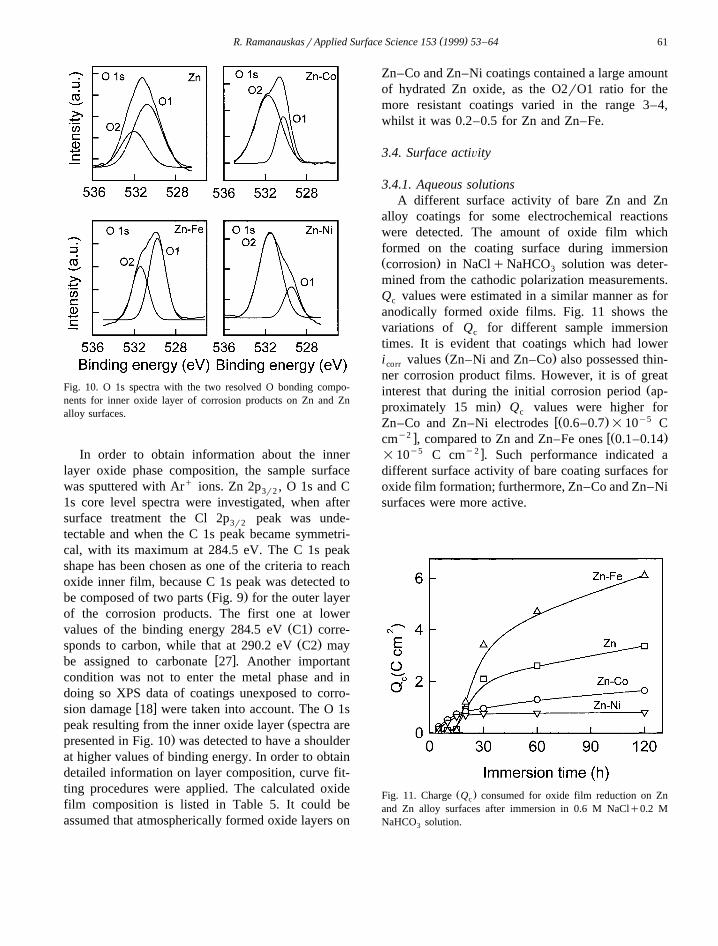
Fig. 10. O 1s spectra with the two resolved O bonding compo-nents for inner oxide layer of corrosion products on Zn and Znalloy surfaces.
In order to obtain information about the innerlayer oxide phase composition, the sample surfacewas sputtered with Arq ions. Zn 2p , O 1s and C3r2
1s core level spectra were investigated, when aftersurface treatment the Cl 2p peak was unde-3r2
tectable and when the C 1s peak became symmetri-cal, with its maximum at 284.5 eV. The C 1s peakshape has been chosen as one of the criteria to reachoxide inner film, because C 1s peak was detected to
Ž .be composed of two parts Fig. 9 for the outer layerof the corrosion products. The first one at lower
Ž .values of the binding energy 284.5 eV C1 corre-Ž .sponds to carbon, while that at 290.2 eV C2 may
w xbe assigned to carbonate 27 . Another importantcondition was not to enter the metal phase and indoing so XPS data of coatings unexposed to corro-
w xsion damage 18 were taken into account. The O 1sŽpeak resulting from the inner oxide layer spectra are
.presented in Fig. 10 was detected to have a shoulderat higher values of binding energy. In order to obtaindetailed information on layer composition, curve fit-ting procedures were applied. The calculated oxidefilm composition is listed in Table 5. It could beassumed that atmospherically formed oxide layers on
Zn–Co and Zn–Ni coatings contained a large amountof hydrated Zn oxide, as the O2rO1 ratio for themore resistant coatings varied in the range 3–4,whilst it was 0.2–0.5 for Zn and Zn–Fe.
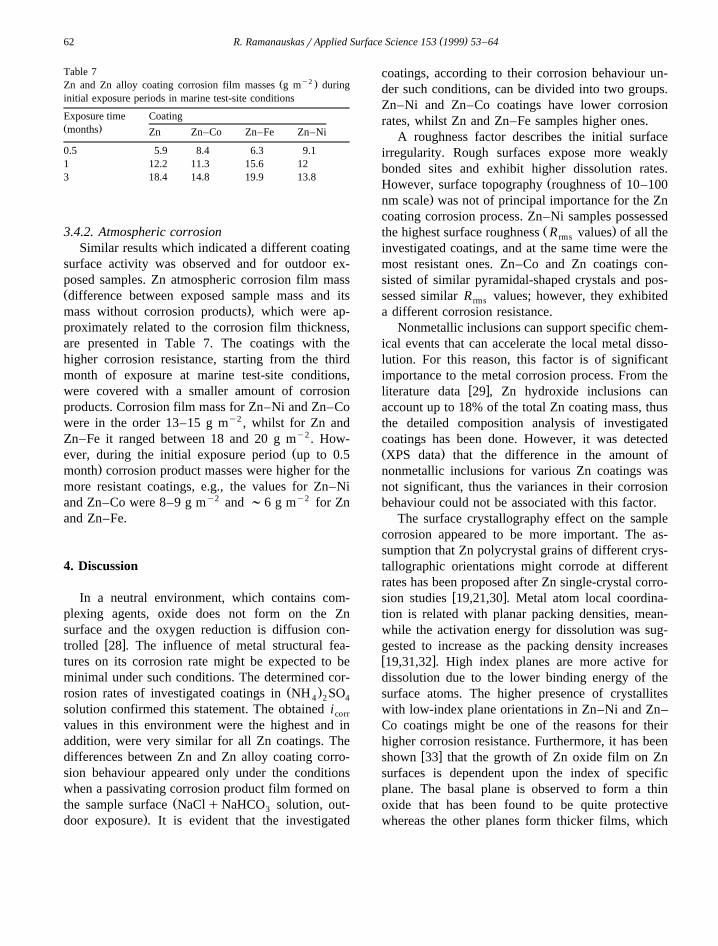
3.4. Surface actiÕity
3.4.1. Aqueous solutionsA different surface activity of bare Zn and Zn
alloy coatings for some electrochemical reactionswere detected. The amount of oxide film whichformed on the coating surface during immersionŽ .corrosion in NaClqNaHCO solution was deter-3
mined from the cathodic polarization measurements.Q values were estimated in a similar manner as forc
anodically formed oxide films. Fig. 11 shows thevariations of Q for different sample immersionc
times. It is evident that coatings which had lowerŽ .i values Zn–Ni and Zn–Co also possessed thin-corr
ner corrosion product films. However, it is of greatŽinterest that during the initial corrosion period ap-
.proximately 15 min Q values were higher forcwŽ . y5Zn–Co and Zn–Ni electrodes 0.6–0.7 =10 C
y2 x wŽ .cm , compared to Zn and Zn–Fe ones 0.1–0.14y5 y2 x=10 C cm . Such performance indicated a
different surface activity of bare coating surfaces foroxide film formation; furthermore, Zn–Co and Zn–Nisurfaces were more active.
Ž .Fig. 11. Charge Q consumed for oxide film reduction on Znc
and Zn alloy surfaces after immersion in 0.6 M NaClq0.2 MNaHCO solution.3
( )R. RamanauskasrApplied Surface Science 153 1999 53–6462
Table 7Ž y2 .Zn and Zn alloy coating corrosion film masses g m during
initial exposure periods in marine test-site conditions
Exposure time CoatingŽ .months Zn Zn–Co Zn–Fe Zn–Ni
0.5 5.9 8.4 6.3 9.11 12.2 11.3 15.6 123 18.4 14.8 19.9 13.8
3.4.2. Atmospheric corrosionSimilar results which indicated a different coating
surface activity was observed and for outdoor ex-posed samples. Zn atmospheric corrosion film massŽdifference between exposed sample mass and its
.mass without corrosion products , which were ap-proximately related to the corrosion film thickness,are presented in Table 7. The coatings with thehigher corrosion resistance, starting from the thirdmonth of exposure at marine test-site conditions,were covered with a smaller amount of corrosionproducts. Corrosion film mass for Zn–Ni and Zn–Cowere in the order 13–15 g my2 , whilst for Zn andZn–Fe it ranged between 18 and 20 g my2 . How-
Žever, during the initial exposure period up to 0.5.month corrosion product masses were higher for the
more resistant coatings, e.g., the values for Zn–Niand Zn–Co were 8–9 g my2 and ;6 g my2 for Znand Zn–Fe.
4. Discussion
In a neutral environment, which contains com-plexing agents, oxide does not form on the Znsurface and the oxygen reduction is diffusion con-
w xtrolled 28 . The influence of metal structural fea-tures on its corrosion rate might be expected to beminimal under such conditions. The determined cor-
Ž .rosion rates of investigated coatings in NH SO4 2 4
solution confirmed this statement. The obtained icorr
values in this environment were the highest and inaddition, were very similar for all Zn coatings. Thedifferences between Zn and Zn alloy coating corro-sion behaviour appeared only under the conditionswhen a passivating corrosion product film formed on
Žthe sample surface NaClqNaHCO solution, out-3.door exposure . It is evident that the investigated
coatings, according to their corrosion behaviour un-der such conditions, can be divided into two groups.Zn–Ni and Zn–Co coatings have lower corrosionrates, whilst Zn and Zn–Fe samples higher ones.
A roughness factor describes the initial surfaceirregularity. Rough surfaces expose more weaklybonded sites and exhibit higher dissolution rates.
ŽHowever, surface topography roughness of 10–100.nm scale was not of principal importance for the Zn
coating corrosion process. Zn–Ni samples possessedŽ .the highest surface roughness R values of all therms
investigated coatings, and at the same time were themost resistant ones. Zn–Co and Zn coatings con-sisted of similar pyramidal-shaped crystals and pos-sessed similar R values; however, they exhibitedrms
a different corrosion resistance.Nonmetallic inclusions can support specific chem-
ical events that can accelerate the local metal disso-lution. For this reason, this factor is of significantimportance to the metal corrosion process. From the
w xliterature data 29 , Zn hydroxide inclusions canaccount up to 18% of the total Zn coating mass, thusthe detailed composition analysis of investigatedcoatings has been done. However, it was detectedŽ .XPS data that the difference in the amount ofnonmetallic inclusions for various Zn coatings wasnot significant, thus the variances in their corrosionbehaviour could not be associated with this factor.
The surface crystallography effect on the samplecorrosion appeared to be more important. The as-sumption that Zn polycrystal grains of different crys-tallographic orientations might corrode at differentrates has been proposed after Zn single-crystal corro-
w xsion studies 19,21,30 . Metal atom local coordina-tion is related with planar packing densities, mean-while the activation energy for dissolution was sug-gested to increase as the packing density increasesw x19,31,32 . High index planes are more active fordissolution due to the lower binding energy of thesurface atoms. The higher presence of crystalliteswith low-index plane orientations in Zn–Ni and Zn–Co coatings might be one of the reasons for theirhigher corrosion resistance. Furthermore, it has been
w xshown 33 that the growth of Zn oxide film on Znsurfaces is dependent upon the index of specificplane. The basal plane is observed to form a thinoxide that has been found to be quite protectivewhereas the other planes form thicker films, which
( )R. RamanauskasrApplied Surface Science 153 1999 53–64 63
are less protective. Thus, Zn coating texture couldhave a dual effect on its corrosion rate. The coatings,which possessed a low-index plane texture, might bemore stable due to a higher metal atom coordinationand because of the fact that oxide films on suchsurfaces were more resistant.
The corrosion process is essentially a surfacephenomenon; thus it might be strongly related tocrystalline perfection, e.g., highly stepped metal sur-faces, since the presence of dislocations makes thesteps indestructible. It is reasonable, therefore, toargue that the lattice distortions must be important inthe corrosion process. X-ray diffraction line broaden-ing is recognised to be caused by crystallite size and
w xlattice strains 34–36 . In general, the grain size ofZn electrodeposits lies in the range 0.1–10 mm, forwhich X-ray diffraction is quite insensitive to its
w xvariations 37,38 , so the observed line broadeningwill be affected mostly by lattice imperfections. Thehighest values of diffraction line integral breadthamong Zn and low alloyed coatings were detectedfor Zn–Co samples. This permitted the assumptionthat the latter coatings possessed a more disorderedlattice compared to Zn and Zn–Fe. The decrease inthe crystalline perfection affects the surface reactiv-ity and usually increases it. Consequently, this factormight be the reason why bare Zn–Co surface wasmore active for oxide film formation.
For Zn–Ni coatings the values of the integralbreadth of diffraction lines were even greater thanthose of Zn–Co; however, this alloy possesses dif-ferent crystal lattice symmetry, thus it is unsuitableto compare directly this parameter with those ofother coatings. Even so, the surface activity for oxideformation during initial corrosion process stages wasalso higher for the Zn–Ni sample compared with Znand Zn–Fe. Thus, it should be assumed that Zn–Nialloy possessed a more disordered lattice and henceits bare surface was more active.
A higher surface activity of certain Zn alloys, andhence the metal structure, might be the precursor foroxide film formation, which contained a large amountof Zn hydroxide and exhibited poor crystallinity. Theamorphous structure and lower electron conductivity
w xof hydrated Zn oxide compared to Zn oxide 10made such alloys more stable in corrosion environ-ments where passive films formed on the metalsurface.
The complexity of real systems made it difficultto evaluate individually and correctly the relationshipof surface chemical composition and structure to thereactivity in aqueous solutions. The role of alloyed
Želements in terms of passivity promoters elements.that enhance passivity , or dissolution moderators, or
Žblockers elements that slow down the metal dissolu-. w xtion rate is recognized as well 39 . However, the
obtained results on Zn coating structure and corro-sion behaviour indicated that metal structure parame-ters such as texture and lattice perfection may be ofprincipal importance while determining electrode-posit corrosion rates.
5. Conclusions
The differences in the corrosion behaviour be-tween Zn and Zn alloy coatings manifest under theconditions when passivating corrosion product filmsform on the metal surface. A higher lattice imperfec-tion of Zn–Co and Zn–Ni electrodeposits makes itsbare surfaces more active for oxide layer formationand influences the oxide film properties. An amor-phous structure and a higher amount of hydrated Znoxide in corrosion product films makes Zn–Co andZn–Ni coatings more resistant compared to Zn andZn–Fe ones. The higher presence of crystallites withlow-index plane orientations may be an additionalreason for higher Zn–Co and Zn–Ni corrosion stabil-ity.
Acknowledgements
The author wishes to acknowledge P. Quintana,I.A. Oliva, and P. Bartolo-Perez for experimentalsupport and valuable discussions and CONACYT,
Ž .Mexico project No. 2207P-A for financial supportin conducting various phases of this investigation.
References
w x1 M.E. Vela, G. Andreasen, S.G. Aziz, R.C. Salvarezza, A.J.Ž .Arvia, Electrochim. Acta 43 1998 3.
w x2 M.G. Fernandes, R.M. Latanision, P.C. Searson, Phys. Rev.Ž .B 47 1993 11749.
( )R. RamanauskasrApplied Surface Science 153 1999 53–6464
w x Ž .3 L.L. Shreier, R.A. Jarman, G.T. Burstein Eds. , Corrosion,Vol. 1, Butterworth, Oxford, 1994, p. 1:33.
w x4 R. Ramanauskas, P. Quintana, L. Maldonado, R. Pomes,Ž .M.A. Pech-Canul, Surf. Coat. Tech. 92 1997 16.
w x5 M.A. Pech-Canul, R. Ramanauskas, L. Maldonado, Elec-Ž .trochim. Acta 42 1997 255.
w x6 R. Ramanauskas, L. Muleshkova, L. Maldonado, P. Dobro-Ž .volskis, Corros. Sci. 40 1998 402.
w x Ž .7 Leidheiser Jr., J. Suzuki, J. Electrochem. Soc. 128 1981242.
w x8 J.R. Vilche, K. Juttner, W.J. Lorenz, W. Kautek, W. Paatsch,¨Ž .M.H. Dean, H. Stimming, J. Electrochem. Soc. 136 1989
3773.w x9 N.R. Short, A. Abibsi, J.K. Dennis, Trans. Inst. Met. Finish.
Ž .67 1989 73.w x Ž .10 G.D. Wilcax, D.R. Gabe, Corros. Sci. 35 1993 1251.w x11 W. Kautek, M. Sahre, W. Paatch, Electrochim. Acta 39
Ž .1994 1151.w x12 A. Stankeviciute, K. Leinartas, G. Bikulcius, D. Virbalyte,ˇ ˙ ˇ ˙
Ž .A.E. Juzeliunas, J. Appl. Electrochem. 28 1998 89.w x13 B.J. Cruickshank, A.A. Gewirth, R.M. Rynders, R.C. Alkire,
Ž .J. Electrochem. Soc. 139 1992 2829.w x14 T.J. Warner, M.P. Schmid, F. Sommer, D. Bellot, Z. Metal-
Ž .lkd. 86 1995 494.w x15 K. Shimizu, K. Kobayashi, P. Skeldon, G.E. Thompson,
Ž .G.C. Wood, Corros. Sci. 39 1997 701.w x16 A. Shaban, E. Kalman, J. Telegdi, G. Palinkas, Gy. Dora,
Ž .Appl. Phys. A: Mater. Sci. Process. 66 1998 S545.w x17 L.Ph. Berube, G. L’Esperance, J. Electrochem. Soc. 136
Ž .1989 2314.w x18 R. Ramanauskas, I. Jureviciute, A. Selskis, Chem. J. Lith.ˇ ˙
Ž .Acad. Sci. 4 1998 291.w x19 D. Abayarathna, E.B. Hale, T.J. O’Keefe, Y.-M. Wang, D.
Ž .Radovic, Corros. Sci. 32 1991 755.w x Ž .20 T.E. Graedel, J. Electrochem. Soc. 136 1989 193C.
w x Ž .21 R. Guo, F. Weinberg, D. Tromans, Corrosion 51 1995 356.w x22 A.E. Bohe, J.R. Vilche, K. Juttner, W.J. Lorenz, W. Paatsch,¨
Ž .Corros. Sci. 33 1991 621.w x23 L. Meng, C.P. Moreira de Sa, M.P. Santos, Appl. Surf. Sci.
Ž .78 1994 57.w x24 L. Avale, E. Santos, E. Leiva, V.A. Macagno, Thin Solid
Ž .Films 219 1992 7.w x25 R. Ramanauskas, M.A. Pech-Canul, P. Quintana, L. Maldon-
Ž .ado, P. Bartolo-Perez, Electrochem. Soc. Proc. 97 26 1998846.
w x26 X.G. Zhang, Corrosion and Electrochemistry of Zinc, Plenum,New York, 1996, p. 474.
w x27 R. Ramanauskas, P. Quintana, P. Bartolo-Perez, L. Diaz-Bal-lote, submitted to Corrosion, 1998.
w x Ž .28 K.G. Boto, L.F.G. Williams, J. Electroanal. Chem. 77 19771.
w x29 K.R. Baldwin, C.J. Smith, M.J. Robinson, Trans. Inst. Met.Ž .Finish. 72 1994 79.
w x Ž30 E. Juzeliunas, A. Sudavicius, Russ. J. Electrochem. Transl.ˇ. Ž .of Electrokhimiya 29 1993 803.
w x Ž .31 R.F. Ashton, M.P. Hepworth, Corrosion 24 1968 50.w x Ž .32 H. Park, J.A. Szpunar, Corros. Sci. 40 1998 525.w x33 S.R. Morrison, Electrochemistry at Semiconductor and Oxi-
dized Electrodes, Plenum, New York, 1980, p. 292.w x34 Th.H. De Keijser, J.I. Langford, E.J. Mittemeijer, A.B.P.
Ž .Vogels, J. Appl. Crystallogr. 15 1982 308.w x35 S. Enzo, G. Fagherazzi, A. Benedetti, J. Polizzi, J. Appl.
Ž .Crystallogr. 21 1988 536.w x Ž .36 D.J. Balzar, J. Appl. Crystallogr. 25 1992 559.w x37 B.D. Cullity, Elements of X-ray Diffraction, 2nd edn., Addi-
son-Wesley, Reading, USA, 1978, p. 285.w x38 J.G.M. Van Berkum, R. Delhez, Th.H. de Keijser, E.J.
Ž .Mittemeijer, Acta Cryst., Sect. A 52 1996 730.w x Ž .39 P. Marcus, Electrochim. Acta 43 1998 109.