experimental and numerical investigation of cold-formed lean ...

EM
Sa
b
c
a
ARRAA
KMACEX
1
gFsaotmlctw
coahsgos
(
0d
Electrochimica Acta 56 (2011) 4554–4565
Contents lists available at ScienceDirect
Electrochimica Acta
journa l homepage: www.e lsev ier .com/ locate /e lec tac ta
ffect of naturally formed oxide films and other variables in the early stages ofg-alloy corrosion in NaCl solution
ebastián Feliu Jr. a,∗, C. Maffiotteb, Alejandro Samaniegoa, Juan Carlos Galvána, Violeta Barrancoa,c
Centro Nacional de Investigaciones Metalúrgicas CSIC, Avda. Gregorio del Amo 8, 28040 Madrid, SpainCIEMAT. FNL (edificio 2), Avda. Complutense, 22, 28040 Madrid, SpainInstituto de Ciencias de Materiales de Madrid, ICMM, Consejo Superior de Investigaciones Científicas, CSIC, Sor Juana Inés de la Cruz, 3, Cantoblanco, 28049 Madrid, Spain
r t i c l e i n f o
rticle history:eceived 11 October 2010eceived in revised form 17 February 2011ccepted 18 February 2011
a b s t r a c t
The influence of initial surface conditions on the subsequent corrosion behaviour of AZ31 and AZ61 mag-nesium alloys in 0.6 M NaCl solution has been studied using electrochemical impedance spectroscopy.For obtaining the different surface conditions, some of the specimens were immersion tested with thesurface in the as-received condition, while others were tested immediately after mechanical polishing,
vailable online 26 February 2011
eywords:agnesium alloys
luminium
and part of the polished specimens after six months of exposure to the laboratory atmosphere. Consider-ing the evolution of the high-frequency capacitive arc of the Nyquist diagram, whose diameter is relatedto the corrosion process, a clear effect of the initial surface conditions is observed only in the early stagesof testing. This effect is especially significant for the freshly polished specimens.
© 2011 Elsevier Ltd. All rights reserved.
hloridelectrochemical impedance spectroscopy-ray photoelectron spectroscopy. Introduction
Magnesium and its alloys, especially Mg–Al alloys, have arousedreat scientific and technological interest over the last two decades.rom a practical point of view, magnesium is the lowest densitytructural metal, making it attractive for use in the automotive,erospace, IT and electronics industries, and in the developmentf new biomaterials for orthopaedic and cardiovascular applica-ions, where weight plays a decisive role. However, being one of the
ost chemically active metals, the use of magnesium is sometimesimited by its inadequate resistance to atmospheric and aqueousorrosion. There is a need for more complete information on the fac-ors that influence the corrosion of these materials, and the presentork aims to contribute to this knowledge.
The effect of aluminium as an alloying element to improve theorrosion resistance of magnesium has been studied in a wide rangef experimental conditions, such as exposure to dry oxygen [1,2],mbient atmospheres [3–5], atmospheres with a high degree ofumidity [6–10], in immersion in distilled water [11], and in saline
olutions or atmospheres [12–24]. In Mg–Al alloys the greater oxy-en affinity of aluminium tends to produce passivating aluminiumxide films or mixtures of Mg and Al oxides, which can give specialtability to the exposed surface [14,25,26].∗ Corresponding author. Tel.: +34 91 5538900; fax: +34 91 5347425.E-mail addresses: [email protected] (S. Feliu Jr.), [email protected]
C. Maffiotte), [email protected] (J.C. Galván).
013-4686/$ – see front matter © 2011 Elsevier Ltd. All rights reserved.oi:10.1016/j.electacta.2011.02.077
Many researchers have carried out studies to find relation-ships between the alloy microstructure (amount and distribution of�-phase precipitates) or the Al content in the bulk alloy and its cor-rosion resistance [13,14,16,18,20,27,28]. A much smaller number ofresearchers have studied the characteristics of the thin passivatinglayers on the surface of the metal, which are formed in contact withthe atmosphere or in solutions of low aggressivity [1,3,4,29,30].
Metals normally oxidise rapidly when exposed to oxygen. How-ever, after just a short time (i.e. a few minutes), when a very thinoxide layer has formed, the reaction virtually ceases. Some time agoCabrera and Mott [31] attributed the formation of this film to theeffect of a strong electric field in the oxide associated with the pres-ence of oxygen ions adsorbed on the outer surface of the metal. In avery thin film the electric field is enormous, but as the film thickensthe effect of the electric field is reduced and the growth rate soonfalls to a very low value.
The thickness of the film formed in air on magnesium-basedmaterials is initially around 2–3 nm, and can slowly increase upto some 4–7 nm after months of exposure at room temperature[1,3,4,32]. The surface composition of this oxide film can changesignificantly during ambient storage. Extra layers of hydrated andcarbonated products of the magnesium oxide can be added tothe original oxide film [1,3,33]. An increase in water molecules in
the film has been reported for long ambient exposure times [29].Hydrophobic organic-matter can also be picked up from the atmo-sphere [3]. Changes have been observed in the film growth ratedepending on the nature of the compounds that form the film, e.g.the presence of a crystalline Mg(OH)2 after long exposure times [3].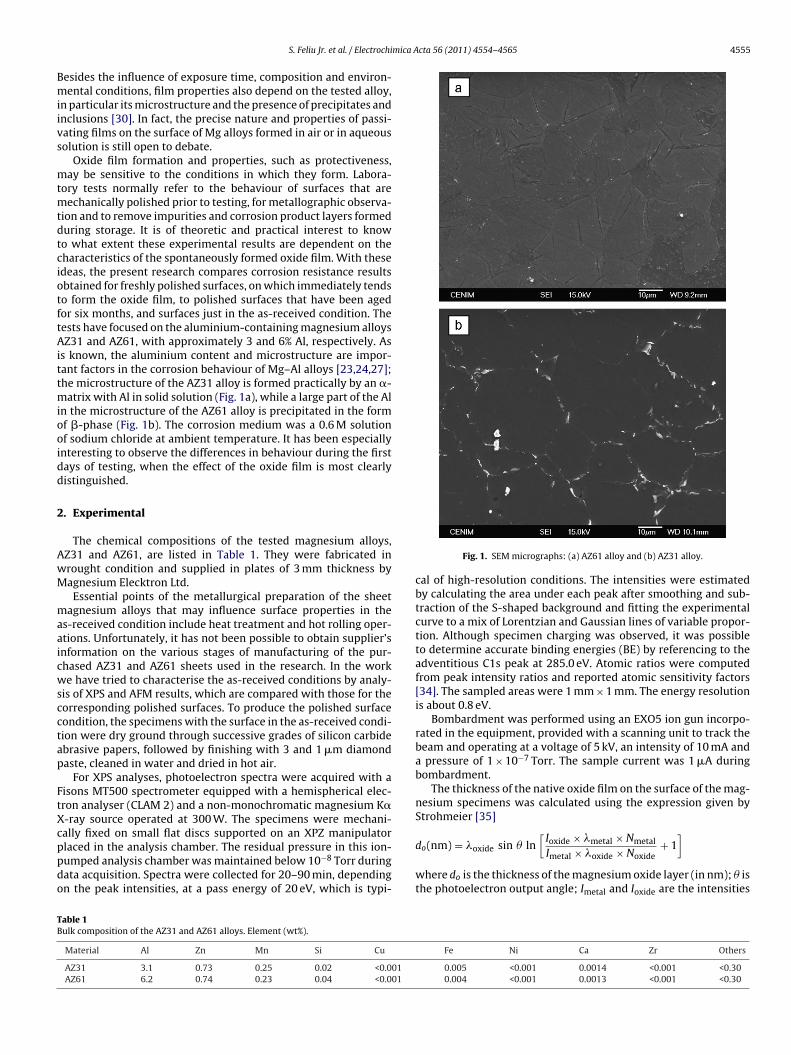
mica Acta 56 (2011) 4554–4565 4555
Bmiivs
mtmtdtciotftAittmiooidd
2
AwM
maaicwscctap
FtXcppdo
TB
S. Feliu Jr. et al. / Electrochi
esides the influence of exposure time, composition and environ-ental conditions, film properties also depend on the tested alloy,
n particular its microstructure and the presence of precipitates andnclusions [30]. In fact, the precise nature and properties of passi-ating films on the surface of Mg alloys formed in air or in aqueousolution is still open to debate.
Oxide film formation and properties, such as protectiveness,ay be sensitive to the conditions in which they form. Labora-
ory tests normally refer to the behaviour of surfaces that areechanically polished prior to testing, for metallographic observa-
ion and to remove impurities and corrosion product layers formeduring storage. It is of theoretic and practical interest to knowo what extent these experimental results are dependent on theharacteristics of the spontaneously formed oxide film. With thesedeas, the present research compares corrosion resistance resultsbtained for freshly polished surfaces, on which immediately tendso form the oxide film, to polished surfaces that have been agedor six months, and surfaces just in the as-received condition. Theests have focused on the aluminium-containing magnesium alloysZ31 and AZ61, with approximately 3 and 6% Al, respectively. As
s known, the aluminium content and microstructure are impor-ant factors in the corrosion behaviour of Mg–Al alloys [23,24,27];he microstructure of the AZ31 alloy is formed practically by an �-
atrix with Al in solid solution (Fig. 1a), while a large part of the Aln the microstructure of the AZ61 alloy is precipitated in the formf �-phase (Fig. 1b). The corrosion medium was a 0.6 M solutionf sodium chloride at ambient temperature. It has been especiallynteresting to observe the differences in behaviour during the firstays of testing, when the effect of the oxide film is most clearlyistinguished.
. Experimental
The chemical compositions of the tested magnesium alloys,Z31 and AZ61, are listed in Table 1. They were fabricated inrought condition and supplied in plates of 3 mm thickness byagnesium Elecktron Ltd.Essential points of the metallurgical preparation of the sheet
agnesium alloys that may influence surface properties in thes-received condition include heat treatment and hot rolling oper-tions. Unfortunately, it has not been possible to obtain supplier’snformation on the various stages of manufacturing of the pur-hased AZ31 and AZ61 sheets used in the research. In the worke have tried to characterise the as-received conditions by analy-
is of XPS and AFM results, which are compared with those for theorresponding polished surfaces. To produce the polished surfaceondition, the specimens with the surface in the as-received condi-ion were dry ground through successive grades of silicon carbidebrasive papers, followed by finishing with 3 and 1 �m diamondaste, cleaned in water and dried in hot air.
For XPS analyses, photoelectron spectra were acquired with aisons MT500 spectrometer equipped with a hemispherical elec-ron analyser (CLAM 2) and a non-monochromatic magnesium K�-ray source operated at 300 W. The specimens were mechani-
ally fixed on small flat discs supported on an XPZ manipulatorlaced in the analysis chamber. The residual pressure in this ion-umped analysis chamber was maintained below 10−8 Torr duringata acquisition. Spectra were collected for 20–90 min, dependingn the peak intensities, at a pass energy of 20 eV, which is typi-able 1ulk composition of the AZ31 and AZ61 alloys. Element (wt%).
Material Al Zn Mn Si Cu
AZ31 3.1 0.73 0.25 0.02 <0.001AZ61 6.2 0.74 0.23 0.04 <0.001
Fig. 1. SEM micrographs: (a) AZ61 alloy and (b) AZ31 alloy.
cal of high-resolution conditions. The intensities were estimatedby calculating the area under each peak after smoothing and sub-traction of the S-shaped background and fitting the experimentalcurve to a mix of Lorentzian and Gaussian lines of variable propor-tion. Although specimen charging was observed, it was possibleto determine accurate binding energies (BE) by referencing to theadventitious C1s peak at 285.0 eV. Atomic ratios were computedfrom peak intensity ratios and reported atomic sensitivity factors[34]. The sampled areas were 1 mm × 1 mm. The energy resolutionis about 0.8 eV.
Bombardment was performed using an EXO5 ion gun incorpo-rated in the equipment, provided with a scanning unit to track thebeam and operating at a voltage of 5 kV, an intensity of 10 mA anda pressure of 1 × 10⁻⁷ Torr. The sample current was 1 �A duringbombardment.
The thickness of the native oxide film on the surface of the mag-nesium specimens was calculated using the expression given byStrohmeier [35]
do(nm) = �oxide sin � ln[
Ioxide × �metal × Nmetal
Imetal × �oxide × Noxide+ 1
]
where do is the thickness of the magnesium oxide layer (in nm); � isthe photoelectron output angle; Imetal and Ioxide are the intensities
Fe Ni Ca Zr Others
0.005 <0.001 0.0014 <0.001 <0.300.004 <0.001 0.0013 <0.001 <0.30
4556 S. Feliu Jr. et al. / Electrochimica Acta 56 (2011) 4554–4565
Mg(OH)2
(a)
After 10 minutes
of sputtering
After 5 minutes
of sputtering
Non-sputtered
AZ61PAZ61OAZ31PAZ31O
Mg(OH)2 (d) Mg(OH)
2 (g) Mg(OH)2 (j)
MgAl2O
4
MgO (b)
Al2O
3
MgAl2O
4
MgO (e)
MgO
(h)
Al2O
3
MgO
(k)
540534528
(c)
540534528
(f)
540534528
(i)
Bi540534528
(l)
O1s peak
ys in
ofpaTr
gfpeea
a
Fig. 2. XPS MgO1s spectra of the AZ31 and AZ61 allo
f the magnesium components in the metallic state and as oxiderom the Mg 2p peak; �metal and �oxide are the mean free paths ofhotoelectrons in the substrate and the oxide layer; and Nm and No
re the volume densities of magnesium atoms in metal and oxide.he values of �metal and �oxide are 3.0 nm [36] and 2.6 nm [37,38],espectively, and an Nmetal/Noxide ratio of 1.24 was used [39].
For metallographic characterisation, the specimens were dryround through successive grades of silicon carbide abrasive papersrom P120 to P2000 followed by finishing with 0.1 �m diamondaste. The surface of the specimens was examined by scanning
lectron microscopy (SEM) using a JEOL JSM-6400 microscopequipped with Oxford Link energy-dispersive X-ray (EDX) micro-nalysis hardware.Images of the specimen surfaces were also obtained in originalnd polished condition using an atomic-force microscope (AFM).
nding energy/eV
the original (O) and polished (P) surface conditions.
All images (20 �m × 20 �m) were taken in the 5100 AFM/SPMfrom Agilent Technologies working in tapping mode using Si typeAFM cantilevers with a normal spring constant of 40 N/m anda typical radius of 10 nm from Applied Nanostructures. Imageswere acquired at a resolution of 512 × 512 points and subjectedto first-order flattening. After flattening, the RMS roughness (root-mean-squared roughness) was calculated.
Electrochemical impedance measurements were conducted in0.6 M NaCl for different times up to 28 days at room tempera-ture (∼25 ◦C) and pH 5.6, although the pH evolved freely during
the experiment. An AUTOLAB potentiostat, model PGSTAT30, withfrequency response analyser software was used. The frequencyranged from 100 kHz to 1 mHz with 5 points/decade, whereasthe amplitude of the sinusoidal potential signal was 10 mV withrespect to the open circuit potential. A typical three-electrode set-
S. Feliu Jr. et al. / Electrochimica Acta 56 (2011) 4554–4565 4557
(a)Mg2+ Mg2+
(d)
(b)
Mg2+
(g)Mg2+
(j)
After 10 minutes
of sputtering
After 5 minutes
of sputtering
AZ61PAZ61OAZ31PAZ31O
Non-sputtered
Mg2+
Mg2+
Mg0
(e)
Mg2+
Mg2+ (h) Mg0
Mg2+
(k)
Mg2+ (c)
B
52
Mg0
Mg2+
(f) (i) Mg0
Mg2+
(l)
Mg2p peak
ys in t
uaw
3
3
nos5[
565248 48
Fig. 3. XPS Mg2p spectra of the AZ31 and AZ61 allo
p was employed: Ag/AgCl and graphite were used as referencend counter electrodes, respectively, and the material under studyas the working electrode.
. Results
.1. Characterisation of the pre-existing oxide film
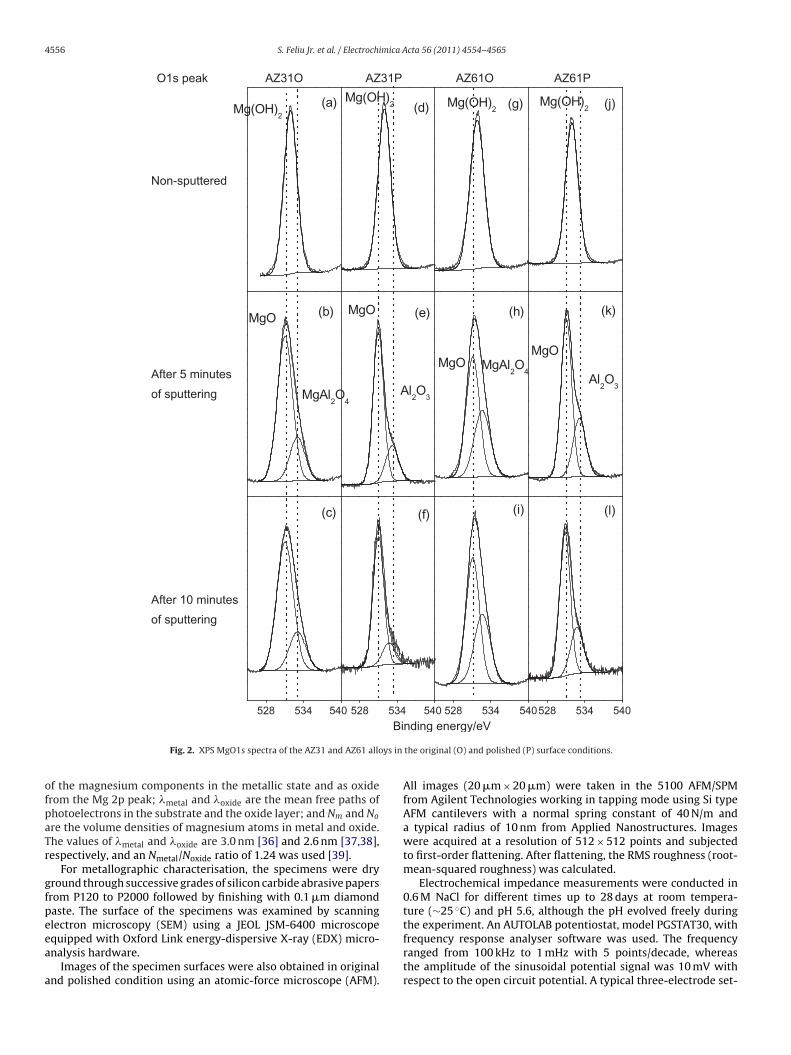
High-resolution O1s spectra of the oxide films formed sponta-
eously on AZ31 and AZ61 alloys are presented in Fig. 2. The spectrabtained on the non-sputtered surface (Fig. 2a, d, g and j) are fairlyimilar, containing one single component at a binding energy of32.2 eV associated with the presence of oxygen in hydroxide form1,3]. Fig. 2b, e, h, k, c, f, i and l shows the spectra obtained after 5inding energy/eV
56 565248 565248
he original (O) and polished (P) surface conditions.
and 10 min of sputtering. The most intense component, at a bind-ing energy of 531.2 eV, is associated with the presence of oxygen inthe form of magnesium oxide, MgO [2], and the less intense com-ponent, at a binding energy of 533.2 eV, could be attributed to thepresence of oxygen in the form of Al2O3 for the case of polishedsurfaces, or in the form of MgAl2O4 for surfaces in the as-receivedcondition [40]. The spectra obtained after 10 min of sputtering weresimilar to those acquired after 5 min.
The Mg2p high resolution XPS spectra obtained on the native
oxide film formed spontaneously on AZ31 and AZ61 alloys areshown in Fig. 3. For the non-sputtered surfaces (Fig. 3a, d, g andj) the spectra are fairly similar, containing one single component ata binding energy of 50.8 eV associated with the presence of magne-sium in the form of magnesium hydroxide in the case of polished
4558 S. Feliu Jr. et al. / Electrochimica Acta 56 (2011) 4554–4565
Table 2Atomic composition of the surface of the AZ31 and AZ61 alloys.
Time of sputtering(min)
% C % O % Mg % Al % Ca O/(Mg + Al) Al/(Mg + Al) × 100
Original surfaceAZ31 0 51 30 16 2 1 1.6 11
5 5 53 38 4 0 1.25 1010 4 52 38 6 0 1.2 14
AZ61 0 65 21 10 3 1 1.6 235 11 55 26 8 0 1.6 24
10 5 56 28 11 0 1.4 28
Polished surfaceAZ31 0 51 35 12 2 0 2.5 14
5 0 41 54 5 0 0.7 810 0 18 75 6 0 0.2 7
3 0 3 198 0 0.9 15
11 0 0.3 14
saosipemOncdca
aibesIstctit
s1fittste
acotmpgoti
Table 3Thickness of the air formed oxide film on polished specimens.
to fit the experimental spectra. The equivalent circuit depicted inFig. 6 served to obtain the parameters of the RHF–CPE capacitivearc. The non-ideal capacitive behaviour is represented by the CPE,which depends on the frequency independent parameters Q and n,in accordance with the impedance function CPE = Q−1(jω)−n.
Table 4Roughness values obtained with atomic force microscope. The values are average offour determinations.
Specimens RMS (nm)
Original surface
AZ61 0 37 47 135 0 46 46
10 0 21 68
urfaces, or perhaps in the form also of MgAl2O4 for surfaces in thes-received condition [40,41]. Fig. 3b, e, h and k shows the spectrabtained after 5 min of AIB. The spectrum observed on the polishedurface of AZ31 alloy (Fig. 3e) shows two components of similarntensity, one at a binding energy of 48.6 eV associated with theresence of magnesium in metallic state and another at a bindingnergy of 50.8 eV which may be associated with the presence ofagnesium in the form of magnesium oxide (demonstrated by the1s peak, Fig. 2e). On the polished AZ61 alloy (Fig. 3k), it should beoted the lower intensity of the metallic magnesium signal whenompared with that of the Mg2+. This result is interpreted as beingue to the greater thickness of the native oxide film in this lastase. The spectra obtained after 10 min of sputtering on the AZ31nd AZ61 polished surfaces were fairly similar (Fig. 3f and l).
Table 2 gives the element composition obtained by XPS on thes-received and polished surfaces of the AZ31 and AZ61 alloys andts variation with sputtering time. Among the various differencesetween these two surface states, attention is drawn to the pres-nce of a significant amount of calcium on the original (as-received)urfaces of both alloys which disappears after surface polishing.n general, 5 min of sputtering (shortest sputtering time tested) iseen to be sufficient to remove the calcium content detected onhe original alloy surfaces. This calcium probably forms part of theomposition of mixed oxides and carbonates in the outermost stra-um of the oxide film. It might come from the calcium present as anmpurity in the bulk alloy (Table 1) [40,41] or be an impurity fromhe processing of the magnesium alloy sheets.
The O/(Mg + Al) atomic ratios obtained on the non-sputteredurface of the original AZ31 and AZ61 alloys reach values close to.6 (Table 2), which tends to suggest the possibility that the outerlm is mainly formed by Mg(OH)2. On the non-sputtered surface ofhe polished alloys this ratio reaches values of close to 3. The spon-aneous formation of magnesium carbonate on the freshly polishedurfaces presumably accounts for this increase. After 5 min of sput-ering, significant amounts of aluminium appear in the oxide film,specially with the AZ61 alloy.
On the sputtered surface of the polished AZ31 and AZ61 alloys,considerable increase in the magnesium content is seen to coin-
ide with a decrease in the oxygen content (Table 2). Five minutesf sputtering is sufficient to remove the significant carbon con-ent detected on the surface of the alloys. The thin outer film of
agnesium oxides formed as a result of the polishing process is
robably uniform, homogeneous and continuous. In contrast, noreat variation in the magnesium or oxygen contents is detectedn the original surface of the AZ31 and AZ61 alloys when the sput-ering time is raised from 5 to 10 min, and the presence of carbons noted after 10 min of sputtering. These results tend to suggestMaterial Film thickness (nm)
AZ31 3.2AZ61 5.1
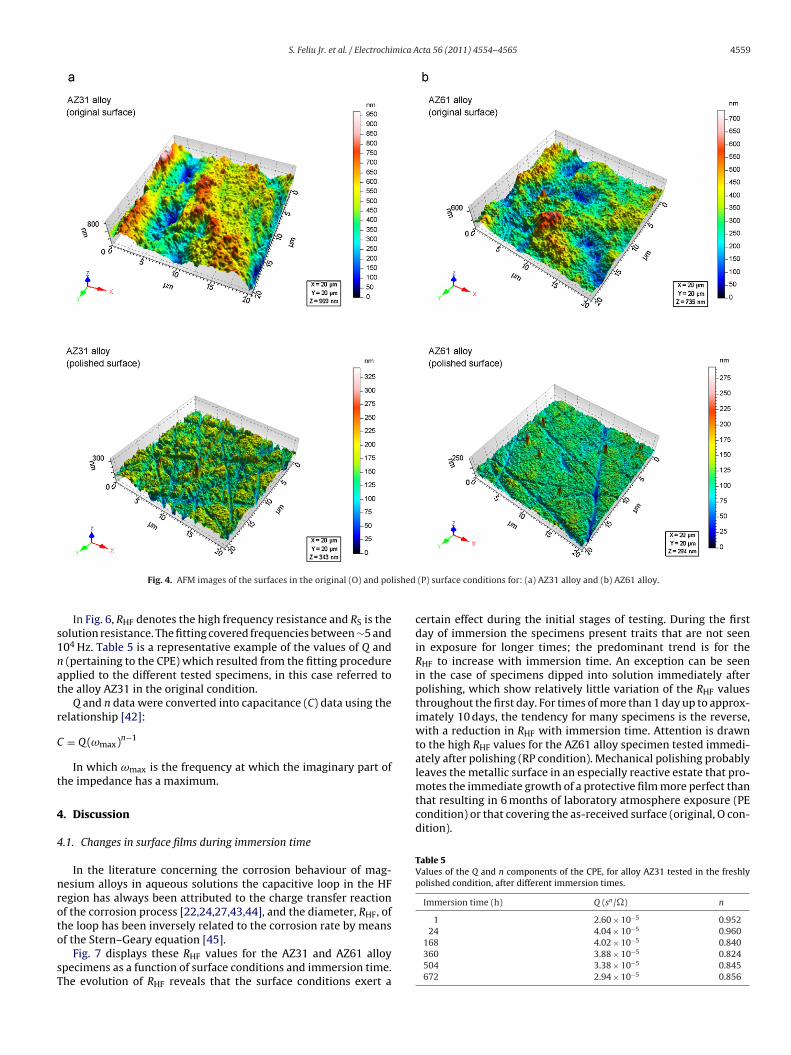
that the external oxide film resulting from the fabrication of thewrought alloys has a non-uniform distribution (e.g., in the formof islands) over the alloy surface and is discontinuous and porous.AFM images (Fig. 4) tend to support this interpretation.
From XPS determinations of oxide film thickness the superficialfilm formed on the polished AZ61 alloy is some 2 nm thicker than onthe AZ31 alloy (Table 3). On the other hand, the presence of a coarsediscontinuous outer layer of magnesium and aluminium oxides onthe original surface of the AZ31 and AZ61 alloys has prevented inthis case to make similar estimates of native oxide film thickness.
As Table 4 shows, the roughness values of the specimens inthe original conditions are about seven times greater than in thepolished condition. Nanometric scale details of the typical surfaceroughness exhibited by the tested specimens are given in Fig. 4.
3.2. Electrochemical impedance measurements
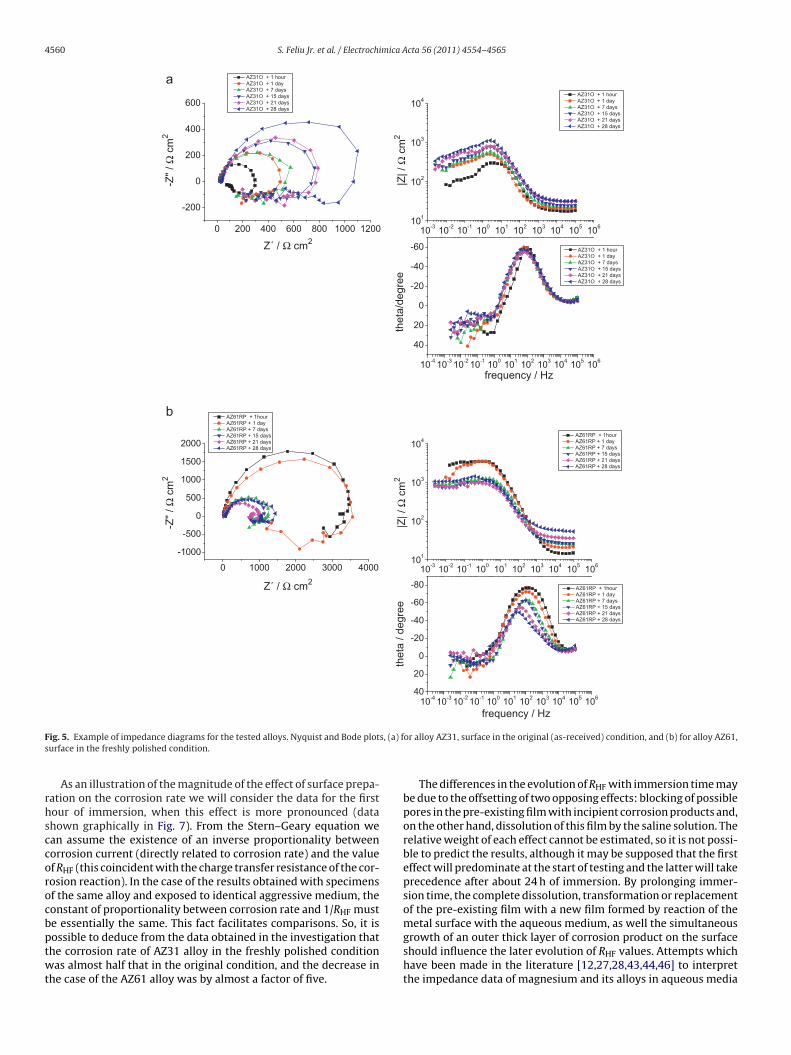
The evolution of the corrosion process has been monitored bymeans of impedance measurements (Fig. 5) with the specimensimmersed in 0.6 M NaCl solution. Bode plots of the phase angleı show the existence of two time constants, which in the Nyquistdiagrams mean the presence of a capacitive loop at high frequencies(HF) and an inductive loop at low frequencies (LF), Fig. 5.
Since there is some impedance frequency dispersion behaviourin the measurements, a constant phase element (CPE) was used
AZ31 197.9AZ61 116.2After polishingAZ31 29.1AZ61 17.1
S. Feliu Jr. et al. / Electrochimica Acta 56 (2011) 4554–4565 4559
lished
s1nat
r
C
t
4
4
nroto
sT
leaves the metallic surface in an especially reactive estate that pro-motes the immediate growth of a protective film more perfect thanthat resulting in 6 months of laboratory atmosphere exposure (PEcondition) or that covering the as-received surface (original, O con-dition).
Table 5Values of the Q and n components of the CPE, for alloy AZ31 tested in the freshlypolished condition, after different immersion times.
Immersion time (h) Q (sn/�) n
1 2.60 × 10⁻⁵ 0.952
Fig. 4. AFM images of the surfaces in the original (O) and po
In Fig. 6, RHF denotes the high frequency resistance and RS is theolution resistance. The fitting covered frequencies between ∼5 and04 Hz. Table 5 is a representative example of the values of Q and(pertaining to the CPE) which resulted from the fitting procedure
pplied to the different tested specimens, in this case referred tohe alloy AZ31 in the original condition.
Q and n data were converted into capacitance (C) data using theelationship [42]:
= Q (ωmax)n−1
In which ωmax is the frequency at which the imaginary part ofhe impedance has a maximum.
. Discussion
.1. Changes in surface films during immersion time
In the literature concerning the corrosion behaviour of mag-esium alloys in aqueous solutions the capacitive loop in the HFegion has always been attributed to the charge transfer reactionf the corrosion process [22,24,27,43,44], and the diameter, RHF, of
he loop has been inversely related to the corrosion rate by meansf the Stern–Geary equation [45].Fig. 7 displays these RHF values for the AZ31 and AZ61 alloypecimens as a function of surface conditions and immersion time.he evolution of RHF reveals that the surface conditions exert a
(P) surface conditions for: (a) AZ31 alloy and (b) AZ61 alloy.
certain effect during the initial stages of testing. During the firstday of immersion the specimens present traits that are not seenin exposure for longer times; the predominant trend is for theRHF to increase with immersion time. An exception can be seenin the case of specimens dipped into solution immediately afterpolishing, which show relatively little variation of the RHF valuesthroughout the first day. For times of more than 1 day up to approx-imately 10 days, the tendency for many specimens is the reverse,with a reduction in RHF with immersion time. Attention is drawnto the high RHF values for the AZ61 alloy specimen tested immedi-ately after polishing (RP condition). Mechanical polishing probably
24 4.04 × 10⁻⁵ 0.960168 4.02 × 10⁻⁵ 0.840360 3.88 × 10⁻⁵ 0.824504 3.38 × 10⁻⁵ 0.845672 2.94 × 10⁻⁵ 0.856
4560 S. Feliu Jr. et al. / Electrochimica Acta 56 (2011) 4554–4565
0 200 400 600 800 1000 1200
-200
0
200
400
600
-Z"
/ Ω c
m2
Z´ / Ω cm2
Z´ / Ω cm2
AZ31O + 1 hour AZ31O + 1 day AZ31O + 7 days AZ31O + 15 days AZ31O + 21 days AZ31O + 28 days
10-3 10-2 10-1 100 101 102 103 104 105 106101
102
103
104
|Z| /
Ω c
m2
-Z"
/ Ω c
m2
|Z| /
Ω c
m2
AZ31O + 1 hour AZ31O + 1 day AZ31O + 7 days AZ31O + 15 days AZ31O + 21 days AZ31O + 28 days
-60
-40
-20
0
20
40
10-4 10-3 10-2 10-1 100 101 102 103 104 105 106
frequency / Hz
thet
a/de
gree
AZ31O + 1 hour AZ31O + 1 day AZ31O + 7 days AZ31O + 15 days AZ31O + 21 days AZ31O + 28 days
a
0 1000 2000 3000 4000
-1000
-500
0
500
1000
1500
2000
AZ61RP + 1hour AZ61RP + 1 day AZ61RP + 7 days AZ61RP + 15 days AZ61RP + 21 days AZ61RP + 28 days
10-3 10-2 10-1 100 101 102 103 104 105 106101
102
103
104 AZ61RP + 1hour AZ61RP + 1 day AZ61RP + 7 days AZ61RP + 15 days AZ61RP + 21 days AZ61RP + 28 days
-80
-60
-40
-20
0
20
4010-4 10-3 10-2 10-1 100 101 102 103 104 105 106
thet
a / d
egre
e
AZ61RP + 1hour AZ61RP + 1 day AZ61RP + 7 days AZ61RP + 15 days AZ61RP + 21 days AZ61RP + 28 days
b
F s, (a) fs
rhsccorocbptwt
ig. 5. Example of impedance diagrams for the tested alloys. Nyquist and Bode ploturface in the freshly polished condition.
As an illustration of the magnitude of the effect of surface prepa-ation on the corrosion rate we will consider the data for the firstour of immersion, when this effect is more pronounced (datahown graphically in Fig. 7). From the Stern–Geary equation wean assume the existence of an inverse proportionality betweenorrosion current (directly related to corrosion rate) and the valuef RHF (this coincident with the charge transfer resistance of the cor-osion reaction). In the case of the results obtained with specimensf the same alloy and exposed to identical aggressive medium, theonstant of proportionality between corrosion rate and 1/RHF must
e essentially the same. This fact facilitates comparisons. So, it isossible to deduce from the data obtained in the investigation thathe corrosion rate of AZ31 alloy in the freshly polished conditionas almost half that in the original condition, and the decrease inhe case of the AZ61 alloy was by almost a factor of five.
frequency / Hz
or alloy AZ31, surface in the original (as-received) condition, and (b) for alloy AZ61,
The differences in the evolution of RHF with immersion time maybe due to the offsetting of two opposing effects: blocking of possiblepores in the pre-existing film with incipient corrosion products and,on the other hand, dissolution of this film by the saline solution. Therelative weight of each effect cannot be estimated, so it is not possi-ble to predict the results, although it may be supposed that the firsteffect will predominate at the start of testing and the latter will takeprecedence after about 24 h of immersion. By prolonging immer-sion time, the complete dissolution, transformation or replacementof the pre-existing film with a new film formed by reaction of the
metal surface with the aqueous medium, as well the simultaneousgrowth of an outer thick layer of corrosion product on the surfaceshould influence the later evolution of RHF values. Attempts whichhave been made in the literature [12,27,28,43,44,46] to interpretthe impedance data of magnesium and its alloys in aqueous media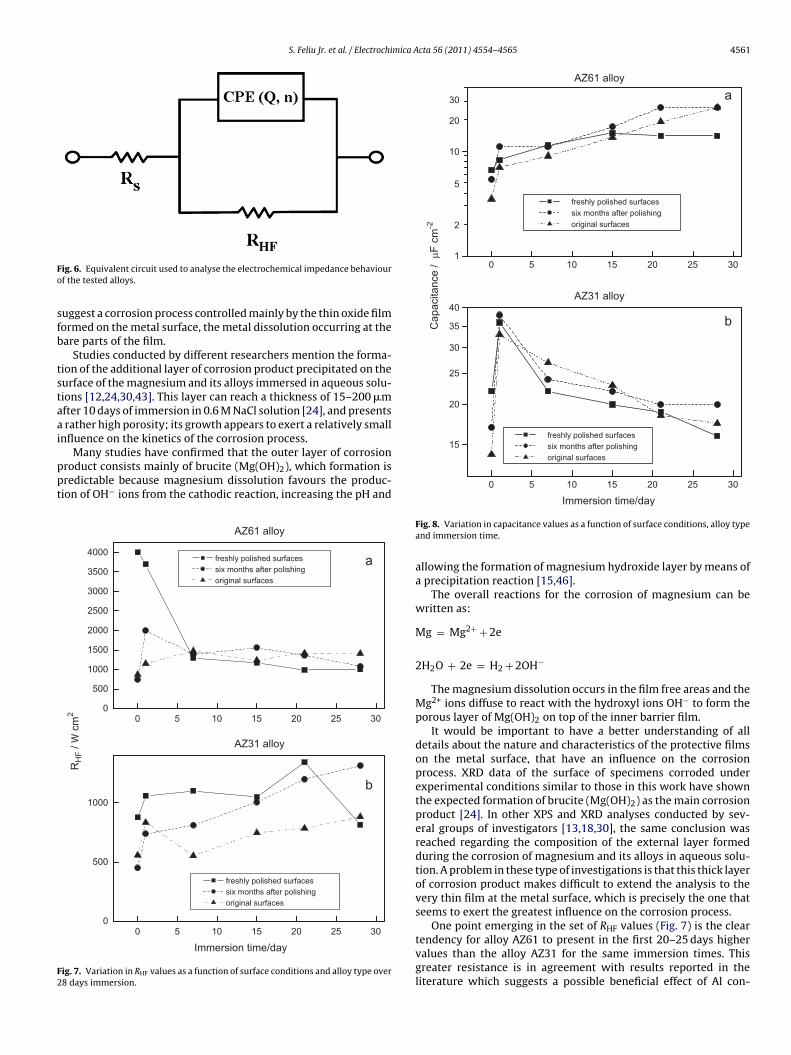
S. Feliu Jr. et al. / Electrochimica Acta 56 (2011) 4554–4565 4561
Fo
sfb
tstaai
ppt
F2
20
25
30
35
40
bCap
acita
nce
/ µF
cm
-2 freshly polished surfaces
3025201510501
30
20
10
5
AZ31 alloy
freshly polished surfaces six months after polishing
original surfaces
AZ61 alloy
a
2
ig. 6. Equivalent circuit used to analyse the electrochemical impedance behaviourf the tested alloys.
uggest a corrosion process controlled mainly by the thin oxide filmormed on the metal surface, the metal dissolution occurring at theare parts of the film.
Studies conducted by different researchers mention the forma-ion of the additional layer of corrosion product precipitated on theurface of the magnesium and its alloys immersed in aqueous solu-ions [12,24,30,43]. This layer can reach a thickness of 15–200 �mfter 10 days of immersion in 0.6 M NaCl solution [24], and presentsrather high porosity; its growth appears to exert a relatively small
nfluence on the kinetics of the corrosion process.
Many studies have confirmed that the outer layer of corrosionroduct consists mainly of brucite (Mg(OH)2), which formation isredictable because magnesium dissolution favours the produc-ion of OH− ions from the cathodic reaction, increasing the pH and
3025201510500
500
1000
b
Immersion time/day
freshly polished surfaces six months after polishing original surfaces
3025201510500
500
1000
1500
2000
2500
3000
3500
4000
AZ31 alloy
RH
F / W
cm
2
freshly polished surfaces six months after polishing original surfaces
AZ61 alloy
a
ig. 7. Variation in RHF values as a function of surface conditions and alloy type over8 days immersion.
302520151050
15 six months after polishing original surfaces
Immersion time/day
Fig. 8. Variation in capacitance values as a function of surface conditions, alloy typeand immersion time.
allowing the formation of magnesium hydroxide layer by means ofa precipitation reaction [15,46].
The overall reactions for the corrosion of magnesium can bewritten as:
Mg = Mg2+ + 2e
2H2O + 2e = H2 + 2OH−
The magnesium dissolution occurs in the film free areas and theMg2+ ions diffuse to react with the hydroxyl ions OH− to form theporous layer of Mg(OH)2 on top of the inner barrier film.
It would be important to have a better understanding of alldetails about the nature and characteristics of the protective filmson the metal surface, that have an influence on the corrosionprocess. XRD data of the surface of specimens corroded underexperimental conditions similar to those in this work have shownthe expected formation of brucite (Mg(OH)2) as the main corrosionproduct [24]. In other XPS and XRD analyses conducted by sev-eral groups of investigators [13,18,30], the same conclusion wasreached regarding the composition of the external layer formedduring the corrosion of magnesium and its alloys in aqueous solu-tion. A problem in these type of investigations is that this thick layerof corrosion product makes difficult to extend the analysis to thevery thin film at the metal surface, which is precisely the one thatseems to exert the greatest influence on the corrosion process.
One point emerging in the set of RHF values (Fig. 7) is the cleartendency for alloy AZ61 to present in the first 20–25 days highervalues than the alloy AZ31 for the same immersion times. Thisgreater resistance is in agreement with results reported in theliterature which suggests a possible beneficial effect of Al con-
4562 S. Feliu Jr. et al. / Electrochimica Acta 56 (2011) 4554–4565
3002001000 4002000 9006003000
4002000 6004002000 9006003000
6004002000 8006004002000 10005000
6003000 9006003000 10005000
8004000 10000 10005000
10005000
-Z"
/ Ω c
m2
10005000
Z´ / Ω cm2
10005000
28 d
21 d
15 d
7 d
1 d
AZ31RPAZ31PEAZ31O
1h
a
F ion tim
ts[autosvttswh
btm
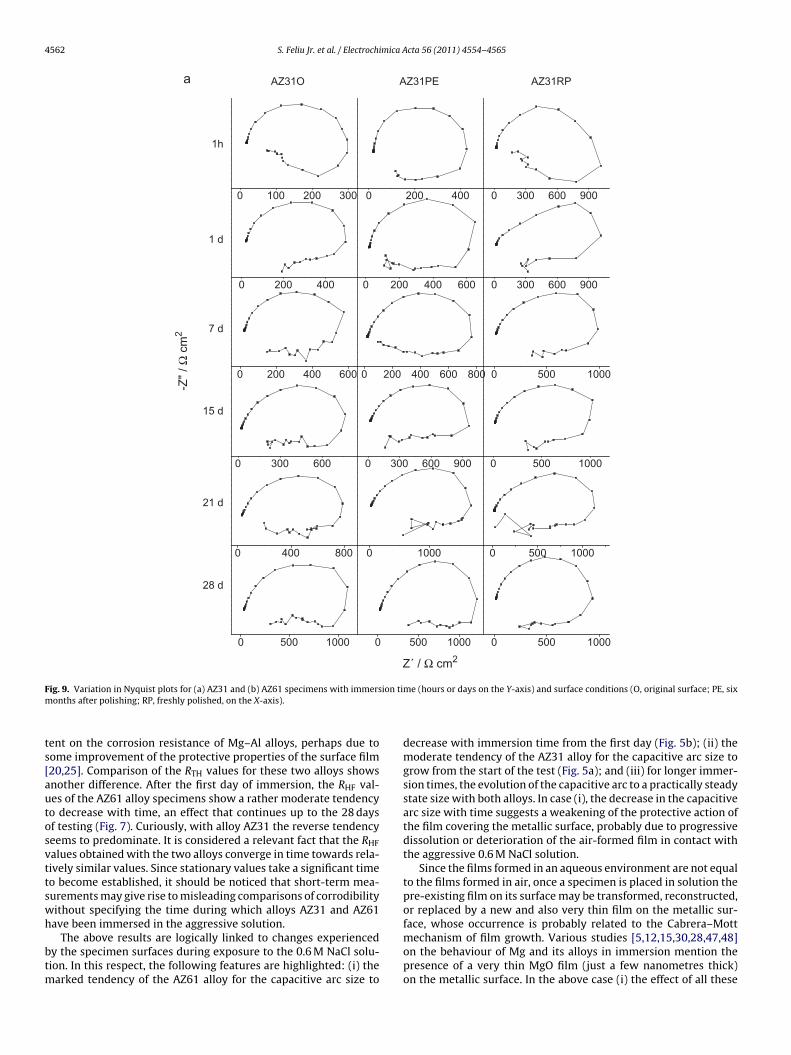
ig. 9. Variation in Nyquist plots for (a) AZ31 and (b) AZ61 specimens with immersonths after polishing; RP, freshly polished, on the X-axis).
ent on the corrosion resistance of Mg–Al alloys, perhaps due toome improvement of the protective properties of the surface film20,25]. Comparison of the RTH values for these two alloys showsnother difference. After the first day of immersion, the RHF val-es of the AZ61 alloy specimens show a rather moderate tendencyo decrease with time, an effect that continues up to the 28 daysf testing (Fig. 7). Curiously, with alloy AZ31 the reverse tendencyeems to predominate. It is considered a relevant fact that the RHFalues obtained with the two alloys converge in time towards rela-ively similar values. Since stationary values take a significant timeo become established, it should be noticed that short-term mea-urements may give rise to misleading comparisons of corrodibilityithout specifying the time during which alloys AZ31 and AZ61
ave been immersed in the aggressive solution.The above results are logically linked to changes experiencedy the specimen surfaces during exposure to the 0.6 M NaCl solu-ion. In this respect, the following features are highlighted: (i) the
arked tendency of the AZ61 alloy for the capacitive arc size to
me (hours or days on the Y-axis) and surface conditions (O, original surface; PE, six
decrease with immersion time from the first day (Fig. 5b); (ii) themoderate tendency of the AZ31 alloy for the capacitive arc size togrow from the start of the test (Fig. 5a); and (iii) for longer immer-sion times, the evolution of the capacitive arc to a practically steadystate size with both alloys. In case (i), the decrease in the capacitivearc size with time suggests a weakening of the protective action ofthe film covering the metallic surface, probably due to progressivedissolution or deterioration of the air-formed film in contact withthe aggressive 0.6 M NaCl solution.
Since the films formed in an aqueous environment are not equalto the films formed in air, once a specimen is placed in solution thepre-existing film on its surface may be transformed, reconstructed,or replaced by a new and also very thin film on the metallic sur-
face, whose occurrence is probably related to the Cabrera–Mottmechanism of film growth. Various studies [5,12,15,30,28,47,48]on the behaviour of Mg and its alloys in immersion mention thepresence of a very thin MgO film (just a few nanometres thick)on the metallic surface. In the above case (i) the effect of all these
S. Feliu Jr. et al. / Electrochimica Acta 56 (2011) 4554–4565 4563
10005000 8004000 300015000
200010000 200010000 300015000
150010005000
b
28 d
21 d
15 d
7 d
1 d
1h
AZ61RPAZ61PEAZ61O
12006000 12008004000
10005000 12006000 12006000
1500010005000 1000500 10005000
10005000 100005000 15001000500
-Z"
/ Ω c
m2
2
(Cont
ptitatarttptoa1tbpf
Fig. 9.
ossible processes obviously cannot compensate the weakening ofhe protective action of the film. In case (ii), the increased capac-tive arc size with immersion time suggests a reinforcement ofhe protective action of the films coating the metallic surface. Onlloy AZ31 the initial film may be less protective and its effect onhe specimen’s behaviour will tend to disappear relatively quickly;leading role may soon be taken by the new films formed as a
esult of the reaction with the aqueous medium, whose consolida-ion and growth must be attributed responsibility for the moderateendency for the capacitive arc size to increase. In case (iii) theractical equalling of the arcs corresponding to the different ini-ial surface conditions with immersion time suggests the evolutionf the specimens towards states of similar surface constitution andctivity. When the immersion time increases from approximately
0 days to 28 days (maximum immersion time), the RHF value tendso a steady state value, which reflects the attainment of a dynamicalance between the corrosion and continuous film reconstructionrocesses; the drop in RHF values for alloy AZ61 and the increaseor alloy AZ31 with immersion time resulting in o a notable recon-Z´ / Ω cm
inued ).
ciliation of the points corresponding to both alloys after about 20days.
4.2. Capacitance values
Fig. 8 displays the capacitance values associated with the capac-itive loop of the impedance diagrams. Comparing the graphs foralloys AZ31 and AZ61, it can be seen that these capacitance val-ues in the first 24 h of immersion are clearly higher in the caseof the AZ31 alloy specimens than for AZ61. Subsequently, overthe next 15 days, the capacitance values continue to be greaterfor AZ31, though tending to decrease, while the values for AZ61tend to increase gradually, so that the values for both alloys con-verge on practically similar capacitance values. After 15–20 days,
the capacitance values for all the tested specimens are groupedaround 15–20 �F/cm2.The higher initial values of capacitance for alloy AZ31 comparedwith those for alloy AZ61 (Fig. 8) suggest either the presence ofthinner films, according to the inverse relationship between capac-
4 mica A
idasncsr[
4
amttNit
lsoprsa
iac
adtipibw
5
(
(
(
[[
[[[[[[[[[[[[
[
[
[
[[[[
[[
[[
[[[
[
[
[
[
[[[[
564 S. Feliu Jr. et al. / Electrochi
tance and film thickness of the flat capacitor formula [46], or moreefective films which leaves a greater fraction of metallic surfacerea in contact with the electrolyte [49]. Curiously, despite the con-iderably different values of surface roughness (Fig. 3 and Table 4),o significant differences in capacitance have been observed whenomparing the capacitance values for the as-received and polishedurfaces (Fig. 8). The complex relationship that can exist betweenoughness and true surface area could perhaps explain this fact50–52].
.3. Inductive loop
As already commented, the impedance diagrams in this studyre characterised by a capacitive loop at HF followed by a well-arked inductive loop at LF. Elucidating the precise nature of
he inductive loop seems rather complicated and is of no prac-ical relevance with regard to information on the corrosion rate.evertheless, the repeated presence of an inductive loop in the
mpedance diagrams obtained in this work merits some atten-ion.
Numerous examples of such inductive loops can be found in theiterature. An inductive effect may be explained by different rea-ons. It is normally related with the adsorption of active speciesn the metallic surface, whose coverage depends on the electrodeotential variations during the measurements [53–55]. In the cor-osion of magnesium and its alloys, where Mg2+ ion productioneems to occur in two steps, the intermediate Mg+ should be thedsorbed specie [43–46].
The notable size of the inductive loops in this work may be seenn Fig. 9. Their size seems to be related somehow with the RHF valuend, therefore, with the surface activity of the specimens in theorrosive medium.
Immersion time has also been seen to have an effect on the rel-tive size of the inductive loop. If the loop size is expressed as theiameter of the semicircle that fits it, and ı is the ratio betweenhe diameters of the inductive and capacitive loops, after 2 h ofmmersion ı values of the order of 0.7–0.8 have been obtained withractically all the tested alloys and surface conditions. At longer
mmersion times, between 1 and 28 days, the ı ratio continues toe of the order of 0.7–0.8 for alloy AZ31 but decreases significantlyith alloy AZ61 to approximately 0.3–0.4.
. Conclusions
1) The corrosion behaviour of magnesium alloys AZ31 and AZ61in several initial surface conditions has been studied by theEIS technique, specially trying to relate the experimental cir-cumstances of the oxide film formation in the air with thesubsequent behaviour of the alloys immersed in 0.6 M NaClsolution. A certain effect of initial surface conditions is observedonly in the early stages of the test. Attention is drawn to thehigh capacitive loop diameter values (RHF) of the Nyquist dia-grams in the case of the specimens tested immediately aftermechanical polishing, compared to those tested after 6 monthsof exposure laboratory ambient, or in the as-received condition.After an initial period which does not last for more than about7 days, no effect attributable to the initial surface condition ofthe specimens is generally seen.
2) With regard to the effect of the alloy type, in the first days ofimmersion a tendency of alloy AZ61 to show the highest RHFvalues (lower corrosion rates) is observed. After 15 days of test-
ing the differences between the impedance diagrams of alloysAZ61 and AZ31 are notably smaller, although the AZ61 alloycontinues to show the largest RHF values.3) A clear effect of the alloy type but not of the surface conditionon the capacitance values has been shown. Attention is also
[
[[
[
cta 56 (2011) 4554–4565
drawn to the different behaviours of the AZ31 and AZ61 alloyswith regard to the inductive loop.
Acknowledgment
We wish to express our gratitude to Prof. S. Feliu for several clar-ifying and stimulating discussions during the course of this work.Also, the authors gratefully acknowledge the financial support forthis work from the Ministry of Science and Innovation of Spain(MAT 2009-13530).
References
[1] V. Fournier, P. Marcus, I. Olefjord, Surf. Interface Anal. 34 (2002) 494.[2] J. Kim, K.C. Wong, P.C. Wong, S.A. Kulinich, J.B. Metson, K.A.R. Mitchell, Appl.
Surf. Sci. 253 (2007) 4197.[3] C. Fotea, J. Callaway, M.R. Alexander, Surf. Interface Anal. 38 (2006) 1363.[4] N.S. McIntyre, C. Chen, Corros. Sci. 40 (1998) 1697.[5] J.H. Nordlien, S. Ono, N. Masuko, K. Nisancioglu, Corros. Sci. 39 (1997) 1397.[6] S.J. Splinter, N.S. McIntyre, Surf. Sci. 314 (1994) 157.[7] R. Lindström, J.-E. Svensson, L.-G. Johansson, J. Electrochem. Soc. 149 (2002)
B103.[8] R. Lindström, L.-G. Johansson, G.-E. Thompson, P. Skeldon, J.E. Svensson, Corros.
Sci. 46 (2004) 1141.[9] M. Jönsson, D. Persson, R. Gubner, J. Electrochem. Soc. 154 (2007) C684.10] M. Jönsson, D. Persson, D. Thierry, Corros. Sci. 49 (2007) 1540.11] J.H. Nordlien, S. Ono, N. Masuko, K. Nisancioglu, J. Electrochem. Soc. 142 (1995)
3320.12] G. Baril, N. Pebere, Corros. Sci. 43 (2001) 471.13] G. Ballerini, U. Bardi, R. Bignucolo, G. Ceraolo, Corros. Sci. 47 (2005) 2173.14] G. Song, A. Atrens, X.L. Wu, B. Zhang, Corros. Sci. 40 (1998) 1769.15] G. Song, A. Atrens, D. Stjohn, J. Naim, Y. Li, Corros. Sci. 39 (1997) 855.16] G. Song, A. Atrens, M. Dargusch, Corros. Sci. 41 (1999) 249.17] R. Lindström, L.-G. Johansson, J.-E. Svensson, Mater. Corros. 54 (2003) 587.18] R Ambat, N.N. Aung, W. Zhou, Corros. Sci. 42 (2000) 1433.19] S. Mathieu, C. Rapin, J. Steinmetz, P. Steinmetz, Corros. Sci. 45 (2003) 2741.20] G. Song, A. Atrens, Adv. Eng. Mater. 1 (1999) 11.21] G. Song, A. Atrens, Adv. Eng. Mater. 9 (2007) 177.22] G.L. Makar, J. Kruger, J. Electrochem. Soc. 137 (1990) 414.23] A. Pardo, M.C. Merino, A.E. Coy, R. Arrabal, F. Viejo, E. Matykina, Corros. Sci. 50
(2008) 823.24] A. Pardo, M.C. Merino, A.E. Coy, F. Viejo, R. Arrabal, S. Feliu Jr., Electrochim. Acta
53 (2008) 7890.25] J.H. Nordlien, K. Nisancioglu, S. Ono, N. Masuko, J. Electrochem. Soc. 143 (1996)
2564.26] J.H. Nordlien, K. Nisancioglu, S. Ono, N. Masuko, J. Electrochem. Soc. 144 (1997)
461.27] S. Mathieu, C. Rapin, J. Hazan, P. Steinmetz, Corros. Sci. 44 (2002) 2737.28] G. Galicia, N. Pebere, B. Tribollet, V. Vivier, Corros. Sci. 51 (2009) 1789.29] C. Chen, S.J. Splinter, T. Do, N.S. McIntyre, Surf. Sci. 382 (1997) L652.30] M. Santamaria, F. Di Quarto, S. Zanna, P. Marcus, Electrochim. Acta 53 (2007)
1314.31] N. Cabrera, N.F. Mott, Rep. Prog. Phys. 12 (1948) 163.32] S. Feliu Jr., M.C. Merino, R. Arrabal, A.E. Coy, E. Matykina, Surf. Interface Anal.
41 (2009) 143.33] M. Jönsson, D. Persson, C. Leygraf, Corros. Sci. 50 (2008) 1406.34] C.D. Wagner, L.E. Davis, M.V. Zeller, J.A. Taylor, R.H. Raymond, L.H. Gale, Surf.
Interface Anal. 3 (1981) 211.35] B.R. Strohmeier, Surf. Interface Anal. 15 (1990) 51.36] S. Tanuma, C.J. Powell, D.R. Penn, Surf. Interface Anal. 17 (1991) 911.37] A. Akkerman, T. Boutboul, A. Breskin, R. Chechik, A. Gibrekhterman, Y. Lifshitz,
Phys. Stat. Sol (B) 198 (1996) 769.38] C.J. Powell, A. Jablonski, NIST Electron Inelastic-Mean-Free-Path Database, SRD
71, US Departament of Commerce, National Institute of Standards and Tech-nology, Gaithersburg, MD, 2000.
39] M. Liu, S. Zanna, H. Ardelean, I. Frateur, P. Schmutz, G. Song, A. Atrens, P. Marcus,Corros. Sci. 51 (2009) 1115.
40] S. Feliu Jr., C. Maffiotte, J.C. Galván, A. Pardo, M.C. Merino, R. Arrabal, Open Surf.Sci. J. 3 (2011) 1.
41] S. Feliu Jr., J.C. Galván, A. Pardo, M.C. Merino, R. Arrabal, Open Corros. J. 3 (2010)80.
42] C.H. Hsu, F. Mansfeld, Corrosion 57 (2001) 747.43] N. Pebere, C. Riera, F. Dabosi, Electrochim. Acta 35 (1990) 555.44] G. Song, A. Atrens, D.St. John, X. Wu, J. Nairn, Corros. Sci. 39 (1997) 1981.45] M. Stern, A.L. Geary, J. Electrochem. Soc. 104 (1957) 56.
46] G. Baril, G. Galicia, C. Deslouis, N. Pebere, B. Tribollet, V. Vivier, J. Electrochem.Soc. 154 (2007) C108.47] N. Hara, Y. Kobayashi, D. Kagaya, N. Akao, Corros. Sci. 49 (2007) 166.48] M. Liu, P. Schmutz, S. Zanna, A. Seyeux, H. Ardelean, G. Song, A. Atrens, P. Marcus,
Corros. Sci. 52 (2010) 562.49] V. Barranco, S. Feliu Jr., S. Feliu, Corros. Sci. 46 (2004) 2221.

[
[[
S. Feliu Jr. et al. / Electrochimica A
50] M.G. Donoso, A. Méndez-Vilas, J.M. Bruque, M.L. González-Martín, Int. Biodeter.Biodegr. 59 (2007) 245.
51] R.D. Armstrong, R.A. Burnham, J. Electroanal. Chem. 72 (1976) 257.52] U. Rammelt, G. Reinhard, Corros. Sci. 27 (1987) 373.
[
[[
cta 56 (2011) 4554–4565 4565
53] I. Epelboin, C. Gabrielli, M. Keddam, H. Takenouti, Electrochim. Acta 20 (1975)913.
54] W.J. Lorenz, F. Mansfeld, Corros. Sci. 21 (1981) 647.55] M. Metikos-Hukovic, R. Babic, Z. Grubac, J. Appl. Electrochem. 32 (2002) 35.
Copyright © 2022 FDOKUMEN