experimental and numerical investigation of cold-formed lean ...
40
1 EXPERIMENTAL AND NUMERICAL INVESTIGATION OF COLD-FORMED LEAN DUPLEX STAINLESS STEEL FLEXURAL MEMBERS Yuner Huang and Ben Young* Department of Civil Engineering, The University of Hong Kong, Pokfulam Road, Hong Kong, China Abstract: Experimental and numerical investigation of cold-formed lean duplex stainless steel flexural members is presented in this paper. The test specimens were cold-rolled from flat plates of lean duplex stainless steel with the nominal 0.2% proof stress of 450 MPa. Specimens of square and rectangular hollow sections subjected to both major and minor axes bending were tested. A finite element model has been created and verified against the test results using the material properties obtained from coupon tests. It is shown that the model can accurately predict the behaviour of lean duplex stainless steel flexural members. An extensive parametric study was carried out using the verified finite element model. The test and numerical results as well as the available data on lean duplex beams are compared with design strengths predicted by various existing design rules, such as the American Specification, Australian/New Zealand Standard, European Code and direct strength method for cold-formed stainless steel. Reliability analysis was performed to evaluate the reliability of the design rules. It is shown that these current design rules provide conservative predictions to the design strengths of lean duplex stainless steel flexural members. In this study, modified design rules on the American Specification, Australian/New Zealand Standard, European Code and direct strength method are proposed, which are shown to improve the accuracy of these design rules in a reliable manner. Keywords: Beam; Cold-formed steel; Design strength; Finite element modeling; Flexural members; Four-point bending tests; Hollow sections; Lean duplex; Stainless steel. * Corresponding author. Tel.: +852-2859-2674; fax: +852-2559-5337. E-mail address: [email protected] (B. Young).
-
Upload
khangminh22 -
Category
Documents
-
view
6 -
download
0
Transcript of experimental and numerical investigation of cold-formed lean ...

1
EXPERIMENTAL AND NUMERICAL INVESTIGATION OF COLD-FORMED LEAN DUPLEX STAINLESS STEEL FLEXURAL
MEMBERS
Yuner Huang and Ben Young*
Department of Civil Engineering, The University of Hong Kong, Pokfulam Road, Hong Kong, China
Abstract: Experimental and numerical investigation of cold-formed lean duplex stainless steel flexural members is presented in this paper. The test specimens were cold-rolled from flat plates of lean duplex stainless steel with the nominal 0.2% proof stress of 450 MPa. Specimens of square and rectangular hollow sections subjected to both major and minor axes bending were tested. A finite element model has been created and verified against the test results using the material properties obtained from coupon tests. It is shown that the model can accurately predict the behaviour of lean duplex stainless steel flexural members. An extensive parametric study was carried out using the verified finite element model. The test and numerical results as well as the available data on lean duplex beams are compared with design strengths predicted by various existing design rules, such as the American Specification, Australian/New Zealand Standard, European Code and direct strength method for cold-formed stainless steel. Reliability analysis was performed to evaluate the reliability of the design rules. It is shown that these current design rules provide conservative predictions to the design strengths of lean duplex stainless steel flexural members. In this study, modified design rules on the American Specification, Australian/New Zealand Standard, European Code and direct strength method are proposed, which are shown to improve the accuracy of these design rules in a reliable manner. Keywords: Beam; Cold-formed steel; Design strength; Finite element modeling; Flexural members; Four-point bending tests; Hollow sections; Lean duplex; Stainless steel. * Corresponding author. Tel.: +852-2859-2674; fax: +852-2559-5337. E-mail address: [email protected] (B. Young).
2
1. Introduction
Cold-formed stainless steel is gaining increasing applications as a construction material serving both architectural and structural needs. It provides aesthetic and modern shining appearance, superior corrosion resistance, longer service life with easy maintenance, and convenience in construction. Therefore, extensive research has been carried out on the structural performance of stainless steel structures. Design specifications for stainless steel structures were developed for various types of stainless steel, including ferritic, austenitic and duplex stainless steel. Nevertheless, the high cost of stainless steel material constrains its wider application. In recent years, a relatively new type of stainless steel, called lean duplex stainless steel of grade EN 1.4162 (LDX 2101), with structural and economical advantages was developed. It is becoming an attractive choice as a construction material due to its low cost compared to duplex stainless steel, and the strength of the material is comparable with duplex stainless steel. However, the lean duplex stainless steel is currently not covered in any design specification, and the investigation on such new material is also limited. Theofanous and Gardner [1] carried out three-point bending tests on 8 specimens and finite element analysis on 36 specimens of lean duplex stainless steel rectangular hollow section (RHS) and square hollow section (SHS). It was found that the European Code is overly conservative, while the Australian/New Zealand Standard and the American Specification provided more accurate prediction to the strengths of flexural members. The modified classification limits that proposed by Gardner and Theofanous [2] and the continuous strength method (CSM) provided better prediction to the flexural members. Huang and Young [3] investigated the material properties of lean duplex stainless steel by conducting coupon tests, stub column tests and measurement of residual stresses. Column tests were conducted on cold-formed lean duplex stainless steel members by Huang and Young [4]. It was found that the current design specifications are generally conservative for columns, and a new design approach of using stub column property & full cross-sectional area in calculation compression capacity has been recommended. Furthermore, finite element analysis on lean duplex stainless steel columns was also performed by Huang and Young [5]. A total number of 259 column strengths were compared with design values predicted by various design rules. It is shown that the existing design rules are generally conservative. Modifications are proposed for the AS/NZS Standard, EC3 Code and direct strength method in order to obtain a more accurate prediction for the cold-formed lean duplex stainless steel columns. Saliba and Gardner [6] performed experimental and numerical investigation on the structural behaviour of lean duplex stainless steel welded I-sections. The investigation included coupon tests, stub

3
column tests and bending tests as well as parametric study on welded I-sections using finite element analysis. The experimental and numerical data were compared with design predictions by European Code for stainless steel and continuous strength method (CSM). It is shown that the current Class limits in the European Code can be relaxed. In addition, the continuous strength method is shown to provide better prediction than the current European Code prediction. The objective of this study is mainly to investigate the structural performance of cold-formed lean duplex stainless steel flexural members. A series of bending tests and a wide range of parametric study on lean duplex stainless steel flexural members were carried out. The 180 numerical and experimental data obtained from this study and previous research [1] were compared with design predictions by the American Specification (ASCE) [7], Australian/New Zealand Standard (AS/NZS) [8], European Code (EC3) [9], the design rule proposed by Gardner and Theofanous [2] and the direct strength method (DSM) described in the North American Specification (AISI) [10]. Reliability analysis was conducted for each of the current design rules, and design recommendations are proposed in this study. It should be noted that the lean duplex stainless steel is not covered in the ASCE, AS/NZS nor EC3.
2. Experimental Investigation
2.1 Test specimens Cold-formed lean duplex stainless steel flexural members were tested subjected to pure bending. The nominal 0.2% proof stress of the lean duplex stainless steel is 450 MPa. There are six different sections including two square hollow sections (SHS) and four rectangular hollow sections (RHS). The test specimens used in this study are the same batch of specimens as those investigated by Huang and Young [3]. The material properties as shown in Table 1 are also reported by Huang and Young [3]. The specimens of RHS were tested under bending about both the major and minor axes. The specimens were labelled such that the depth of the web (D), width of the flange (B), thickness (t) of the cross-section as well as the specimen length (L) can be recognized. The arrangement of the cross-sectional dimensions also refers to the bending axis. For example, the label 30×50×2.5L900 defines the following specimen. The numbers before the letter “L” is refer to the cross-sectional dimension. The dimensions of the web (D), flange (B) and thickness (t) of the cross-section are equal to 30, 50 and 2.5 mm, respectively. The numbers after the letter “L” indicates the specimen length of 900 mm.

4
The dimension of the web (D) is smaller than the flange (B), thus the beam is subjected to minor axis bending. On the other hand, the specimen 50×30×2.5L900 is of the same cross-sectional dimension and length, but subjected to major axis bending. 2.2 Test setup and procedure The four-point bending tests were conducted to obtain the moment capacity of each test specimen. The relationship between the bending moment and curvature of the specimens can also be obtained. A total of ten four-point bending tests was conducted. The test setup is shown in Fig. 1. The pin-ended boundary conditions were simulated by a half-rounded support and a roller support located at 70 mm from the two ends of the specimen. Major and minor axes bending tests were carried out on the specimens of RHS. The specimens of SHS were placed so that the surface with the weld is located at the web of the sections. The moment span between the two loading points, and the shear span between the end supports and the loading points were carefully designed, so that the section moment capacity could be obtained without the occurrence of shear failure. Vertical loading was applied through a lockable ball bearing connecting to a spreader beam. The function of the lockable ball bearing is to eliminate any possible gaps between the spreader beam and the two loading points. The bearing was locked by four bolts and restrained from rotation prior to testing, as shown in Fig. 1. Web stiffening plates were clamped at the two loading points and the ends of each specimen. In addition, wooden blocks were inserted at these locations to prevent any possible local bearing failure during testing. Three displacement transducers (LVDTs) were placed along the centerline of the tension face of each specimen at the two loading points and at the mid-span of the specimen. The vertical deflections of the specimen at these three locations (two loading points and mid-span) were recorded, and the curvature of the specimen was calculated from the recorded deflections. Concentrated compressive force was applied by a hydraulic testing machine using displacement control with a constant loading rate of 1.0 mm/min for all test specimens. The static load was recorded by pausing the applied staining for two minutes at the ultimate load. A data acquisition system was used to record the applied load and the readings of the LVDTs at regular intervals during the tests.

5
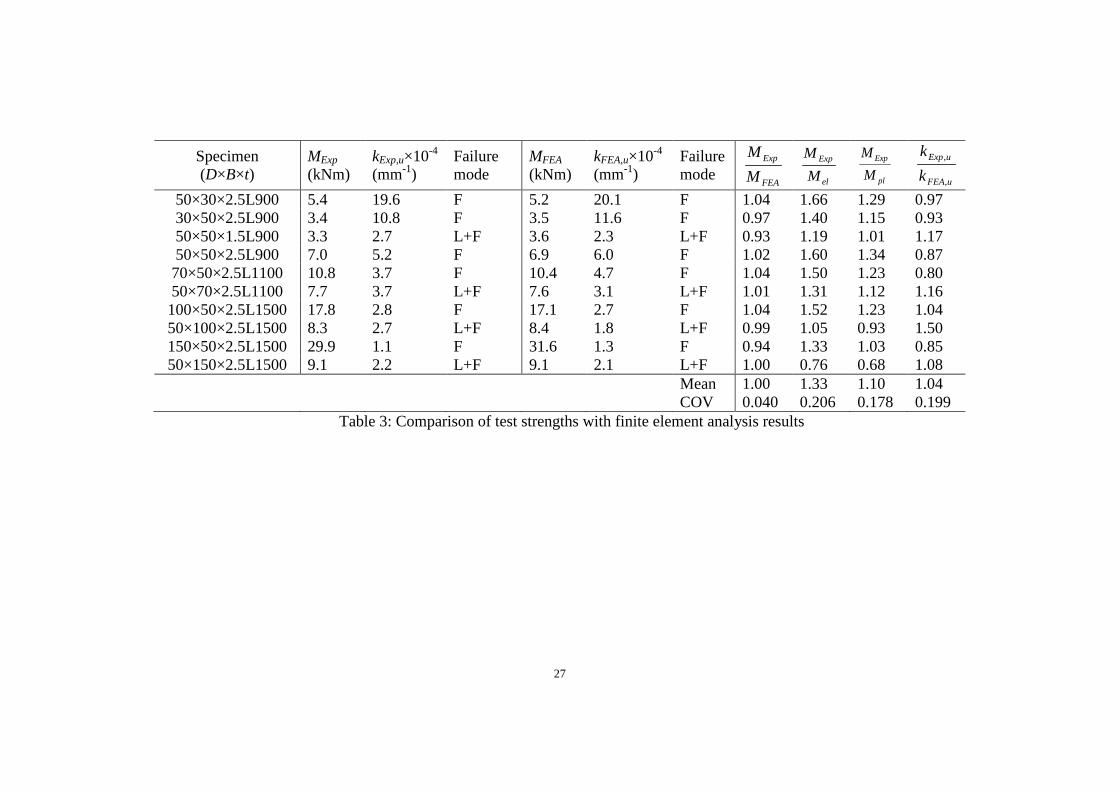
2.3 Test results The experimental ultimate moments (MExp) and the corresponding curvatures (kExp,u) of the test specimens are summarized in Table 3. The static moment-curvature curve for each specimen is plotted in Fig. 2(a). The static moment (M) and the curvature (k) of each specimen are normalized with the plastic moment (Mpl) and the curvature corresponding to plastic moment (kpl), respectively, as shown in Fig. 2(b). The moments were obtained using half of the static applied load from the actuator multiplied by the shear span of the specimens. Out-of-plane bending was not observed in the tests. In addition to flexural behaviour (F), local buckling (L) is also observed at ultimate load of specimens 50×50×1.5L900, 50×70×2.5L1100, 50×100×2.5L1500 and 50×150×2.5L1500. The failure modes observed at ultimate load of the specimens 50×30×2.5L900 and 50×50×1.5L900 involved flexural behaviour (F) and combination of flexural behaviour and local buckling (L+F) are shown in Figs 3 and 4, respectively. The curvatures (kExp,u) of test specimens were calculated from displacements measured from the three LVDTs. A constant curvature between the transducer locations was assumed, and the curvature was calculated using the radius (r) of the curved beam specimen between the LVDTs located at the two loading points, such that kExp,u = 1/r. The experimental ultimate moments (MExp) are compared with the theoretical elastic (Mel) and plastic (Mpl) bending moments, as shown in Table 3. The elastic and plastic bending moments were calculated using the measured 0.2% proof stress (σ0.2) obtained from the flat coupon tests, as shown in Table 1, multiplied by the elastic and plastic section moduli of the full sections, respectively. Generally, conservative predictions to moment capacity of the test specimens were found, especially for those subjected to major axis bending. The mean value of MExp/Mel and MExp/Mpl ratios is equal to 1.33 and 1.10 with the corresponding coefficients of variation (COV) of 0.206 and 0.178, respectively. The moment capacity of specimen 50×150×2.5L1500 was over predicted by elastic and plastic bending moments with the MExp/Mel and MExp/Mpl ratios of 0.76 and 0.68, respectively. This is due to the early occurrence of local buckling in the compression flange before the specimen reached yielding. 3. Finite element model
Finite element model was developed using the program ABAQUS version 6.11 [11] to simulate the cold-formed lean duplex stainless steel flexural members. The initial local geometric imperfections and materials properties obtained from tensile coupon tests of flat

6
portions and corners measured by Huang and Young [3] were incorporated in the finite element model. A four-noded doubly curved shell element with reduced integration (S4R) with a mesh size of 10 mm × 10 mm (length by width) in the flat portions of the cross-sections and a finer mesh at the corners were used. In the experiments, the concentrated compressive load was applied vertically through the lockable bearing and spreader beam, and then the load transferred to the roller and half-rounded bar onto the load transferring plates to the specimen, as shown in Fig. 1. Therefore, the two loading points were modelled by two reference points located at the middle of the contact surfaces between the load transferring plates and the specimen. The reference points were coupled to the contact surfaces between the transferring plates and the specimen, and restrained against all degrees of freedom except for displacement in the vertical and longitudinal directions along the flexural member as well as the rotation about the bending axis. Similarly, the two supports were modelled by coupling the contact surfaces with two reference points located at the bottom flange of the specimen in the middle of the corresponding contact surfaces. The pin support (half-rounded) was modeled by restraining against all degrees of freedom except for the rotation about the bending axis, while the roller support was modeled by allowing an extra degree of freedom for longitudinal displacement along the specimen. The loading was applied by displacement control method, which is identical to the tests of flexural members, by specifying an axial displacement at the two reference loading points. In the finite element model, the loading was applied by a static RIKS step available in the ABAQUS library. The nonlinear geometric parameter (*NLGEOM) was included to deal with the large displacement analysis.
Huang and Young [3] conducted the tensile coupon tests to obtain the material properties of the cold-formed lean duplex stainless steel specimens. These specimens are of the same batch as the beam specimens in this study. The coupons were extracted from the flat portions and corners of each section, and the measured stress-strain curves were used in the finite element model. The material properties including the 0.2% proof strength (yield strength) (σ0.2), ultimate strength (σu), strain at fracture (εf), initial Young’s modulus (Eo), and Ramberg-Osgood parameter (n) of flat and corner coupon tests for each section are summarized in Table 1. A multi-linear stress-strain curve containing the elastic part up to the proportional limit stress with the measured Young’s modulus, and the plastic part with the true stress and logarithmic true plastic strain curve, which is converted from a static stress-strain curve, was used. The true plastic stress-strain curves converted from flat coupon test results were used as the material properties in modelling the flat portions of the
7
specimens, while those converted from the corner coupon test results were used in modelling the corner regions of the specimens. The local geometric imperfections for each section that measured by Huang and Young [3] were included in the finite element model. The local buckling mode, which was obtained by carrying out Eigenvalue analysis with a large D/t ratio and using a BUCKLE procedure, was superposed on the flexural member model. The first buckling mode predicted by the ABAQUS Eigenvalue analysis are normalized to 1.0, thus the buckling mode was factored by the measured magnitudes of the initial local geometric imperfections for each member. In addition, the membrane residual stresses of section 150×50×2.5, which was measured by Huang and Young [3], was included in the model of specimens 150×50×2.5L1500 and 50×150×2.5L1500 using the ABAQUS (*INITIAL CONDITIONS, TYPE = STRESS) parameter to assess the influence of the residual stresses on the beam capacities of cold-formed lean duplex stainless steel flexural members. The section was partitioned into strips of the same width as those measured by Huang and Young [3]. It should be noted that the bending residual stresses effect has been taken into account by the material properties obtained from flat and corner coupon tests.
The ultimate moments predicted by finite element analysis (MFEA) including residual stresses are compared with the test results (MExp). The numerical results obtained by the model excluding residual stresses are also compared with the test results. The moment ratio MExp/MFEA of specimen 150×50×2.5L1500 equals to 0.96 for the finite element model includes residual stresses, while the MExp/MFEA ratio equals to 0.94 for the model without considering residual stresses. It is shown that the finite element model including residual stresses is 2% more accurate than that without considering residual stresses. For the specimen 50×150×2.5L1500, the MExp/MFEA ratios are both equal to 1.00 for the finite element models with and without residual stresses. The finite element model with residual stresses is 0.3% more accurate than that without residual stresses. The moment-curvature curves of the test and finite element analysis for specimen 50×150×2.5L1500 are shown in Fig. 5. It is shown that the effect of residual stresses on the beam are quite small, thus the residual stresses are not included in the parametric study.

8
4. Verification of Finite Element Model
The moment capacities (MFEA) predicted by the finite element analysis are compared with the test results (MExp), as shown in Table 3. The mean value of MExp/MFEA ratio is 1.00 with the coefficient of variation (COV) of 0.040. A maximum difference of 7% is found between the experimental and numerical moment capacities for specimen 50×50×1.5L900. The failure modes predicted by the finite element analysis are identical to those obtained from the tests at ultimate load. The failure modes of flexural buckling (F) and interaction of local and flexural buckling (L+F) obtained from the FEA compare well with the experimental failure modes for specimens 50×30×2.5L900 and 50×50×1.5L900 as shown in Figs 3 and 4, respectively. The comparison of curvatures of the test specimens (kExp,u) with those of the finite element results are summarized in Table 3. The mean value of kExp,u/kFEA,u equals to 1.04 with the COV of 0.199. Fig. 5 shows the comparison of the experimental and numerical results for specimen 50×150×2.5L1500. It is observed that good agreement has been achieved in terms of the ultimate flexural strength and corresponding curvature.
5. Parametric Study
An extensive parametric study was performed using the verified finite element model with a total of 126 flexural members of lean duplex stainless steel. The material properties adopted in the parametric study were based on the stress-strain curves obtained from the flat and corner coupon tests of section 70×50×2.5 reported in Huang and Young [3]. The averaged measured local geometric imperfection for the tested specimens reported in Huang and Young [3, 4] was t/11, where t is the thickness of each section. Thus, a slightly conservative rounded number of t/10 was used as the local imperfection in the parametric study. The residual stresses of the flexural members are not included in the finite element model, considering its negligible effect on the moment capacity.
The 126 specimens in the parametric study were SHS and RHS, with 6 different overall profiles (overall depth × overall width) of SHS ranged from 50×50 to 300×300, and 7 different overall profiles of RHS ranged from 50×30 to 350×100. The thicknesses of each profile varied to cover a wide range of slenderness ratio from stocky to slender sections. The aspect ratio (D/B) for the specimens was ranged from 0.25 to 4. The moment span between the two loading points was 500 mm for all specimens, and the shear span between the loading points to the supports were carefully designed so that the section flexural capacity can be
9
reached without shear failure. The RHS specimens were subjected to both major and minor axes bending. The specimens in the parametric study used the same labelling system as that of the test specimens, as shown in Table 4. The ultimate moment capacities and the corresponding curvatures predicted by the finite element analysis are summarized in Table 4. 6. Reliability Analysis
The suitability of the current design rules, including ASCE [7], AS/NZS [8], EC3 [9], modified EC3 by Gardner and Theofanous [2], direct strength method (DSM) in the AISI [10] and continuous strength method (CSM) [6] for the cold-formed lean duplex stainless steel flexural members is evaluated using reliability analysis, which is detailed in the Commentary of the ASCE Specifications [7]. A target reliability index (β0) of 2.5 for stainless steel structural members is used as a lower limit. The design rules are considered to be reliable if the reliability index is greater than or equal to 2.5. The resistance factors (φ0) of 0.90 for members with stiffened compression flanges subjected to bending is recommended by ASCE [7], AS/NZS [8], and AISI Standard [10] for direct strength method (DSM), while the resistance factors of 0.91 is used by the EC3 [9], the modified EC3 by Gardner and Theofanous [2] as well as the continuous strength method (CSM) [6]. The load combinations of 1.2DL+1.6LL, 1.25DL+1.5LL and 1.35DL+1.5LL were used for design rules in ASCE, AS/NZS and EC3 in the reliability analysis, respectively, where DL is the dead load and LL is the live load. The load combination of 1.35DL+1.5LL was used for reliability analysis of modified EC3 by Gardner and Theofanous [2] and continuous strength method (CSM), while the load combination of 1.2DL+1.6LL was used for the direct strength method (DSM). The Eq. 6.2-2 in the ASCE Specification [7] was used in calculating the reliability index. The statistical parameters Mm = 1.10, Fm = 1.00, Vm = 0.10 and VF = 0.05, which are the mean values and coefficients of variation for material properties and fabrication factors for flexural members in Clause 3.3.1.1 of the commentary of the ASCE Specification were adopted. The mean value (Pm) and coefficient of variation (VP) of tested-to-predicted load ratio or numerical results to design predictions ratio are shown in Table 5. In calculating the reliability index, Eq. F1.1-3 in the North American cold-formed steel Specification AISI S100 [10] was used to calculate the correction factor, in order to take into account for the influence by the number of data. For the purpose of direct comparison, a constant resistant factor (φ1) of 0.90 and a load combination of 1.2DL+1.6LL were used to calculate the

10
reliability index (β1) for the design rules, and the values of the reliability index are also shown in Table 5.
7. Current Design Rules and Comparison of Moment Capacities
7.1 General
The experimental and numerical moment capacities (Mu) are compared with the unfactored design flexural strengths (nominal strength) predicted by ASCE [7], AS/NZS [8], EC3 [9], modified EC3 by Gardner and Theofanous [2], DSM [10] and CSM [6]. The comparison of the experimental and numerical moment capacities with the design moment capacities is shown in Table 5 and 6. The flat coupon test result of section 70×50×2.5, reported in Huang and Young [3], is used in calculating the design flexural strengths for specimens in the parametric study. The design rules in ASCE [7], AS/NZS [8], EC3 [9] and modified EC3 by Gardner and Theofanous [2] used the effective width method for the sections when local buckling occurs. Therefore, the calculation procedure using these design rules involved iterative process, as the location of the neutral axis shifts with the effective width when the sections subjected to bending. However, such tedious iterative process is not required in the DSM [10] and CSM [6], as the flexural strength is calculated by the full section instead of effective section. It should be noted that the ASCE, AS/NZS and EC3 do not cover the material of lean duplex stainless steel.
7.2 American Specification and Australian/New Zealand Standard The ASCE [7] and AS/NZS [8] use the same design rules to calculate the moment capacity and the effective width of the section. According to Clause 3.3.1.1 in the ASCE Specification and Clause 3.3 of the AS/NZS Standard, the two design specifications allow the calculation base on initiation of yielding and inelastic reserve capacity. Therefore, both approaches are assessed in this study. For the approach by initiation of yielding, the moment capacities (Myielding) were calculated by the effective section modulus (Se) multiplied by the yield strength (fy). The effective width was calculated in accordance with Clause 2.2 in ASCE and AS/NZS, where a yield strength at the extreme fibre of compressive flange and the stress distribution vary linearly in the

11
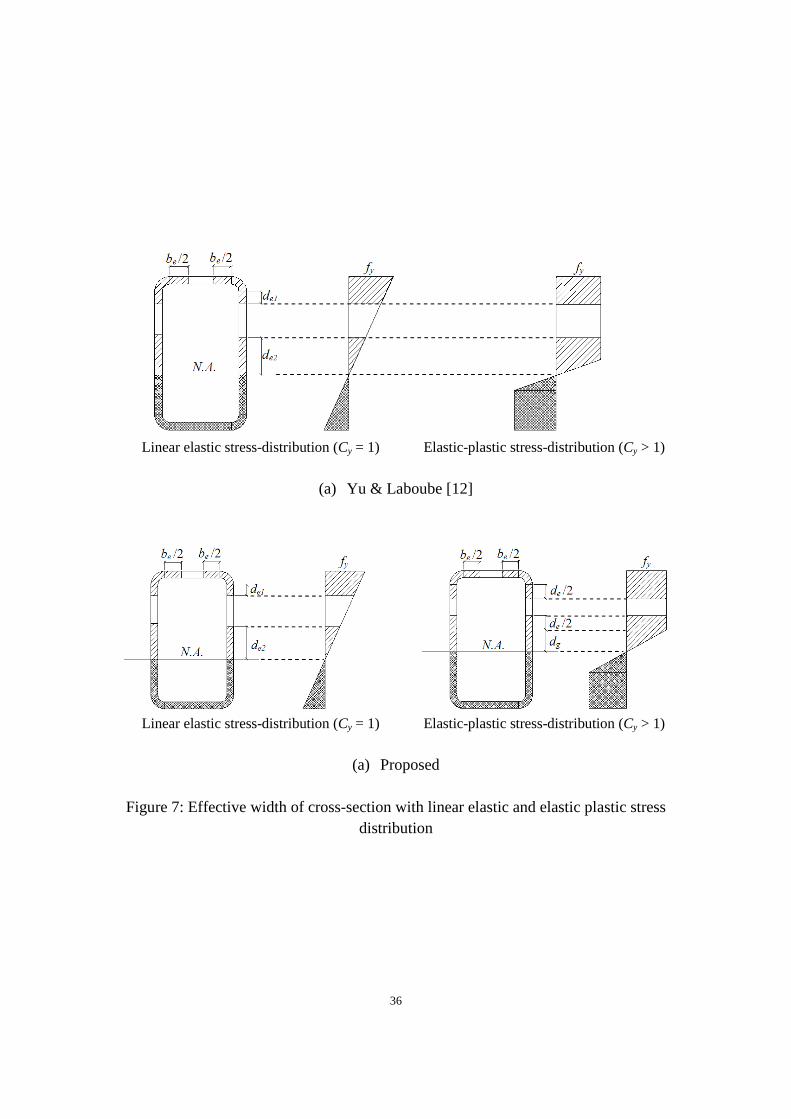
section were assumed. It is shown in Table 5 that the initiation of yielding approach in ASCE [7] and AS/NZS [8] provide quite conservative and scattered predictions for moment capacities of the specimens, especially to those stocky sections with low slenderness ratio d/(tε), where d is the flat portion of the web and ε is the material factor, as shown in Table 5 and Fig. 6. The mean value of the Mu/Myielding ratio is 1.50 and the coefficient of variation (COV) equals to 0.264. This approach is considered to be reliable for ASCE [7] and AS/NZS [8] with the reliability indices (β0) of 2.85 and 2.71, respectively. For the approach by inelastic reserve capacity, the moment capacities (Minelastic) were calculated by the equivalent force multiplying the lever arm within the section, considering equilibrium of stresses in the effective section and assuming an ideally elastic-plastic stress distribution in the section. The compression strain factor (Cy) was calculated to determine the stress distribution in the section. However, the ASCE [7] and AS/NZS [8] did not state clearly the calculation of effective widths that involve elastic-plastic stress distribution in the section. According to Yu and Laboube [12] for elastic-plastic stress distribution in the section, the effective widths were calculated using the equations for elements with stress gradient in Clause 2.2.2 of the ASCE [7] and AS/NZS [8], as shown in Fig. 7(a). It is required in both the ASCE [7] and AS/NZS [8] that the ratio of the depth of compressed portion of the web to its thickness does not exceed the slenderness ratio. In this study, there are 47 out of 180 specimens that exceeded this limitation. Thus, 133 specimens within the limit were compared using the inelastic reserve capacity design approach, as shown in Table 5.
It is shown that the mean value of Mu/Minelastic ratio is 1.34 and the COV equals to 0.200, which is less conservative and less scattered than the approach by initiation of yielding. The reliability indices (β0) for the ASCE [7] and AS/NZS [8] are 2.92 and 2.76, respectively, which are larger than the target value of 2.50. The comparison of experimental and numerical results with design strengths by ASCE [7] and AS/NZS [8] is shown in Fig. 6, where the flat width b is obtained by the flat portion of the flange. It should be noted that both approaches provide quite conservative predictions to specimens with the compression strain factor (Cy) equal to 3, which is the elastic-plastic stress distribution occurred in the section. The comparison of the test and numerical results with the design predictions to the 54 specimens with compression strain factor equal to 3 are shown in Table 6. It is shown that the approach by inelastic reserve capacity is very conservative for these specimens with the mean value of Mu/Minelastic equal to 1.54 and COV of 0.179 for both ASCE [7] and AS/NZS [8]. Therefore, design rules for stainless steel flexural members need to be modified.

12
Furthermore, the limitation of the approach by inelastic reserve capacity, that the ratio of the depth of the compressed portion in the web (dw) to its thickness does not exceed the slenderness ratio (λl), was assessed by comparing the design flexural strengths (M*
inelastic) of the 47 specimens which exceeded the limitation (dw/t > λl) with the test and numerical results, as shown in Table 5, where λl is defined in Clause 3.3 of ASCE [7] and AS/NZS [8]. The result shows that the approach provides good prediction on these specimens even they are beyond the limitation. The mean value of Mu/M*
inelastic is 1.17 with the COV of 0.153, and the reliability indices (β0) of 2.72 and 2.55 for ASCE [7] and AS/NZS [8], respectively.
7.3 European Code According to Clause 5.1 of the EC3 Part 1.4 [9], the provisions given in Section 5 and 6 of EC3 Part 1.1 [13] should be applied for stainless steel, except where modified or superseded by the special provisions given in EC3 Part 1.4. Therefore, the moment capacity (MEC3) was calculated by the equations 6.13 to 6.15 of Clause 6.2.5 in EC3 Part 1.1 [13]. Classification was required according to Table 5.2 in EC3 Part 1.4, where the flat portions of the web and compressive flange were classified since these elements subjected to bending and compression. For specimens classified as Class 4 section, the effective widths were calculated by Table 4.1 of EC3 Part 1.5 [14] together with the reduction factor calculated by Clause 5.2.3 in EC3 Part 1.4. The classification is governed by the larger Class of element in the section. In this study, 80 specimens had a larger class in the flange compared to the class in the web, while 24 specimens had a larger class in the web instead of the flange. The remaining 76 sections had the same class in either the flange or web. It should be noted that there are not many investigation covered lean duplex stainless steel flexural members for section having a larger class in the web. The 24 specimens from the parametric study are used to assess the classification of elements subject to bending in the EC3 Code. The comparison of the experimental and numerical data with the design strengths is shown in Fig. 8 and Table 5. It is shown that the EC3 predictions are quite conservative with the mean value of Mu/MEC3 equal to 1.25 and COV of 0.147. The reliability index (β0) is 2.83, which is greater than the target reliability index of 2.5. Gardner and Theofanous [2] analysed the classification limits of the European Code [9] for stainless steel. A set of classification limits for compression elements was proposed, and the effective width equations [2] were modified as shown in Eqs. (1-2):
13
21 0.188 1
p p
ρλ λ
= − ≤ for outstand elements (1)
20.772 0.079 1
p p
ρλ λ
= − ≤ for internal elements (2)
where ρ is the reduction factor for local buckling and pλ is the element slenderness. In this
study, the design moment capacities (MG&T) predicted by Gardner and Theofanous [2] in modifying the European Code were compared with the test and numerical results obtained from this study and available data. It is shown that the modified EC3 by Gardner and Theofanous [2] provides a more accurate and less scattered prediction, with the mean value of Mu/MG&T equal to 1.19 with the COV of 0.133 as well as the reliability index (β0) of 2.73. In European Code, a section is classified as Class 1 when it reaches plastic moment capacity for full section and be able to maintain sufficient deformation capacity, which is calculated by Eq. (3),
1^
−=pl
pl
kk
R (3)
where kpl is the curvature corresponding to the plastic moment (Mpl) on the ascending branch of moment-curvature curve, while k^
pl is the curvature on the descending branch at the plastic moment after the ultimate moment. The locations of ku, k^
pl and kpl on the moment-curvature curve of specimen 100×50×2.5L1500 is shown in Fig. 8. For specimens 30×50×2.5L900, 50×30×2.5L900, 50×50×2.5L900 and 50×70×2.5L1100, the curvature (k^
pl) was not recorded, because the deformations of the specimens were very large and tests had to stop before reaching k^
pl. Therefore, the maximum recorded curvatures for these four specimens were used as the value of k^
pl in Eq. (3) to calculate the rotation capacities (R). Since there is no required deformation capacity for Class 1 in the EC3 Part 1.4 [9], the requirement of R = 3 for carbon steel are adopted in this study to assess the Class 1 limit [15, 16], and Gardner and Theofanous [2] also adopted the same requirement for stainless steel. The rotation capacity R of the specimens with moment capacity exceeds the plastic moment capacity are plotted against the slenderness of the flange (b/(tε)) and web (d/(tε)) in Figs 10 and 11, respectively. The specimens governed by the flange are those with a larger class of the flange than the web, as plotted in Fig. 10, while the specimens governed by the web are those with a larger class of

14
the web than the flange, as plotted in Fig. 11. It is shown in Figs 10 and 11 that the current Class 1 limits for carbon steel in EC3 Part 1.1 [13] is more appropriate than those for stainless steel in EC3 Part 1.4 [9], as the limit of moment capacity exceeds the plastic moment while maintaining rotation capacity R larger than 3, in designing for lean duplex stainless steel internal elements subjected to compression and bending. A section is classified as Class 2 and Class 3 when it reaches plastic and elastic moment capacities, respectively. Therefore, the moment capacities obtained from the test and numerical results are normalized with plastic moment capacity for Class 2 and elastic moment capacity for Class 3 that plotted against the flange and web slenderness, in order to assess the Class 2 and Class 3 limits in EC3 Code, as shown in Figs 12 to 15. It is observed that the current Class 2 and Class 3 limits for stainless steel are generally conservative for lean duplex stainless steel beams. Hence, the current Class 2 and Class 3 limits for stainless steel can be relaxed for lean duplex material. 7.4 Direct Strength Method The direct strength method used in this study was based on the clause 1.2.2 of Appendix 1 in the North American Specification for the Design of Cold-Formed Steel Structural Members [10]. The nominal flexural strength (MDSM) shall be determined by the minimum of the nominal flexural strength for lateral-torsional buckling (Mne), local buckling (Mnl) and distortional buckling (Mnd). The lateral-torsional buckling and distortional buckling did not occur for SHS and RHS. According to the Clause 1.2.2.2 in the Appendix 1 of Commentary on the North American Cold-formed Steel Specification [17], for fully braced beams which are restrained against lateral-torsional buckling, the maximum Mne value is taken as the yield moment (My). According to Fig. C-1.2.2-1 in the Appendix 1 of Commentary on the North American Cold-formed Steel Specification [17], the flexural strength for local buckling (Mnl) is calculated by Eqs. 1.2.2-5, 1.2.2-6 and 1.2.2-7 in the North American Cold-formed Steel Specification [10], for which the nominal flexural strength for lateral-torsional buckling (Mne) is replaced by the yield moment (My). Therefore, the nominal flexural strength (MDSM) equation [10] is shown in Eq. (4):
yM for λl ≤ 0.776
yy
crl
y
crl MMM
MM
4.04.0
15.01
− for λl > 0.776 (4)
MDSM =

15
where the yield moment (My) is equal to Sf fy, and Sf = gross section modulus, fy = yield strength, and λl = (My/Mcrl)0.5. The critical elastic local buckling moment (Mcrl) of the cross-section was obtained from a rational elastic finite strip buckling analysis [18] with a 5 mm half-wave length interval. It is shown that the DSM also provided conservative and scattered predictions to the flexural members of SHS and RHS considered in this study, as shown in Table 5. The mean value of Mu/MDSM ratio is 1.35 with the corresponding COV and the reliability index (β0) of 0.172 and 3.12, respectively. The comparison of test and numerical results with design strengths by DSM is also shown in Fig. 16. It is found that the DSM provides a very conservative prediction for the 81 specimens with λl smaller than 0.776, as shown in Table 6. The mean value of Mu/MDSM ratio is 1.47 with COV of 0.138. On the other hand, the DSM provides good prediction to the 99 specimens with λl greater than or equal to 0.776, with the mean value of Mu/MDSM ratio equals to 1.16 and COV of 0.084. Therefore, the DSM for specimens with λl small than 0.776 should be modified, in order to provide a more accurate prediction for cold-formed lean duplex stainless steel flexural members. 7.5 Continuous strength method The continuous strength method (CSM) is a deformation-based design method. Gardner and Theofanous [2] and Saliba and Gardner [6] have shown that the CSM is capable of providing accurate predictions for stainless steel flexural members. Similar to the DSM, the cross-section classification and effective width calculation are not required in CSM. The continuous strength method used in this study was based on the CSM equations for bending resistances presented in Saliba and Gardner [6]. In addition, the CSM allows for strain hardening in determining the cross-section resistance. It is stated in Saliba and Gardner [6]
that the CSM does not apply to cross-sections where the slenderness ( pλ ) larger than 0.748,
because there is no significant benefit to be derived from strain hardening beyond this limit [6]. Therefore, the flexural strengths of 96 specimens that meet the requirement of the CSM are compared with the design values (MCSM) by the continuous strength method, as shown in Fig. 5. It is found that the CSM provides the best prediction among the existing design rules. The mean value of Mu/MCSM ratio is 1.13 with COV of 0.087. The reliability index (β0) is equal to 2.75, which is greater than the target value of 2.5.

16
It is noted that the continuous strength method is capable of providing good prediction for the cold-formed lean duplex stainless steel flexural members, while the other existing design rules investigated in this study provide quite conservative predictions for the moment capacities of lean duplex stainless steel flexural members. Therefore, modifications to the ASCE and AS/NZS as well as EC3 and DSM are proposed in the following section. 8. Modified Design Rules & Comparison of Beam Strengths
8.1 General The ASCE Specification [7], AS/NZS Standard [8], EC3 Code [9] and DSM [10] do not cover the design of lean duplex stainless steel. It was found that these design rules provide quite conservative predictions to the moment capacity of lean duplex stainless steel. Therefore, modifications to these design rules are proposed for lean duplex stainless steel flexural members. A total number of 180 test and numerical results as well as the available data was used in the modifications of the design rules. The design strengths calculated by the modified inelastic reserve capacity approach in the ASCE Specification and AS/NZS Standard as well as the modified EC3 Code and DSM are represented by M#
inelastic, M#EC3, and
M#DSM, respectively.
8.2 ASCE Specification and AS/NZS Standard The approach by initiation of yielding is considered to be too conservative in designing flexural members of lean duplex stainless steel, due to the assumption of linear elastic stress distribution in the section for all specimens including those reached elastic-plastic stress distribution. In this study, modifications are made to the approach by inelastic reserve capacity, especially to those stocky sections with compression strain factor (Cy) equals to 3.0. In the approach by inelastic reserve capacity, the stress distribution in the section is governed by the compression strain factor (Cy). If the factor is equal to 1.0, the stress distribution is linearly elastic up to the yield strength (fy) at the extreme fibre of the compressive flange. If the factor is larger than 1.0, the location of the threshold of linear elastic stress distribution having the strain equal to yield strain (ey), beyond which a stress block of yield strength is formed in the section. Therefore, the stress distribution in the section is elastic-plastic. However, the calculation procedure of effective width is not clearly stated in the ASCE

17
Specification [7] and AS/NZS Standard [8] for sections having elastic-plastic stress distribution (Cy > 1). Therefore, Yu and Laboube [12] suggested that the effective width equations for sections with linear elastic stress distribution can be used for those having elastic-plastic stress distribution. However, such design calculation leads to a quite conservative prediction for stocky members, especially those with Cy equals to 3.0. In this study, the modified design rules for moment capacities (M#
inelastic) consist of three parts, namely for (i) effective width calculation; (ii) upper bound limit of moment capacity; and (iii) limitation of web slenderness (dw/t ratio). Firstly, the effective width calculation for specimens with compression strain factor (Cy) larger than 1.0, it is recommended that the height of the stress gradient in the compression portion of the web (dg), as shown in Fig. 7(b), is assumed to be fully effective, while that of the effective width for the plastic compressive stress block is calculated by the equations for webs with uniform compression, as indicated in the Clause 2.2.1 of the ASCE Specification [7] and AS/NZS Standard [8]. The effective width and the stress distribution in the sections calculated by Yu and Laboube [12] method and the proposed method are shown in Figs 7(a) and 7(b), respectively. Secondly, the upper bound limit of moment capacity from the approach by inelastic reserve capacity shall not exceed 1.25 times that obtained from the approach by initiation of yielding (Minelastic ≤ 1.25Myielding). Hence, this provides conservative predictions for specimens with low d/(tε) value, due to the overly conservative predictions by initiation of yielding approach. Therefore it is recommended that the requirement of Minelastic ≤ 1.25Myielding is not required in designing lean duplex stainless steel flexural members. Thirdly, the limitation of web slenderness of dw/t < λl in calculating the moment capacity can be removed. It is shown in Table 5 that the approach by inelastic reserve capacity provided good predictions to the 47 specimens exceeded the web slenderness limit (dw/t ≥ λl). The comparison of the test and numerical results with the predications from the modified design rules using the inelastic reserve capacity approach is summarized in Table 5 and Fig. 6. The mean value of the Mu/M#
inelastic ratio equals to 1.18 with COV of 0.116, and is considered to be reliable with the reliability index (β0) of 2.98 and 2.79 for ASCE Specification and AS/NZS Standard, respectively. Fig. 6 shows the improvement of moment capacity predictions by the modified design rules, especially for those specimens with compression strain factor larger than 1.0. It is also observed from Table 6 that the accuracy of the prediction to the specimens with compression strain factor (Cy) equals to 3.0 improves considerably compared to the current design rule. The mean value of the Mu/M#
inelastic ratio equals to 1.20 with the COV of 0.119, and the reliability index (β0) of 3.01 and 2.82 for

18
ASCE Specification and AS/NZS Standard, respectively. The modified design rules for moment capacities (M#
inelastic) are validated against the numerical and experimental data of specimens with B/t ratio ranged from 6.25 to 140, and D/t ratio ranged from 6.25 to 83.3.
8.3 EC3 Code The rotational capacities (R) of the specimens, where the ultimate moments (Mu) are larger than the plastic moment (Mpl), are plotted against the web slenderness (d/tε) and flange slenderness (b/tε) in Figs 10 and 11. As discussed in Section 7.3 of this paper, the Class 1 limits for carbon steel in EC3 Part 1.1 [13] are more appropriate than those in EC3 Part 1.4 [9] for stainless steel. In addition, the moment capacities of the flange governed and web governed specimens that normalized with the elastic and plastic moment capacities are shown in Figs 12 – 15. It is shown that the Class 2 and Class 3 limits for carbon steel in EC3 Part 1.1 [13] are more appropriate for the cold-formed lean duplex stainless steel flexural members. Therefore, it is recommended that the Class 1, Class 2 and the Class 3 limits for carbon steel in EC3 Part 1.1 [13] are adopted for lean duplex stainless steel flexural members. Therefore, it is suggested that the class limits (b/tε) of 33, 38 and 42 are used for Classes 1, 2 and 3 for element subject to compression, while the class limits (d/tε) of 72, 83 and 124 are used for Classes 1, 2 and 3 for element subject to bending, respectively. The effective width formula for internal element is modified and shown in Eq. (5):
104.07.02 ≤−=pp λλ
ρ (5)
The design strengths calculated by the proposed class limits and effective width formula are represented by M#
EC3, and the comparison of the test and numerical results with the design strengths predicted by the modified design rules is summarized in Table 5 and Fig. 8. The mean value of the Mu/M#
EC3 ratio equals to 1.15 and the COV equals to 0.123. It is shown that the modified design rules are less conservative than the current EC3 Code predictions. The EC3 modified design rules are considered to be reliable with the reliability index (β0) equal to 2.65. Table 6 shows that the experimental and numerical results-to-prediction moment ratio of Classes 1, 2 and 3 sections reduced from 1.35 to 1.23, while that of the Class 4 sections reduced from 1.17 to 1.09 when the current design predictions compared with the modified design predictions. The EC3 modified design rules are considered to be reliable for all four Classes 1, 2, 3 and 4 sections, with the reliability index larger than or equal to the target value
19
of 2.50. The modified design rules are validated against the numerical and experimental data of specimens with D/t ratio ranged from 6.25 to 140, and B/t ratio ranged from 6.25 to 83.3. 8.4 Direct Strength Method The nominal flexural strength (MDSM) in the direct strength method [10] as calculated by Eq. (4) shows that the nominal flexural strength is equal to a constant value of yield moment (MDSM = My), when λl is less than or equal to 0.776 (λl ≤ 0.776). In this study, based on a total number of 81 data with λl less than or equal to 0.776, it is shown that the flexural strengths generally decrease linearly as λl increases. Furthermore, the flexural strength predictions using the current direct strength method are generally conservative. Therefore, it is recommended to modify the current direct strength equation [10] to Eq. (6) as shown below:
( )( ) yl M1776.01.1 +− λ for λl ≤ 0.776
yy
crl
y
crl MM
MM
M1.1
1.11.115.01
4.04.0
− for λl > 0.776 (6)
The comparison of the experimental and numerical data with the design values calculated by the modified DSM in Eq. (6) is shown in Tables 5-6 and Fig. 16. The design strengths calculated by the modified DSM are represented by M#
DSM. The mean value of the Mu/M#DSM
is 1.07 with COV of 0.127 and the reliability index (β0) of 2.55, as shown in Table 5. It is shown that the modified DSM provides more accurate and less scattered predictions compared to the current DSM for the cold-formed lean duplex stainless steel flexural members. The comparison of the experimental and numerical data with the design values for the 81 specimens with λl less than or equal to 0.776, and the 99 specimens with λl greater than 0.776, is summarized in Table 6. The mean values of Mu/M#
DSM for specimens with λl ≤ 0.776 and λl > 0.776 are equal to 1.04 and 1.07 with COV of 0.062 and 0.142, respectively. The modified DSM is considered to be reliable for these two groups of specimens with reliability index (β0) of 2.70 and 2.50, respectively. It is shown that the modified DSM provides the most accurate predictions among the design rules discussed earlier. Furthermore, the tedious iterative process is not required. The modified direct strength equation in Eq. (6) is validated against the experimental and numerical data of specimens with λl ranged from 0.13 to 2.0.
M#DSM =
20
9. Conclusions Experimental and numerical investigation on the structural performance of cold-formed lean duplex stainless steel flexural members has been presented in this paper. A series of four-point bending tests was conducted on square and rectangular hollow sections. A finite element model of flexural members was developed and verified with the experimental results. A wide range of parametric study was performed using the verified finite element model. The experimental and numerical results obtained from this study and the available data were compared with the design strengths predicted by the American Specification [7], Australian/New Zealand Standard [8], European Code [9], modified European Code by Gardner and Theofanous [2], direct strength method [10] and continuous strength method [6]. It is shown that the continuous strength method is capable of providing good prediction for cold-formed lean duplex stainless steel square and rectangular hollow sections flexural members, while the other design rules are quite conservative. Modifications on the design rules in the AS/NZS, ASCE, EC3 and DSM are proposed and compared with the experimental and numerical results. It is shown that the modified design rules provide more accurate and less scatter predictions than the existing design rules. The modified direct strength method provides the most accurate predictions compared to the other design rules, and this method is relatively simple in calculating the flexural strengths. Therefore, it is recommended that the modified DSM is used in designing cold-formed lean duplex stainless steel flexural members of square and rectangular hollow sections. The modified DSM design equations are capable of producing reliable limit state designs when calibrated with resistance factor of 0.9.
Acknowledgements The writers are grateful to STALA Tube Finland for supplying the test specimens. The research work described in this paper was supported by a grant from the Research Grants Council of the Hong Kong Special Administrative Region, China (Project No. HKU718612E).

21
Notation The following symbols are used in this paper: A Full area B Overall width of the flange b Flat width of the flange be Effective width of compressive flange Cy Compression strain factor in American Specification and Australian/New Zealand
Standard D Overall depth of the web d Flat portion of the web de Effective width of stress block in the compressive web de1 Portion of the effective width of compressive web in stress gradient de2 Portion of the effective width of compressive web in stress gradient dg Height of the stress gradient in the compression portion of the web in the
modified approach by inelastic reserve capacity dw Depth of the compressed portion of the web Eo Initial Young’s modulus ey Yield strain in American Specification and Australian/New Zealand Standard Fm Mean value of fabrication factor fy Yield strength k Curvature kExp,u Curvature corresponding to the experimental ultimate moment kFEA,u Curvature corresponding to the ultimate moment predicted by finite element
analysis kpl Curvature corresponding to the plastic moment (Mpl) on the ascending branch of
moment-curvature curve ku Curvature at ultimate moment k^
pl Curvature corresponding to the plastic moment (Mpl) on the descending branch of moment-curvature curve
L Length of specimen Mcrl Critical elastic local buckling moment MDSM Unfactored design moment capacity predicted by the direct strength method M#
DSM Unfactored design moment capacity predicted by the modified direct strength method

22
Md Moment capacities predicted by design rules MEC3 Unfactored design moment capacity predicted by the European Code MExp Experimental ultimate moment (test moment capacity) MFEA Ultimate moment predicted by finite element analysis Mel Elastic bending moment M#
EC3 Unfactored design moment capacity predicted by the modified European Code MG&T Unfactored design moment capacity predicted by the modified European Code by
Gardner and Theofanous Minelastic Unfactored design moment capacity predicted by the approach by inelastic
reserve capacity in American Specification and Australian/New Zealand Standard M*
inelastic Unfactored design moment capacity predicted by the approach by inelastic reserve capacity for specimens with the ratio of the depth of the compressed portion of the web to its thickness exceeded the slenderness ratio
M#inelastic Unfactored design moment capacity predicted by the modified approach by
inelastic reserve capacity Mm Mean value of material factor Mne Nominal flexural strength for lateral-torsional buckling in direct strength method Mnl Nominal flexural strength for local buckling in direct strength method Mnd Nominal flexural strength for distortional buckling in direct strength method Mpl Plastic bending moment Mu Experimental and numerical ultimate moments My Yield moment Myielding Unfactored design moment capacity predicted by the approach by initiation of
yielding in American Specification and Australian/New Zealand Standard n Ramberg-Osgood parameter Pm Mean value of tested-to-predicted load ratio R Rotational capacity r Radius of the curved beam specimen between the LVDTs located at the two
loading points ri Inner radius ro Outer radius Se Effective section modulus Sf Gross section modulus t Thickness of specimen VF Coefficient of variation of fabrication factor Vm Coefficient of variation of material factor
23
Vp Coefficient of variation of tested-to-predicted load ratio β0 Reliability index β1 Reliability index ε Material factor in European Code εf Tensile strain after fracture based on gauge length of 25 mm φ0 Resistance factor φ1 Resistance factor λl Slenderness ratio in American Specification, Australian/New Zealand Standard
and direct strength method
pλ Element slenderness in European Code
ρ Value in calculating effective area in American Specification, Australian/New Zealand Standard and European Code
σ0.2 0.2% tensile proof stress σu Tensile strength

24
References [1] Theofanous M, Gardner L. Experimental and numerical studies of lean duplex stainless
steel beams. Journal of Constructional Steel Research 2010; 66 (6): 816-25. [2] Gardner L, Theofanous M. Discrete and continuous treatment of local buckling in
stainless steel elements. Constructional Steel Research 2008; 64 (11): 1207-16. [3] Huang Y, Young B. Material properties of cold-formed lean duplex stainless steel
sections. Thin-Walled Structures 2012; 54 (7): 72-81. [4] Huang Y, Young B. Tests of pin-ended cold-formed lean duplex stainless steel columns.
Journal of Constructional Steel Research 2013; 82: 203-15. [5] Huang Y, Young, B. Structural performance of cold-formed lean duplex stainless steel
columns. Proceedings of the 4th International Experts Seminar on Stainless Steel in Structures, The Steel Construction Institute, UK, 2012.
[6] Saliba N, Gardner L. Cross-section stability of lean duplex stainless steel welded I-sections. Journal of Constructional Steel Research 2013; 80: 1-14.
[7] ASCE. Specification for the design of cold-formed stainless steel structural members. SEI/ASCE 8-02; Reston, VA: American Society of Civil Engineers; 2002.
[8] AS/NZS. Cold-formed stainless steel structures. Australian/New Zealand Standard, AS/NZS 4673:2001. Sydney, Australia: Standards Australia; 2001.
[9] EC3. Design of steel structures – Part 1.4: General rules – Supplementary rules for stainless steels. European Committee for Standardization, EN 1993-1-4, Brussels; 2006.
[10] AISI. North American Specification for the design of cold-formed steel structural members. AISI S100-2007, North American Cold-formed Steel Specification, American Iron and Steel Institute, Washington, D.C., 2007.
[11] ABAQUS Standard User’s Manual. Dassault Systemes Simulia Corp., Version 6.11, USA; 2011
[12] Wei-Wen Yu and Roger A. Laboube. Cold-formed Steel Design (4th Edition). John Wiley & Sons, Inc. 2010. Chapter 4: Flexural Members: 97-190.
[13] EC3. Design of steel structures – Part 1.1: General rules and rules for buildings. European Committee for Standardization, EN 1993-1-1, Brussels; 2005.
[14] EC3. Design of steel structures – Part 1.5: Plated structural elements. European Committee for Standardization, EN 1993-1-5, Brussels; 2006.
[15] Bild S, Roik K, Sedlacek G, Stutzki C, Spangemacher R. The b/t-ratios controlling the applicability of analysis models in Eurocode 3, Part 1.1. Background Document 5.02 for chapter 5 of Eurocode 3, Part 1.1, Aachen. 1989.

25
[16] Sedlacek G, Feldmann M. The b/t-ratios controlling the applicability of analysis models in Eurocode 3, Part 1.1. Background Document 5.09 for chapter 5 of Eurocode 3, Part 1.1, Aachen. 1995.
[17] AISI. Commentary on North American Specification for the design of cold-formed steel structural members. AISI S100-2007-C, North American Cold-formed Steel Specification, American Iron and Steel Institute, Washington, D.C., 2007.
[18] Papangelis JP, Hancock GJ. Computer analysis of thin-walled structural members. Comput Struct 1995; 56(1):157–76.

26
Section (D×B×t)
Flat Corner σ0.2 σu εf Eo n σ0.2 σu εf Eo n
(MPa) (MPa) (%) (GPa) (MPa) (MPa) (%) (GPa) 50×30×2.5 683 764 39 198 7 788 975 22 192 4 50×50×1.5 610 734 44 194 5 824 1012 15 200 5 50×50×2.5 635 756 44 198 6 833 1079 19 207 5 70×50×2.5 613 738 44 194 8 844 995 21 200 5 100×50×2.5 625 727 49 200 6 882 1033 17 203 5 150×50×2.5 664 788 35 202 4 831 967 18 199 6
Table 1: Measured material properties obtained from tensile coupon tests [3]
Specimen (D×B×t)
D (mm)
B (mm)
t (mm)
ro (mm)
ri (mm)
L (mm)
A (mm2)
50×30×2.5L900 50.0 30.0 2.571 5.0 2.0 900 364.2 30×50×2.5L900 30.3 50.5 2.574 5.0 2.0 900 359.7 50×50×1.5L900 50.2 50.2 1.527 3.0 1.0 900 290.2 50×50×2.5L900 50.0 50.1 2.487 3.0 1.0 900 457.4 70×50×2.5L1100 70.5 50.8 2.553 4.0 1.0 1100 575.1 50×70×2.5L1100 50.7 70.4 2.513 4.0 1.0 1100 565.7 100×50×2.5L1500 100.4 50.4 2.497 3.5 1.0 1500 713.9 50×100×2.5L1500 50.7 100.1 2.480 3.5 1.0 1500 708.3 150×50×2.5L1500 150.4 50.1 2.473 4.5 2.0 1500 950.0 50×150×2.5L1500 50.1 149.9 2.459 4.5 2.0 1500 944.7
Table 2: Measured specimen dimensions
27
Specimen (D×B×t)
MExp (kNm)
kExp,u×10-4 (mm-1)
Failure mode
MFEA (kNm)
kFEA,u×10-4
(mm-1) Failure mode
Exp
FEA
MM
Exp
el
MM
Exp
pl
MM
uFEA
uExp
kk
,
,
50×30×2.5L900 5.4 19.6 F 5.2 20.1 F 1.04 1.66 1.29 0.97 30×50×2.5L900 3.4 10.8 F 3.5 11.6 F 0.97 1.40 1.15 0.93 50×50×1.5L900 3.3 2.7 L+F 3.6 2.3 L+F 0.93 1.19 1.01 1.17 50×50×2.5L900 7.0 5.2 F 6.9 6.0 F 1.02 1.60 1.34 0.87 70×50×2.5L1100 10.8 3.7 F 10.4 4.7 F 1.04 1.50 1.23 0.80 50×70×2.5L1100 7.7 3.7 L+F 7.6 3.1 L+F 1.01 1.31 1.12 1.16 100×50×2.5L1500 17.8 2.8 F 17.1 2.7 F 1.04 1.52 1.23 1.04 50×100×2.5L1500 8.3 2.7 L+F 8.4 1.8 L+F 0.99 1.05 0.93 1.50 150×50×2.5L1500 29.9 1.1 F 31.6 1.3 F 0.94 1.33 1.03 0.85 50×150×2.5L1500 9.1 2.2 L+F 9.1 2.1 L+F 1.00 0.76 0.68 1.08
Mean 1.00 1.33 1.10 1.04 COV 0.040 0.206 0.178 0.199
Table 3: Comparison of test strengths with finite element analysis results

28
Specimen (D×B×t)
MFEA (kNm)
kFEA,u×10-4 (mm-1)
Specimen (D×B×t)
MFEA (kNm)
kFEA,u×10-4 (mm-1)
50×50×6L900 14.2 21.8 100×50×8L900 53.6 10.2 50×50×4L900 9.7 18.4 100×50×5L900 33.9 14.5 50×50×2L900 4.7 4.6 100×50×3L900 19.5 3.7 50×50×1.5L900 3.2 1.8 100×50×2L900 11.8 1.3 50×50×1L900 1.8 1.6 100×50×1L900 3.7 0.7 100×100×10L900 95.5 7.2 50×100×8L900 28.2 8.7 100×100×5L900 47.7 2.6 50×100×5L900 18.4 5.4 100×100×3L900 24.7 1.1 50×100×3L900 10.2 1.9 100×100×2.5L900 19.3 1.0 50×100×2.5L900 7.8 1.8 100×100×1.5L900 8.6 0.6 50×100×2L900 6.0 1.5 150×150×15L1500 323.0 5.1 50×100×1.5L900 3.7 1.3 150×150×10L1500 217.8 3.4 300×100×10L2100 503.3 1.9 150×150×5L1500 96.8 0.9 300×100×8L2100 386.1 1.1 150×150×4L1500 71.9 0.7 300×100×7.5L2100 354.8 1.0 150×150×3L1500 44.4 0.5 300×100×7L2100 324.1 0.9 200×200×20L2100 766.8 4.1 300×100×6.5L2100 306.3 0.8 200×200×10L2100 384.5 1.8 300×100×6L2100 276.7 0.7 200×200×6L2100 198.4 0.6 300×100×5.5L2100 244.4 0.5 200×200×4L2100 101.5 0.4 300×100×5L2100 218.5 0.5 200×200×2.5L2100 49.0 0.3 300×100×4L2100 144.0 0.3 250×250×20L2100 1207.0 2.5 300×100×3L2100 73.4 0.2 250×250×15L2100 908.0 1.9 100×300×15L1500 285.5 2.3 250×250×8L2100 424.4 0.6 100×300×10L1500 149.6 1.1 250×250×6L2100 274.2 0.4 100×300×8L1500 133.7 0.7 250×250×4L2100 146.1 0.3 100×300×6L1500 90.2 0.7 300×300×25L3000 2168.0 2.3 100×300×5.5L1500 80.3 0.5 300×300×15L3000 1290.0 1.2 100×300×5L1500 70.8 0.5 300×300×105L3000 780.0 0.5 100×300×4L1500 48.4 0.5 300×300×7L3000 460.6 0.4 350×100×15L3000 988.0 4.2 300×300×5L3000 275.0 0.3 350×100×10L3000 637.0 1.4 70×50×8L900 30.0 26.4 350×100×8L3000 493.9 0.8 70×50×4L900 15.9 14.9 350×100×7.5L3000 459.2 0.7 70×50×2L900 7.3 2.6 350×100×7L3000 414.5 0.5 70×50×1.5L900 5.0 1.4 350×100×6.5L3000 382.8 0.5 70×50×1L900 2.5 1.2 350×100×6L3000 344.1 0.5 50×70×8L900 17.3 9.2 350×100×5.5L3000 302.6 0.4 50×70×4L900 11.7 6.4 350×100×5L3000 264.5 0.3 50×70×2.5L900 6.8 3.1 350×100×4L3000 183.2 0.3 50×70×2L900 5.0 1.9 100×350×15L1500 312.9 1.1 50×70×1.5L900 3.4 1.9 100×350×12L1500 242.2 1.0 50×70×1L900 1.8 1.3 100×350×9L1500 163.7 0.6 50×30×4L900 7.7 37.1 100×350×7L1500 116.5 0.7 50×30×3L900 5.7 34.5 100×350×6.5L1500 104.9 0.6 50×30×2L900 3.7 19.6 100×350×6L1500 94.2 0.5 50×30×1.5L900 2.7 11.8 100×350×5L1500 60.4 0.6

29
Table 4. Parametric study results
50×30×1L900 1.6 2.2 280×70×8L2100 313.0 1.5 30×50×4L900 4.5 28.2 280×70×6L2100 221.8 0.8 30×50×3L900 3.5 11.9 280×70×5.5L2100 200.8 0.8 30×50×2L900 2.4 7.8 280×70×5L2100 176.3 0.6 30×50×1.5L900 1.6 3.1 280×70×4.5L2100 152.9 0.5 30×50×1L900 0.9 3.6 280×70×4L2100 127.0 0.4 250×100×15L2100 578.1 7.7 280×70×3.5L2100 103.4 0.3 250×100×10L2100 383.5 5.2 280×70×3L2100 78.9 0.3 250×100×8L2100 301.7 2.4 280×70×2L2100 47.6 0.1 250×100×6L2100 217.3 1.2 70×280×11L900 123.2 1.9 250×100×5.5L2100 195.6 1.0 70×280×9L900 98.6 1.4 250×100×5L2100 174.0 0.8 70×280×8L900 84.9 1.3 250×100×4L2100 126.5 0.5 70×280×6L900 58.6 0.8 100×250×13L1500 221.2 2.6 70×280×5L900 41.0 0.8 100×250×9L1500 148.7 1.2 70×280×4.5L900 36.5 0.6 100×250×7L1500 110.6 0.9 70×280×4L900 28.0 0.5 100×250×5L1500 66.0 0.6 100×250×4.5L1500 56.8 0.9 100×250×4L1500 47.7 0.6 100×250×3L1500 29.0 0.6

30
ASCE AS/NZS EC3 DSM CSM u
yielding
MM
u
inelastic
MM
*
u
inelastic
MM
#u
inelastic
MM
u
yielding
MM
u
inelastic
MM
*
u
inelastic
MM
#u
inelastic
MM
u
EC3
MM
&
u
G T
MM
#
u
EC3
MM
u
DSM
MM
#
u
DSM
MM
CSM
u
MM
# of data 180 133 47* 180 180 133 47* 180 180 180 180 180 180 96 Mean (Pm) 1.50 1.34 1.17 1.18 1.50 1.34 1.17 1.18 1.25 1.19 1.15 1.35 1.07 1.13 COV (Vp) 0.264 0.200 0.153 0.116 0.264 0.200 0.153 0.116 0.147 0.133 0.123 0.172 0.127 0.087 Resistance factor (φ0)
0.90 0.90 0.90 0.90 0.90 0.90 0.90 0.90 0.91 0.91 0.91 0.90 0.90 0.91
Reliability index (β0)
2.85 2.92 2.72 2.98 2.71 2.76 2.55 2.79 2.83 2.73 2.65 3.12 2.55 2.75
Resistance factor (φ1)
0.90 0.90 0.90 0.90 0.90 0.90 0.90 0.90 0.90 0.90 0.90 0.90 0.90 0.90
Reliability index (β1)
2.85 2.92 2.72 2.98 2.85 2.92 2.72 2.98 3.00 2.91 2.83 3.12 2.55 2.94 * Specimens that exceeded the limitation (dw/t > λl) of the approach by inelastic reserve capacity in ASCE and AS/NZS # Modified design rules
Table 5: Comparison of the tests and numerical results with the design moment capacities

31
ASCE AS/NZS EC3 DSM
Cy = 3 Cy = 3 Class 1, 2, 3 Class 4 λl < 0.776
λl ≥ 0.776
u
inelastic
MM
#u
inelastic
MM
u
inelastic
MM
#u
inelastic
MM
u
EC3
MM TG
u
MM
&
#u
EC3
MM
u
EC3
MM TG
u
MM
& #
u
EC3
MM
u
DSM
MM
#u
DSM
MM
u
DSM
MM
#u
DSM
MM
# of data 54 82 54 82 63 81 94 117 101 86 81 81 99 99 Mean (Pm) 1.54 1.20 1.54 1.20 1.35 1.47 1.23 1.17 1.11 1.09 1.47 1.04 1.16 1.07 COV (Vp) 0.179 0.119 0.179 0.119 0.083 0.138 0.085 0.154 0.135 0.110 0.138 0.062 0.084 0.142 Resistance factor (φ0)
0.90 0.90 0.90 0.90 0.91 0.90 0.91 0.91 0.91 0.91 0.90 0.90 0.90 0.90
Reliability index (β0)
3.50 3.01 3.33 2.82 3.45 3.50 3.07 2.57 2.46 2.50 3.50 2.70 3.04 2.50
Resistance factor (φ1)
0.90 0.90 0.90 0.90 0.90 0.90 0.90 0.90 0.90 0.90 0.90 0.90 0.90 0.90
Reliability index (β1)
3.50 3.01 3.50 3.01 3.64 3.64 3.26 2.75 2.64 2.69 3.64 2.70 3.04 2.50 # Modified design rules
Table 6: Comparison of the tests and numerical results with the design moment capacities

32
(a)
(b)
Figure 1: (a) Schematic set up of the bending test. (b) Bending test setup of specimen 150×50×2.5L1500
P
Spreader beamRound bar
Test specimenStiffening plate
LVDTs
Loading ram with a lockable bearing
Half-rounded support
Load transferring plate

33
(a) Moment-curvature curves
(b) Normalized moment-curvature curves
Figure 2: Moment-curvature curves of test specimens
0
5
10
15
20
25
30
35
0 5 10 15 20 25
Mom
ent (
kNm
)
Curvature k ×10-4 (mm-1)
50×30×2.5L90030×50×2.5L90050×50×1.5L90050×50×2.5L90070×50×2.5L110050×70×2.5L1100100×50×2.5L150050×100×2.5L1500150×50×2.5L150050×150×2.5L1500
0.0
0.2
0.4
0.6
0.8
1.0
1.2
1.4
1.6
0 2 4 6 8 10 12
M /M
pl
k /kpl
50×30×2.5L90030×50×2.5L90050×50×1.5L90050×50×2.5L90070×50×2.5L110050×70×2.5L1100100×50×2.5L150050×100×2.5L1500150×50×2.5L150050×150×2.5L1500

34
Figure 3. Experimental and numerical failure mode of flexural failure for
specimen 50×30×2.5L900
Figure 4. Experimental and numerical failure mode of interaction of local and flexural failure for specimen 50×50×1.5L900

35
Figure 5: Comparison of load-displacement curves of test and FEA for specimen
50×150×2.5L1500
Figure 6: Comparison of test and numerical results with design strengths by ASCE
and AS/NZS
0
1
2
3
4
5
6
7
8
9
10
0 1 2 3 4
Mom
ent (
kNm
)
Curvature k ×10-4 (mm-1)
TestFEA (without residual stresses)FEA (with residual stresses)
36
Linear elastic stress-distribution (Cy = 1) Elastic-plastic stress-distribution (Cy > 1)
(a) Yu & Laboube [12]
Linear elastic stress-distribution (Cy = 1) Elastic-plastic stress-distribution (Cy > 1)
(a) Proposed
Figure 7: Effective width of cross-section with linear elastic and elastic plastic stress
distribution

37
Figure 8: Locations of kpl, k^pl and ku on moment-curvature curve of specimen 100×50×2.5L1500
Figure 9: Comparison of tests and numerical results with design strengths by EC3
0.0
0.2
0.4
0.6
0.8
1.0
1.2
1.4
1.6
1.8
2.0
0 20 40 60 80 100 120 140
Mu/M
d
b/(tε)
EC3Gardner & TheofanousProposed EC3

38
Figure 10: Class 1 limit of element subject to compression Figure 11: Class 1 limit of element subject to bending
Figure 12: Class 2 limit of element subject to compression Figure 13: Class 2 limit of element subject to bending

39
Figure 14. Class 3 limit of element subject to compression Figure 15. Class 3 limit of element subject to bending

40
Figure 16: Comparison of tests and numerical results with design strengths by DSM
Mu / My