
Corrosion Behavior of SUS 304L Steel in pH13 ... - J-Stage
7
Article Electrochemistry , (in press) Corrosion Behavior of SUS 304L Steel in pH 13 NaOH Solution Takuma NAKAGAWA, a Hisayoshi MATSUSHIMA, a Mikito UEDA, a, * and Hiroshi ITO b a Graduate School of Engineering, Hokkaido University, Kita-13, Nishi-8, Kita-ku, Sapporo, Hokkaido 060-8628, Japan b National Institute of Advanced Industrial Science and Technology, Namiki 1-2-1, Tsukuba, Ibaraki 305-7262, Japan * Corresponding author: [email protected] ABSTRACT In order to investigate the corrosion behavior of SUS 304L steel in alkaline solutions, linear sweep voltammogram measurements were performed in NaOH solutions at pH 12 and 13 at 333 K. Constant potential electrolysis was carried out in an NaOH solution at 333 K at pH 13 from 5 to 20 hours. The surface analysis of the samples before and after the constant potential electrolysis was performed by atomic force microscopy, X-ray photoelectron spectroscopy (XPS), and Raman spectroscopy. The XPS measurements of the samples before the electrolysis showed that Fe and Cr oxide films were formed on the SUS 304L stainless steel surface, and the presence of FeOOH, CrOOH and Ni(OH) 2 on the surface was confirmed after the electrolysis. It is suggested that the dissolved metal ions from the SUS 304L surface reacted with OH - and formed a precipitated film on the surface in the alkaline environment. © The Author(s) 2020. Published by ECSJ. This is an open access article distributed under the terms of the Creative Commons Attribution 4.0 License (CC BY, http://creativecommons.org/licenses/by/4.0/), which permits unrestricted reuse of the work in any medium provided the original work is properly cited. [DOI: 10.5796/electrochemistry.20-00077]. Uploading "PDF file created by publishers" to institutional repositories or public websites is not permitted by the copyright license agreement. Keywords : Corrosion, SUS 304L, High Alkaline Solution 1. Introduction In recent years, interest in hydrogen energy has been increasing as an environmentally friendly energy source. One method for producing hydrogen and oxygen is the water electrolysis method. The water electrolysis method is expected to produce hydrogen with low carbon generation in the future by using renewable energy sources such as wind power and sunlight. 1,2 Alkaline water electrolysis has been used commercially for several decades, but has the disadvantage of high cell voltage and low current density due to high internal resistance. 3 Subsequently, an electrolysis cell using a proton exchange membrane (PEM) with lower internal resistance has been developed. 2,4 The PEM type water electrolysis has several advantages over alkaline water electrolysis, including compact shape and the high purity of the hydrogen produced. However, to use the PEM type water electrolysis on a large scale, 5,6 noble metals such as platinum and iridium alloys must be used as stable metal components under the acidic conditions of the electrolyte of the PEM type water electrolysis. 7 In addition, since there is no track record of large-scale devices exceeding megawatt generating capacity, further studies are required. A different method of water electrolysis for hydrogen production is using an alkaline electrolyte with metals other than noble metals. This is considered potentially more advantageous than the PEM type water electrolysis when considering apparatus costs and up-scaling. Chatzichristodoulou et al. reported improving PEM reaction efficiency by thinning the porous diaphragm in an alkaline water electrolytic cell and increasing the operating temperature. 8 A different approach is to use an alkaline polymer electrolyte membrane (AEM) using a hydroxide salt-type cationic ionomer anion. 8–10 It has been suggested that AEM type water electrolysis will make it possible to reduce costs by using low cost catalysts such as metal oxides and metal/nitrogen doped carbon. Water electrolysis using such an AEM utilizes alkaline electrolytes like 1 M KOH solution or 1 M NaOH solutions. 11–14 These alkaline solutions greatly improve the cell performance, but the high pH may promote corrosion. 10,15–17 In the AEM type water electrolysis, titanium is used as the container material because titanium is very stable against corrosion in alkaline environments. 15 However, titanium is also expensive and it makes the cost of the electrolysis cell high. For this reason AEM type electrolysis cells employing lower cost metals other than titanium would be attractive. 9,18–21 Stainless steel contains elements such as chromium, nickel, manganese, and silicon, and it is based on iron, wherefore it has excellent corrosion resistance. Ohtsuka et al. reported that iron forms oxides and oxyhydroxides on the surface in alkaline solutions, 22 and that stainless steel also forms oxyhydr- oxides. 23,24 Since the formed dense and thin passive film protects the inside metal, it has high corrosion resistance and can be used in a wide range of environments. 25–27 Corrosion resistance of stainless steel is poor in acidic environ- ment such as PEM type fuel cells. For example, Lædre et al. used SUS 304 in 0.1 M Na 2 SO 4 and 1mM H 2 SO 4 mixed solutions, 4 Wang et al. used SUS 310L and SUS 316L in 1 M H 2 SO 4 and 2 ppm F ¹ ions also in mixed solutions. 28 In both cases, the surface oxide film broke down and the stainless steel corroded. 4,28 As AEM type water electrolysis uses alkaline solutions, the use of stainless steel can be possible. Benaioun et al. reported that when SUS 304 is immersed in NaOH solution, the surface oxide film grew over time and protected the inside of vessels. 29 Relatedly, it has been reported that stainless steel exhibits corrosion resistance in NaOH solutions of pH 13 when there is no applied potential or with mixed solutions of NaOH and KOH from pH 9 to 13. 29,30 We are considering using stainless steel as a container material in AEM type water electrolysis, and it is known that weak electric fields can be applied to container materials during electrolysis. To further elucidate this, it is necessary to examine the corrosion resistance of stainless steel by applying potential lower than those applied to the electrodes in electrolysis. There have been few reports to evaluate the corrosion resistance while applying a potential to stainless steel for more than 10 hours in an alkaline solution. In this paper, as a weak electric field, a potential equivalent to about half the electrolysis potential was applied to stainless steel for up to 20 Electrochemistry Received: June 2, 2020 Accepted: July 3, 2020 Published online: August 7, 2020 The Electrochemical Society of Japan https://doi.org/10.5796/electrochemistry.20-00077 Advance Publication by J-STAGE i
-
Upload
khangminh22 -
Category
Documents
-
view
8 -
download
0
Transcript of Corrosion Behavior of SUS 304L Steel in pH13 ... - J-Stage
Article Electrochemistry, (in press)
Corrosion Behavior of SUS 304L Steel in pH 13 NaOH Solution
Takuma NAKAGAWA,a Hisayoshi MATSUSHIMA,a Mikito UEDA,a,* and Hiroshi ITOb
a Graduate School of Engineering, Hokkaido University, Kita-13, Nishi-8, Kita-ku, Sapporo, Hokkaido 060-8628, Japanb National Institute of Advanced Industrial Science and Technology, Namiki 1-2-1, Tsukuba, Ibaraki 305-7262, Japan
* Corresponding author: [email protected]
ABSTRACTIn order to investigate the corrosion behavior of SUS 304L steel in alkaline solutions, linear sweep voltammogram measurements wereperformed in NaOH solutions at pH 12 and 13 at 333 K. Constant potential electrolysis was carried out in an NaOH solution at 333 K atpH 13 from 5 to 20 hours. The surface analysis of the samples before and after the constant potential electrolysis was performed by atomicforce microscopy, X-ray photoelectron spectroscopy (XPS), and Raman spectroscopy. The XPS measurements of the samples before theelectrolysis showed that Fe and Cr oxide films were formed on the SUS 304L stainless steel surface, and the presence of FeOOH, CrOOH andNi(OH)2 on the surface was confirmed after the electrolysis. It is suggested that the dissolved metal ions from the SUS 304L surface reactedwith OH− and formed a precipitated film on the surface in the alkaline environment.
© The Author(s) 2020. Published by ECSJ. This is an open access article distributed under the terms of the Creative Commons Attribution 4.0 License (CC BY,http://creativecommons.org/licenses/by/4.0/), which permits unrestricted reuse of the work in any medium provided the original work is properly cited. [DOI:
10.5796/electrochemistry.20-00077]. Uploading "PDF file created by publishers" to institutional repositories or public websites is not permitted by the copyrightlicense agreement.
Keywords : Corrosion, SUS 304L, High Alkaline Solution
1. Introduction
In recent years, interest in hydrogen energy has been increasingas an environmentally friendly energy source. One method forproducing hydrogen and oxygen is the water electrolysis method.The water electrolysis method is expected to produce hydrogen withlow carbon generation in the future by using renewable energysources such as wind power and sunlight.1,2 Alkaline waterelectrolysis has been used commercially for several decades, buthas the disadvantage of high cell voltage and low current densitydue to high internal resistance.3 Subsequently, an electrolysis cellusing a proton exchange membrane (PEM) with lower internalresistance has been developed.2,4 The PEM type water electrolysishas several advantages over alkaline water electrolysis, includingcompact shape and the high purity of the hydrogen produced.However, to use the PEM type water electrolysis on a large scale,5,6
noble metals such as platinum and iridium alloys must be usedas stable metal components under the acidic conditions of theelectrolyte of the PEM type water electrolysis.7 In addition, sincethere is no track record of large-scale devices exceeding megawattgenerating capacity, further studies are required.
A different method of water electrolysis for hydrogen productionis using an alkaline electrolyte with metals other than noble metals.This is considered potentially more advantageous than the PEM typewater electrolysis when considering apparatus costs and up-scaling.Chatzichristodoulou et al. reported improving PEM reactionefficiency by thinning the porous diaphragm in an alkaline waterelectrolytic cell and increasing the operating temperature.8
A different approach is to use an alkaline polymer electrolytemembrane (AEM) using a hydroxide salt-type cationic ionomeranion.8–10 It has been suggested that AEM type water electrolysiswill make it possible to reduce costs by using low cost catalysts suchas metal oxides and metal/nitrogen doped carbon. Water electrolysisusing such an AEM utilizes alkaline electrolytes like 1M KOHsolution or 1M NaOH solutions.11–14 These alkaline solutionsgreatly improve the cell performance, but the high pH may promotecorrosion.10,15–17
In the AEM type water electrolysis, titanium is used as thecontainer material because titanium is very stable against corrosionin alkaline environments.15 However, titanium is also expensive andit makes the cost of the electrolysis cell high. For this reason AEMtype electrolysis cells employing lower cost metals other thantitanium would be attractive.9,18–21 Stainless steel contains elementssuch as chromium, nickel, manganese, and silicon, and it is based oniron, wherefore it has excellent corrosion resistance. Ohtsuka et al.reported that iron forms oxides and oxyhydroxides on the surface inalkaline solutions,22 and that stainless steel also forms oxyhydr-oxides.23,24 Since the formed dense and thin passive film protects theinside metal, it has high corrosion resistance and can be used in awide range of environments.25–27
Corrosion resistance of stainless steel is poor in acidic environ-ment such as PEM type fuel cells. For example, Lædre et al. usedSUS 304 in 0.1M Na2SO4 and 1mM H2SO4 mixed solutions,4
Wang et al. used SUS 310L and SUS 316L in 1M H2SO4 and 2 ppmF¹ ions also in mixed solutions.28 In both cases, the surface oxidefilm broke down and the stainless steel corroded.4,28
As AEM type water electrolysis uses alkaline solutions, the useof stainless steel can be possible. Benaioun et al. reported thatwhen SUS 304 is immersed in NaOH solution, the surface oxidefilm grew over time and protected the inside of vessels.29
Relatedly, it has been reported that stainless steel exhibits corrosionresistance in NaOH solutions of pH 13 when there is no appliedpotential or with mixed solutions of NaOH and KOH from pH 9 to13.29,30
We are considering using stainless steel as a container material inAEM type water electrolysis, and it is known that weak electricfields can be applied to container materials during electrolysis. Tofurther elucidate this, it is necessary to examine the corrosionresistance of stainless steel by applying potential lower than thoseapplied to the electrodes in electrolysis. There have been few reportsto evaluate the corrosion resistance while applying a potential tostainless steel for more than 10 hours in an alkaline solution. In thispaper, as a weak electric field, a potential equivalent to about halfthe electrolysis potential was applied to stainless steel for up to 20
Electrochemistry Received: June 2, 2020
Accepted: July 3, 2020
Published online: August 7, 2020
The Electrochemical Society of Japan https://doi.org/10.5796/electrochemistry.20-00077
Advance Publication by J-STAGE
i
hours, and the corrosion resistance of the stainless steel surface wasevaluated. A pH 12 or 13 NaOH solution is considered as acandidate for these electrolytes.
In this paper, experiments were conducted with a pH 13 NaOHsolution to evaluate a more severe environment for stainless steel,and a pH 12 NaOH solution was also used for comparison.Commercially available SUS 304L was used as the stainless steel,and electrochemical measurements were performed. The change inroughness of the SUS 304L surface before and after the electrolysiswas measured by atomic force microscopy (AFM), and thecorrosion products formed on the surface were analyzed by X-rayphotoelectron spectroscopy (XPS) and Raman spectroscopy.
2. Experimental
Specimens of SUS 304L plate (Nippon Steel Stainless Steel:chemical composition: 18–20wt% Cr, 9–13% Ni, ¯0.030% C,¯1.00% Si, ¯2.00% Mn, ¯0.045% P, ¯0.030% S) were cut into40 © 10 © 1mm coupons, polished with water-resistant SiC polish-ing paper (Struers: # 400 to 2400) and finished to a mirror surfaceusing alumina powder (Struers: T = 0.06 µm). After polishing,ultrasonic cleaning with distilled water and acetone was used. TheNaOH solutions of pH 12 and 13 were prepared by sodiumhydroxide (Nacalai Tescque: 97%) and distilled water as theelectrolyte. The experimental cell was a cylindrical PTFE and theworking, counter, and reference electrodes were attached to the lidof the cell. The SUS 304L specimen was used as the workingelectrode, platinum plate for the counter electrode, and Hg/HgO(0.098V vs. SHE, International Chemistry) for the referenceelectrode. The experimental temperature was maintained at 60°Cand 150mL of the electrolyte prepared at pH 13 was used. LinearSweep Voltammogram (LSV) measurements were performed fromthe open circuit potential to 1.0V (vs. Hg/HgO) at a sweep rate of5mVs¹1. A potentiostat (Hokuto Denko: HZ-7000) was used tocontrol the potential. Constant potential electrolysis was performedat a potential of 1.0V (vs. Hg/HgO) for 5, 10 and 20 hours. Thesurface roughness of the SUS 304L before and after the constantpotential electrolysis was measured by atomic force microscopy(AFM) (Shimadzu Corporation: SPM-9700HT). In the measure-ments, the contact mode, a sweep speed of 2Hz, and the resolutionof 512 © 512 pixels were selected.
When performing ICP atomic emission spectroscopy (ICP-AES,iCAP6300, Thermo Scientific), 50mL of the electrolyte after theelectrolysis was controlled from pH 13 to pH 3 by the addition of1M nitric acid. Then, the Fe, Cr, and Ni concentrations in theelectrolyte was quantitatively analyzed.
An XPS (JEOL: JPS-9200) was used to examine the surfaceand depth profile before and after the electrolysis. In the XPSmeasurements, an Al anode was used with the acceleration voltageof 10 kV. Calibration was performed based on carbon (285.0 eV).Qualitative and quantitative analyses were performed in 1mm ©1mm areas while etching the sample. The etching rate was3.03 nmmin¹1 (SiO2 reference), and an etching was continued for20 seconds. The specimens before electrolysis and after 5 hours ofelectrolysis were analyzed by laser Raman microscopy (Nano-photon: RAMANtouch Basic VIS-HM). The excitation wavelengthwas 532 nm, and mapping measurements were carried out on thespecimen with a range of 342.7 µm © 50.9 µm.
3. Results and Discussion
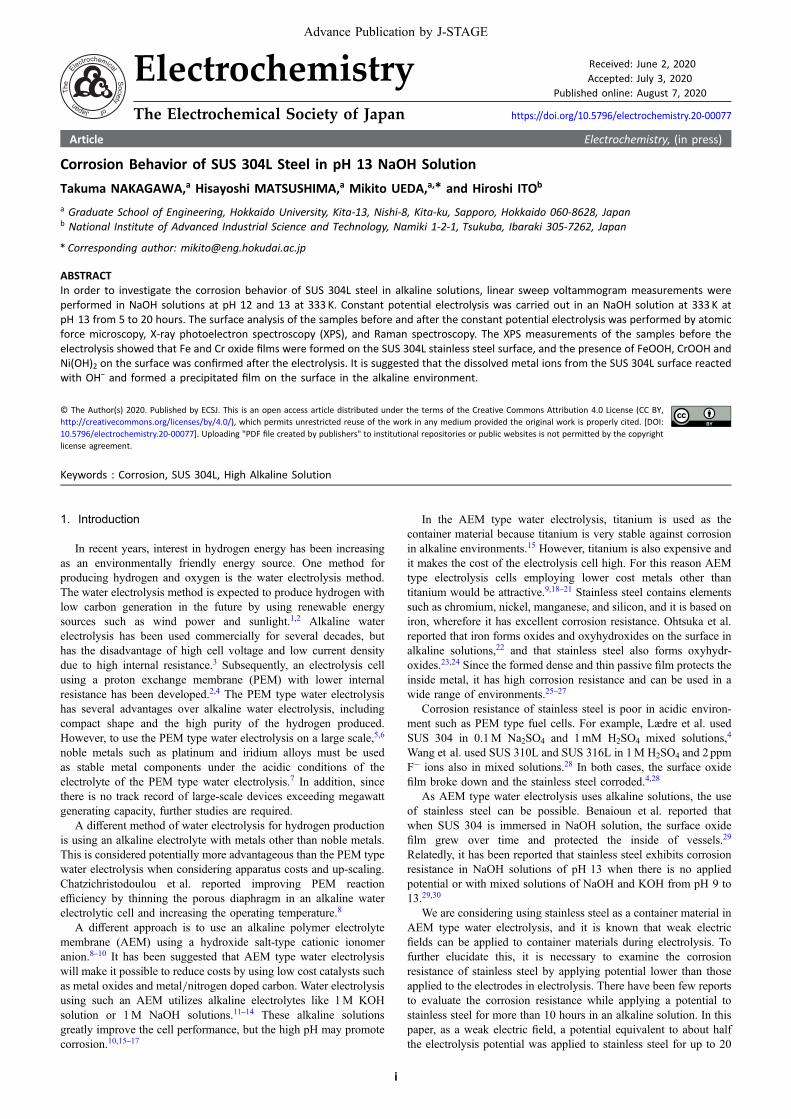
The results of the LSV measurements with NaOH solutionsprepared at pH 12 and 13 at a temperature of 60°C are shown inFig. 1. From this figure, a slight increase in anode current at 0.15Vand a steep increase from about 0.65V was observed in the solutionat pH 13. A steep increase from about 0.77V was observed for the
pH 12 NaOH solution. There was no change in the color of eithersolution before or after the LSV measurement.
In the anode current in Fig. 1, no oxygen evolution reactioncould be confirmed until after about 0.65V, suggesting possibility ofdissolution of the metal elements from the stainless steel surface.The steep increases in the anode current seen in Fig. 1 may be aclear indication of an oxygen evolution reaction from the electrodesurfaces. The oxygen evolution reaction in an alkaline solution issuggested to be the following,
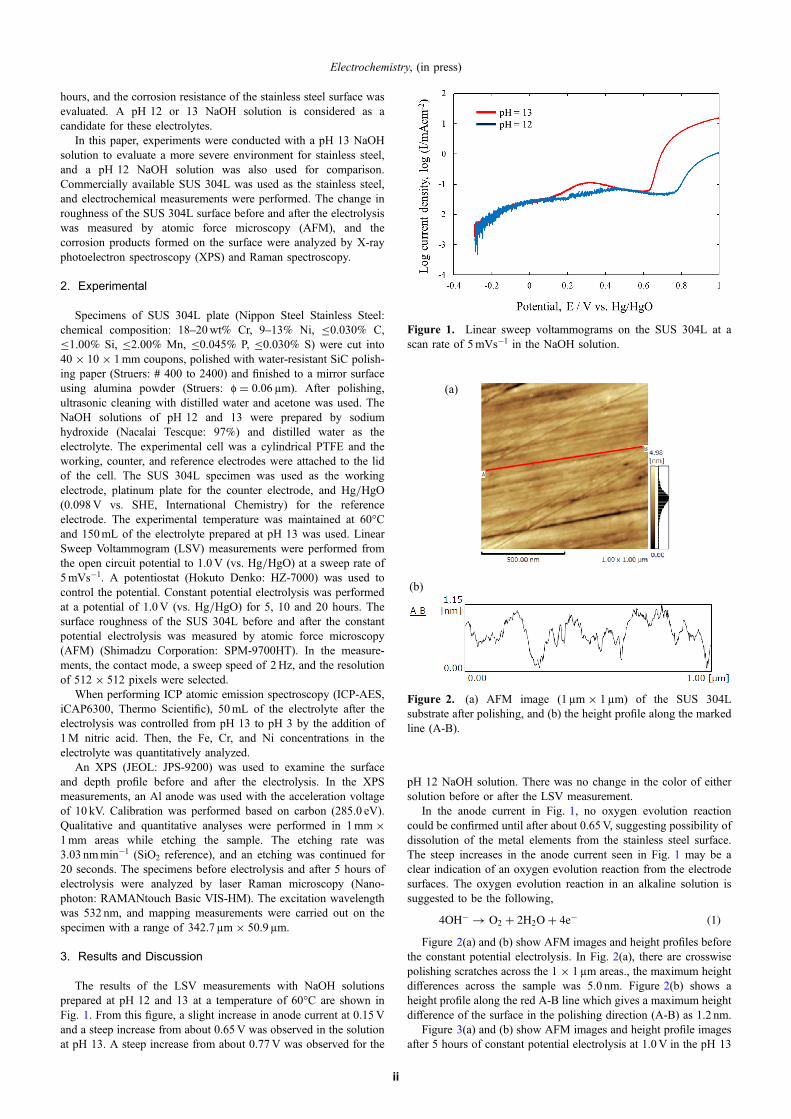
4OH� ! O2 þ 2H2Oþ 4e� ð1ÞFigure 2(a) and (b) show AFM images and height profiles before
the constant potential electrolysis. In Fig. 2(a), there are crosswisepolishing scratches across the 1 © 1µm areas., the maximum heightdifferences across the sample was 5.0 nm. Figure 2(b) shows aheight profile along the red A-B line which gives a maximum heightdifference of the surface in the polishing direction (A-B) as 1.2 nm.
Figure 3(a) and (b) show AFM images and height profile imagesafter 5 hours of constant potential electrolysis at 1.0V in the pH 13
Figure 1. Linear sweep voltammograms on the SUS 304L at ascan rate of 5mVs¹1 in the NaOH solution.
(a)
(b)
Figure 2. (a) AFM image (1 µm © 1µm) of the SUS 304Lsubstrate after polishing, and (b) the height profile along the markedline (A-B).
Electrochemistry, (in press)
ii

NaOH solution. In Fig. 3(b), the maximum height difference (A-Bline in (a)) is about 4.1 nm. The Fig. 3(c) and (d) show AFM imagesand height profile after 20 hours of constant potential electrolysiswith maximum height difference (A-B line in (c)) of about 7.2 nm.
The reason why the maximum height differences in 20 hours arelarger than that of 5 hours in Fig. 3 is considered that continuousdissolution occurred on the surface during the electrolysis in theNaOH solution. This is consistent with the result shown in Fig. 1and may be ascribed to oxygen generation accompanied by oxidefilm breakdown.
Figure 4 shows the concentration change of Fe, Cr, and Ni versuselectrolysis time by the ICP-AES analysis. The Cr concentrations
increase slightly until 10 hours of electrolysis following which thereis very little change, the Fe changes until 20 hours. Dissolution of Niwas not detected at any of the sampling points.
The Fe, Cr, and Ni concentrations in the electrolyte after 5 hoursof constant potential electrolysis were 0.06, 0.03, and 0 ppm,respectively. The quantity of electric charge that had flowed in theconstant potential electrolysis during the 5 hours was QT =346Ccm¹2. The amount of electric charge required for Fe todissolve as Fe2+, and for the concentration to reach 0.06 ppmrequires an electric charge of 0.20Ccm¹2. Similarly, for Cr todissolve as Cr3+ 0.16Ccm¹2 is needed to reach the concentrationof 0.03 ppm. The remaining amount of electric charge would beavailable for oxygen evolution and 345.64Ccm¹2 would beavailable for formation of oxides and hydroxides. Similarly, thecalculated amount of electric charge for the 10 and 20 h of constantpotential electrolysis are 664Ccm¹2 and 1421Ccm¹2. The dissolvedamounts of Cr and Fe were 0.44Ccm¹2 and 0.51Ccm¹2 by the ICPanalysis. From this it may be concluded that the current used fordissolution of stainless steel is very small and most of the current isused in the oxygen generation reaction, further, the dissolution ofstainless steel decreases with increasing electrolysis time.
Figure 5(a)–(e) show the XPS spectrums of the specimen forC 1s, O 1s, Cr 2p3/2, Fe 2p3/2, and Ni 2p3/2 before the constantpotential electrolysis. Immediately before the constant potentialelectrolysis, the samples had been polished, and peak separation wasperformed to evaluate the possibility of the presence of metal andmetal oxide on the sample surface. The result of the XPSmeasurements for C 1s in Fig. 5(a) was resolved into three peaksat 285.0 eV, 286.5 eV, and 288.9 eV, as in previous reports.31–34 Inthe result for O 1s in Fig. 5(b), two peaks resolution, at 529.9 and532.2 eV, was performed. For the results of Cr 2p3/2 in Fig. 5(c), itwas thought that two peaks, at 574.3 and 576.5 eV, overlapped.
(a) (b)
(c) (d)
Figure 3. (a) AFM image of the SUS 304L surface and (b) the height profile along the marked line (A-B) after constant potentialelectrolysis at 1.0V vs. Hg/HgO for 5 hours in NaOH solution at pH = 13. (c) AFM image of the SUS 304L surface and (d) the height profilealong the marked line (A-B) after constant potential electrolysis at 1.0V vs. Hg/HgO for 20 hours in NaOH solution at pH = 13.
Figure 4. Concentration change of Fe, Cr and Ni in NaOHsolution of pH 13 after constant potential electrolysis from 5 to 20hours.
Electrochemistry, (in press)
iii
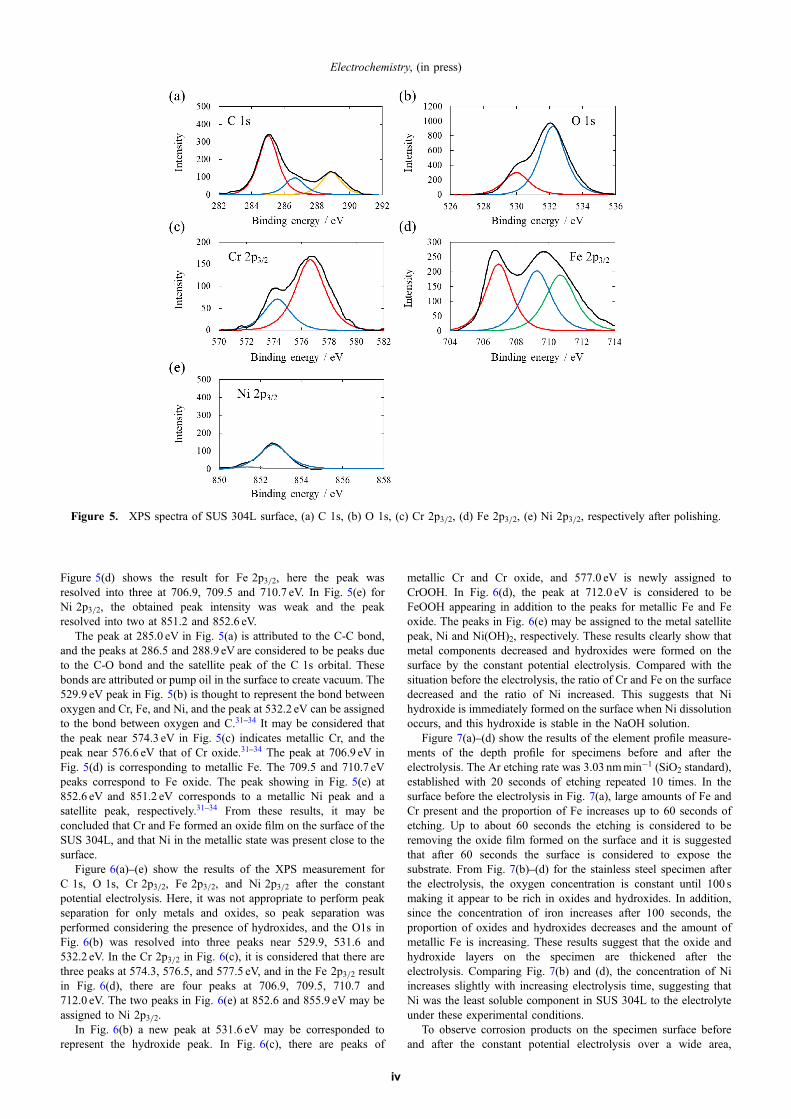
Figure 5(d) shows the result for Fe 2p3/2, here the peak wasresolved into three at 706.9, 709.5 and 710.7 eV. In Fig. 5(e) forNi 2p3/2, the obtained peak intensity was weak and the peakresolved into two at 851.2 and 852.6 eV.
The peak at 285.0 eV in Fig. 5(a) is attributed to the C-C bond,and the peaks at 286.5 and 288.9 eV are considered to be peaks dueto the C-O bond and the satellite peak of the C 1s orbital. Thesebonds are attributed or pump oil in the surface to create vacuum. The529.9 eV peak in Fig. 5(b) is thought to represent the bond betweenoxygen and Cr, Fe, and Ni, and the peak at 532.2 eV can be assignedto the bond between oxygen and C.31–34 It may be considered thatthe peak near 574.3 eV in Fig. 5(c) indicates metallic Cr, and thepeak near 576.6 eV that of Cr oxide.31–34 The peak at 706.9 eV inFig. 5(d) is corresponding to metallic Fe. The 709.5 and 710.7 eVpeaks correspond to Fe oxide. The peak showing in Fig. 5(e) at852.6 eV and 851.2 eV corresponds to a metallic Ni peak and asatellite peak, respectively.31–34 From these results, it may beconcluded that Cr and Fe formed an oxide film on the surface of theSUS 304L, and that Ni in the metallic state was present close to thesurface.
Figure 6(a)–(e) show the results of the XPS measurement forC 1s, O 1s, Cr 2p3/2, Fe 2p3/2, and Ni 2p3/2 after the constantpotential electrolysis. Here, it was not appropriate to perform peakseparation for only metals and oxides, so peak separation wasperformed considering the presence of hydroxides, and the O1s inFig. 6(b) was resolved into three peaks near 529.9, 531.6 and532.2 eV. In the Cr 2p3/2 in Fig. 6(c), it is considered that there arethree peaks at 574.3, 576.5, and 577.5 eV, and in the Fe 2p3/2 resultin Fig. 6(d), there are four peaks at 706.9, 709.5, 710.7 and712.0 eV. The two peaks in Fig. 6(e) at 852.6 and 855.9 eV may beassigned to Ni 2p3/2.
In Fig. 6(b) a new peak at 531.6 eV may be corresponded torepresent the hydroxide peak. In Fig. 6(c), there are peaks of
metallic Cr and Cr oxide, and 577.0 eV is newly assigned toCrOOH. In Fig. 6(d), the peak at 712.0 eV is considered to beFeOOH appearing in addition to the peaks for metallic Fe and Feoxide. The peaks in Fig. 6(e) may be assigned to the metal satellitepeak, Ni and Ni(OH)2, respectively. These results clearly show thatmetal components decreased and hydroxides were formed on thesurface by the constant potential electrolysis. Compared with thesituation before the electrolysis, the ratio of Cr and Fe on the surfacedecreased and the ratio of Ni increased. This suggests that Nihydroxide is immediately formed on the surface when Ni dissolutionoccurs, and this hydroxide is stable in the NaOH solution.
Figure 7(a)–(d) show the results of the element profile measure-ments of the depth profile for specimens before and after theelectrolysis. The Ar etching rate was 3.03 nmmin¹1 (SiO2 standard),established with 20 seconds of etching repeated 10 times. In thesurface before the electrolysis in Fig. 7(a), large amounts of Fe andCr present and the proportion of Fe increases up to 60 seconds ofetching. Up to about 60 seconds the etching is considered to beremoving the oxide film formed on the surface and it is suggestedthat after 60 seconds the surface is considered to expose thesubstrate. From Fig. 7(b)–(d) for the stainless steel specimen afterthe electrolysis, the oxygen concentration is constant until 100 smaking it appear to be rich in oxides and hydroxides. In addition,since the concentration of iron increases after 100 seconds, theproportion of oxides and hydroxides decreases and the amount ofmetallic Fe is increasing. These results suggest that the oxide andhydroxide layers on the specimen are thickened after theelectrolysis. Comparing Fig. 7(b) and (d), the concentration of Niincreases slightly with increasing electrolysis time, suggesting thatNi was the least soluble component in SUS 304L to the electrolyteunder these experimental conditions.
To observe corrosion products on the specimen surface beforeand after the constant potential electrolysis over a wide area,
Figure 5. XPS spectra of SUS 304L surface, (a) C 1s, (b) O 1s, (c) Cr 2p3/2, (d) Fe 2p3/2, (e) Ni 2p3/2, respectively after polishing.
Electrochemistry, (in press)
iv

mapping measurements were carried out using a scanning Ramanmicroscope, and the results of the surface before electrolysis areshown in Fig. 8(a) and (b). The upper part of (a) is an opticalmicrograph of the measured part, and the lower black part is themapped image of the measured part. In the lower part, most of areais black with a number of yellow and green points. The black area
means no signal point in Raman measurement. The two spectrumscorresponding to the colored points are shown in Fig. 8(b). Peaksshow at 220, 288, 400, 494, and 660 cm¹1 in the spectrum ofthe yellow areas. A peak was observed at 233 cm¹1 in thegreen spectrum. The peak shown as yellow is considered to beFe2O3
24,35–37 and the part shown in green does not correspond to any
Figure 7. Depth profiles of SUS 304L by XPS analysis, (a) after polishing and after constant potential electrolysis for (b) 5 hours, (c) 10hours and (d) 20 hours, respectively.
Figure 6. XPS spectra of SUS 304L surface, (a) C 1s, (b) O 1s, (c) Cr 2p3/2, (d) Fe 2p3/2, (e) Ni 2p3/2, respectively after constant potentialelectrolysis at 1.0V for 5 hours.
Electrochemistry, (in press)
v

(a)
(b)
Figure 8. (a) Optical micrograph of the measured part (top half ) and the mapped image of the measured part by a scanning Ramanmicroscope (bottom half ). (b) Raman spectra of SUS 304L after polishing (yellow: Fe2O3, green: unknown).
(a)
(b)
Figure 9. (a) Optical micrograph of the measured part (top half ) and the mapped image of the measured part by a scanning Ramanmicroscope (bottom half ). (b) Raman spectra of SUS 304L after constant potential electrolysis for 5 hours (red: C-FeOOH, yellow: Fe2O3,blue: Fe3O4).
Electrochemistry, (in press)
vi

identifiable compound. In a report by Maslar et al., oxide formationwas confirmed on the surface of SUS 304L,38 and it is consideredthat in the present study oxide was also formed on the surface of thesample before the constant potential electrolysis.
Figure 9(a) shows an optical micrograph of the measured part,and the lower black part is the mapped image of the measured partafter 5 hours of constant potential electrolysis. The three spectrumscorresponding to the colored points are shown in Fig. 9(b). Blue,red, and yellow points indicate different compounds, and it can beseen that there are more points than before the electrolysis shown inFig. 8(a). In Fig. 9(b), the red spectrum is for C-FeOOH, the yellowfor Fe2O3, and the blue is considered to be due to Fe3O4 as has beenreported by Ohtsuka.23 Based on this result, C-FeOOH was notpresent before the electrolysis while it is detected after theelectrolysis, this result suggests that the formation of C-FeOOHtakes place through Fe(OH)2 or Fe(OH)3. The reason why thespectrums of CrOOH and Ni(OH)2 were not detected by the Ramanmicroscopy is that the films are very thin, at a few nm, and the laseroutput is controlled as weak.
Overall, it was found that most of the current was used foroxygen generation when the constant potential electrolysis wascarried out at 1.0V. Immediately after the start of the electrolysis,there was a slight dissolution from the specimen surface withoxygen generation. The dissolved metal component then forms anoxyhydroxide and hydroxides. As a result, the substrate isconsidered to become protected. Since the dissolved amounts ofFe and Cr are very small, it may be considered that SUS 304L couldbe used as container material for water electrolysis using an NaOHaqueous solution of pH 13.
4. Conclusions
From the results of the LSV measurements in an environment of60°C using SUS 304L stainless steel as an electrode and NaOHsolution at pH 12 and 13, it was found that the current density of theanode was larger at pH 13.
From the constant potential electrolysis at 60°C with pH 13, itwas found that the sample surface before electrolysis was uniform,the height differences across the surface increased after constantpotential electrolysis. From the results of ICP measurement, it wasshown that Fe and Cr in the stainless steel surface were slightlydissolved into the electrolyte. From the XPS measurement, it wasobserved that FeOOH, CrOOH, and Ni(OH)2 were present on thesurface after the electrolysis. Corrosion resistance of SUS 304L withan applied potential in NaOH solution of pH 13 was excellent and itwill be suitable as a container material for water electrolysis cells.
Acknowledgments
Part of the experiments reported here are supported by the NewEnergy and Industrial Technology Development Organization(NEDO).
References
1. B. Pivovar, N. Rustagi, and S. Satyapal, Electrochem. Soc. Interface, 27, 47(2018).
2. P. Lettenmeier, R. Wang, R. Abouatallah, F. Burggraf, A. S. Gago, and K. A.Friedrich, J. Electrochem. Soc., 163, F3119 (2016).
3. D. Pletcher and X. Li, Int. J. Hydrogen Energy, 36, 15089 (2011).4. S. Lædre, O. E. Kongstein, A. Oedegaard, H. Karoliussen, and F. Seland, Int. J.
Hydrogen Energy, 42, 2713 (2017).5. U. Babic, M. Suermann, F. N. Büchi, L. Gubler, and T. J. Schmidt, J. Electrochem.
Soc., 164, F387 (2017).6. G. Yang, S. Yu. J. Mo, Z. Kang, Y. Dohrmann, F. A. List, J. B. Green, S. S. Babu,
and F. Zhang, J. Power Sources, 396, 590 (2018).7. M. Schalenbach, G. Tjarks, M. Carmo, W. Lueke, M. Mueller, and D. Stolten,
J. Electrochem. Soc., 163, F3197 (2016).8. C. Chatzichristodoulou, F. Allebrod, and M. B. Mogensen, J. Electrochem. Soc.,
163, F3036 (2016).9. H. Li, M. R. Kraglund, A. K. Reumert, X. Ren, D. Aili, and J. Yang, J. Mater.
Chem. A, 7, 17914 (2019).10. X. Li, F. C. Walsh, and D. Pletcher, Phys. Chem. Chem. Phys., 13, 1162 (2011).11. Y. Leng, G. Chen, A. J. Mendoza, T. B. Tighe, M. A. Hickner, and C. Y. Wang,
J. Am. Chem. Soc., 134, 9054 (2012).12. L. Xiao, S. Zhang, J. Pan, C. Yang, M. He, L. Zhuang, and J. Lu, Energy Environ.
Sci., 5, 7869 (2012).13. E. J. Park, C. B. Capuano, K. E. Ayers, and C. Bae, J. Power Sources, 375, 367
(2018).14. X. Wu and K. Scott, J. Power Sources, 214, 124 (2012).15. M. K. Cho, H. Y. Park, H. J. Lee, H. J. Kim, A. Lim, D. Henkensmeier, S. J. Yoo,
J. Y. Kim, S. Y. Lee, H. S. Park, and J. H. Jang, J. Power Sources, 382, 22 (2018).16. Z. Liu, S. D. Sajjad, Y. Gao, H. Yang, J. J. Kaczur, and R. I. Masel, Int. J.
Hydrogen Energy, 42, 29661 (2017).17. J. Hnát, M. Plevová, J. Žitka, M. Paidar, and K. Bouzek, Electrochim. Acta, 248,
547 (2017).18. J. André, L. Antoni, and J. P. Petit, Int. J. Hydrogen Energy, 35, 3684 (2010).19. J. André, L. Antoni, J. P. Petit, E. De Vito, and A. Montani, Int. J. Hydrogen
Energy, 34, 3125 (2009).20. D. D. Papadias, R. K. Ahluwalia, J. K. Thomson, H. M. Meyer, M. P. Brady, H.
Wang, J. A. Turneer, R. Mukundan, and R. Borup, J. Power Sources, 273, 1237(2015).
21. Y. Yang, L. J. Guo, and H. Liu, Int. J. Hydrogen Energy, 36, 1654 (2011).22. T. Ohtsuka, K. Azumi, and N. Sato, Corros. Sci., 31, 155 (1990).23. T. Ohtsuka, Mater. Trans., JIM, 37, 67 (1996).24. T. Ohtsuka, Hyomen Kagaku, 36, 12 (2015).25. N. E. Hakiki and M. Da Cunha Belo, J. Electrochem. Soc., 143, 3088 (1996).26. M. Da Cunha Belo, N. E. Hakiki, and M. G. S. Ferreira, Electrochim. Acta, 44,
2473 (1999).27. N. B. Hakiki, S. Boudin, B. Rondot, and M. Da Cunha Belo, Corros. Sci., 37,
1809 (1995).28. J. T. Wang, W. W. Wang, C. Wang, and Z. Q. Mao, Int. J. Hydrogen Energy, 37,
12069 (2012).29. N. E. Benaioun, I. Maaafa, A. Florentin, E. Denys, N. E. Hakiki, N. Moulayat, and
J. L. Bubendorff, Appl. Surf. Sci., 436, 646 (2018).30. L. Freire, M. J. Carmezim, M. G. S. Ferreira, and M. F. Montemor, Electrochim.
Acta, 55, 6174 (2010).31. S. Anantharaj, S. Chatterjee, K. C. Swaathini, T. S. Amarnath, E. Subhashini,
D. K. Paattanayak, and S. Kundu, ACS Sustain. Chem. Eng., 6, 2498 (2018).32. H. Schäfer, K. Küpper, K. M. Buschbaum, D. Daum, M. Steinhart, J.
Wollschläger, U. Krupp, M. Schmidt, W. Han, and J. Stangl, Nanoscale, 9,17829 (2017).
33. J. M. Olivares-Ramírez, M. L. Campos-Cornelio, J. Uribe Godínez, E. Borja-Arco,and R. H. Castellanos, Int. J. Hydrogen Energy, 32, 3170 (2007).
34. H. Zhong, J. Wang, F. Meng, and X. Zhang, Angew. Chem., Int. Ed., 55, 9937(2016).
35. D. L. A. de Faria, S. Venâncio Silva, and M. T. de Oliveira, J. Raman Spectrosc.,28, 873 (1997).
36. Z.-Q. Tian and B. Ren, Annu. Rev. Phys. Chem., 55, 197 (2004).37. J. E. Maslar, W. S. Hurst, W. J. Bowers, Jr., J. H. Hendricks, and E. S. Windsor,
J. Electrochem. Soc., 156, C103 (2009).38. J. E. Maslar, W. S. Hurst, J. J. Bowers, and J. H. Hendricks, Corros. Sci., 58, 739
(2002).
Electrochemistry, (in press)
vii