Controlling geological and hydrogeological processes in an arsenic contaminated aquifer on the Red...
17
Controlling geological and hydrogeological processes in an arsenic contaminated aquifer on the Red River flood plain, Vietnam Flemming Larsen a, * , Nhan Quy Pham b , Nhan Duc Dang c , Dieke Postma a , Søren Jessen d , Viet Hung Pham e , Thao Bach Nguyen b , Huy Duc Trieu b , Luu Thi Tran e , Hoan Nguyen b , Julie Chambon d , Hoan Van Nguyen b , Dang Hoang Ha b , Nguyen Thi Hue e , Mai Thanh Duc e , Jens Christian Refsgaard a a Geological Survey of Denmark and Greenland (GEUS), Østervoldgade 10, DK-1350 Copenhagen K, Denmark b Hanoi University of Mining and Geology, Viet Nam c Institute for Nuclear Science and Technology, Viet Nam d Institute of Environment and Resources, Technical University of Denmark, Denmark e Research Centre for Environmental Technology and Sustainable Development (CETASD), Hanoi University of Science, VNU, Viet Nam article info Article history: Available online 4 July 2008 abstract Geological and hydrogeological processes controlling recharge and the mobilization of As were investigated in a shallow Holocene aquifer on the Red River flood plain near Hanoi, Vietnam. The geology was investigated using surface resistivity methods, geophysical borehole logging, drilling of boreholes and installation of more than 200 piezometers. Recharge processes and surface–groundwater interaction were studied using (i) time-ser- ies of hydraulic head distribution in surface water and aquifers, (ii) the stable isotope com- position of waters and (iii) numerical groundwater modeling. The Red River and two of its distributaries run through the field site and control the groundwater flow pattern. For most of the year, there is a regional groundwater flow towards the Red River. During the mon- soon the Red River water stage rises up to 6 m and stalls the regional groundwater flow. The two distributaries recharge the aquifer from perched water tables in the dry season, whilst in the flooding period surface water enters the aquifer through highly permeable bank sediments. The result is a dynamic groundwater flow pattern with rapid fluctuations in the groundwater table. A transient numerical model of the groundwater flow yields an average recharge rate of 60–100 mm/a through the confining clay, and a total recharge of approximately 200 mm/a was estimated from 3 H/ 3 He dating of the shallow groundwater. Thus in the model area, recharge of surface water from the river distributaries and recharge through a confining clay is of the same magnitude, being on average around 100 mm/a. The thickness of the confining clay varies between 2 and 10 m, and affects the recharge rate and the transport of electron acceptors (O 2 , NO 3 and SO 2 4 ) into the aquifer. Where the clay layer is thin, an up to 2 m thick oxic zone develops in the shallow aquifer. In the oxic zone the As concentration is less than 1 lg/L but increases in the reduced zone below to 550 lg/ L. In the Holocene aquifer, As is mobilized at a rate of around 14 lg/L/a. An As mass balance for the field site shows that around 1100 kg of As is annually leached from the Holocene sand and discharged into the Red River, corresponding to 0.01% of the total pool of As now present in the Holocene sand. Ó 2008 Elsevier Ltd. All rights reserved. 0883-2927/$ - see front matter Ó 2008 Elsevier Ltd. All rights reserved. doi:10.1016/j.apgeochem.2008.06.014 * Corresponding author. E-mail address: fl[email protected] (F. Larsen). Applied Geochemistry 23 (2008) 3099–3115 Contents lists available at ScienceDirect Applied Geochemistry journal homepage: www.elsevier.com/locate/apgeochem
-
Upload
independent -
Category
Documents
-
view
0 -
download
0
Transcript of Controlling geological and hydrogeological processes in an arsenic contaminated aquifer on the Red...
Applied Geochemistry 23 (2008) 3099–3115
Contents lists available at ScienceDirect
Applied Geochemistry
journal homepage: www.elsevier .com/locate /apgeochem
Controlling geological and hydrogeological processes in an arseniccontaminated aquifer on the Red River flood plain, Vietnam
Flemming Larsen a,*, Nhan Quy Pham b, Nhan Duc Dang c, Dieke Postma a, Søren Jessen d,Viet Hung Pham e, Thao Bach Nguyen b, Huy Duc Trieu b, Luu Thi Tran e, Hoan Nguyen b,Julie Chambon d, Hoan Van Nguyen b, Dang Hoang Ha b, Nguyen Thi Hue e, Mai Thanh Duc e,Jens Christian Refsgaard a
a Geological Survey of Denmark and Greenland (GEUS), Østervoldgade 10, DK-1350 Copenhagen K, Denmarkb Hanoi University of Mining and Geology, Viet Namc Institute for Nuclear Science and Technology, Viet Namd Institute of Environment and Resources, Technical University of Denmark, Denmarke Research Centre for Environmental Technology and Sustainable Development (CETASD), Hanoi University of Science, VNU, Viet Nam
a r t i c l e i n f o
Article history:Available online 4 July 2008
0883-2927/$ - see front matter � 2008 Elsevier Ltddoi:10.1016/j.apgeochem.2008.06.014
* Corresponding author.E-mail address: [email protected] (F. Larsen).
a b s t r a c t
Geological and hydrogeological processes controlling recharge and the mobilization of Aswere investigated in a shallow Holocene aquifer on the Red River flood plain near Hanoi,Vietnam. The geology was investigated using surface resistivity methods, geophysicalborehole logging, drilling of boreholes and installation of more than 200 piezometers.Recharge processes and surface–groundwater interaction were studied using (i) time-ser-ies of hydraulic head distribution in surface water and aquifers, (ii) the stable isotope com-position of waters and (iii) numerical groundwater modeling. The Red River and two of itsdistributaries run through the field site and control the groundwater flow pattern. For mostof the year, there is a regional groundwater flow towards the Red River. During the mon-soon the Red River water stage rises up to 6 m and stalls the regional groundwater flow.The two distributaries recharge the aquifer from perched water tables in the dry season,whilst in the flooding period surface water enters the aquifer through highly permeablebank sediments. The result is a dynamic groundwater flow pattern with rapid fluctuationsin the groundwater table. A transient numerical model of the groundwater flow yields anaverage recharge rate of 60–100 mm/a through the confining clay, and a total recharge ofapproximately 200 mm/a was estimated from 3H/3He dating of the shallow groundwater.Thus in the model area, recharge of surface water from the river distributaries and rechargethrough a confining clay is of the same magnitude, being on average around 100 mm/a. Thethickness of the confining clay varies between 2 and 10 m, and affects the recharge rate andthe transport of electron acceptors (O2, NO�3 and SO2�
4 ) into the aquifer. Where the claylayer is thin, an up to 2 m thick oxic zone develops in the shallow aquifer. In the oxic zonethe As concentration is less than 1 lg/L but increases in the reduced zone below to 550 lg/L. In the Holocene aquifer, As is mobilized at a rate of around 14 lg/L/a. An As mass balancefor the field site shows that around 1100 kg of As is annually leached from the Holocenesand and discharged into the Red River, corresponding to 0.01% of the total pool of Asnow present in the Holocene sand.
� 2008 Elsevier Ltd. All rights reserved.
. All rights reserved.

3100 F. Larsen et al. / Applied Geochemistry 23 (2008) 3099–3115
1. Introduction
Groundwater enrichment by geogenic As is a wide-spread problem in the flood plain aquifers of SoutheastAsia. Ultimately the source of As is the transport of As-con-taining sediments from the Himalayas down to the floodplains (Stanger, 2005; Charlet and Polya, 2006). On a regio-nal scale, the distribution of high-As waters in West Bengaland Bangladesh shows great variation due to differences insediment distribution, diagenesis and variations inabstraction depths (Smedley and Kinniburgh, 2002). On asmaller scale, the patchy distribution of As in groundwa-ters of Bangladesh is influenced by the complex hydrologyof paddy rice fields, irrigation channels and boreholes andwaste water ponds. These produce a mosaic of rechargeand discharge areas resulting in complex groundwaterflow paths and variable As distribution (Harvey et al.,2006). The more detailed coupling of As enrichment togroundwater hydraulics has only recently been addressed(e.g. Klump et al., 2006; Stute et al., 2007). Klump et al.(2006) made a rigorous analysis of how irrigation pumpingis affecting the flow system in the upper 30 m of the aqui-fer. Stute et al. (2007) studied the hydrological control on
Fig. 1. Location of the Dan Phuong field site, 30 km NW of Hanoi on the Redboreholes is indicated by dots except for those contained in the H- and the K-trgeological cross-section in Fig. 4 is shown as the line A–B, and the model doma
the groundwater As concentration in Bangladesh and re-ported an increase in the As concentration with increasinggroundwater age for the upper 20 m of the aquifer.Although the mechanism of As release from the sedimentsis still uncertain, the relationship between the As concen-tration and groundwater age suggests the kinetics of As re-lease from the sediments and the groundwater residencetime to be important factors (Stute et al., 2007).
High groundwater As concentrations have also been re-ported from aquifers of the Red River flood plain, Vietnam(Berg et al., 2001, 2008). The objective in this study is toclarify the hydrogeological and geochemical processes con-trolling the mobilization of As in a Red River Holoceneaquifer. The field site is near the village Dan Phuong,30 km NW of Hanoi. The geochemical results of the studyhave been published by Postma et al. (2007). The field site(Fig. 1) is located between the dyke and the Red River andis intersected by two minor distributaries to the Red River.Between the dyke and the river there is no groundwaterabstraction and therefore the natural interaction betweenthe surface waters and the shallow aquifer can be studied.The study addresses the hydrogeology and As mobilizationin a Holocene aquifer to a depth of 22 m below the surface.
River flood plain (UTM coordinates: 565695; 2338909). The location ofansects which each contain up to 100 piezometers. The orientation of thein for the numerical groundwater model is also indicated.

F. Larsen et al. / Applied Geochemistry 23 (2008) 3099–3115 3101
Here the results of the geological and hydrogeologicalinvestigations are reported with additional new geochem-ical and isotopic data. Based on simulated groundwaterflows from a numerical modeling of the field site and ob-served groundwater As concentrations, an As mass balancehas been established for the Holocene aquifer.
2. Study site
2.1. Red River basin
The Dan Phuong field site is located in the central partof the Red River basin, close to the main river (Fig. 1), witha distance to the mountains surrounding the flood plain ofapproximately 10 km. The land use is dominated by non-irrigated crops, such as corn and sweet potato, which areharvested in June and December. The area is flat but withdrainage of surface run-off and a near-surface interflowinto channels running through the field site. The presentposition of the Red River on the flood plain is controlledby the dykes alongside the river (Fig. 1): these dykes wereconstructed approximately 1 ka ago.
The climate in the study area is dominated by theSoutheast Asian monsoon system with a rainy season fromMay/June to October/November. The average discharge inthe Red River is about 3700 m3/s with recorded variationsbetween 370 and 38,000 m3/s (Ngo, 2006). The water stagein the Red River has been measured over the last 40 a atthe meteorological station at Sontay, located 16 km up-stream of the field site. During most years, the river stageat Sontay station varies between 6 and 12 m above sea le-vel (Fig. 2). Ngo (2006) defines the pre-flooding season asthe period with a fast increase in the river stage in May–June, the flooding takes place during July and August, andthe post-flood season is from late August to October witha falling river stage. Upstream of the field site, there aretwo reservoirs, which have an impact on the river stage.The release of water from these reservoirs may causeabrupt increases in the river stage during periods with a
Fig. 2. Mean monthly water stages in the Red River from year 1990 to2001, measured at Sontay, 16 km upstream of the field site. Error barsindicate ±1 standard deviation.
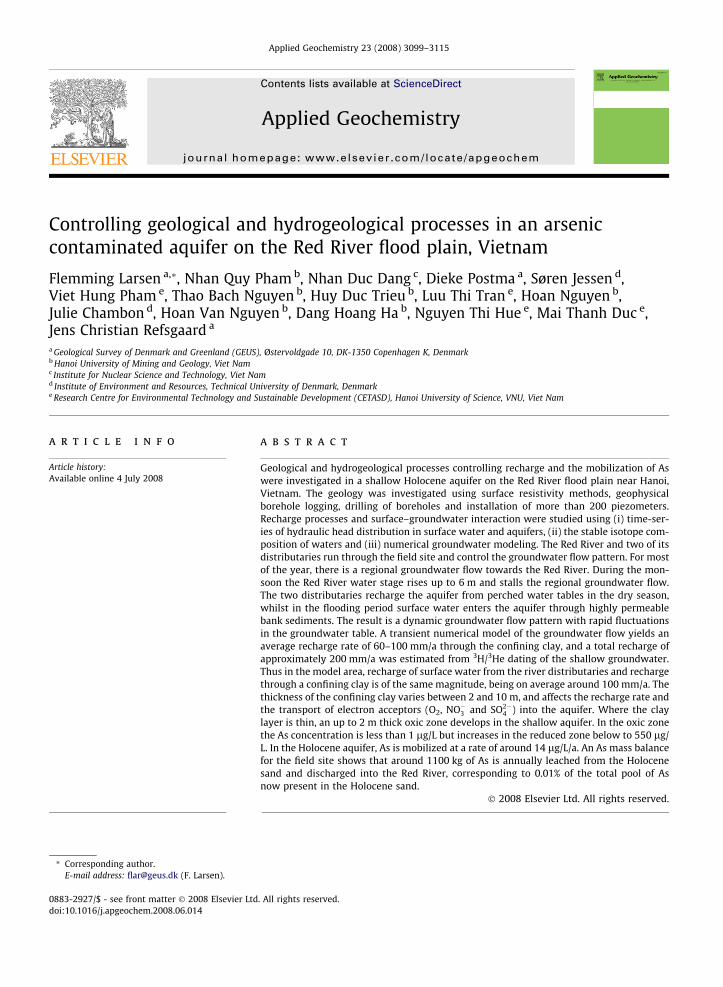
low water level. The precipitation record at Sontay station,from 1993 to 2003, is depicted in Fig. 3a. The mean annualprecipitation in this period was 1640 mm with 70% of therain falling from May to October. During the monsoonthe monthly rainfall exceeds 300 mm, the daily rainfall istypically between 10 and 50 mm/day but extreme eventswith up to 100–200 mm/day are recorded every year. Thepotential annual evaporation in northern Vietnam is typi-cally 700–800 mm, and some years up to 1000mm.
In this hydraulic regime, a hydraulic year can be consid-ered as the period from the beginning of the pre-floodingin one calendar year (May/June) to the end of the dry sea-son the following calendar year.
The Red River flood plain sediments consist of a Pleisto-cene and Holocene sequence of gravel, sand and claydeposits, with a thickness ranging from a few meters inthe NW to 100–200 m at the coast, and are overlying Neo-gene deposits (Mathers and Zalasiewicz, 1999; Nielsenet al., 1999; Lam and Boyd, 2003; Tanabe et al., 2003a,b,2006). During the Quaternary period, alluvial and fluvialsediments have been transported by braided rivers fromthe NW towards the SE, to the Gulf of Tonkin. The bound-ary between the fluvial dominated and shallow marinedepositional environments has shifted during the Pleisto-cene and Holocene in response to eustatic sea levelchanges (Tanabe et al., 2003a). However, during the Qua-ternary the sea has never transgressed the flood plain asfar inland as the present location of Hanoi (Tanabe et al.,2003a). Because the Dan Phuong field site is located NWof Hanoi, the aquifer sediments have been deposited byfluvial systems during the Pleistocene and Holocene. Ini-tially the depositional environment must have beenbraided rivers, later followed by meandering river systems.
2.2. Dan Phuong field site
The thickness of the Pleistocene and Holocene depositsincreases from the marginal mountains towards the cen-tral part of the flood plain, reaching a thickness of 60–70 m at Dan Phuong. The thickness of the Holocene aquiferincreases from a few meters near the mountains to 30–35 m at the field site. The flat area between the mountainsand the Red River is intersected by a dense network ofchannels, which are in hydraulic contact with the shallowHolocene aquifer.
At the Dan Phuong field site, the Red River forms a largemeandering bend (Fig. 1) and the shallow sediments arecharacterized by sandy point bar systems and channeldeposits of sand and gravel, overlain by clay-rich depositswith a thickness of up to 10 m. The confining clay-richlayer has been laid down as overbank deposits. The areabetween the Red River and the main dyke is intersectedby two, approximately 30 m wide distributaries of themain river and these are, in the following text, referredto as the southern and northern channel (Fig. 1). The eleva-tion of the bottom of these channels is approximately +6 mabove sea level. During the rainy season, water flowsthrough the two channels from the west towards the east,and the channels and the river are hydraulically connected.During the dry season, the two distributaries become iso-lated from the main river but they continue to interact
a
b
c
Fig. 3. (a) Mean monthly precipitation at Sontay station from 1990 to 2003. Error bars indicate ±1 standard deviation. (b) Measured d18O values in Hanoiprecipitation sampled from 2002 to 2007. (c) The relationship between 18O and 2H concentrations in precipitation through the years from 2002 to 2007.
3102 F. Larsen et al. / Applied Geochemistry 23 (2008) 3099–3115
with the shallow Holocene aquifer, controlled by the localhead differences and hydraulic properties of the streambedsediments. At low river stages, the channel waters draininto the main river through constructed outlets towardsthe east.
The geology at Dan Phuong is depicted in a cross-sec-tion in Fig. 4. Holocene deposits are found from elevation+10 m and down to elevation from �25 m. Preliminaryoptical luminescence (OSL) dating of the Holocene aquifersand, sampled 10 m below the surface, suggests a burialage of 460 ± 30 a. The island between the Red River andthe northern channel is dominated by sandy deposits,overlain by a confining clay layer towards the east. In thearea between the two channels, the thickness of the clayey
overbank deposit is up to 8 m. Inspection of the confininglayer in the channel bank deposits shows intensive fractur-ing of the upper, weathered layers. Underlying the confin-ing layer are fine to medium grained fluvial sand deposits,with up to 1 m thick interbedded, discontinuous layers ofclayey silt and fine sand. The sand contains disseminatedfragments of organic material and the clay-rich layers havelarger plant fragments and roots. In the southwesterly partof the field site (Fig. 4) there is an up to 4 m thick deposit ofclay that forms an aquitard between the Holocene andPleistocene sandy aquifers. This clay layer is not found inthe northeasterly end of the field site, where the transitionbetween the Pleistocene and the Holocene aquifer depositsis identified by a change in grain size of the fluvial

Fig. 4. A geological cross-section through the Dan Phuong field site. For location of boreholes and the cross section, see Fig. 1.
F. Larsen et al. / Applied Geochemistry 23 (2008) 3099–3115 3103
sediments. In general, the coarser deposits are found in thePleistocene fluvial system, and the lowermost 10–20 m ofdeposits are cobbles and boulders, probably laid down asalluvial fan sediments. The underlying Neogene depositsare located 50–60 m below the surface.
The depth of the Red River at the field site was measuredby a lead from a boat. The river was found to be 13 m deepnear the southern bank decreasing to only 2 m towards thenorthern bank (Fig. 4). This depth range indicates that theRed River channel near Dan Phuong has been eroded inthe Holocene deposits. Hydraulic contact between the riverand the Pleistocene aquifer may therefore only be con-ducted through the Holocene deposits.
3. Methods
3.1. Sampling of precipitation and surface water
Since 2002, precipitation has been collected at the roofof the Institute for Nuclear Science and Technology in Ha-noi. Sampling is done in a standard device following rec-ommendations given by IAEA (2002). Mixed monthlysamples were pipetted into 100 mL vials for analysis ofthe stabile isotopic composition (dD and d18O) of the water.
Red River water samples have also been collectedmonthly since 2002 in the same location in Hanoi. AtDan Phuong, water samples from the Red River and thetwo channels have been collected since May 2005. Thesamples were collected at 1 m depth using a 500 mL glassbottle and were analyzed for dD and d18O.
3.2. Instrumentation of field site
A total of 40 observation piezometers were installed inthe Holocene sand to describe the overall groundwaterflow. Two transects consisting of 100 piezometers (H-tran-sect) and 56 piezometers (K-transect) were established.
Two of the K-piezometers (K11 and K50) have screens inthe upper layers of the Pleistocene aquifer. These transectshave been used for hydraulic head measurements andgroundwater sampling. The K-transect is oriented perpen-dicular to the southern channel, in a part of the aquiferwith a relatively good hydraulic contact between the sur-face water and the shallow groundwater. The H-transectis oriented almost perpendicular to the northern channel,in an area with a poor direct hydraulic contact betweenthe surface water and the shallow groundwater. The loca-tion of the two transects is shown in Figs. 1 and 4. The twotransects are aligned almost parallel with the regionalnortheasterly groundwater flow direction towards theRed River.
The piezometers were installed using jet drilling, downto 22 m, and equipped with Ø 64 mm PVC-casings, 0.3 mscreens and 1 m sand traps. The positions of the screensare indicated by the crosses in Fig. 6. The water used forjet drilling was pumped from nearby boreholes or fromthe channels. A quartz sand filter pack was installed, andthe well was sealed using bentonite. The top of the PVCcasings at the well heads was sealed to prevent the en-trance of surface water during flooding. Immediately uponcompletion, the well was pumped to remove the water af-fected by the drilling operation. Then the well was left atrest for at least 3 months before sampling.
For hydraulic characterization and water sampling, four1200 diameter boreholes were drilled with a bailer andequipped with 160 mm PVC pipes and 6 m long screens.The boreholes were drilled at the locations T1 and T2(Fig. 1); two at each location with screens in either theHolocene or the Pleistocene aquifer.
3.3. Sediment and water sampling
Sediment sampling for optically stimulated lumines-cence (OSL) dating of the burial age (Murray and Oley,

3104 F. Larsen et al. / Applied Geochemistry 23 (2008) 3099–3115
1999) was done by coring of sediments 15 m below thesurface in a borehole drilled close to the H10 piezometerin the H-transect. A steel coring device (0.5 m � Ø64 mm) was used for this sampling. The cores were sealedand stored in Al-laminate bags to prevent exposure to sun-light after sampling and in this state brought to Denmark.For hydraulic characterization of the sand in the unsatu-rated zone, an intact core from the base of the confiningclay to the water table was collected adjacent to the H1
piezometer, in the H-transect, at the end of the dry season.Field procedures for inorganic geochemistry sampling
are summarized in Postma et al. (2007). Water for stableisotope analysis was sampled in 1 L glass bottles. Ground-water samples from the Holocene aquifer were collectedfrom the two transects and from the Pleistocene from theboreholes T1 and T2 and from the K11 and K50 piezometers.
Samples for 3H/3He dating of the groundwater were ta-ken from screens placed at different depths in the distancerange from 64 to 75 m in the H-transect (Fig. 6). Water wassampled in 50 cm long sections of 3/800 (0.95 cm) diameterCu tube sealed at either end with pinch-off clamps (Stuteand Schlosser, 2000). Dissolved gas samples for noble gasanalysis were collected in passive diffusion samples (San-ford et al., 1996) which were placed in the borehole for24 h. The dissolved gas pressures in the borehole waterwere measured. Sampling of the H-transect was done inNovember 2005 and the K-transect was sampled inNovember 2006. Samples from the Pleistocene aquiferwere taken from the T1 and T2 boreholes in November2006 and 2007.
3.4. Estimation of hydraulic parameters
The transmissivity and storativity of the Holocene andPleistocene aquifers were determined from pump testingof the T boreholes, using the Theis method for unsteady-state flow in confined aquifers. Horizontal hydraulic con-ductivities of the Holocene sand were estimated from slugtests performed in piezometers (Hvorslev, 1951) and fromsieving analysis. Residual water content and sedimentporosity were estimated on the intact core material fromthe unsaturated zone. Assuming that the unsaturated zonesands are fully drained by the end of the dry season, thespecific yield of the unsaturated sand was determined asthe difference between the estimated porosity and theresidual water content of the sand. Hydraulic conductivi-ties of the bottom sediments were estimated from seepagemeter measurements in the northern channel. The seepageflux is measured by enclosing an area of the bottom with acylinder (top of a barrel) vented to a plastic bag. The flux ofwater in or out of the bottom sediments is then measuredas differences from a known water volume in the plasticbag in a given time (Lee, 1977).
In this paper, percolation is referring to the water flow-ing downwards from the root zone. The percolation caneither reach the shallow aquifer as recharge or support anear surface lateral groundwater flow (interflow). At thefield site, shallow drainage ditches have been establishedevery 50–100 m to enable an efficient drainage of the ara-ble land in the rainy season. Rainwater run-off to theditches also occurs in periods of high-intensity rainfall.
3.5. Water level measurements
Water levels in boreholes and in the two channels havebeen measured manually bi-monthly since May 2005.Water level and atmospheric pressure variations have alsobeen measured in boreholes and piezometers with the useof pressure transducers (Van Essen Instruments, Delft, TheNetherlands). Recorded water pressures have been cor-rected for atmospheric pressure variations.
3.6. Laboratory water analysis procedures
Laboratory procedures used for inorganic analysis aresummarized in Postma et al. (2007). The Noble Gas Labora-tory at the University of Utah, Department of Geology andGeophysics analyzed the samples for 3H and dissolvedgases. For further details, see e.g. Manning et al. (2005).Corrections were made for degassing effects, and ages ofthe water were interpreted by the laboratory. The lumines-cence dating of the sediment was done at the Nordic Lab-oratory for Luminescence Dating, Risø NationalLaboratory, Denmark. The stable isotopic composition ofthe water samples was analyzed at the Institute for Nucle-ar Science and Technology in Hanoi using a MicroMassSpectrometer (IsoPrime, GV Instruments, UK) equippedwith an Eurovector elemental analyzer (EuroEA 3000,Italy). Data processing was performed using the MasslynxProgram supplied by GV Instruments Com., UK. The isoto-pic composition of 2H and 18O is determined as
dD or d18O ¼ ½Rsample � Rstd�=Rstd � 1000;‰
The results are given in ‰ d-notation with reference to theVSMOW standard (Coplen, 1996) and have a precision bet-ter than 0.15‰ for d 18O and 1.5‰ for dD.
3.7. Hydrogeological modeling
A transient numerical groundwater flow model was setup for the field site using the code MODFLOW (McDonaldand Harbaurgh, 2005). Analytical solutions of surface andgroundwater interactions were solved using the softwareSTW1 (Barlow and Moench, 1998).
4. Results
4.1. Local geology and hydrogeology
The spatial distribution of the thickness of the confiningclay-rich layer between the two channels has been com-piled from geophysical and drilling data (Fig. 5). The claylayer reaches a thickness of about 6 m in a central area be-tween the two channels. It thins out towards the southernchannel near the K-transect (Fig 5). In the banks of thesouthern channel, the thickness of the clay layer is onlyapproximately 0.5 m. When the river is low, the Holoceneaquifer sand outcrops in the bank of the channel, whereasduring high water a direct hydraulic contact is establishedbetween the surface water and shallow groundwater.
In the southern part of the H-transect, the thickness ofthe confining mud layer is only 2–3 m (Fig. 5) and hand

Fig. 5. Thickness of the clay-rich covering layer based on data fromsurface geophysical measurements, borehole geophysical logging anddrilling.
F. Larsen et al. / Applied Geochemistry 23 (2008) 3099–3115 3105
drilling revealed the clay layer to be oxidized throughout.In the northern end of the H-transect, adjacent to thenorthern channel, the geophysical and drilling resultsshowed a thickness of the confining clay layer of up to8 m. North of the northern channel, the island is domi-nated by sandy deposits (Fig. 4) which are in direct hydrau-lic contact with the Holocene aquifer through the highpermeable sands below the northern channel (Fig. 4).Therefore, when the hydraulic head is increasing in thechannel and the Red River, the pressure can be transmittedto the shallow aquifer between the channels from thenorth.
Observations during drilling showed that the clay-richsuperficial layer contains an upper oxidized zone and alower reduced zone. Near surface clay-rich deposits com-monly have an upper highly fractured oxidized zone over-lying a reduced zone with fewer fractures (e.g. Cherry,1989; Jørgensen and Fredericia, 1992; McKay et al., 1993;Jørgensen et al., 2002). At Dan Phuong, the thickness ofthe oxidized zone is typically 3–4 m. Oxidized zones arecharacterized by a high density of sub-vertical fractures,which often have a prominent staining from Fe-oxidesand Mn-oxides and a matrix with a yellowish brown colordue to the presence of Fe-oxides in the clay. Most of thefractures in the upper few meters are the result of desicca-tion during periods of low water table. The spacing be-tween the fractures in the reduced zone is larger and thefracture apertures are generally smaller (Jørgensen et al.,2002).
4.2. Hydraulic parameters
For use as input parameters in the numerical ground-water flow model, the hydraulic parameters of the Pleis-tocene and Holocene aquifer sand and the channelbottom sediments have been estimated. The results aresummarized in Table 1. The estimated transmissivity of
the Holocene sand from the pump testing varies from3.4 to 3.7 � 10�3 m2/s and the storativity varies from 1.0to 1.6 � 10�4. The average hydraulic conductivity of thesaturated Holocene sand (thickness 25 m) was calculatedto be 1.4 � 10�4 m/s. The spatial distribution of thehydraulic conductivity in the K-transect from slug testsvaries from 0.2 to 8 � 10�4 m/s (Fig. 6a), with an averagehydraulic conductivity of 3.6 � 10�4 m/s. In the H-tran-sect values vary between 0.3 and 16 � 10�4 m/s with anaverage value of 3.3 � 10�4 m/s (Fig. 6b). Weber et al.(1972) studied the spatial permeability distribution inHolocene fluvial channel-fill sediments, and their resultsare similar to those of the present study. Fluvial aquifersare typically built of fining-upwards cycles of sand, siltand clay up to 5–10 m thick (Gani and Alam, 2004), andthe observed hydraulic heterogeneity in the studied aqui-fers will therefore be seen at this scale. The most perme-able layers probably represent more coarse graineddeposits laid down in point bars, while zones with a low-er hydraulic conductivity likely to be more fine grainedsand and silt representing channel fill deposits. The dis-tance between highly permeable zones in the Dan Phuongresembles spatial variations reported by Gani and Alam(2004). The porosity of the well sorted sand from theHolocene is remarkable high with values ranging between32% and 49% (average 39%). Tanabe et al. (2006) also ob-served a high porosity, up to 50%, in Holocene sandy sed-iments from the Red River delta flood plain.
The estimated transmissivity of the Pleistocene sand isfrom 2.2 to 4.4 � 10�3 m2/s and the storativity is between1.5 and 6.0 � 10�4. Hydraulic conductances of the bottomsediments in the channels, ranging from 0.04 to 1.10 m2/day (average 0.3 m2/day), were calculated from seepagemeter measurements, using a channel width of 30 m anda thickness of the bottom sediments of 4 m. The measuredwater retention in the unsaturated profile ranged from0.41 in the capillary fringe to an almost constant value of0.08 further upward. The thickness of the capillary fringein the fine to medium grained sand was 0.8 m. The esti-mated specific yield varied from 0.04 in the capillary fringeto 0.31 in the upper part of the unsaturated sand (averagevalues of 0.2).
4.3. Seasonal dynamics in the Holocene aquifer
The elevation of the water table in boreholes and chan-nels during the dry season is between +6.2 m in the SW to+5.2 m in the NE (Fig. 7a). In the dry season the groundwa-ter table is lower than the bottom of the channels and leak-age will occur into the aquifer through low permeability,bottom sediments. During this time of year a high hydrau-lic gradient builds up towards the Red River amounting toapproximately 1.3‰, and in this part of the aquifer thedirection is towards the NE (45–50� NE). Using the averagehydraulic conductivity for the Holocene sand of3.5 � 10�4 m/s, and an average porosity of 39%, the calcu-lated horizontal Darcian and particle velocities in the dryseason are 14 m/a and 37 m/a, respectively. Because thereis no upward flow to the channels in the dry season, thegroundwater flow between the two channels can, at a firstapproximation, be conceptualized using a simple flow

a b
dc
fe
Fig. 6. Results from the K-transect and the H-transect. Crosses indicate sampling points and contouring is based on a measurement at each sampling point(vertical anisotropy factor 3); (a,b) Hydraulic conductivities of the Holocene aquifer sand based on results from slug tests; (c,d) d18O of groundwater fromthe transects; (e,f) Groundwater As concentrations in the Holocene aquifer in the two transects.
Table 1Estimated hydraulic properties
Transmissivityrange (m2/s)
Storativityrange
Hydraulic conductivityrange/average (m/s)
Porosityrange/average (%)
Specific retentionrange/average
Specific yieldrange/average
Pleistocene sand 2.2–4.4 � 10�3 1.5–6.0 � 10�4 – – – –Holocene sand 3.4–3.7 � 10�3 1.0–1.6 � 10�4 0.2–1.6 � 10�4/3.5 � 10�4 32–49/39 0.08–0.41/0.19 0.04–0.31/0.20
3106 F. Larsen et al. / Applied Geochemistry 23 (2008) 3099–3115
model with uniformly increasing age of the water withincreasing depth (Vogel, 1967). Based on 3H/3He dating ofthe groundwater, an average vertical groundwater particlevelocity of 0.5 m/a was determined in the H-transect byPostma et al. (2007). Again, using an average porosity ofthe sand of 0.39, this vertical particle velocity corresponds
to a total, average recharge rate from both surface waterand percolation of 195 mm/a. This recharge rate representsthe hydrogeological conditions below the covering clay be-tween the two channels, and higher recharge probablytakes place in the sandy area north of the northernchannel.
a b c
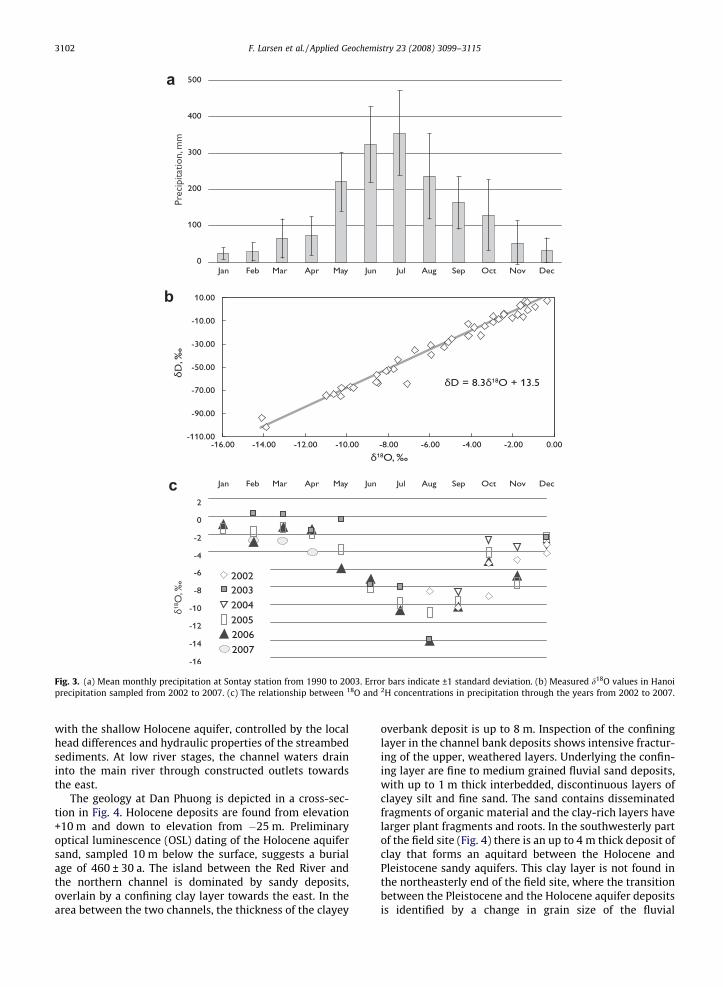
Fig. 7. (a,b) Groundwater table elevations in the rain season (a) and Monsoon (b). The location of observation borehole and the H- and K-transect areshown. (c) Observed hydraulic heads in southern channel and the borehole C9, located 170 m from the channel.
F. Larsen et al. / Applied Geochemistry 23 (2008) 3099–3115 3107
The groundwater head distribution during the monsoonis shown in Fig. 7b. The water table is now virtually flatwith elevations varying between +8.38 m and +8.28 m.The previous northeasterly flow has been stalled by theincreasing stage in the Red River.
Fig. 7c illustrates the interaction between the water inthe channels and the aquifer by comparing the hydraulicheads in the southern channel and borehole (C9) located170 m north of the southern channel (Fig. 1). During thepre-flooding period of June 2005, the water stage in thechannel increased rapidly and a steep gradient was estab-lished towards the aquifer. Therefore surface water flowsinto the aquifer where the bank sediments are permeable.From July to October the water stage in the channel variesstrongly and it is controlled by the release of water fromthe reservoirs upstream of the field site. The result is a suc-cession of gaining and losing phases at the interface withthe aquifer. During the post-flooding period, from Octoberto November, the water stage in the channel decreasesdrastically and groundwater flows towards the channelfor some months. The increase of the water stage in thechannel during January–February 2006 (Fig. 7c) is probablyagain due to the release of water from the upstream reser-voirs. The groundwater table continues to fall and fromlate February to the beginning of the next pre-flooding sea-son in 2006 and the river stage in the southern channel re-mains above the groundwater table. During high waterstands, the channel water infiltrates into the aquiferthrough high permeability sand layers outcropping in thebanks of the channels. This is different from periods witha low water stage in the dry period, when infiltration oc-curs through the low-permeability, clay-rich, bottom sedi-ments. Such head dependant leakage from rivers toaquifers has previously been described by Rushton andTomlinson (1979). The storage of water in the Holoceneaquifer was assessed by measuring the water table varia-tion in borehole H1 of the H-transect, where the aquiferis unconfined throughout the year. From June to the Au-
gust 2006, the water table increased from an elevation+5.80 m to +8.43 m (data not shown). Using an averagespecific yield of the Holocene sand of 0.2 (Table 1), this cor-responds to an uptake of water of 0.53 m3/m2 of theaquifer.
In the southern part of the field site, recharge of surfacewater from the southern channel into the shallow aquiferbuilt up higher hydraulic heads in the Holocene than inthe Pleistocene aquifer through most of the year. Thedownward flow of groundwater from the Holocene to thePleistocene aquifer mainly occurs north of the area wherethe aquitard is present. Further towards the north, wherethe aquitard is absent, upward hydraulic gradients fromthe Holocene to the Pleistocene are observed, and conse-quently this area is a discharge zone with groundwaterflowing upward from the Pleistocene deposits into theHolocene and further into the Red River.
4.4. Isotopic and chemical composition of precipitation inHanoi
The concentrations of 2H and 18O in meteoric waters,which have not undergone extensive evaporation, willshow a linear correlation (Craig, 1961). For precipitationin Hanoi this relationship is given by the equationd2H = 8.3 � d18O + 13.5 (Fig. 3b). The annual distributionof d18O in precipitation from Hanoi (Fig. 3c) shows anenrichment in the dry season from October to May withd18O values typically between 0‰ and �4‰., while duringthe rainy season, depletion of rain is seen and d18O variesbetween �8‰ and �14‰. These seasonal trends of d18Oin rainwater are similar to those previously described fromthe Asian South Pacific by Dansgaard (1964), Lawrence andWhite (1991), Rozanski et al. (1993) and Araguás-Araguáset al. (1998). The phenomenon is known as the amount ef-fect, and it is due to secondary evaporation, causing 18Oenrichment, during rainfall in the dry season (Friedmanet al., 1962; Dansgaard, 1964; Clark and Fritz, 1997).

3108 F. Larsen et al. / Applied Geochemistry 23 (2008) 3099–3115
During monsoon rainfalls the relative humidity of the air isclose to saturation and secondary evaporation does not oc-cur. Araguás-Araguás et al. (1998) showed that the amounteffect has an impact on the stable isotopic composition ofthe precipitation at a distance of up to 700 km from theSouthern Pacific coast. In the Red River flood plain, theamount effect provides a characteristic seasonal isotopicfingerprint on the precipitation.
4.5. Stable isotopic composition of surface and groundwater
The variations of d18O in the Red River water samplesduring 2006 are depicted in Fig. 8 and the values range be-tween �11‰ and �7‰. During the dry season, d18O valuesin the river water are between�9‰ and�7‰, but after themonsoon rain, the Red River water becomes more 18O de-pleted with d18O values in the range �11‰ and �9‰. Inthe northern channel the d18O values range between�6‰ and �0‰ in the dry season (Fig. 8), whereas in therainy season the channel and the Red River become con-nected and yield the same the d18O values. Enrichment of18O in the channel water during spring is the combined ef-fect of evaporation of water in the channels and 18O en-riched spring precipitation (Fig. 3c).
The spatial distribution of d18O in the K-transect onNovember 2006 is displayed in Fig. 6c. Note that the south-ern end of the K-transect is adjacent to the bank of thesouthern channel (Fig. 1). The d18O varies between �9‰
and �4‰, with maximum values between �5‰ and�4‰ clustered in a zone approximately 10 m from thesouthern channel. Values between �7.5‰ and �6.5‰ arefound where the clay layer is thin at distances up to40 m from the southern channel. When the clay layer be-comes thicker the d18O values only vary between �9‰
and �7.5‰. The d18O composition of the water in the H-transect is displayed in Fig. 6d. The d18O values in the H-transect are confined to a narrow range between �10‰
and �8‰. There is no clear pattern in the spatial distribu-tion of d18O as was seen in the K-transect. The differencesin d18O distribution between the K and H transects areinterpreted as follows: The zone in the K-transect withd18O values of �5 to �4‰ reflects surface water that hasrecharged to the aquifer during July–August, 2006. In the
Fig. 8. d18O of channel and Red River waters in samples from the DanPhuong field site during 2006.
3–4 months that passed until sampling in November2006, the surface water has moved approximately 10 mhorizontally into the shallow aquifer. The intermediate val-ues between �7.5‰ and �6.5‰, below the thin clay cover,are most likely due to an input of surface water infiltratedthrough the clay cover during the flooding. The isotopiccomposition of the water below the thicker clay resemblesthe values in the H-transect, and this water was most likelyrecharged by percolation through the covering clay layer.The limited variation in the d18O values in the H-transectindicates that in this part of the aquifer, the surface wateris not flowing from the channel into the aquifer duringhigh river stages. This conclusion is consistent with thepresence of a thick clayey deposit just south of the north-ern channel (Fig. 5), and the chemical composition of thewater in the northern part of this transect (Postma et al.,2007). The groundwater d18O composition in the H-tran-sect resembles that of precipitation in Hanoi during therainy season (Fig. 3c). Apparently recharge to the Holoceneaquifer near the H-transect predominantly proceeds bypercolation through the covering clay layer during heavyrainfall in the monsoon period.
Groundwater concentrations of Cl� and d18O composi-tions of water from the two transects are shown in Fig. 9.The increase in Cl� concentration from precipitation to re-charge water in the H-transect is not reflected in increasingd18O values, indicating that evapotranspiration is the mainmechanism for water loss, since this is a non-fractionatingprocess (Zimmerman et al., 1967; Förstel, 1982). Water isalso taken up by the fast growing bio-mass (mainly corn)and this is also a non-fractionating process with probablylittle uptake of Cl� from the water. In contrast, the south-ern part of the K-transect shows high d18O values associ-ated with a high concentration of Cl� (Fig. 9). In this case,the d18O and the Cl� content of the water appear to be con-trolled by evaporation from a free water surface in thechannel or from the top soils. The recharge of surface waterto the aquifer can be delineated as the zone with low d18Oenrichment (Fig. 6c).
The stable isotope composition of the water in the Pleis-tocene aquifer is more depleted than the groundwater
Fig. 9. Chloride and d18O in groundwater from the K-transect andH-transects.
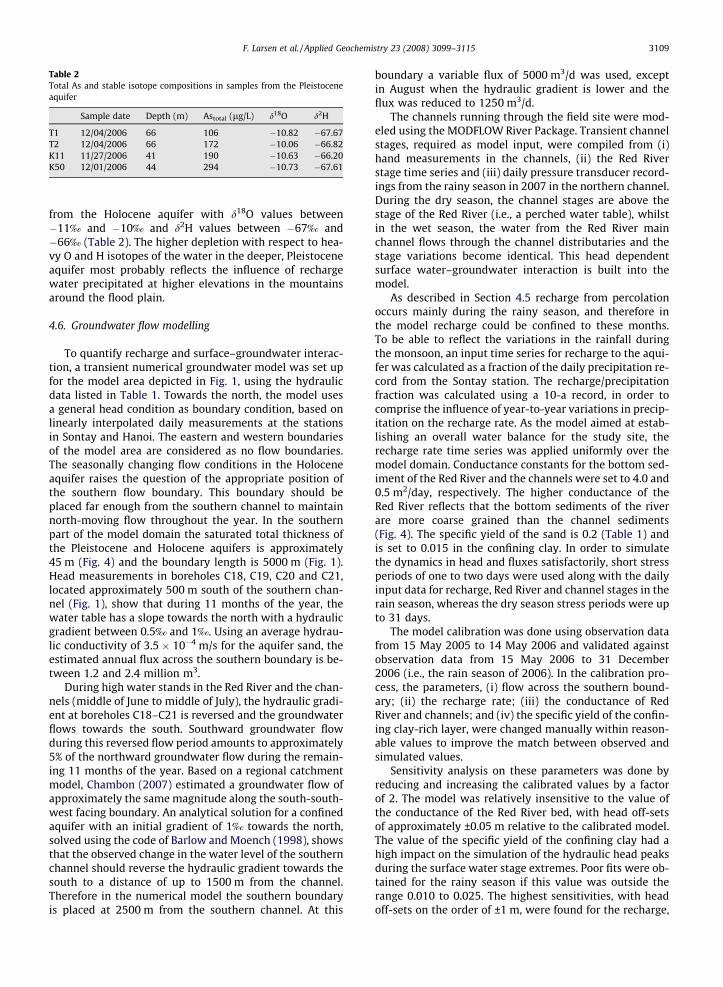
Table 2Total As and stable isotope compositions in samples from the Pleistoceneaquifer
Sample date Depth (m) Astotal (lg/L) d18O d2H
T1 12/04/2006 66 106 �10.82 �67.67T2 12/04/2006 66 172 �10.06 �66.82K11 11/27/2006 41 190 �10.63 �66.20K50 12/01/2006 44 294 �10.73 �67.61
F. Larsen et al. / Applied Geochemistry 23 (2008) 3099–3115 3109
from the Holocene aquifer with d18O values between�11‰ and �10‰ and d2H values between �67‰ and�66‰ (Table 2). The higher depletion with respect to hea-vy O and H isotopes of the water in the deeper, Pleistoceneaquifer most probably reflects the influence of rechargewater precipitated at higher elevations in the mountainsaround the flood plain.
4.6. Groundwater flow modelling
To quantify recharge and surface–groundwater interac-tion, a transient numerical groundwater model was set upfor the model area depicted in Fig. 1, using the hydraulicdata listed in Table 1. Towards the north, the model usesa general head condition as boundary condition, based onlinearly interpolated daily measurements at the stationsin Sontay and Hanoi. The eastern and western boundariesof the model area are considered as no flow boundaries.The seasonally changing flow conditions in the Holoceneaquifer raises the question of the appropriate position ofthe southern flow boundary. This boundary should beplaced far enough from the southern channel to maintainnorth-moving flow throughout the year. In the southernpart of the model domain the saturated total thickness ofthe Pleistocene and Holocene aquifers is approximately45 m (Fig. 4) and the boundary length is 5000 m (Fig. 1).Head measurements in boreholes C18, C19, C20 and C21,located approximately 500 m south of the southern chan-nel (Fig. 1), show that during 11 months of the year, thewater table has a slope towards the north with a hydraulicgradient between 0.5‰ and 1‰. Using an average hydrau-lic conductivity of 3.5 � 10�4 m/s for the aquifer sand, theestimated annual flux across the southern boundary is be-tween 1.2 and 2.4 million m3.
During high water stands in the Red River and the chan-nels (middle of June to middle of July), the hydraulic gradi-ent at boreholes C18–C21 is reversed and the groundwaterflows towards the south. Southward groundwater flowduring this reversed flow period amounts to approximately5% of the northward groundwater flow during the remain-ing 11 months of the year. Based on a regional catchmentmodel, Chambon (2007) estimated a groundwater flow ofapproximately the same magnitude along the south-south-west facing boundary. An analytical solution for a confinedaquifer with an initial gradient of 1‰ towards the north,solved using the code of Barlow and Moench (1998), showsthat the observed change in the water level of the southernchannel should reverse the hydraulic gradient towards thesouth to a distance of up to 1500 m from the channel.Therefore in the numerical model the southern boundaryis placed at 2500 m from the southern channel. At this
boundary a variable flux of 5000 m3/d was used, exceptin August when the hydraulic gradient is lower and theflux was reduced to 1250 m3/d.
The channels running through the field site were mod-eled using the MODFLOW River Package. Transient channelstages, required as model input, were compiled from (i)hand measurements in the channels, (ii) the Red Riverstage time series and (iii) daily pressure transducer record-ings from the rainy season in 2007 in the northern channel.During the dry season, the channel stages are above thestage of the Red River (i.e., a perched water table), whilstin the wet season, the water from the Red River mainchannel flows through the channel distributaries and thestage variations become identical. This head dependentsurface water–groundwater interaction is built into themodel.
As described in Section 4.5 recharge from percolationoccurs mainly during the rainy season, and therefore inthe model recharge could be confined to these months.To be able to reflect the variations in the rainfall duringthe monsoon, an input time series for recharge to the aqui-fer was calculated as a fraction of the daily precipitation re-cord from the Sontay station. The recharge/precipitationfraction was calculated using a 10-a record, in order tocomprise the influence of year-to-year variations in precip-itation on the recharge rate. As the model aimed at estab-lishing an overall water balance for the study site, therecharge rate time series was applied uniformly over themodel domain. Conductance constants for the bottom sed-iment of the Red River and the channels were set to 4.0 and0.5 m2/day, respectively. The higher conductance of theRed River reflects that the bottom sediments of the riverare more coarse grained than the channel sediments(Fig. 4). The specific yield of the sand is 0.2 (Table 1) andis set to 0.015 in the confining clay. In order to simulatethe dynamics in head and fluxes satisfactorily, short stressperiods of one to two days were used along with the dailyinput data for recharge, Red River and channel stages in therain season, whereas the dry season stress periods were upto 31 days.
The model calibration was done using observation datafrom 15 May 2005 to 14 May 2006 and validated againstobservation data from 15 May 2006 to 31 December2006 (i.e., the rain season of 2006). In the calibration pro-cess, the parameters, (i) flow across the southern bound-ary; (ii) the recharge rate; (iii) the conductance of RedRiver and channels; and (iv) the specific yield of the confin-ing clay-rich layer, were changed manually within reason-able values to improve the match between observed andsimulated values.
Sensitivity analysis on these parameters was done byreducing and increasing the calibrated values by a factorof 2. The model was relatively insensitive to the value ofthe conductance of the Red River bed, with head off-setsof approximately ±0.05 m relative to the calibrated model.The value of the specific yield of the confining clay had ahigh impact on the simulation of the hydraulic head peaksduring the surface water stage extremes. Poor fits were ob-tained for the rainy season if this value was outside therange 0.010 to 0.025. The highest sensitivities, with headoff-sets on the order of ±1 m, were found for the recharge,
3110 F. Larsen et al. / Applied Geochemistry 23 (2008) 3099–3115
and the channel bed conductance, and not surprisingly theflow across the southern boundary. The latter modeluncertainty was reduced by carefully sampling the headobservations along this boundary and the uncertainty hastherefore been confined to the estimated hydraulic con-ductivity of the sand, which seems well documented. Theestimated conductance of the channel appears high andcould very well be wrong by a factor of 5–10. Mean error(ME) values between simulated and observed hydraulicheads, using a uniform recharge rate of 60 mm/a, is0.57 m in the calibrated model and 0.60 m in the validatedmodel. Increasing the recharge rate gave larger errors andwith a recharge rate of 100 mm/a, the ME values of the cal-ibrated and validated model increased to 0.77 m and0.80 m, respectively. The mean absolute errors (MAE) inthe validated model with a recharge of 60 and 100 mm/awere 0.78 and 0.93 m, respectively. Given the abovementioned uncertainties in the flux across the southern
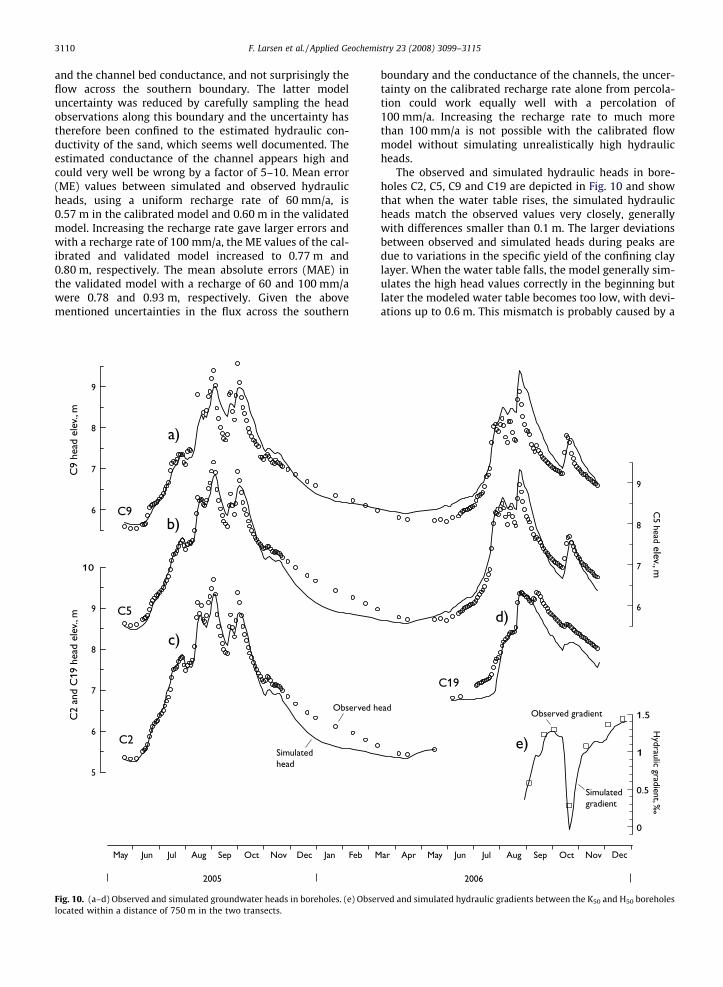
Fig. 10. (a–d) Observed and simulated groundwater heads in boreholes. (e) Obselocated within a distance of 750 m in the two transects.
boundary and the conductance of the channels, the uncer-tainty on the calibrated recharge rate alone from percola-tion could work equally well with a percolation of100 mm/a. Increasing the recharge rate to much morethan 100 mm/a is not possible with the calibrated flowmodel without simulating unrealistically high hydraulicheads.
The observed and simulated hydraulic heads in bore-holes C2, C5, C9 and C19 are depicted in Fig. 10 and showthat when the water table rises, the simulated hydraulicheads match the observed values very closely, generallywith differences smaller than 0.1 m. The larger deviationsbetween observed and simulated heads during peaks aredue to variations in the specific yield of the confining claylayer. When the water table falls, the model generally sim-ulates the high head values correctly in the beginning butlater the modeled water table becomes too low, with devi-ations up to 0.6 m. This mismatch is probably caused by a
rved and simulated hydraulic gradients between the K50 and H50 boreholes

F. Larsen et al. / Applied Geochemistry 23 (2008) 3099–3115 3111
delayed yield from the fine grained sand during fallingwater conditions. Simulated and observed hydraulic gradi-ents between boreholes K50 and H50, located 750 m apart,are also shown in Fig. 10. The simulated hydraulic gradientshows differences between the observed and measuredhydraulic gradient of less than 0.2‰, and therefore theoverall dynamics of the system appear to be well describedby the model.
A water budget for the model area, based on groundwa-ter flow calculated with the validated model, is depicted inFig. 11. The simulated groundwater flow from May 2005 toMay 2006 across the southern boundary is 1.6 million m3.This is distributed between the Holocene and Pleistoceneaquifers with 0.9 and 0.7 million m3, respectively. Thesouthern and northern channels together recharge 1.6 mil-lion m3 into the aquifer, mainly during the rain season. Inthe months after the rain season 0.6 million m3 of ground-water is discharged back into the two channels, with ahigher flux flowing into the northern channel due to thehigher hydraulic head in this part of the aquifer. Using auniform recharge rate of 60 mm/a, the total annual re-charge from percolation is 1.4 million m3, about the sameamount as the recharge from the channels (1.6 millionm3). Where the separating aquitard clay layer betweenthe aquifers is not present, 2.4 million m3 flows downwardinto the Pleistocene aquifer, mainly in the upper few meterof this aquifer. During the simulated year, 4.7 million m3
groundwater discharged into the Red River, and 1.2 millionm3 flows back as bank infiltration during the flooding per-iod. Water discharging from the Pleistocene into the RedRiver must flow up through the Holocene deposits, belowthe Red River. The storage change in the Holocene aquiferin the simulated year was 2.9 and +0.5 million m3. Particletracking simulation gives annually averaged hydraulic gra-dients between the two channels of 0.8‰ and horizontalparticle velocities of 25–28 m/a. As expected this is smallerthan the particle velocity of 37 m/a calculated from Darcy’slaw and the high hydraulic gradient measured in the dryseason (Section 4.3).
Fig. 11. Calculated groundwater flows in millions m3/a in the
4.7. As concentration in groundwater
The groundwater in the Holocene aquifer is a CaHCO3-MgHCO3 type of water, mostly anoxic and enriched inCH4 and Fe(II) (Postma et al., 2007). Fig. 6e and f showsthe distribution of groundwater As in the two transects.At the southern end of the H-transect, the covering clay-rich layer is thin and the upper 2 m of the saturated zonecontains dissolved O2 and NO�3 (Postma et al., 2007,Fig. 4). This oxic zone contains less groundwater As thanthe detection limit of 0.013 lM As (1 lg/L). Below the oxiczone the total As concentration gradually increases, reach-ing values as high as 7.4 lM (555 lg/L). In the anoxic zonethe degradation of organic material is the controlling pro-cess and As is released to the groundwater in associationwith the reduction of Fe-oxides. A more detailed discussionof the geochemical processes controlling the distribution ofAs in the aquifer is given in Postma et al. (2007). In the H-transect, the groundwater As concentration of 555 lg/Lbuilds up along a downward gradient of 20 m correspond-ing to a groundwater age of 40 a (Postma et al., 2007). Thisis equivalent to an As release rate from the sediments of14 lg/L/a. For comparison, Stute et al. (2007) reported anAs release rate of 19 lg/L/a (with a range from 7 to27 lg/L/a) in their study of a shallow aquifer system inBangladesh.
The distribution of As in the groundwater of the K-tran-sect (Fig. 6e) shows As to be present throughout the aquiferreaching a concentration of up to 6.6 lM (495 lg/L).Apparently the recharge water from the southern channelbecomes quickly reduced and As seems to become mobi-lized already at the interface between the surface andgroundwater, maybe in the bottom sediments of the chan-nel. Polizzotto et al. (2006) in their study from Cambodiaalso observed mobilization of As near surface channelsediments.
The Pleistocene aquifer at Dan Phuong has only beensampled from a few boreholes in the T1 and T2 (for loca-tion, see Fig. 1) which are equipped with 6 m long screens,
simulated hydraulic year from May 2005 to May 2006.

3112 F. Larsen et al. / Applied Geochemistry 23 (2008) 3099–3115
and from the piezometers K11 and K50 in the K-transect.Samples from November 2006 (Table 2) showed As con-centrations in the range from 1.4 to 3.9 lM (106–294 lg/L), and similar concentrations were found in samples fromNovember 2007 (data not shown).
5. Discussion
One of the puzzling questions which still remain to beanswered is why such large spatial variations in ground-water As concentration are observed both over large andsmall scales (e.g. Smedley and Kinniburgh, 2002; van Geenet al., 2003; Harvey et al., 2006). The results of this studyindicate that the spatial distribution of As in groundwaterof the Holocene aquifer is strongly affected by the hydrau-lic properties of the covering clay layer, through a controlof the recharge rate, and the chemical composition of thewater percolating through the confining clay layer.
5.1. The recharge mechanism of the Holocene aquifer
According to the numerical groundwater model, the an-nual recharge rates from percolation and from the twochannels are of the same order in the model area; 1.6and 1.4 million m3, respectively. Recharge rates show largevariations due to the spatial variability of the top soil com-position (clay or sand), the land use, topography etc. Basedon 3H/3He profiles, Stute et al. (2007) report from Bangla-desh a 10-fold range of recharge rates from 100 to1100 mm/a and these findings suggest that a clear distinc-tion must be made between areas with sandy and clay-richdeposits. The hydraulic properties of clay-rich near surfacedeposits were reviewed by Cherry (1989) and detailed fieldstudies have been reported by McKay et al. (1993). The re-sults from these studies reveal that the bulk hydraulic con-ductivity in oxidized zones of clay-rich deposits aretypically 1–3 orders of magnitude larger than in the re-duced zone, and therefore, surface near lateral groundwa-ter flow (interflow) is often generated in the transitionzone between the oxidized and reduced zones. At Dan Phu-ong interflow occurs during the monsoon rainfalls, and fol-lows the hydraulic gradients towards the shallow drainageditches, established for every 50–100 m in the arable land.A surface run-off of the monsoon rain also occurs and theseprocesses together strongly reduce the recharge to theshallow aquifer in the area with clay-rich top soils. In areaswith sandy top soils, the near surface water flow is verticaldownwards and relatively fast water flow will probablyalso reduce the evapotranspiration, and higher rechargerates are therefore to be expected.
From the 3H/3He profile in the shallow Holocene sand,published by Postma et al. (2007), a total recharge rate ofaround 195 mm/a below the confining clay can be esti-mated. In addition, the results from the numerical model-ing show that an average recharge rate from percolationmuch higher than 100 mm/a seems unlikely in areas cov-ered by confining clay units.
At Dan Phuong, the interaction between surface waterand the Holocene aquifer is highly dependent on the waterstage in the channels, as the hydraulic conductivity of the
clay-rich bottom sediments is much lower than that ofthe sandy sediments in the banks of the channels. To quoteWoessner (2000): ‘‘The exchange of surface water withshallow aquifers in fluvial plain sediments is controlledby: (i) the distribution and magnitude of the hydraulic con-ductivity both within the channel bed and in the associatedfluvial plain sediments; (ii) the relation of the channelstage to the adjacent groundwater gradients; and (iii) thegeometry and position of the stream/channel within thefluvial plain”.
5.2. Chemistry of the recharge water
Electron acceptors (O2, NO�3 and SO2�4 ) are transported
into the aquifer where the confining clay is less than 2–3 m thick. An approximately 2 m thick oxic zone, with alow As concentration, has developed in the underlying sat-urated Holocene sand. Over depth the As concentration in-creases and reaches a concentration of 7.4 lM As (555 lg/L) at 20 m depth. The transport of O2, NO�3 and SO2�
4
through the covering clay will be controlled by the thick-ness of the clay, the capacity of the clay to reduce O2 andNO�3 , the water residence time in the layer, and diffusioninto the clay matrix between fractures (Cherry, 1989;Jørgensen et al., 2002). When the thickness of the confiningclay layer exceeds about 3 m, its base remains saturatedand reduced most of the year, and electron acceptors arenot transported into the aquifer. Here Fe-oxide reductiontakes place from the water table and also the As concentra-tion starts to increase (Fig. 6e and f). The average As mobi-lization rate is around 14 lg/L/a (Section 4.7) and the ratecontrolling chemical process is apparently the rate of sed-imentary organic matter degradation (Postma et al., 2007).The groundwater As concentration is then the product ofthe water particle velocity and the As release rate fromthe sediments. Therefore local hydrogeological conditionswill have a strong effect on the As concentration build upin the shallow aquifers.
The biogeochemical processes occurring in the hypor-heic zone, the upper few centimeters of sediment belowa surface water body, may have a profound effect on chem-istry of interacting water (e.g Brunke and Gonser, 1997;Dahm et al., 1998; Sophocleous, 2002). The compositionof the groundwater in the K-transect (Fig. 6e) representsthe situation 4 months after recharge from the southernchannel. Yet the water contains no dissolved O2, NO�3 orSO2�
4 and these components must have been reduced inthe channel bottom or aquifer sediments. Massmannet al. (2004) described a case where river water infiltratesinto a glacial fluvial aquifer and where dissolved O2 andNO�3 already became reduced only a few meters into thestream bank. Whether in the present case As is mobilizedin the bottom sediments of the channels is at present notknown.
5.3. A mass balance for As in the groundwater
The Dan Phuong field site is located between the RedRiver and the dyke, and the sediments are therefore young,probably less than 500 a. Postma et al. (2007) suggested

F. Larsen et al. / Applied Geochemistry 23 (2008) 3099–3115 3113
that the situation in Dan Phuong could be viewed as a kindof initial state of the older sediments (up to 10 ka BP) inBangladesh and W. Bengal (Goodbred and Kuehl, 2000).In this perspective it is useful to construct a mass balancefor As for the Dan Phuong field site. The flux of groundwa-ter As into the area can be calculated from the calculatedflow into the model domain multiplied by observed aver-age groundwater As concentrations. The estimated fluxesin the As mass balance are shown in Fig. 12. The averageAs concentrations of groundwater flowing into the Holo-cene and Pleistocene aquifers from the southern boundaryhave been set at 4 lM (300 lg/L) and 2 lM (150 lg/L),respectively, and with the regional groundwater flow375 kg/a As enters the model area. The water rechargingthe Holocene aquifer from the channels will gain As eitherby mobilization within the aquifer or in the bottom sedi-ments of the channel (Polizzotto et al., 2006) but there isno net flux of As entering the system this way. The ground-water flowing into the upper layers of the Pleistocene aqui-fer contains 720 kg As, assuming groundwater Asconcentrations of 4 lM, as seen in the bottom of the Holo-cene aquifer (Fig. 6e and f). Lower groundwater As concen-trations in the Pleistocene suggests that at least some ofthis As is sorbed to the sediments in the Pleistocene aqui-fer. The mass of As leached into the Red River with thegroundwater is around 945 kg/a, with 480 kg/a comingfrom the Holocene aquifer and 465 kg/a from the Pleisto-cene aquifer. In addition, 180 kg/a is transported with thegroundwater into the channels after the monsoon period.The total amount of As leached from the Holocene aquiferis 1100 kg/a. The average As concentration in the sedimentis 7.5 lg/g (Postma et al., 2007) and the total mass of As inthe 24 km2 model area is therefore 13.3 million kg As. Theamount of As leached annually therefore corresponds to0.01% of the total As mass in the Holocene sand.
There are considerable uncertainties in the constructedAs mass balance but the main conclusions are quite clear.First of all, a considerable mass of As is transported annu-ally from the aquifers to the Red River. Since the river
Fig. 12. A mass balance of As in the Holocene aquifer. Groundwater flows aconcentrations are average observed concentrations in the Holocene and Pleisto
water contains very low concentrations of dissolved As,the groundwater As is apparently precipitated togetherwith Fe-oxides and incorporated in the sediments. In thelong term this constitutes an As recycling loop since theAs enriched sediment with time will be redeposited alongthe river and form a new aquifer.
The second main conclusion is that the amount of Asexported from the system is small compared to the poolof As present in the sediment and a timescale of thousandsof years is envisaged before the Holocene sediments be-come depleted in As which is in agreement with the esti-mates of Postma et al. (2007) based on the As releaserate. The present rates of organic matter decompositionand thereby of As release must decrease over time (Postmaet al., 2007) as the most reactive organic C becomes con-sumed and therefore the time required to deplete the sed-iment for As is a minimum estimate.
6. Conclusions
1. The flood plain aquifers at Dan Phuong show during thedry season (October to May/June) a regional groundwa-ter flow directed towards the Red River, with horizontalparticle velocities up to 37 m/a. In this period, the waterstage of the Red River distributaries is typically abovethe groundwater table and recharge of the shallowaquifer occurs by leakage through the low permeablebottom sediments.
2. During the monsoon, the water stages in the Red Riverand its distributaries increases up to 6–8 m. Thisincrease is stalling the regional groundwater flow inthe adjacent aquifer and the result is a pattern of rapidfluctuations in groundwater table elevations and flowdirection. During this phase, the groundwater tablesincreases up to 4 m within 2–3 months. Rapid fluctua-tions in the stages of the river and channels are gener-ating a succession of gaining and losing phases at theinterface with the aquifer.
re simulated values from the numerical modeling and groundwater Ascene aquifers.

3114 F. Larsen et al. / Applied Geochemistry 23 (2008) 3099–3115
3. Numerical modeling of the groundwater flow showsthat recharge of the Holocene aquifer by surface waterfrom Red River distributaries and from rainwaterthrough a confining clay-rich layer are of the sameorder, being approximately 1.5 million m3/a in themodeled area. An average areal recharge rate from per-colation of 60–100 mm/a through the confining claywas obtained from the transient groundwater flowmodel, while a total recharge rate of 195 mm/a belowconfining clay layers was estimated from 3H/3He datingof the water.
4. At places where the confining, clay-rich layer is lessthan 2–3 m thick, water containing electron acceptors(O2, NO�3 and SO2�
4 ) is transported into the aquiferthrough fractures, or sandy outcrops, and influencesthe redox conditions in the underlying aquifer. The spa-tial variation in the As content of the groundwaterbecomes, accordingly, a function of the hydrogeologicalsetting.
5. Arsenic is mobilized in the Holocene aquifer at a rate ofabout 14 lg/L/a, possibly with retardation in the Pleis-tocene aquifer. An As mass balance for the field siteshows that around 1100 kg of As is in these years annu-ally leached from the Holocene sand and dischargedinto the Red River, corresponding to 0.01% of the totalpool of As present in the Holocene sand.
6. Variations in stable isotope composition of precipita-tion, surface water and groundwater have proved tobe a useful tool in tracing surface–groundwater interac-tions in the shallow Holocene aquifer. This is mainlydue to the amount effect in the precipitation which inparts of Southeast Asia offers a distinct seasonal isoto-pic signature, which can be traced in the hydrologicalcycle. In the studied site, groundwater from the Pleisto-cene aquifer is more depleted than water from theHolocene aquifer, probably reflecting a component ofrecharge water from the surrounding mountains ofthe Red River flood plain.
Acknowledgements
This work is part of research capacity building projectfinanced by the Danish aid organization DANIDA. Furtherproject information can be viewed at http://www.viet-as.env.dtu.dk. Prof. Klaus Froehlich is thanked for a gooddiscussion on the use of stable isotope in recharge studies.We also thank Kristian Anker Rasmussen (GEUS) and Tor-ben Dolin (DTU) for the drawing work. Alexander van Geenand David Polya are acknowledged for constructive com-ments and inputs in the review process. An anonymous re-viewer is also thanked for positive comments and ideas.
References
Araguás-Araguás, L., Froenlich, K., Rozanski, K., 1998. Stable isotopecomposition of precipitation over southeast Asia. J. Geophys. Res. 103(28), 721–728. 742.
Barlow, P.M., Moench, A.F., 1998. Analytical solutions and computerprograms for hydraulic interaction of stream-aquifer systems. U.S.Geol. Surv. Open-File Rep., 98–415A.
Berg, M., Tran, H.C., Nguyen, T.C., Pham, H.V., Schertenleib, R., Giger, W.,2001. Arsenic contamination of groundwater and drinking water in
Vietnam: a human health threat. Environ. Sci. Technol. 35, 2621–2626.
Berg, M., Pham, T.K.T., Stengel, C., Bruschman, J., Pham, H.V., Nguyen, V.D.,Giger, W., Stüben, D., 2008. Hydrogeological and sedimentary controlsleading to arsenic contamination of groundwater in the Hanoi area,Vietnam: The impact of iron–arsenic ratios, peat, river bank deposits,and excessive groundwater abstraction. Chem. Geol. 249, 91–112.
Brunke, M., Gonser, T., 1997. Special Review: The ecological significanceof exchange processes between river and groundwater. FreshwaterBiol. 37, 1–33.
Chambon, J., 2007. Estimation of the Dynamic Interaction betweenSurface and Groundwater at Dan Phuong, Vietnam. M.Sc. thesis,Technical University of Denmark, Institute of Environment &Resources, September 2007.
Charlet, L., Polya, D.A., 2006. Arsenic in shallow, reducing groundwaters insouthern Asia: an environmental health disaster. Elements 2, 91–96.
Cherry, J., 1989. Hydrogeological contamination behaviour in fracturedand unfractured clayey deposits in Canada. In: Kobus, H.E.,Kinzelbach, W. (Eds.), Proc. Internat. Symp. Contaminant Transportin Groundwater. A.A. Balkama, pp. 11–20.
Clark, I., Fritz, P., 1997. Environmental Isotopes in Hydrogeology. LewisPublishers.
Coplen, T.B., 1996. New guidelines for reporting stable hydrogen, carbon,and oxygen isotope ratio data. Geochim. Cosmochim. Acta 60, 3336–3359.
Craig, H., 1961. Isotopic variations in meteoric waters. Science 133, 1702–1703.
Dahm, C., Grimm, N.B., Marmonier, P., Valett, H.M., Vervier, P., 1998.Nutrient dynamics at the interface between surface water andgroundwater. Freshwater Biol. 40, 427–453.
Dansgaard, W., 1964. Stable isotopes in precipitation. Tellus 16, 461–469.Förstel, H., 1982. 18O/16O ratio in plants and their environment. In:
Schmidt, H.L., Förstel, H., Heinzinger, K. (Eds.), Stable Isotopes.Elsevier, Amsterdam, pp. 503–516.
Friedman, I., Machta, L., Soller, R., 1962. Water vapour exchange betweena water droplet and its environment. J. Geophys. Res. 67, 2761–2766.
Gani, M.R., Alam, M.M., 2004. Fluvial facies architecture in small-scaleriver system in the Upper Dupi Tila Formation, northeast BengalBasin, Bangladesh. J. Asian Earth Sci. 24, 225–236.
Goodbred, J.S.L., Kuehl, S.A., 2000. The significance of large sedimentsupply, active tectonism, and eustasy on margin sequencedevelopment: late quaternary stratigraphy and evolution of theGanges-Brahmaputra delta. Sed. Geol. 133, 227–248.
Harvey, C.F., Ashfaque, K.N., Yu, W., Badruzzaman, A.B.M., Ali, M.A., Oates,P.M., Michael, H.A., Neumann, R.B., Beckie, R., Islam, S., Ahmed, M.F.,2006. Groundwater dynamics and arsenic contamination inBangladesh. Chem. Geol. 228, 112–136.
Hvorslev, M.J., 1951. Time lag and soil permeability in groundwaterobservations. U.S. Army Corps Engineers Waterways Exp. Sta., 36.
IAEA. 2002. Water and Environment Newsletter of the Isotope HydrologySection, International Atomic Energy Agency. Issue No. 16, November2002: 5.
Jørgensen, P.R., Fredericia, J., 1992. Migration of nutrients, pesticides, andheavy metals in fractured clayey till. Géotechnique 42, 67–77.
Jørgensen, P.P., Hoffmann, M., Kistrup, J., Bryde, C., Bossi, R., Vilholt, K.G.,2002. Preferential flow and pesticide transport in a clay-rich till: Field,laboratory, and modeling analysis. Water Resour. Res. 38, 1246.doi:10.1029/2001WRooo49.
Klump, S., Kipfer, R., Cirpka, O.A., Harvey, C.F., Brennwald, M.S., Ashfaque,K.N., Badruzzaman, A.B.M., Hug, S.J., Imboden, D.M., 2006.Groundwater dynamics and arsenic mobilization in Bangladeshassessed using noble gas and tritium. Environ. Sci. Technol. 40,243–250.
Lam, D.D., Boyd, W.E., 2003. Holocene Coastal Strategraphy and theSedimentaryn Development of the Hai Phong Area of the Bac Bp Plain(Red River Delta) Vietnam. Aust. Geographer 34, 177–194.
Lawrence, J.R., White, J.W.C., 1991. The elusive climate signal in theisotopic composition of precipitation. In: Taylor, H.P., Jr., O’Neil, J.R.,Kaplan, I.R. (Eds.), Stable Isotope Geochemistry: a Tribute to SamuelEpstein. Special Publication No. 3, The Geochemical Society, pp. 169–185.
Lee, D.R., 1977. A device for measuring seepage flux in lakes and estuaries.Limnol. Oceanog. 22, 140–147.
Manning, A.H., Solomon, D.K., Thiros, S.A., 2005. 3H/3He age data inassessing the susceptibility of wells to contamination. Ground Water43, 353–367.
Massmann, G., Tichomirowa, M., Merz, C., Pekdeger, A., 2004. Sulideoxidation and sulphate reduction in a shallow groundwater system(Oderbruch Aquifer, Germany). J. Hydrol. 278, 231–243.

F. Larsen et al. / Applied Geochemistry 23 (2008) 3099–3115 3115
Mathers, S., Zalasiewicz, J., 1999. Holocene sedimentary architecture ofthe Red River Delta, Vietnam. J. Coast. Res. 15, 314–325.
McDonald, MG., Harbaurgh, A.W., 2005. A modular three-dimensionalfinite-dirrerence ground-water flow model. U.S. Geological Survey.
McKay, L.D., Cherry, J.A., Gilham, R.W., 1993. Field experiments in afractured clay till 1 hydraulic conductivity and fracture aperature.Water Resour. Res. 29, 1149–1162.
Murray, A.S., Oley, J.M., 1999. Determining sedimentation rates usingluminescence dating. Geo Research Forum 5, 121–144.
Ngo, L. L., 2006. Optimising reservoir operation–a case study of the HoaBinh reservoir, Vietnam. Ph. D. thesis. Institute of Environment andResources, Technical University, Denmark.
Nielsen, L.H., Mathiesen, A., Bidstrup, T., Vejb�k, O.V., Dien, P.T., Tiem,P.V., 1999. Modelling of hydrocarbon generation in the Cenozoic SongHong Basin, Vietnam: a high prospective basin. J. Earth Sci. 17, 269–294.
Polizzotto, M.L., Harvey, C.F., Li, G., Badruzzman, B., Ali, A., Newville,M., Sutton, S., Fendorf, S., 2006. Solid-phases and desorptionprocesses of arsenic within Bangladesh sediments. Chem. Geol.228, 97–111.
Postma, D., Larsen, F., Nguyen, T.M.H., Mai, T.D., Pham, H.V., Pham, Q.N.,Jessen, S., 2007. Arsenic in groundwater of the Red River flood plain,Vietnam: controlling geochemical processes and reactive transportmodelling. Geochim. Cosmochim. Acta 71, 5054–5071.
Rozanski, K., Araguás-Araguás, L., Gonfiantini, R., 1993. Isotopic patternsin modern global precipitation. In: Continental Isotope Indicators ofClimate. American Geophysical Union Monograph.
Rushton, K.R., Tomlinson, L.M., 1979. Possible mechanisms for leakagebetween aquifers and rivers. J. Hydrol. 40, 49–65.
Sanford, W.E., Shropshire, R.G., Solomon, D.K., 1996. Dissolved gas tracersin groundwater: simplified injection, sampling, and analysis. WaterResour. Res. 32, 1635–1642.
Smedley, P.L., Kinniburgh, D.G., 2002. A review of the source, behaviourand distribution of arsenic in natural waters. Appl. Geochem. 17, 517–568.
Sophocleous, M., 2002. Interaction between groundwater and surfacewater: the state of the science. Hydrogeol. J. 10, 52–67.
Stanger, G., 2005. A paleo-hydrogeological model for arseniccontamination in southern and south-east Asia. Environ. Geochem.Health 27, 359–367.
Stute, M., Schlosser, P., 2000. Atmospheric noble gases. In: Cook, P.G.,Herczeg, A.L. (Eds.), Environmental Tracers in Subsurface Hydrology.Klüwer, Boston, pp. 49–377.
Stute, M., Zheng, Y., Schlosser, P., Horneman, A., Dhar, R.K., Datta, S.,Hoque, M.A., Seddique, A.A., Shamsudduha, M., Ahmed, K.M., Green,A.V., 2007. Hydrogeological control of As concentrations inBangladesh groundwater. Water Resour. Res. 43, W09417.doi:10.1029/2005WR00449.
Tanabe, S., Hori, K., Saito, Y., Haruyama, S., Vu, V.P., Kitamura, A., 2003a.Song Hong (Red River) delta evolution related to millennium-scaleHolocene sea-level changes. Quatern. Sci. Rev. 22, 2345–2361.
Tanabe, S., Hori, K., Saito, Y., Haruyama, S., Doanh, L.Q., Sato, Y., Hiraide, S.,2003b. Sedimentary facies and radiocarbon dates of the Nam Dinh-1core from the Song Hong (Red River) delta, Vietnam. J. Asian Sci 21,503–513.
Tanabe, S., Saito, Y., Vu, Q.L., Hanebuth, T.J.J., Ngo, Q.L., Kitamura, A., 2006.Holocene evolution of the Song Hong (Red River) delta system,northern Vietnam. Sed. Geol. 187, 29–61.
van Geen, A., Zheng, Y., Versteeg, R., Stute, M., Horneman, A., Dhar, R.,Steckler, M., Gelman, A., Small, C., Ahsan, H., Graziano, J.H., Hussain, I.,Ahmed, K.M., 2003. Spatial variability of arsenic in 6000 tube wells ina 25 km2 area of Bangladesh. Water Resour. Res. 39, 1140.doi:10.1029/2002WR00161.
Vogel, J.C. 1967. Investigation of groundwater flow with radiocarbon. In:Proc. 1966 Symp. IAEA Vienna, 355-369.
Weber, K.J., Eijpe, R., Leijnse, D., Moens, C., 1972. Permeability distributionin a Holocene distributary channel-fill near Leerdam (TheNetherlands). Geologie en Mijnbouw 51, 53–62.
Woessner, W.W., 2000. Stream and fluvial plain groundwater interactions:Rescaling hydrologic thought. Groundwater 38, 423–429.
Zimmerman, U., Mönnich, K.O., Roether, W. 1967. Downward movementof soil moisture traced by means of hydrogen isotopes. In: IsotopeTechniques in the Hydrologic Cycle. Geophysical Monograph Series11, American Geophysical Union.