
Institut de recherche pour l'étude des religions Bulletin d ...
Upload
khangminh22Category
view
3download
0
HAL Id: tel-01318127https://tel.archives-ouvertes.fr/tel-01318127
Submitted on 19 May 2016
HAL is a multi-disciplinary open accessarchive for the deposit and dissemination of sci-entific research documents, whether they are pub-lished or not. The documents may come fromteaching and research institutions in France orabroad, or from public or private research centers.
L’archive ouverte pluridisciplinaire HAL, estdestinée au dépôt et à la diffusion de documentsscientifiques de niveau recherche, publiés ou non,émanant des établissements d’enseignement et derecherche français ou étrangers, des laboratoirespublics ou privés.
Contributions à l’étude de la réponse moléculaire àl’hypoxie : Modélisation mathématique et
expérimentations sur cellules FUCCIBaptiste Bedessem
To cite this version:Baptiste Bedessem. Contributions à l’étude de la réponse moléculaire à l’hypoxie : Modélisationmathématique et expérimentations sur cellules FUCCI. Biologie cellulaire. Université Grenoble Alpes,2015. Français. �NNT : 2015GREAS024�. �tel-01318127�

THÈSE Pour obtenir le grade de
DOCTEUR DE L’UNIVERSITÉ GRENOBLE ALPES Spécialité : Modèles, méthodes et algorithmes pour le Biologie, la santé et l’environnement
Arrêté ministériel : 7 août 2006
Présentée par
Baptiste Bedessem Thèse dirigée par Angélique Stéphanou préparée au sein du Laboratoire TIMC-IMAG et de l'École Doctorale pour l’Ingénierie pour la Santé, la Cognition et l’Environnement
Contributions à l’étude de la réponse moléculaire à l’hypoxie Modélisation mathématique et expérimentations sur cellules FUCCI
Thèse soutenue publiquement le 23 octobre 2015
devant le jury composé de :
Mme Carine Michiels Professeure à l’Institut de Recherche pour les
Sciences de la Vie de Namur (Rapportrice) Mr Olivier Saut Directeur de Recherche au CNRS de Bordeaux (Rapporteur)
Mme Annabelle Ballesta Maître de Conférence des Universités, Université de Warwick (Examinatrice)
Mr Xavier Ronot Professeur à l’EPHE (Président du Jury)
Mme Angélique Stéphanou Chargée de recherche au CNRS de Grenoble, Directrice de thèse

2

Table des matieres
Resume 7
1 Introduction 9
2 Etat de l’art et motivations 13
2.1 Cycle cellulaire . . . . . . . . . . . . . . . . . . . . . . . . . . . . . . . 13
2.1.1 Generalites : phases et points de controle . . . . . . . . . . . . . 13
2.1.2 Acteurs moleculaires . . . . . . . . . . . . . . . . . . . . . . . . 14
2.1.3 Regulation de l’activite des couples cycline/CDK . . . . . . . . 16
2.1.4 Points de controle . . . . . . . . . . . . . . . . . . . . . . . . . . 17
2.2 HIF-1α : roles et regulation . . . . . . . . . . . . . . . . . . . . . . . . 18
2.2.1 Effets de HIF-1α a l’echelle moleculaire . . . . . . . . . . . . . . 18
2.2.2 Interactions avec le cycle cellulaire . . . . . . . . . . . . . . . . 20
2.2.3 Liens avec la carcinogenese . . . . . . . . . . . . . . . . . . . . . 21
2.2.4 Regulation de HIF-1α : aspects biologiques . . . . . . . . . . . . 21
2.2.5 Regulation de HIF-1α : modeles mathematiques . . . . . . . . . 23
2.3 Les molecules inductrices de HIF-1α . . . . . . . . . . . . . . . . . . . 24
2.4 Les cellules FUCCI : un outil pour explorer la dynamique du cycle cellulaire 25
2.4.1 Les outils d’etude du cycle . . . . . . . . . . . . . . . . . . . . . 25
2.4.2 Les cellules FUCCI : bases biologiques . . . . . . . . . . . . . . 26
2.4.3 Utilisation des cellules FUCCI . . . . . . . . . . . . . . . . . . . 28
2.5 Demarche de la these . . . . . . . . . . . . . . . . . . . . . . . . . . . . 30
3 Hypoxie et cycle cellulaire : approche mathematique 33
3.1 Introduction . . . . . . . . . . . . . . . . . . . . . . . . . . . . . . . . . 33
3.1.1 Modelisation du cycle cellulaire . . . . . . . . . . . . . . . . . . 33
3.1.2 Hypoxie et cycle cellulaire . . . . . . . . . . . . . . . . . . . . . 34
3.1.3 Le modele d’Alarcon . . . . . . . . . . . . . . . . . . . . . . . . 35
3.2 Un modele plus complet . . . . . . . . . . . . . . . . . . . . . . . . . . 36
3.2.1 Demarche . . . . . . . . . . . . . . . . . . . . . . . . . . . . . . 36
3.2.2 Article : Bedessem B. and Stephanou A., A mathematical modelof HIF-1-mediated response to hypoxia on the G1/S transition,Mathematical Biosciences, 2014, 248 :31-9 . . . . . . . . . . . . 37
3.3 Conclusion . . . . . . . . . . . . . . . . . . . . . . . . . . . . . . . . . . 55
3

4 Table des matieres
4 Hypoxie et cycle cellulaire : approche experimentale 574.1 Introduction . . . . . . . . . . . . . . . . . . . . . . . . . . . . . . . . . 57
4.1.1 Cadre de l’etude . . . . . . . . . . . . . . . . . . . . . . . . . . 574.1.2 Methode . . . . . . . . . . . . . . . . . . . . . . . . . . . . . . . 58
4.2 Etude des effet de DFO et CoCl2 sur le cycle cellulaire . . . . . . . . . 594.2.1 Article : B.Bedessem, M-P.Montmasson, M. Hamel, F.Giroud,
A.Stephanou, Effects of the hypoxia-mimetic agents DFO andCoCl2 on HeLa-FUCCI cells, Journal of Cell Biology and CellMetabolism, 2015 . . . . . . . . . . . . . . . . . . . . . . . . . . 59
4.2.2 Conclusion . . . . . . . . . . . . . . . . . . . . . . . . . . . . . . 724.3 Recuperation apres blocage en phase G2 . . . . . . . . . . . . . . . . . 744.4 Effets de la reoxygenation . . . . . . . . . . . . . . . . . . . . . . . . . 764.5 Conclusion . . . . . . . . . . . . . . . . . . . . . . . . . . . . . . . . . . 79
5 Regulation de HIF-1α 815.1 Introduction . . . . . . . . . . . . . . . . . . . . . . . . . . . . . . . . . 81
5.1.1 Compartimentation de HIF-1α : aspects biologiques . . . . . . . 815.1.2 Les effets de la reoxygenation . . . . . . . . . . . . . . . . . . . 835.1.3 Modeles existants pour la regulation de HIF-1α . . . . . . . . . 84
5.2 Un modele compartimente pour la regulation de HIF-1α . . . . . . . . 855.2.1 Demarche et principaux resultats obtenus . . . . . . . . . . . . 855.2.2 Article : Bedessem B. and Stephanou A., Role of compartmental-
ization on HIF-1 degradation dynamics during changing oxygenconditions : a computational approach, Plos One, 2014, 9(10) . . 86
5.2.3 Conclusion . . . . . . . . . . . . . . . . . . . . . . . . . . . . . . 1095.3 Comment la reoxygenation peut-elle induire
l’apoptose ? . . . . . . . . . . . . . . . . . . . . . . . . . . . . . . . . . 1105.3.1 Les interconnexions des voies hypoxiques et apoptotiques : la
relation yin-yang . . . . . . . . . . . . . . . . . . . . . . . . . . 1115.3.2 Formulation du modele yin-yang . . . . . . . . . . . . . . . . . 1125.3.3 Resultats . . . . . . . . . . . . . . . . . . . . . . . . . . . . . . 114
5.4 Localisation de HIF-1α et cycle cellulaire . . . . . . . . . . . . . . . . . 1165.4.1 Introduction . . . . . . . . . . . . . . . . . . . . . . . . . . . . . 1165.4.2 Methode . . . . . . . . . . . . . . . . . . . . . . . . . . . . . . . 1165.4.3 Resultats . . . . . . . . . . . . . . . . . . . . . . . . . . . . . . 120
5.5 Conclusion . . . . . . . . . . . . . . . . . . . . . . . . . . . . . . . . . . 121
6 Conclusion generale 123
Bibliographie 127
A Acquisition des images en microscopie 147
B Traitement des images 151
C Protocole d’immunomarquage de HiF-1α 155

Table des matieres 5
D Article scientifique : Bedessem B. and Ruphy S., SMT or TOFT?How the two main theories of carcinogenesis were made (artifi-cially) incompatible, Acta Biotheoretica, 2015 157

6 Table des matieres

Resume
Les effets biologiques de l’hypoxie sont tres etudies aujourd’hui, principalement enraison du role crucial que jouent les conditions d’oxygenation dans le developpementdes cancers. Depuis plusieurs annees, une litterature foisonnante tente ainsi de decrireles multiples aspects de la reponse moleculaire, cellulaire et physiologique a l’hy-poxie. La complexite des voies de signalisation impliquees et la diversite de leurseffets cellulaires rendent la tache delicate. Cet etat de fait se reflete dans la plu-ralite des methodes utilisees, depuis les simulations numeriques jusqu’aux approchesexperimentales. Dans cette these, j’ai aborde ce sujet sur la base de deux outils : lamodelisation mathematique et une demarche experimentale utilisant les cellules HeLa-FUCCI. Cette lignee cellulaire recemment developpee est en effet un instrument dechoix encore peu exploite. Par une construction genetique liant des proteines du cyclecellulaire a un fluorophore, elle rend possible l’etude, en continue, de la dynamiquedu cycle en microscopie de fluorescence. Nous avons ainsi pu analyser plusieurs as-pects de la reponse cellulaire a l’hypoxie, dans un contexte tumoral. Dans un premiertemps, nous avons cherche a caracteriser mathematiquement les liens tisses entre lecycle cellulaire et les voies de signalisation de l’hypoxie, centrees sur le facteur de tran-scription HIF-1α. Ce modele propose une explication simple a l’arret du cycle observenotamment dans les cellules tumorales en conditions hypoxiques. Nous avons ainsimontre que l’induction de chimioresistance pouvait se concevoir comme une entree fa-cilitee en quiescence des cellules cancereuses. Dans le but de valider ces observations,nous avons ensuite cherche a quantifier experimentalement la dynamique de la pro-liferation cellulaire en utilisant les cellules HeLa-FUCCI. Comme il est apparu queles fluorophores qu’elles portent sont sensibles au manque d’oxygene, nous avons testedifferentes molecules couramment utilisees pour induire HIF-1α et mimer l’hypoxie(DFO et CoCl2). De cette etude ont emerge des resultats originaux quant a la dy-namique de blocage du cycle des cellules HeLa en presence de chelateurs du fer. Si lesconditions hypoxiques ne sont pas favorables a l’utilisation des cellules FUCCI, nousavons pu en revanche montrer qu’elles etaient tout a fait adaptees a l’etude de la dy-namique du cycle cellulaire en condition de reoxygenation. De maniere interessante,nous avons alors pu observer un ralentissement significatif de la phase S apres retoura la normoxie. Afin d’apporter un eclairage theorique a cette observation, nous avonspropose un modele mathematique de la dynamique de regulation de HIF-1α en condi-tions d’oxygene fluctuantes, base sur le couple HIF-1α/pVHL, dont les relations sontpensees dans un cadre compartimente (noyau/cytoplasme). Ce modele simple reproduitfidelement les caracteristiques principales de la reponse cellulaire a l’hypoxie. En outre,en simulant les consequences d’une reoxygenation brutale, nous avons observe la genese
7

8 Table des matieres
de fortes instabilites du niveau intracellulaire de HIF-1α. Enfin, nous avons mene uneetude experimentale de la compartimentation de HIF-1α. L’outil FUCCI permet en ef-fet d’observer simultanement l’avancement du cycle (en microscopie de fluorescence), etla localisation intra-cellulaire de HIF-1α (par immunomarquage). Nous avons pu mon-trer que la variabilite de la localisation de HIF-1α n’etait pas due a la progression dansle cycle. Elle est donc certainement liee soit a des differences genetiques inter-cellulaire,soit a une stochasticite de la regulation de HIF-1α.

1Introduction
Au sein d’un organisme vivant, l’hypoxie peut se definir comme une inadequationentre les besoins tissulaires, et les apports effectifs en oxygene. La pression d’oxygenelimite induisant les voies moleculaire de reponse a hypoxie est ainsi relative au typecellulaire considere : 15% dans le cerveau, 6% dans le foie et les reins [1]. In vitro, ilest d’usage d’imposer des pressions en oxygene (PO2
) inferieures a 2% O2 pour etudierles effets biologiques de l’hypoxie [2]. Les nombreux travaux sur le sujet ont reporteune grande variete de reponses cellulaires au manque d’oxygene. D’une part, des PO2
inferieures a 1% peuvent induire un arret du cycle. Ce dernier se manifeste souventdans la transition G1/S [3], mais des blocages en phase G2 ou M ont egalement etereportes [4]. Lorsque l’hypoxie est extreme (proche de l’anoxie), une induction des voiesde l’apoptose dependantes de p53 a souvent ete observee [5–8]. D’autre part, la priva-tion d’oxygene peut egalement avoir un effet inverse, en promouvant la proliferationcellulaire [9–12].
L’etude des effets biologiques de l’hypoxie est rendue cruciale de part le role que jouela privation d’oxygene dans les cancers. En effet, a cause de leur croissance rapide, lestumeurs subissent une hypoxie chronique [3]. Cette derniere est associee a l’emergencede phenotypes agressifs et resistants [13, 14]. Pour certains auteurs, comme Andersonet al. (2006) [15], l’hypoxie peut ainsi etre vue comme une force selective favorisantle developpement, au sein de la masse tumorale, de marges invasives. De manieregenerale, l’hypoxie chronique est consideree comme l’un des principaux facteurs d’echecdes therapies anti-cancereuses [16]. Plusieurs mecanismes, que nous detaillerons dansle chapitre suivant, sont ici a l’œuvre : baisse de la production de radicaux libresen radiotherapie, entree en quiescence des cellules, selection de phenotypes resistants...Outre cette privation constitutive d’oxygene, les tissus cancereux sont soumis a une hy-poxie cyclique, due a l’evolution de l’architecture du systeme vasculaire [17]. La periodede ces cycles peut varier de quelques minutes a plusieurs heures ou jours. Des etudesrecentes ont montre que cette hypoxie intermittente favorisait fortement l’emergence et
9

10 Introduction
la selection de phenotypes tumoraux resistants et invasifs [18, 19]. Plusieurs mecanismessemblent a l’œuvre. D’une part, chaque cycle tend a augmenter la frequence des mu-tations cellulaires [20]. D’autre part, la reoxygenation tend a affecter selectivementplus de 200 genes [21]. Il faut egalement noter que ces phenomenes de reoxygenationjouent aussi un role important dans les cas d’ischemie. Notamment, la reperfusion bru-tale suivant une rupture de l’approvisionnement sanguin genere des vagues d’apoptosecausant de gros dommages tissulaires [22, 23].
Les implications medicales de ces reponses cellulaires a l’hypoxie ont rendu crucialela comprehension des voies moleculaires qui les sous-tendent. La decouverte de l’agentcentral de la reponse cellulaire a l’hypoxie, le facteur de transcription HIF-1, remonteau debut des annees 90. Elle est associee a l’equipe de Gregg L. Semenza. Cette dernierea en effet mis en evidence l’existence d’une sequence genetique presente sur les promo-teurs de differents genes exprimes sous l’effet de l’hypoxie : le HRE (Hypoxia ResponsiveElement) [24]. Ce HRE a ainsi ete identifie en aval du gene de l’EPO, une hormonestimulant la proliferation des erythrocytes [25], puis d’enzymes glycolytiques [26, 27].La structure de la proteine se liant au HRE a ete etablie dans l’etude de Wang et al.(1995) [28]. Il s’agit d’un heterodimere, que les auteurs nommerent HIF-1 (HypoxiaInducible Factor-1 ). Ce dernier est constitue d’une sous-unite α (HIF-1α). dont la sta-bilite depend de la pression en oxygene, et d’une sous-unite β (HIF-1β), exprimee demaniere constitutive [29]. Il se lie a l’ADN via un motif helice-tour-helice. La sous-uniteα contient un domaine responsable de sa degradation en presence d’oxygene (ODDD :Oxygen-Dependent Degradation Domain) [30]. Bien que cette these soit centree sur lefacteur HIF-1, et specialement sur sa sous-unite α, il convient de noter ici que deuxautres proteines peuvent s’associer avec HIF-1β et medier la reponse cellulaire a l’hy-poxie : HIF-2α et HIF-3α. HIF-2α a ete identifiee en 1997, independamment des travauxde Semenza [31]. Initialement, la proteine est apparue comme exprimee de maniere plusrestreinte que HIF-1α. Notamment, sa presence semble limitee aux cellules constitu-tives des vaisseaux sanguins. Cependant, des observations plus recentes suggerent unpanorama plus complexe des relations entre HIF-1 et HIF-2α. Ces dernieres sont eneffet co-exprimees dans un grand nombres de types cellulaires [29]. Une troisieme sous-unite α a ete decrite, HIF-3α. [32]. Ses roles sont moins connus. Il semble que plusieursisoformes de cette proteine existent, qui peuvent promouvoir ou inhiber l’activites desautres facteurs de transcription HIF [32].
La figure 1.1 donne une representation en trois dimensions de la proteine HIF-1α.Cette derniere est intensivement etudiee aujourd’hui, en tant qu’agent cle de la reponsecellulaire a l’hypoxie.
Lorsque la pression en oxygene diminue, son niveau intracellulaire augmente ensuivant une loi exponentielle bien caracterisee experimentalement. La figure 1.2 donnela courbe, tracee par Jiang et al. (1996) [33], representant l’activite genetique deHIF-1 en fonction de l’intensite de l’hypoxie. Les auteurs ont quantifie, via une seried’electrophoreses sur gel de polyacrylamide, la quantite de facteur de transcription lieea l’ADN dans des cellules HeLa, dans differentes conditions d’hypoxie. Il apparaıt quel’abondance nucleaire de HIF-1 augmente rapidement pour des pressions d’oxygenesinferieures a 1%. Ce comportement, qui a plus tard ete qualifie de “switch-like”, est

11
Figure 1.1: Structure de la sous-unite α du facteur de transcription HIF-1.
Figure 1.2: Abondance proteique de HIF-1 en fonction de la pression en oxygene.Les mesures ont ete faites en densitometrie,a partir d’electrophorese sur gel SDS-Page(Western-Blot). Les losanges noirs correspon-dent a une experience realisee en presence deKCN.
principalement du a la stabilisation de HIF-1α en absence d’oxygene [34]. Cette sous-unite peut ensuite se dimeriser avec HIF-1β pour former un facteur de transcriptionactif.
La connaissance des mecanismes d’action et des voies de regulation de HIF-1, et enparticulier de sa sous-unite α, est motivee par le role important joue par la proteine dansla tumorigenese. En effet, elle est sur-exprimee dans la plupart des types de cancer [35–38]. Parallelement, on constate une forte expression des genes controles par le facteur detranscription [39]. Deux causes ont ete invoquees pour expliquer cette observation [35].D’une part, comme nous l’avons vu, l’hypoxie chronique a laquelle sont soumises les cel-lules tumorales induit logiquement une accumulation de HIF-1α. D’autre part, des mu-tations genetiques peuvent egalement induire une deregulation de sa concentration ennormoxie. Par exemple, certains cancers se caracterisent par une perte de fonctionnalitede la proteine pVHL, impliquee dans le systeme de degradation oxygene-dependant deHIF-1α [40]. De fait, les liens tisses entre HIF-1 et la tumorigenese sont intensivementetudies depuis plusieurs annees [6, 41, 42]. La proteine HIF-1α est d’ailleurs devenueune cible pour des traitements anti-cancer novateurs, cherchant notamment a diminuerl’activite de HIF-1α. [43].
Dans ce cadre, la comprehension fine de la reponse cellulaire a l’hypoxie est

12 Introduction
evidemment cruciale. Si de grands progres ont ete faits sur le sujet ces dernieres annees,la dynamique actuelle des recherches dans ce domaine est a la hauteur de la com-plexite du probleme. De nombreuses questions se posent. Parmi elles, les mecanismesde regulation de HIF-1α et les relations entre le facteur de transcription et les proteinesdu cycle cellulaire font l’objet d’etudes experimentales, et, de plus en plus, de travauxde modelisation. D’autre part, les effets de la reoxygenation, en lien avec l’hypoxiecyclique a laquelle sont soumises les tumeurs, sont encore peu compris. Enfin, l’utili-sation d’inducteurs chimiques de HIF-1α, notamment les chelateurs du fer, ouvre unevoie interessante du point de vue de la mise en place de traitements anti-cancereux.L’etude de leurs effets biologiques est la aussi un domaine de recherche tres actif. Cettethese se propose d’apporter quelques contributions a ces questions contemporaines, encouplant modelisation mathematique et experimentation sur cellules HeLa-FUCCI.

2Etat de l’art et motivations
Dans le chapitre precedent, nous avons presente le cadre general dans lequel s’inscritcette these. Ici, nous desirons brosser un portrait un peu plus detaille de l’etat des con-naissances portant sur le controle du niveau moleculaire de HIF-1α et son interactionavec le cycle cellulaire. De cette maniere, nous clarifierons les questions ayant motivela conduite de ce travail, et les demarches adoptees pour y repondre. Apres un brefrappel portant sur la biologie de la proliferation cellulaire, notre propos s’attachera adecrire les grands traits de la regulation de HIF-1α, et son interaction avec les proteinesdu cycle. Nous preciserons notamment les caracteristiques des modeles mathematiquesexistants, et les questions qu’ils soulevent. Nous aborderons ensuite le probleme desmolecules induisant HIF-1α, comme DFO ou CoCl2. Celles-ci sont en effet utilisees demaniere tres repandue dans le but de mimer les consequences biologiques de l’hypoxie,bien que la diversite de leurs cibles moleculaires induise une variabilite importante deleurs effets biologiques. Nous nous attarderons enfin sur le modele experimental queconstitue la lignee HeLa-FUCCI, de maniere a mettre en valeur l’interet que presenteson utilisation pour l’etude de la dynamique de la proliferation.
2.1 Cycle cellulaire
2.1.1 Generalites : phases et points de controle
La connaissance des mecanismes moleculaires de la regulation du cycle cellulaire afait d’immenses progres depuis une vingtaine d’annees. Les premieres etudes ont etemenees sur deux especes de levure : Saccharomyces Cerevisiae et Saccharomyces Pombe.Elles ont permis d’identifier les principaux agents proteiques controlant la proliferationcellulaire. Plus tard, il est apparu que le systeme de regulation etait tres conserve entreles especes, bien que plus complexe chez les eucaryotes pluricellulaires. Ici, nous nous
13

14 Etat de l’art et motivations
concentrons sur la regulation du cycle chez l’homme. Avant d’entrer dans le detail devoies complexes de son controle, nous rappelons ici quelques generalites. Une celluleen division passe par quatre phases distinctes, nommees G1, S, G2, et M. Une derniereetape, la cytodierese, assure la separation des cytoplasmes des deux cellules filles. Lafigure 2.1 donne une representation schematique de l’enchaınement des phases du cycle,et de ses points de controle. La premiere phase, dite G1, est une phase de croissance. Lacellule augmente son volume et synthetise un grand nombre de proteines necessaires asa division. Durant la phase S, l’ADN est replique, de maniere a fournir a chaque cellulefille l’integralite du patrimoine genetique. La phase G2 est dediee a l’achevement de lacroissance, au controle de la qualite de la duplication de l’ADN, et a la preparationde la mitose. Cette derniere (phase M) voit l’avenement de deux cellules filles a partirde la cellule initiale. Les chromosomes doubles se repartissent en deux lots (a peupres) identiques, et le cytoplasme se divise (cytodierese). La duree totale du cycle esttres variable d’un type cellulaire a l’autre. Pour un fibroblaste humain en culture, lesdurees typiques sont de 12h pour la phase G1, 5h pour la phase S, 4h pour la phaseG2, et une heure pour la phase M. Dans un organisme, ces valeurs sont evidemmenthautement dependantes de la fonction cellulaire. Les cellules specialisees (produisantdes hormones, conduisant l’influx nerveux...) ne se divisent pas. On dit qu’elles sonten phase quiescente, ou G0. A l’inverse, les cellules souches chargees de la regenerationdes tissues se divisent en continue, comme dans l’epithelium intestinal.
Comme le montre la figure 2.1, le cycle cellulaire est jalonne de points de controle.Ils en regulent la progression, en bloquant a des moments precis l’avancee des cellulesjugees inaptes a le poursuivre. La premier point de contole se situe a la transition entreles phases G1 et S. Il bloque la progression des cellules lorsque leur taille n’est passuffisante, ou lorsque l’ADN est en mauvais etat. De nombreux agents externes peuventici intervenir, notamment le manque de facteurs de croissance, un stress nutritionnel, ouencore, comme nous le verrons, l’hypoxie. Le passage de la phase G2 a M est egalementcontrole, afin de garantir la replication correcte de l’ADN. Enfin, le controle du fuseaumitotique permet de bloquer la mitose (phase M) si les conditions d’une separationcorrecte des chromatides ne sont pas reunies.
Comment sont regules ces points de controle ? Quelles sont les proteines cles inter-venant dans la progression du cycle ? La figure 2.2 introduit le couple cycline/CDK(CDK=Cycline-Dependent Kinase). Ces complexes proteiques s’accumulent dans lacellule au cours des differentes phases du cycle, et leur activite determine le passagedes points de controle. Nous allons maintenant etudier plus en detail la dynamique deregulation de ces agents.
2.1.2 Acteurs moleculaires
Les CDK sont des enzymes de type kinase. Elles activent de multiples cibles parphosphorylation. Par ce biais, elles agissent sur la synthese et/ou l’activite des proteinesnecessaires a la progression du cycle : enzymes de synthese de l’ADN, fuseau de mi-crotubules, enzymes metaboliques... Pour etre actives, les CDK doivent, d’une part,former un complexe avec une cycline donnee, et d’autre part, etre phosphorylees surun residu threonine proche de son site actif (Threonine 160). La phosphorylation sur

2.1 Cycle cellulaire 15
Figure 2.1: Representation schematiquedes differentes phases du cycle cellulaire (G1,S, G2, M, et cytodierese) et de ses points decontrole
Figure 2.2: Points de controle du cycle, etprincipales proteines regulatrices
d’autres residus entraıne a l’inverse une inhibition de l’activite enzymatique de la CDK.La figure 2.5 schematise un couple cycline/CDK actif. De nombreux types de CDK ontete recenses (11 chez l’homme). De meme, il existe au moins une dizaine de cyclines,dont la fonction est, pour plusieurs d’entre elles, inconnue a ce jour. Chaque phasedu cycle est caracterisee par l’augmentation de l’activite d’un couple cycline/CDKdonne. La figure 2.4 donne l’evolution de cette activite enzymatique au cours du cycle.Le passage des differents points de controle requiert une accumulation suffisante dela cycline/CDK correspondante. Cette idee sera reprise et illustree plus tard dans lathese, notamment dans l’elaboration de notre modele de transition G1/S en hypoxie.Comment est regulee cette activite des complexes cycline/CDK?

16 Etat de l’art et motivations
Figure 2.3: Complexe cycline/cdk. Pouretre actifs, les CDK doivent etre lies a une cy-cline, et porter un groupement phosphate surune threonine situee a proximite du site actif(threonine 160, en vert). Une phosphorylationsupplementaire sur une serine ou une threoninepeut inhiber son activite (en rouge).
Figure 2.4: Role des complexes cycline/cdk. La progression dans le cycle est permise parun ensemble de couples cycline/CDK, specifiques de chaque phase. Notamment, le passagedes points de controle est possible lorsque l’activite du complexe correspondant est suffisante(a gauche). On peut ainsi representer schematiquement, comme ci-dessus (a droite), les vari-ations d’activite des differents complexes cycline/cdk au cours du cycle.
2.1.3 Regulation de l’activite des couples cycline/CDK
L’activite des couples cyclines/CDK est regulee par plusieurs mecanismes.Premierement, l’equilibre phosphorylation/dephosphorylation des CDK modifie leuractivite enzymatique. La phosphorylation activatrice (proche du site actif) des CDK estassuree par une proteine nommee CAK (CDK-activating Kinase). D’autres proteineskinases peuvent inhiber l’activite des CDK en les phosphorylant sur un autre site : c’estle cas de la proteine kinase Wee1. A l’inverse, la phosphatase CDC25 (CDC pour CellDivision Cycle) supprime le groupement phosphate inhibiteur et active le complexecycline/CDK. La figure 2.5 schematise ces differentes interactions. Deuxiemement,un groupe de proteines nommees CDKi (CDK-inhibitors) inactive les complexes cy-cline/CDK en interagissant avec eux. Deux familles de molecules peuvent jouer ce

2.1 Cycle cellulaire 17
role. Les proteines CIP/KIP (CDK-Interacting Proteins/Kinase Inhibitory Proteins)se fixent sur les complexes cycline/CDK et inhibent leur activite kinase. C’est le casnotamment des proteines p21, p27, p57. D’autre part, les proteines de la famille INK4,incluant les proteines p14 et p16, empechent la formation des complexes cycline/CDK.La figure 2.6 represente quelques unes des nombreuses interactions entre les com-plexes cycline/CDK et leurs inhibiteurs (CDKI) et activateurs (CDC25). Enfin, untroisieme mecanisme assure la regulation de l’activite des complexes cycline/CDK : ladegradation des cyclines. Une des particularites de ces proteines, et qui leur vaut leurnom, est de voir leur niveau intracellulaire varier au cours du cycle. Ainsi, la cycline Ds’accumule en phase G1 et disparaıt en phase S, la cycline E est presente lors de la tran-sition G1/S, la cycline B entre la phase G2 et la mitose... Un des mecanismes guidantces fluctuations est l’adressage des cyclines au proteasome par ubiquitination. Cettemodification chimique est assuree par des complexes proteiques comportant notam-ment des ligases E-3, ajoutant des groupements ubiquitine aux cyclines. Ces complexessont actives sequentiellement au cours du cycle. Par exemple, le groupement APC(Anaphase Promoting Complex) degrade les cyclines lors de l’entree en mitose, et SCFcontrole la transition G1/S en degradant notamment la cycline E. La figure 2.7 donneune representation schematique de ces mecanismes. Cette degradation sequentielle descyclines est essentielle a la progression dans le cycle.
Figure 2.5: Dynamique d’activa-tion/inhibition de CDK1 par phosphorylation.La proteine activatrice CAK phosphoryle laCDK sur la theonine 160, ce qui l’active.Des proteines inhibitrices, comme wee1,inhibent l’activite des cdk en phosphorylantles enzymes sur la threonine 14 ou 15. Cephosphate peut etre retire par une proteineactivatrice, la CDC25.
2.1.4 Points de controle
Nous donnerons, dans la suite de ce manuscrit, une description plus complete desevenements moleculaires permettant l’entree en phase S, et de la maniere dont cer-taines contraintes environnementales (en l’occurence, l’hypoxie) jouent sur ce point decontrole. Nous nous contenterons donc, pour le moment, et en guise d’exemple, de don-ner une description rapide du mecanisme moleculaire presidant a la transition G1/S.Ce dernier est illustre sur la figure 2.8. Un facteur externe, typiquement un facteur decroissance, active le couple cycline D/CDK4. Cette derniere phosphoryle la proteineRb, ce qui libere le facteur de transcription E2F. Ce dernier stimule ensuite l’expressionde nombreuses proteines, dont les enzymes de replication de l’ADN, et la cycline E.Celle-ci forme un complexe avec la CDK2, et libere a son tour E2F, creant une bouclede retroaction positive. Lorsque l’activite des cyclines est suffisante, la cellule passe lepoint de controle et rentre irreversiblement en phase S.

18 Etat de l’art et motivations
Figure 2.6: Representation schematique des interactions entre quelques agents du cyclecellulaire. Les complexes cycline/CDK permettent la progression dans le cycle. Leur activiteest regulee positivement ou negativement par differentes familles de proteines. Les CDC25(phosphatases) activent les CDK par dephosphorylation. La famille CIP/KIP inhibe les com-plexes cycline/CDK en s’y liant, et la famille INK empeche leur formation.
Cette transition G1/S peut etre influencee par des facteurs externes, comme, parexemple, la detection de dommages a l’ADN. La proteine p53 peut alors soit initierl’apoptose, soit activer les voies de reparation de l’ADN et arreter le cycle en phase G1.Pour ce faire, elle induit la synthese de la proteine p21, une CKI inhibant l’activite ducomplexe cycline E/CDK2. La cellule ne peut alors plus franchir le point de controle,et reste bloquee en phase G1.
2.2 HIF-1α : roles et regulation
2.2.1 Effets de HIF-1α a l’echelle moleculaire
Le facteur de transcription HIF-1 est un modulateur puissant de l’expression genetique.Il influe sur l’expression d’environ 1% des genes chez l’homme [2]. Premierement, HIF-1conduit un changement metabolique, en favorisant la glycolyse par rapport a la respi-ration mitochondriale. Pour ce faire, il stimule l’expression de transporteurs du glucose(Glut-1), et des enzymes du metabolisme glycolytique [24, 44]. HIF-1 inhibe egalement

2.2 HIF-1α : roles et regulation 19
Figure 2.7: Mecanisme de regulation ducycle par degradation des cyclines. Des com-plexes contenant la ligase E3 ubiquitinent lescyclines au cours du cycle, ce qui induit leurdegradation par le proteasome
Figure 2.8: Representation schematiquedes evenements moleculaires de la transitionG1/S.
l’activite mitochondriale en induisant la synthese de la Pyruvate Deshydrogenase Ki-nase 1 (PDK1) [44]. Deuxiemement, le facteur de transcription HIF-1 stimule la synthesede divers facteurs angiogeniques, tels que le VEGF [24]. Dans les cellules productricesdes globules rouge, il stimule egalement l’expression de l’EPO, ainsi que de proteinesimpliquees dans le metabolisme du fer (transferrine) [24]. Enfin, HIF-1 est impliqueedans un reseau complexe de regulation de la proliferation et de l’apoptose. Il semble eneffet que la proteine puisse etre pro-apoptotique ou anti-apoptotique, selon le type decellule et les conditions environnementales [45]. La revue de litterature presentee parSermeus et al. (2011) [46] permet de faire le point sur l’ensemble des interactions con-nues entre HIF-1 et les reseaux lies a l’apoptose. Les auteurs en dressent un bilan qu’ilsexpriment en terme de balance apoptose/survie (figure 2.9). Lorsque HIF-1 domine, lacellule tend a resister a l’apoptose, voire a proliferer. Lorsque p53 prend le dessus, elleentre en apoptose.
Moleculairement, cet equilibre est alors regule par un reseau complexe d’interac-tions, encore mal comprises, impliquant HIF-1 et les voies de l’apoptose : p53 [46],

20 Etat de l’art et motivations
Figure 2.9: Equilibre survie/apoptose en fonction de l’intensite de l’episode hypoxique. Latransition entre un phenotype survie/proliferation et un phenotype arret du cycle/apoptosedepend, selon ce modele, de l’equilibre entre p53 et HIF-1α. Tire de Sermeus et al. [46]
famille Bcl-2 [2] etc.
2.2.2 Interactions avec le cycle cellulaire
Outre l’equilibre survie/apoptose, HIF-1 influe sur l’equilibre proliferation/arretdu cycle. Comme nous l’avons note en introduction, la facteur de transcription esten effet connu pour influer positivement ou negativement sur la dynamique du cyclecellulaire. A l’echelle moleculaire, il apparaıt que HIF-1 stimule la synthese de facteursde croissance. D’autre part, la proteine interagit de maniere complexe avec les proteinesdu cycle. Elle inhibe notamment la transition G1/S, via une diminution de l’activite dela cycline E [47–49]. Il est possible que cette action sur le cycline E passe par l’activationd’inhibiteurs de cyclines, comme les proteines p21 ou p27 [3, 47, 50]. Alarcon et al.(2004) [49] ont mis au point un modele de la transition G1/S en hypoxie utilisantce dernier resultat. Les auteurs utilisent en outre ce modele afin d’expliquer l’entreeen quiescence facilitee des cellules tumorales sous hypoxie. Or, l’activation de p27 enhypoxie est controversee ; en consequence, son lien avec l’arret du cycle en phase G1
l’est tout autant [6, 51]. Ce modele de la dynamique du point de controle precedant la

2.2 HIF-1α : roles et regulation 21
phase S n’est donc pas totalement satisfaisant. En revanche, l’action inhibitrice de HIF-1α sur la cycline D est bien attestee [52, 53]. Un modele plus satisfaisant et general del’effet de HIF-1α sur le cycle cellulaire, et en particulier sur la transition G1/S devraitdonc prendre en compte cette observation experimentale.
2.2.3 Liens avec la carcinogenese
La recension des genes cibles de HIF-1α donne des indications sur le role du facteurde transcription dans la tumorigenese. Comme nous l’avons note en introduction, HIF-1α est sur-exprime dans la plupart des cancers, soit par l’effet de mutations deregulantsa degradation, soit du fait du micro-environnement tumoral. De fait, les proteinesinduites par HIF-1α sont presentes en grandes quantite dans les cellules tumorales[39]. La revue de litterature realisee par Kunz et al. (2003) [14] recense quelques ef-fets moleculaires de HIF-1α favorables a la tumorigenese. Ainsi, l’activation des voiesangiogeniques est favorable a la croissance cancereuse, puisque la neo-vascularisationpermet d’augmenter l’apport de nutriments aux cellules. D’autre part, en favorisant lepassage d’un metabolisme aerobie a un metabolisme glycolytique, HIF-1 participe a lamise en place des caracteristiques classiques des cellules tumorales. Kunz et al. (2003)[14] notent aussi l’influence possible de HIF-1 sur les liens entre les cellules et la matriceextra-cellulaire. Notamment, en diminuant l’expression de E-cadherine, HIF-1 limitela stabilite tissulaire, et favorise donc la proliferation cellulaire. Cette proliferationest aussi favorisee par l’activation de facteurs mitogenes, lies a la famille MAPK. Lasur-expression de HIF-1α dans les tumeurs favorise aussi la synthese de proteines anti-apoptotiques, comme Bcl-xL [54], ou MdM2 [55]. D’autres auteurs, comme Alarconet al. (2004) [49], ont egalement note que les cellules cancereuses semblent entrer plusfacilement en quiescence sous hypoxie que les cellules saines. Cette entree en quiescencesoustrait les cellules a l’apoptose induite par les agents chimiotherapeutiques, et limitedonc l’efficacite des therapies [56]. D’autre part, l’hypoxie intermittente est egalementconnue pour favoriser la selection de phenotypes resistants et invasifs [18, 19]. Notam-ment, la frequence des mutations cellulaires augmente avec le nombre de cycles [20].En outre, plus de 200 genes sont induits specifiquement par l’hypoxie cyclique [21].
2.2.4 Regulation de HIF-1α : aspects biologiques
Induction de HIF-1α en hypoxie
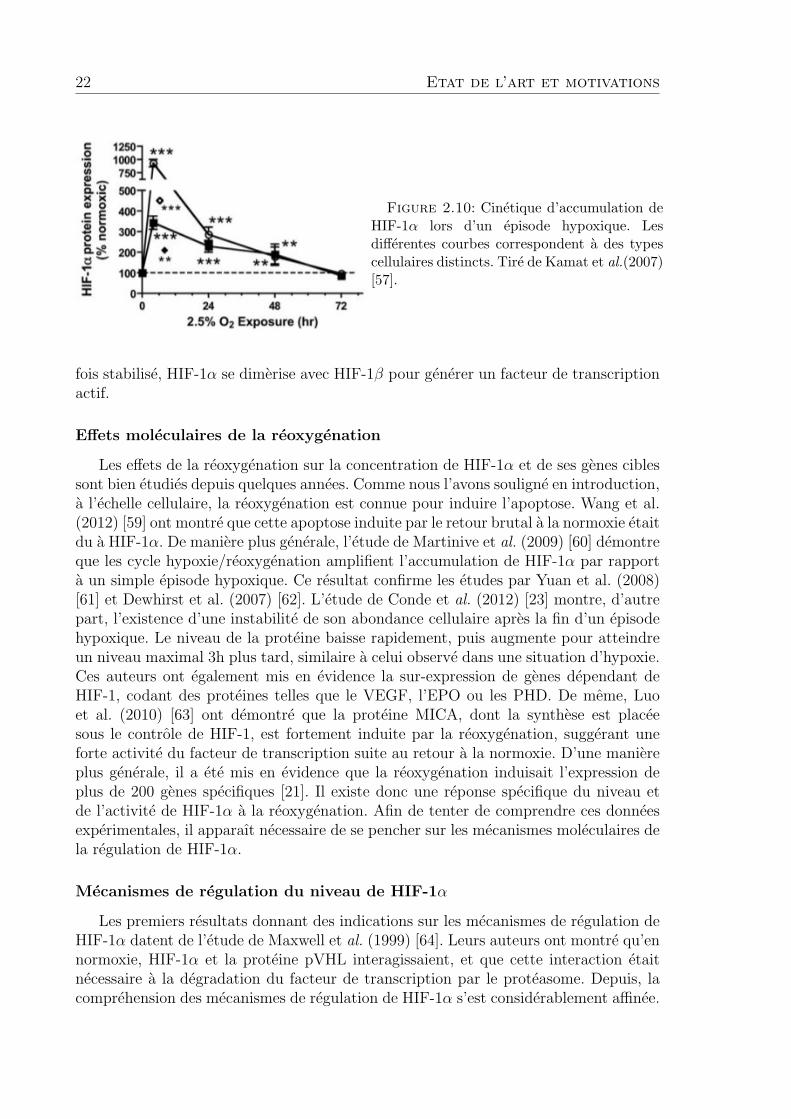
Comme nous l’avons note en introduction, HIF-1α s’accumule de maniere significa-tive dans la cellule lorsque la pression d’oxygene dans la cellule passe sous la barredes 1% [33]. La cinetique de cette induction est bien connue. Le niveau de la proteineaugmente rapidement, pour atteindre un maximum apres un laps de temps variantde 1 a 5 heures selon le tissu considere [1]. Puis, la concentration cellulaire de HIF-1αdiminue progressivement, jusqu’a rejoindre un niveau d’equilibre [57, 58]. La figure 2.10donne un exemple de mesure experimentale de l’evolution de l’abondance de HIF-1α,realisee par Kamat et al. (2007) [57]. Les auteurs suivent par western blot l’evolution del’abondance de HIF-1α dans des cellules MCF-7 soumises a un episode hypoxique. Une
22 Etat de l’art et motivations
Figure 2.10: Cinetique d’accumulation deHIF-1α lors d’un episode hypoxique. Lesdifferentes courbes correspondent a des typescellulaires distincts. Tire de Kamat et al.(2007)[57].
fois stabilise, HIF-1α se dimerise avec HIF-1β pour generer un facteur de transcriptionactif.
Effets moleculaires de la reoxygenation
Les effets de la reoxygenation sur la concentration de HIF-1α et de ses genes ciblessont bien etudies depuis quelques annees. Comme nous l’avons souligne en introduction,a l’echelle cellulaire, la reoxygenation est connue pour induire l’apoptose. Wang et al.(2012) [59] ont montre que cette apoptose induite par le retour brutal a la normoxie etaitdu a HIF-1α. De maniere plus generale, l’etude de Martinive et al. (2009) [60] demontreque les cycle hypoxie/reoxygenation amplifient l’accumulation de HIF-1α par rapporta un simple episode hypoxique. Ce resultat confirme les etudes par Yuan et al. (2008)[61] et Dewhirst et al. (2007) [62]. L’etude de Conde et al. (2012) [23] montre, d’autrepart, l’existence d’une instabilite de son abondance cellulaire apres la fin d’un episodehypoxique. Le niveau de la proteine baisse rapidement, puis augmente pour atteindreun niveau maximal 3h plus tard, similaire a celui observe dans une situation d’hypoxie.Ces auteurs ont egalement mis en evidence la sur-expression de genes dependant deHIF-1, codant des proteines telles que le VEGF, l’EPO ou les PHD. De meme, Luoet al. (2010) [63] ont demontre que la proteine MICA, dont la synthese est placeesous le controle de HIF-1, est fortement induite par la reoxygenation, suggerant uneforte activite du facteur de transcription suite au retour a la normoxie. D’une maniereplus generale, il a ete mis en evidence que la reoxygenation induisait l’expression deplus de 200 genes specifiques [21]. Il existe donc une reponse specifique du niveau etde l’activite de HIF-1α a la reoxygenation. Afin de tenter de comprendre ces donneesexperimentales, il apparaıt necessaire de se pencher sur les mecanismes moleculaires dela regulation de HIF-1α.
Mecanismes de regulation du niveau de HIF-1α
Les premiers resultats donnant des indications sur les mecanismes de regulation deHIF-1α datent de l’etude de Maxwell et al. (1999) [64]. Leurs auteurs ont montre qu’ennormoxie, HIF-1α et la proteine pVHL interagissaient, et que cette interaction etaitnecessaire a la degradation du facteur de transcription par le proteasome. Depuis, lacomprehension des mecanismes de regulation de HIF-1α s’est considerablement affinee.

2.2 HIF-1α : roles et regulation 23
Cavadas et al. (2013) [34] ont recemment dresse un bilan des connaissances sur le reseaumoleculaire en jeu. La figure 2.11 en donne une premiere vue simplifiee. La base dela regulation repose sur l’activite d’enzymes, les PHDs (Prolyl-Hydroxylase Domain).Celles-ci sont activees en presence d’oxygene ; elles hydroxylent alors la proteine HIF-1α. Cette modification chimique conduit a la formation d’un complexe avec pVHL,ce qui mene a son ubiquitination et a sa degradation par le proteasome. En hypoxie,l’action des PHDs est reduite, et HIF-1α s’accumule dans la cellule. La proteine peutalors s’associer a l’unite β, synthetisee de maniere constitutive, pour former le facteurde transcription HIF-1. En outre, il a ete montre que l’hydroxylation de HIF-1α parune autre d’enzyme (FIH : Factor Inhibiting HIF-1) limitait sa liaison au complexep300/CSB, ce qui inhibe son activite genetique. La figure 2.12 donne un apercu plusprecis des reactions biochimiques en jeu. Elle met ainsi en evidence l’existence denombreuses retroactions. Notamment, les genes codant pour les PHDs sont porteursd’un HRE (HIF-1 Responsive Element). En consequence, leur expression est stimuleepar HIF-1, ce qui conduit a une retroaction negative sur le facteur de transcription. Ceschema presente egalement le merite de spatialiser la dynamique de la regulation. Celle-ci affiche en effet une compartimentation noyau/cytoplasme. HIF-1 peut etre degradeedans les deux espaces [65], et transiter de l’un a l’autre [66].
Notons qu’outre cette regulation du niveau de HIF-1α, l’action du facteur de tran-scription HIF-1 peut egalement etre modulee en jouant sur la liaison des sous-unitesα et β [67], ou sur l’intervention de proteines necessaires a son activite genetique[34]. D’autre part, HIF-1α n’est pas la seule proteine capable de s’associer a HIF-1β.Des proteines de sequence proches, HIF-2α et HIF-3α jouent egalement un role dans lareponse cellulaire a l’hypoxie [24, 29]. Cependant, dans cette these, nous negligerons cesaspects, et nous concentrerons principalement sur la question du niveau intra-cellulairede HIF-1α.
Figure 2.11: Representation schematique de la regulation de HIF-1α en normoxie (A) eten hypoxie (B). Tire de Cavadas et al. (2013) [34]
2.2.5 Regulation de HIF-1α : modeles mathematiques
Plusieurs modeles mathematiques decrivant la regulation moleculaire de la con-centration et de l’activite de HIF-1α ont ete proposes. Ils cherchent a expliquer lesprincipales caracteristiques de l’accumulation de la proteine dans des conditions d’hy-poxie [34]. Les premiers travaux en ce sens ont ete realises par Kohn et al. (2004) [68].

24 Etat de l’art et motivations
Figure 2.12: Biochimie de la regulation de HIF-1α. Tire de N’Guyen et al. (2013) [67]
Ils se centrent, dans la plupart des cas, sur l’action oxygene-dependante des PHDs.Differentes boucles de retroactions sont prises en compte dans ces travaux : synthese dePHD sous controle de HIF-1 [68], inhibition des PHDs par le succinate [69]. Le modelede N’Guyen et al. (2013) inclut en outre l’influence de l’enzyme FIH sur l’activite tran-scriptionnelle de HIF-1 [67]. De maniere generale, toutes ces demarches considerentun grand nombre d’acteurs biomoleculaires pour obtenir des resultats biologiquementpertinents. L’identification des interactions moleculaires cruciales pour expliquer lesobservations experimentales reste delicate. De fait, certains auteurs, comme Heiner etal. (2010) ont realise une analyse structurelle, dans le but d’identifier les interactionsresponsables du comportement de type interrupteur (switch-like) et d’extraire ainsi lecœur du reseau moleculaire de regulation de HIF-1α. Un des enjeux de la modelisationmathematique de la regulation de HIF-1α est donc de mettre en œuvre une approche ala fois simple et satisfaisante du point de vue biologique. Un tel modele devra en outreprendre en compte la compartimentation noyau/cytoplasme de la degradation de HIF-1α. Des etudes recentes, telle que celle menee par Moroz et al. (2009) [58] soulignenten effet l’importance de cette dynamique spatiale dans la regulation de la proteine.
2.3 Les molecules inductrices de HIF-1α
Plusieurs molecules sont couramment utilisees pour mimer l’hypoxie en induisantl’accumulation de HIF-1α. Parmi elles, on trouve le chlorure de coblat (CoCl2) ou la

2.4 Les cellules FUCCI : un outil pour explorer la dynamique du
cycle cellulaire 25
desferrioxamine (DFO). Ces molecules sont largement utilisees pour les perturbationsqu’elles induisent dans l’activite des proteines dependantes du fer. Le Co remplacele fer dans son site de fixation, et le DFO est un chelateur du fer. Dans les deuxcas, la degradation de HIF-1α est inhibee. En effet, l’hydroxylation de HIF-1α se faiten presence de fer. Si ce dernier n’est pas disponible, HIF-1α n’est pas ubiquiniteeet s’accumule dans la cellule. Ces molecules sont egalement utilisees pour leurs effetsanti-cancer, notamment via les blocages du cycle qu’elles induisent [70, 71]. D’unemaniere generale, si ces agents chimiques provoquent effectivement une augmentationdu niveau d’expression intra-cellulaire de HIF-1α, ils ont egalement de nombreux autreseffets [72]. Notamment, ils sont connus pour induire l’apoptose [73] et l’arret du cyclecellulaire via des interactions complexes avec ses proteines regulatrices [71].CoCl2 et DFO sont certainement les molecules les plus utilisees pour simuler l’hy-poxie [74]. En consequence, leur effets biologiques sont relativement bien etudies. Ellespromeuvent toutes les deux l’apoptose quand leur concentration est suffisamment haute[73, 75, 76]. Cependant, CoCl2 semble induire une augmentation de la viabilite pendantles premieres 6 a 8 heures de traitement [45, 77]. La proliferation cellulaire en presencede ces agents a ete testee en utilisant differentes lignees. Dai et al. (2012) [75] ontmontre qu’en presence de CoCl2, la croissance des populations de cellules PC-2 etaitstimulee pendant 72h. Puis, une inhibition dependante de la dose se manifeste, accom-pagnee d’une augmentation de la mort cellulaire. D’une maniere plus generale, CoCl2 etDFO sont connues pour inhiber la proliferation [74]. Cependant, leur influence precisesur le cycle cellulaire apparaıt comme tres variable. En presence de CoCl2, plusieursetudes reportent un arret en phase G1 [74, 78], ou en phase G2 [79]. Dans le cas deDFO, un grand nombre d’etudes concluent a un blocage en phase G1 ou en phase S,selon la dose et le type cellulaire utilise [74, 80–82]. Un article recent par Siriwardanaet al. (2013) [83] a pu precisement differencier un arret en G1 et un arret en S. Enoutre, certains auteurs ont note l’existence d’un arret du cycle en phase G2 [71, 84].Clairement, les effets de DFO et de CoCl2 sur le cycle dependent donc etroitement dela concentration en agent chimique, du temps d’exposition, et de la lignee cellulaireutilisee. L’etude de leurs effets sur le cycle est loin d’etre parfaitement comprise ; or, lesproprietes anti-cancer de ces molecules rendent cette comprehension necessaire pour lamise au point de therapies novatrices.
2.4 Les cellules FUCCI : un outil pour explorer la
dynamique du cycle cellulaire
2.4.1 Les outils d’etude du cycle
Une des techniques les plus classiques d’analyse du cycle cellulaire est offerte par lacytometrie en flux. Cette methode permet d’etudier plusieurs caracteristiques physiquesde cellules isolees entraınees par un flux liquide : taille, granularite, fluorescence. L’utili-sation de la cytometrie pour la quantification de la dynamique de proliferation passe parun marquage des cellules permettant de differentier les phases du cycle. Une techniquecouramment utilisee est le marquage de l’ADN par une molecule se liant specifiquement

26 Etat de l’art et motivations
a la double helice (DAPI, Hoechst, Brdu...). La mesure du niveau de fluorescence per-met alors de determiner la phase du cycle dans laquelle se trouve chaque cellule. EnG0 et G1, on en a une quantite q ; en G2, 2q, et en S, entre q et 2q. En appliquant ceprincipe a une grande population de cellules, on peut arriver a determiner la proportionde cellules dans les differentes phases du cycle.
Il est egalement possible d’analyser la dynamique de proliferation en imagerie bi-ologique, par marquage de proteines caracteristiques d’une phase donnee. Par exem-ple, un marquage dirige contre des cyclines permet de visualiser la progression ducycle cellule a cellule. A l’echelle d’une population, la suivie par western blot du con-tenu proteique (cycline, cdk...) permet d’obtenir des informations sur des modificationsglobales du cycle cellulaire. Cependant, aucune de ces techniques n’offre la possibilited’une quantification precise de la dynamique de proliferation in vivo ou sur des cellulesproliferantes.
2.4.2 Les cellules FUCCI : bases biologiques
Les cellules FUCCI (Fluorescent Ubiquitination-Based Cell Cycle Indicator) con-stituent une lignee cellulaire recemment creee a partir de cellules HeLa [85]. Ce systemetire partie d’un couple de proteines oscillantes, la cdt1 et la geminine, couplees a desfluorophores (Kusabira Orange et Vert Azami). La figure 2.13 montre le reseau deregulation simplifie des proteines cdt1 et geminin. L’inhibition du complexe SCF enphase G1 conduit a l’accumulation de cdt1. Puis, en phase S et G2, celle-ci est progres-sivement degradee, et l’inhibition du complexe APC induit l’accumulation de geminine.
Figure 2.13: Schema de regulation des proteines cdt1 et geminine au cours du cycle. Tirede Sakaue-Sawano et al. (2008) [85]
Ces deux proteines sont donc de bon marqueurs oscillants permettant de discriminerles differentes phases du cycle. Une construction genetique, presentee sur la figure 2.14permet alors de coupler la cdt1 avec le Kusabira Orange, fluorescent dans le rouge, etla geminine avec le Vert Azami, fluorescent dans le vert.
De ce fait, le cycle peut etre suivi par la mesure de la fluorescence des noyauxcellulaires. La figure 2.15 illustre l’evolution parallele des niveaux proteiques et de lafluorescence nucleaire au cours de la progression dans le cycle.

2.4 Les cellules FUCCI : un outil pour explorer la dynamique du
cycle cellulaire 27
Figure 2.14: Construction genetique couplant la cdt1 et la geminine au Kusabira Orangeet au Vert Azami.
Figure 2.15: Evolution parallele des niveaux proteiques (cdt1 et geminine) et de la fluo-rescence nucleaire au cours du cycle cellulaire.Tire de [86]
La figure 2.16 offre une autre representation du lien entre la fluorescence et le cyclecellulaire : chaque phase est caracterisee par une emission particuliere dans deux canaux(rouge et vert). Ainsi, la mesure de la fluorescence de chaque cellule doit permettred’analyser la progression dans le cycle.
La figure 2.17 montre l’image en microscopie de fluorescence de deux champs d’uneculture de cellules HeLa-FUCCI. Elle a ete acquise suivant le protocole d’imageriedecrit dans l’annexe A. On distingue clairement les phases G1, S, G2 et M. On noteaussi la presence de cellules non-fluorescentes, qui sont en debut de phase G1, ou noncyclantes. On les nomme, par commodite, G0. Le systeme FUCCI permet donc dequantifier precisement l’avancee dans la phase G1, ce que ne permettent pas de faireles methodes de cytometrie en flux, comme le rappellent Carlier et al. (2014) [87].
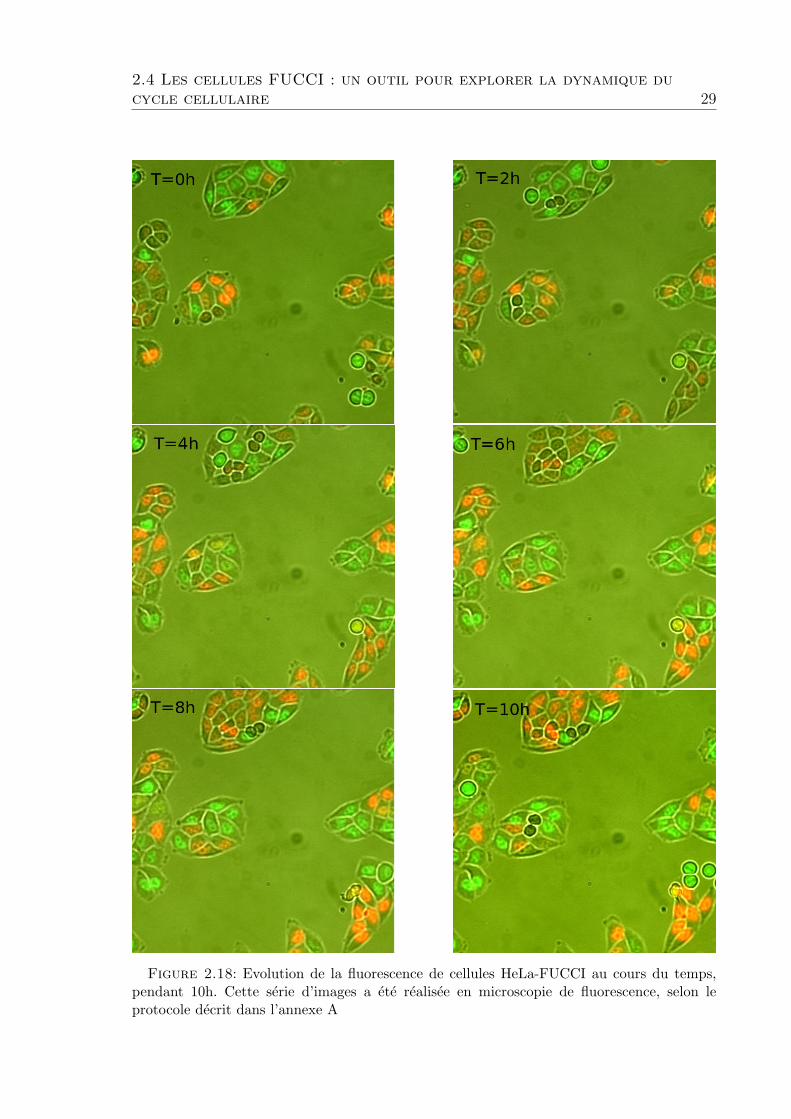
Une autre specificite des cellules HeLa-FUCCI est la possibilite d’imager la progres-sion du cycle dans le temps. La figure 2.11 donne a voir l’evolution de la fluorescencedans le temps pour un champs donne. On y observe nettement plusieurs transitions

28 Etat de l’art et motivations
Figure 2.16: Fluorescence nucleaire descellules FUCCI et progression dans le cycle.Tire de [85]
Figure 2.17: Imagerie de cellules HeLa-FUCCI proliferantes realisee en microscopie defluorescence. La mesure de la fluorescence rouge (Texas Red) et verte (Alexa-Fluor 488)permet de differentier les phases du cycle cellulaire
G1/S, S/G2, G2/M et M/G1.
2.4.3 Utilisation des cellules FUCCI
Bien qu’encore peu repandues, les cellules HeLa-FUCCI ont ete utilisees ces dernieresannees dans differentes etudes. Kaida et al. (2011) [88] s’appuient sur cette lignee cel-lulaire pour demontrer l’effet de drogues anti-tumorales sur le cycle cellulaire. Elles ontegalement ete utilisees en biologie cellulaire, dans le cadre d’une etude sur la cycline Imenee par Nagano et al. (2013) [89]. Le systeme FUCCI a egalement ete transpose sur
2.4 Les cellules FUCCI : un outil pour explorer la dynamique du
cycle cellulaire 29
Figure 2.18: Evolution de la fluorescence de cellules HeLa-FUCCI au cours du temps,pendant 10h. Cette serie d’images a ete realisee en microscopie de fluorescence, selon leprotocole decrit dans l’annexe A

30 Etat de l’art et motivations
d’autres types de cellules. Carlier et al. (2014) [87] l’a ainsi mis en place sur des cellulespancreatiques β. Zieke et al. (2014) [90] l’ont integre a differentes lignees cellulaires dedrosophiles. Enfin, les cellules FUCCI sont prometteuses en tant qu’outil de quantifica-tion in vivo de la proliferation. Ainsi, Sugiyama et al. (2009) [91] ont pu mettre en placeune lignee de zebrafishs porteurs du systeme FUCCI. Cela leur a permis d’analyser ladynamique de proliferation lors du developpement embryonnaire.
2.5 Demarche de la these
Cette these se propose d’apporter quelques contributions a l’etude de la reponsecellulaire a l’hypoxie, en utilisant des outils de modelisation mathematique et les po-tentialites experimentales offertes par les cellules FUCCI. Dans un premiers temps, nousnous attacherons a etablir un modele de la transition G1/S sous hypoxie. L’article quenous avons publie dans Mathematical Biosciences [92] servira de base a la presentationde ce travail. L’idee generale ayant guide notre demarche repose sur une ameliorationdu modele propose par Alarcon et al. (2004) [49]. Nous avons notamment cherche aetablir une description biologiquement plus adequate des evenements moleculaires al’œuvre. En effet, comme nous l’avons vu, le travail d’Alarcon et al. presente plusieursdefauts conceptuels qui affectent son niveau de generalite et sa pertinence explicative,notamment concernant les specificites des cellules tumorales face au stress hypoxique.Nous montrerons notamment comment l’inhibition de la cycline D par HIF-1α permetde proposer un mecanisme pour le blocage du cycle d’une part, mais egalement pourl’emergence de resistances induites par l’hypoxie dans les cellules tumorales.
Dans un second temps, nous aborderons la question sous un angle experimental. Lebut sera alors de tester l’utilite des cellules FUCCI dans l’etude de la reponse cellulaire al’hypoxie. Apres avoir montre que la sensibilite des fluorophores a la pression d’oxygenerendait delicate l’analyse de la dynamique du cycle, nous avons choisi d’etudier l’effetde molecules chelatrices du fer, couramment utilisees comme inductrices de HIF-1α,et donc comme molecules mimant l’hypoxie. Les resultats obtenus seront presentes ausein de l’article publie dans Journal of Cell Biology and Cell Metabolism [93]. Nousmettons notamment en evidence des effets originaux de CoCl2 et DFO sur le cyclecellulaire des cellules HeLa-FUCCI. D’autre part, si l’etude de l’influence de l’hypoxiesur la dynamique de proliferation est delicate a mener, il est tout a fait possible d’anal-yser les effets de la reoxygenation. Le suivi de la fluorescence des cellules FUCCI apresun cycle hypoxie/normoxie nous a permis de mettre en evidence un ralentissement dela phase S. Ce resultat eclaire les donnees de la litterature decrivant l’activation desvoies de reparation de l’ADN lors d’un retour a la normoxie. Enfin, une revelation im-munocytochimique de HIF-1α, induite par DFO, a donne a voir une grande variabilitede la distribution intra-cellulaire du facteur de transcription. Or, comme nous l’avonsnote precedemment, la compartimentation nucleo-cytoplasmique de HIF-1α joue unrole important dans sa regulation.
Cette derniere observation experimentale, ainsi que celles obtenues en conditionsde reoxygenation, nous a donc conduit a nous interesser, dans un troisieme temps, auxmecanismes de la regulation moleculaire de HIF-1α. Cette derniere partie de la these

2.5 Demarche de la these 31
s’organise autour d’un article que nous avons publie dans Plos One [94] Nous avonscherche a etablir un modele decrivant les aspects moleculaires du controle du niveauintra-cellulaire de HIF-1α. Comme nous l’avons vu, les modeles existants utilisent ungrand nombre d’acteurs moleculaires et de retroactions pour parvenir a decrire les prin-cipales caracteristiques de la reponse moleculaire a l’hypoxie. Notre travail s’est placedans une optique de minimisation des interactions, et dans un contexte de comparti-mentation de HIF-1α. Notre modele est ainsi centre sur deux acteurs principaux (pVHLet HIF-1α), avec une boucle de retroaction (synthese de pVHL sous le controle deHIF-1α). Ces deux molecules sont prises dans une navette nucleo-cytoplasmique. Nousmontrons que cette description relativement simple explique les donnees experimentalesclassiques concernant l’induction et la degradation de HIF-1α. D’autre part, nous avonspu simuler les effets de la reoxygenation, ce qui nous a permis de caracteriser uneinstabilite de l’activite de HIF-1α interessante au regard des donnees experimentalesrecentes. Enfin, nous avons complete cette troisieme partie par une etude experimentalede la compartimentation de HIF-1α. Comme le systeme FUCCI offre la possibilited’etudier la dynamique du cycle cellule a cellule, en condition de proliferation, nousavons pu coupler les donnees de fluorescence (rouge et verte) a un marquage immuno-cytochimique dirige contre HIF-1α (revelation a la peroxydase). Par ce protocole, ila ete possible d’obtenir, sur un grand nombre de cellules, a la fois les informationsconcernant le cycle cellulaire et la localisation nucleaire ou cytoplasmique du facteurde transcription. Nous avons ainsi pu rechercher une eventuelle correlation entre cesdeux variables. Il est apparu que la localisation de HIF-1α n’etait que tres faiblementcorrelee a la progression dans le cycle. Elle est donc certainement liee a une variabiliteinter-cellulaire non connue a ce jour.

32 Etat de l’art et motivations
3Hypoxie et cycle cellulaire : approche
mathematique
3.1 Introduction
3.1.1 Modelisation du cycle cellulaire
Nous avons rappele, dans l’introduction, quelques donnees de base concernant laconnaissance de la regulation moleculaire du cycle cellulaire. Le nombre important d’ac-teurs engages dans ce reseau, et les relations complexes de retroactions qui les lient enfont un domaine de choix pour les approches mathematiques. De fait, la modelisationdu cycle cellulaire est un domaine phare de la biologie computationnelle depuis lesannees 1990. L’elucidation des voies de signalisation moleculaires controlant la dy-namique de la proliferation ont servi de base a la formulation de nombreux modelesmathematiques. Comme note dans la revue de Csikasz-Nagy (2009) [95], ces modelestentent de reconstituer l’evolution temporelle du niveau intracellulaire des proteinesdu cycle. Pour ce faire, ils utilisent une serie plus ou moins exhaustive d’EquationsDifferentielles Ordinaires decrivant les relations d’activation/inhibition tissees entre lesdifferents acteurs du cycle : cyclines, CDCs, CDKs. L’accent est notamment mis surla modelisation des transitions irreversibles, telles que la transition entre les phasesG1 et S du cycle. Les travaux de Novak et Tyson font reference sur ce point [96, 97].La transition G1/S y est traitee comme un changement brutal (switch) des niveauxd’expression d’une cycline et de son inhibiteur : la premiere depasse un certain seuil etla seconde passe en dessous d’une concentration critique. La phase G1 s’acheve lorsquecet interrupteur moleculaire se declenche. Notons ici que dans un souci d’allegementdu texte, “cycline” refere en realite au complexe cycline/cdk, qui seul possede l’activiteenzymatique.
Dans ce cadre, le cœur du cycle cellulaire est alors mu par un mecanisme de “switch”
33

34 Hypoxie et cycle cellulaire : approche mathematique
moleculaire autorisant le passage d’une phase a la suivante [98]. En guise d’illustration,la description mathematique de la transition G1/S que l’on trouve dans les travaux deTyson et Novak peut se mettre sous la forme simplifiee suivante (voir Alarcon et al(2004) [49]) . Si x est le niveau d’expression de l’inhibiteur de cycline Cdh1/APC, ycelle d’une cycline (E ou A), et m la masse de la cellule, on a :
dx
dt=
(k3 + k4A)(1− x)
J3 + 1− x−
k5myx
J4 + x(3.1)
dy
dt= k1 − (k2 + k6x)y (3.2)
dm
dt= µm(1−
m
m0
) (3.3)
Les ki quantifient des vitesses de reaction chimique, les Ji sont des constantes en-zymatiques de type Michaelis-Menten, et A un activateur generique. m est la masse dela cellule, et m0 sa masse a la fin du cycle. Dans ce cadre, le gain de masse active laprogression du cycle. Le modele complet de la transition G1/S developpe par Tyson etNovak [96] prend en compte d’autres activateurs de la synthese des cyclines, tels quele facteur de transcription E2F, active par la cycline D. Durant la progression dans laphase G1, x diminue et y augmente. Lorsque ces deux variables atteignent des valeurscritiques, le “switch” moleculaire se manifeste par un changement brutal dans les con-centrations proteiques, comme schematise sur la figure 3.2. Cet evenement permet lepassage de la transition G1/S.
3.1.2 Hypoxie et cycle cellulaire
L’integration des facteurs environnementaux influencant la proliferation cellulaireest l’un des defis actuels de la modelisation mathematique du cycle cellulaire [95].Cependant, peu prennent en compte les parametres externes, tels que la temperature,les proprietes mecaniques du substrat, ou encore l’hypoxie. Or, comme nous l’avons vuen introduction, ce dernier facteur est crucial dans diverses conditions pathologiques.Notamment, les cellules tumorales sont soumises a une hypoxie chronique [14, 99]. Cettehypoxie induit des phenotypes plus agressifs, metastatiques et resistants [13, 54]. Enparticulier, si l’hypoxie tend a entraıner l’apoptose dans les cellules proliferantes saines,les cellules tumorales resistent a l’apoptose [13]. L’un des mecanismes pouvant expliquerce phenomene est l’entree dans un etat quiescent, au sein duquel la cellule interromptsystematiquement son cycle de division [56, 100]. Cet etat quiescent permet egalementa la cellule cancereuse d’echapper aux effets de la chimiotherapie [56, 101, 102].
Afin d’apprehender le role de l’hypoxie dans la tumorigenese, il est necessaire decomprendre les connexions existant entre les voies de signalisation activees par lemanque d’oxygene, et les reseaux moleculaires regulant le cycle cellulaire. Notamment,quels sont les mecanismes responsables du ralentissement ou de l’arret complet dela dynamique de proliferation ? Comment expliquer les differences observees dans les

3.1 Introduction 35
Figure 3.1: Representation schematique du modele proposepar Alarcon et al. (2004) pour la regulation de la transition G1/Sen conditions hypoxiques. Extrait de Alarcon et al. (2004), [49].
reponses a l’hypoxie entre les cellules saines et tumorales ? Plusieurs pistes ont ete en-visagees. Certaines impliquent la voie p53 [46], ou divers inhibiteurs de kinases [51]. Ila egalement ete propose que l’hypoxie agisse via la proteine p27 [3]. Cette hypothesea servi de base au modele bati par Alarcon et al. (2004) [49].
3.1.3 Le modele d’Alarcon
Alarcon et al. (2004) [49] ont propose un modele simple expliquant pourquoi lescellules cancereuses peuvent entrer en quiescence en conditions hypoxiques, alors queles cellules saines poursuivent leur cycle. Ce modele est presente dans la figure 3.1. Selonleur description, l’hypoxie agit en augmentant l‘’abondance de la proteine p27. Cettederniere est un agent inhibiteur du cycle cellulaire : elle empeche la phosphorylation dela proteine Rb par le complexe cyclineE/cdk. Cette phosphorylation est necessaire a laliberation du facteur de transcription E2F, qui retroagit positivement sur la synthese dela cycline E. Le modele simplifie propose par Alarcon et al ne prend pas explicitementen compte cette etape, et ne considere que 4 agents : p27, une cycline, Rb (sous formephosphorylee ou non phosphorylee), et un inhibiteur de la cycline (APC/cdh1). Cedernier diminue le niveau de cycline/cdk actif, qui inhibe sa synthese en retour. Laphosphorylation de Rb est activee par la cycline/cdk, dont la vitesse de synthese estaugmentee par le Rb phosphoryle. Les equations donnees par Alarcon et al. dans lecas d’une cellule saine s’ecrivent de la maniere suivante (voir [49]), avec y le niveaud’expression de la cycline, x d’APC/cdh1, u de Rb non-phosphoryle, z de proteine p27et m la masse de la cellule :
dx
dt=
(1 + b3u)(1− x)
J3 + 1− x−
b4myx
J4 + x(3.4)
dy
dt= a4 − (a1 + a2x+ a3z)y (3.5)
dm
dt= µm(1−
m
m0
) (3.6)
dz
dt= c1(1−
m
m0
)− c2P
B + Pz (3.7)
36 Hypoxie et cycle cellulaire : approche mathematique
du
dt= d1 − (d2 + d1y)u (3.8)
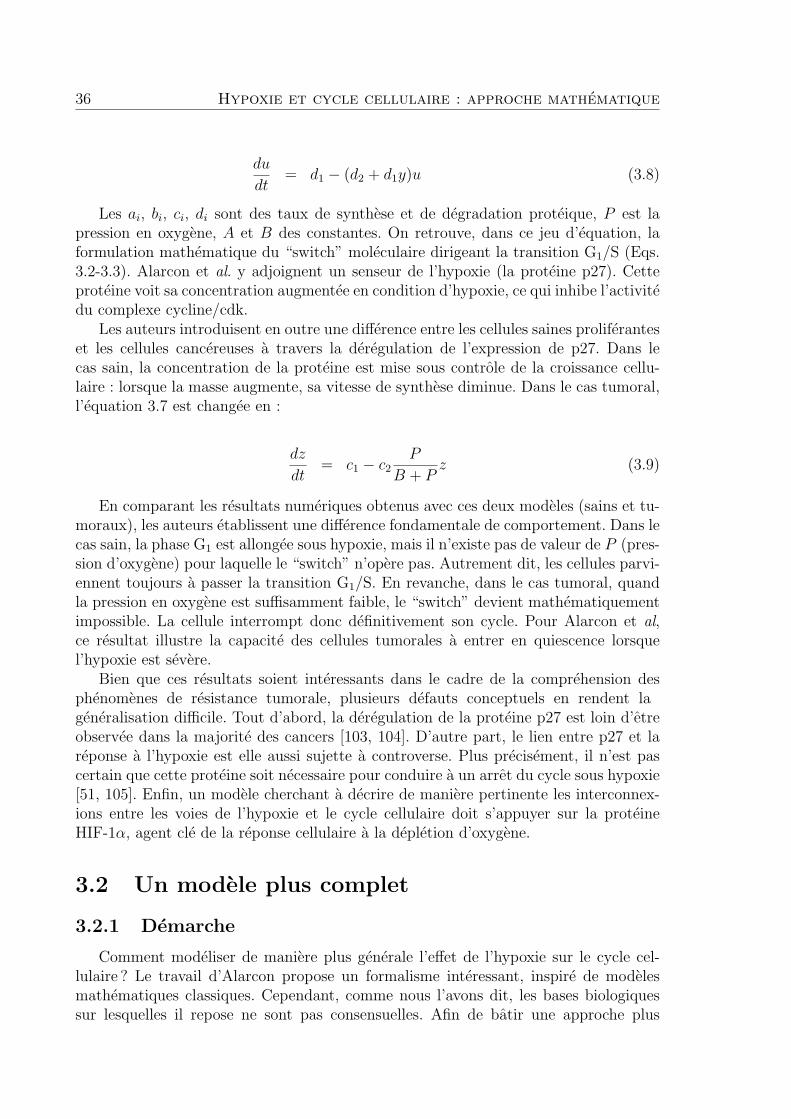
Les ai, bi, ci, di sont des taux de synthese et de degradation proteique, P est lapression en oxygene, A et B des constantes. On retrouve, dans ce jeu d’equation, laformulation mathematique du “switch” moleculaire dirigeant la transition G1/S (Eqs.3.2-3.3). Alarcon et al. y adjoignent un senseur de l’hypoxie (la proteine p27). Cetteproteine voit sa concentration augmentee en condition d’hypoxie, ce qui inhibe l’activitedu complexe cycline/cdk.
Les auteurs introduisent en outre une difference entre les cellules saines proliferanteset les cellules cancereuses a travers la deregulation de l’expression de p27. Dans lecas sain, la concentration de la proteine est mise sous controle de la croissance cellu-laire : lorsque la masse augmente, sa vitesse de synthese diminue. Dans le cas tumoral,l’equation 3.7 est changee en :
dz
dt= c1 − c2
P
B + Pz (3.9)
En comparant les resultats numeriques obtenus avec ces deux modeles (sains et tu-moraux), les auteurs etablissent une difference fondamentale de comportement. Dans lecas sain, la phase G1 est allongee sous hypoxie, mais il n’existe pas de valeur de P (pres-sion d’oxygene) pour laquelle le “switch” n’opere pas. Autrement dit, les cellules parvi-ennent toujours a passer la transition G1/S. En revanche, dans le cas tumoral, quandla pression en oxygene est suffisamment faible, le “switch” devient mathematiquementimpossible. La cellule interrompt donc definitivement son cycle. Pour Alarcon et al,ce resultat illustre la capacite des cellules tumorales a entrer en quiescence lorsquel’hypoxie est severe.
Bien que ces resultats soient interessants dans le cadre de la comprehension desphenomenes de resistance tumorale, plusieurs defauts conceptuels en rendent lageneralisation difficile. Tout d’abord, la deregulation de la proteine p27 est loin d’etreobservee dans la majorite des cancers [103, 104]. D’autre part, le lien entre p27 et lareponse a l’hypoxie est elle aussi sujette a controverse. Plus precisement, il n’est pascertain que cette proteine soit necessaire pour conduire a un arret du cycle sous hypoxie[51, 105]. Enfin, un modele cherchant a decrire de maniere pertinente les interconnex-ions entre les voies de l’hypoxie et le cycle cellulaire doit s’appuyer sur la proteineHIF-1α, agent cle de la reponse cellulaire a la depletion d’oxygene.
3.2 Un modele plus complet
3.2.1 Demarche
Comment modeliser de maniere plus generale l’effet de l’hypoxie sur le cycle cel-lulaire ? Le travail d’Alarcon propose un formalisme interessant, inspire de modelesmathematiques classiques. Cependant, comme nous l’avons dit, les bases biologiquessur lesquelles il repose ne sont pas consensuelles. Afin de batir une approche plus

3.2 Un modele plus complet 37
satisfaisante, il nous a semble pertinent d’introduire explicitement le facteur de tran-scription HIF-1α, molecule cle de la reponse cellulaire a l’hypoxie. La seconde etapeest, tout naturellement, d’exploiter les donnees experimentales disponibles decrivantses interactions avec les proteines du cycle cellulaire. L’un des effets moleculaires deHIF-1α ayant ete reporte concerne la synthese de cycline D. Notamment, Wen et al.(2010) ont observe, apres 24h a 0,2% d’oxygene, une baisse de 50% du niveau moyende cycline D dans la population cellulaire etudiee. En inactivant HIF-1α, ils ont puretablir le niveau d’expression normoxique de cycline D. Des preuves indirectes decette relation d’inhibition ont ete egalement mises a jour. Goda et al. (2003) [48, 50]ont ainsi mis en evidence une diminution de la phosphorylation de la proteine Rb. Or,cette etape est necessaire a la liberation du facteur de transcription E2F, ce dernieractivant la synthese de cycline E. Ce resultat est donc coherent avec les nombreusesobservations faisant etat d’une inhibition hypoxie-dependante de la cycline E [47–49].L’hypothese d’une regulation negative de la cycline D par HIF-1α est donc conforteepar des arguments convaincants. En consequence, nous avons choisi de centrer notremodele sur cette interaction biochimique. La description des effets biologiques de lacycline D est empruntee aux modeles classiques du cycle cellulaire, et notamment auxtravaux de Tyson et Novak [97] : phosphorylation de Rb et liberation de E2F, quistimule la synthese de cycline E. Celle-ci est alors consideree comme equivalente a lacycline generique du modele d’Alarcon : c’est l’evolution de sa concentration qui dirigel’entree en phase S. Le niveau de HIF-1α est regule par la pression en oxygene selon laloi mise en evidence experimentalement par Jiang et al. (1996) [33] : sa concentrationdecroit exponentiellement lorsque le taux d’oxygene se rapproche de la normoxie. Lebut de ce travail est d’utiliser ces principes simples afin de proposer un mecanismed’entree en quiescence en conditions hypoxiques. Plus precisement, a la suite du travaild’Alarcon, il s’agit de mettre en place un modele plus general permettant d’expliquerun des liens existant entre hypoxie et chimioresistance dependante de HIF-1α. Notredemarche est presentee en detail dans l’article ci-apres, publie en 2014 dans Mathemat-ical Biologsciences.
3.2.2 Article : Bedessem B. and Stephanou A., A mathemat-
ical model of HIF-1-mediated response to hypoxia onthe G1/S transition, Mathematical Biosciences, 2014,248 :31-9
Resume
L’hypoxie est connue pour influencer le cycle cellulaire en augmentant la duree dela phase G1, ou en induisant un etat quiescent (arret de la proliferation cellulaire).L’entree en quiescence permet a la cellule d’echapper a l’apoptose. Il a ete suggere quecertaines cellules tumorales aient acquis l’avantage sur les cellules saines d’entrer plusfacilement en quiescence quand les conditions environnementales, telles que la pressiond’oxygene, ne sont pas favorables [49, 100]. Cette capacite contribue a l’apparition dephenotypes hautement resistants et aggressifs [56].

38 Hypoxie et cycle cellulaire : approche mathematique
Le facteur HIF-1α est un acteur cle de la reponse cellulaire a l’hypoxie. Comme lescellules tumorales sont soumises a des conditions d’hypoxie chronique, la proteine estpresente en plus grande concentration dans les cellules tumorales que dans les cellulessaines. En outre, il a ete montre que l’existence de mutations genetiques stabilisantHIF-1α est caracteristique de plusieurs types de cancer [106]. Finalement, il a etesuggere que le niveau intracellulaire de HIF-1α puisse etre relie a l’agressivite destumeurs [35, 107–109]. Or, jusqu’a aujourd’hui, les modeles mathematiques decrivantla transition G1/S sous hypoxie ne le prennent pas en compte.
En consequence, nous proposons un modele mathematique de la transition G1/S enhypoxie, qui integre explicitement la voie HIF-1α. Ce modele reproduit le ralentisse-ment de la phase G1 en hypoxie moderee, et l’entree en quiescence en cas d’hypoxiesevere. Nous montrons egalement que l’inhibition de l’expression de la cycline D parHIF-1α peut induire la quiescence. Ce resultat offre une explication theorique aux ob-servations experimentales de Wen et al. (2010) [52]. Ainsi, notre modele confirme quela chimioresistance peut etre liee, pour une part, a la regulation negative de la cyclineD par HIF-1α.
Abstract
Hypoxia is known to influence the cell cycle by increasing the G1 phase duration orby inducing a quiescent state (arrest of cell proliferation). This entry into quiescence isa mean for the cell to escape from hypoxia-induced apoptosis. It is suggested that somecancer cells have gain the advantage over normal cells to easily enter into quiescencewhen environmental conditions, such as oxygen pressure, are unfavorable [49, 100].This ability contributes in the appearance of highly resistant and aggressive tumorphenotypes [56].
The HIF-1α factor is the key actor of the intracellular hypoxia pathway. As tumorcells undergo chronic hypoxic conditions, HIF-1α is present in higher level in cancerthan in normal cells. Besides, it was shown that genetic mutations promoting over-stabilization of HIF-1α are a feature of various types of cancers [106]. Finally, it issuggested that the intracellular level of HIF-1α can be related to the aggressivenessof the tumors [35, 107–109]. However, up to now, mathematical models describing theG1/S transition under hypoxia, did not take into account the HIF-1α factor in thehypoxia pathway.
Therefore, we propose a mathematical model of the G1/S transition under hypoxia,which explicitly integrates the HIF-1α pathway. The model reproduces the slowingdown of G1 phase under moderate hypoxia, and the entry into quiescence of prolifer-ating cells under severe hypoxia. We show how the inhibition of cyclin D by HIF-1αcan induce quiescence ; this result provides a theoretical explanation to the experimen-tal observations of Wen et al. (2010). Thus, our model confirms that hypoxia-inducedchemoresistance can be linked, for a part, to the negative regulation of cyclin D byHIF-1α.

3.2 Un modele plus complet 39
Introduction
The integration of environmental factors influencing cell proliferation is the ac-tual challenge of cell cycle modeling [95]. Indeed, since the 1990’s, many models weredeveloped to describe the evolution of protein levels during the cycle [97, 110–112].However, few of them take into account external parameters, such as the temperature,the mechanical properties of the substrate, or hypoxia. This last factor is particularlyinteresting to study. In physiological condition, hypoxia can occur if the blood does notbring enough oxygen to the cells. If hypoxia is too severe or too long, the cell entersinto apoptosis [13]. In pathological conditions, cancer cells undergo a chronic hypoxia[14, 99]. This hypoxia induces more aggressive, metastatic and resistant tumors [13, 54].In particular, if hypoxia can induce apoptosis in normal proliferating cells, tumor cellsresist to apoptosis [13]. One mechanism that can explain this resistance is the entryinto a quiescent state, where the cell stops its division cycle [56, 100]. This quiescentstate is also a mean for the cancer cell to escape from the effects of chemotherapy[56, 101, 102]. Therefore, it participates to the aggressiveness of the tumors.
Alarcon al. [49] proposed a simple model explaining why cancer cells can enter intoquiescence under hypoxic conditions whereas normal cells follow their cycle. The au-thors introduce a difference between normal proliferating and cancer cells through thederegulation of the expression of a protein of the cell-cycle (p27) during tumorigenesis.However, this deregulation event is not a general feature of cancer. Indeed, this phe-nomenon was not observed in the majority of tumor cells [103, 104]. Besides, it is notclear that p27 is necessary to induce hypoxia-induced cell cycle arrest [51, 105].
The HIF-1α factor is the central protein involved in the intracellular signalingpathway of hypoxia [113]. It is a transcription factor, which enhances the expression ofnumerous genes. These genes enable the cell to adapt to the environmental conditions(angiogenesis, arrest of aerobic metabolism), or to enter into apoptosis [44, 50].
HIF-1 is an heterodimeric protein, constituted of two sub-units : HIF-1β, which isconstitutively expressed, and HIF-1α, which is the sensor of hypoxia. Indeed, in orderto activate hypoxia genes, HIF-1α has to be in a reduced form. When the level of oxygenis sufficient, an enzyme called HIF-1α prolyl-hydroxylase is active and converts HIF-1αinto an hydroxylated form. This oxygenated form of HIF-1α is rapidly degraded by theproteasom pathway [13, 102, 114].
The ways of actions of HIF-1α are numerous and complex [2]. A review of thehuge molecular biology literature dealing with the effects of HIF-1α on the cell cycleenables us to retain several types of actions. First, it is clear that HIF-1α indirectlydownregulates cyclin E activity, and this inhibition is the reason why HIF-1α causesslowing down or arrest of cell cycle [47–49]. The origins of this action on cyclin Eactivity remain poorly defined [47], even if some potential pathways are known. Notably,the upregulation of cyclins inhibitors, such as p21 and p27, are reported [3, 47, 50].However, some authors showed that the action of HIF-1α on p27 is not so clear sincethe expression of p27 under hypoxia may be independent of HIF-1α [6, 51].
The second important effect of HIF-1α is the interrelation between this factor andcyclin D [52, 53]. Wen et al. [52] studied the effect of HIF stabilization on cyclin Dlevel. They first found that after 24h at 0.2%, the mean cylin D concentration in the

40 Hypoxie et cycle cellulaire : approche mathematique
whole cell population decreases with 50% compared to the normoxic condition. Toconfirm the implication of HIF-1, its activity was impaired by DN-HIF overexpression,which induces an increase of the cyclin D level. There is also an action of cyclin D onHIF-1α, due to the activation of the HIF-1 prolyl-hydroxylase activity [53]. Besides,the activation of cyclin D expression by HIF-2 underlines the rivalry in hypoxic tumorgrowth and progression between HIF-1 and HIF-2. Here, we choose to focus on theinfluence of cyclin D inhibition by HIF-1α, in order to show how this simple relationshipcan generate a serie of interesting results in agreement with data from the literature.Besides, the inhibition of the cyclins by HIF-1α under hypoxia is very well documented.As we previously said, hypoxia-dependent inhibition of cyclin E is considered as a causeof hypoxia-dependent cell-cycle arrest. Second, the increase of unphosphorylated versusphosphorylated form of the Retinoblastoma protein [48, 50] under hypoxia is also a goodevidence for the downregulation of cyclin D by HIF.
The increase of HIF-1α activity during tumorigenesis is well documented, since itseems to be a very common feature of cancers [24, 35, 42, 115]. As a consequence,this factor became a new therapeutic target [116, 117]. In some cases, its high levelis simply due to the chronic hypoxia undergone by the tumor cells. In other cases,genetic mutations induce an over-stabilization of HIF-1. It is the case for the renalclear carcinoma [75]. As a consequence, for the same oxygen pressure, HIF-1 will havea higher level in cancer cells than in normal cells [118].
In a general way, a link was found between the aggressiveness of cancers and HIF-1α activity. This role of HIF in tumorigenesis is firstly due to the induction of anti-apoptotic and pro-angiogenic genes. Second, it mediates the entrance into quiescenceof proliferating cells, which induces a hypoxia-dependent chemoresistance.
The aim of this work is to describe an example of a simple mechanism of HIF-1α-dependent entrance into quiescence under hypoxia. We make a link between thelevel of HIF-1α and the ability of the cell to enter into quiescence under hypoxia. Inagreement with the literature, our model assumes the regulation of HIF-1α stabilityby the oxygen pressure [114, 119, 120]. We built a mathematical model of the G1/Stransition in hypoxic conditions, which explicitly integrates the HIF-1α pathway. Wefocused on the relationships between HIF-1α and the cyclins, in order to propose asimple and biologically accurate mechanism of hypoxia-induced quiescence.
Model
Hypotheses Our model is primary based on the models described in Alarcon et al.[49], Tyson and Novak [96], Novak and Tyson [97]. In those papers, the G1/S transitionis modeled by a biological switch between a cyclin and an inhibitor complex. They con-sidered that this inhibitor was APC/cdh1. However, this role of APC/cdh1 complex isnot well admitted ; classicaly, the complex addressing cyclin E for degradation is knownto be the SCF complex [121]. As a consequence, it is more accurate to consider that theinhibitor of cyclin E is SCF. The switch that we aim to study is represented in Figure3.2. The G1 phase finishes when this molecular switch occurs. In our model, we differen-tiate the cyclin E and the cyclin D. Cyclin E is involved in the molecular switch where

3.2 Un modele plus complet 41
it inhibits and is inhibited by the SCF complex. Whereas Novak and Tyson [97] con-sider that two cyclins drive the G1/S transition (cyclin E and A), we consider here justone cyclin we named cyclin E. The concentration in active SCF complex is controlledby an evolution equation similar to that given by Tyson and Novak [96] for APC/cdh1complex. Cyclin D phosphorylates the Rb protein, which releases the transcription fac-tor E2F. As Novak and Tyson [97], we supposed that at each time, E2FRb is in anequilibrium relationship with E2F and Rb because the complexation/decomplexationof phopshorylated Rb and E2F is supposed to be very fast compared to the evolution ofthe cyclin concentration. Besides, free E2F can be in unphosphorylated (active) form,or in phosphorylated (inactive) form. A dynamic equilibrium ensures the transitionfrom phosphorylated to unphosphorylated form. The total concentration of E2F (freephosphorylated/unphosphorylated, and complexed with Rb) is supposed to be con-stant, as in [97]. Active E2F factor promotes the synthesis of cyclin E, as assumed forcyclin A by Novak and Tyson [97]. Besides, to take into account the cell growth inthe progression through the G1 phase, we assume that the mass increases the cyclin Econcentration. This assumption is taken from Alarcon et al. [49] and Novak and Tyson[97]. The oxygen pressure is taken into account with the variable P , which representsthe percentage of oxygen among all the other gases in the cell environment. The effectof the oxygen pressure is modeled by the concentration of HIF-1α. This concentra-tion increases when the oxygen pressure decreases, as well described in the literature[33, 122]. Jiang et al. [33] show that in vitro cultured cells submitted to hypoxia ex-hibit an exponential relationship between HIF-1 level and oxygen pressure [33]. Theexperimental results from Zhou et al. [122] confirm that an exponential law is a goodmodel for the hypoxia-induced HIF-1 stabilization. These authors also showed thatthis exponential law strongly depends on the cancer cell line. We will discuss this pointlater. HIF-1α decreases the cyclin D activity by inhibiting its synthesis, as observedin experiments [52]. The evolution of cyclin D level during the cycle, the influence ofHIF-1α on its level, and the reaction of Rb phosphorylation are calibrated with datafrom the literature. We do not take into account the role of the p27 protein, contraryto Alarcon et al. [49]. As we said, the effects of hypoxia on this protein remain unclear ;besides, we want to focus on the influence of cyclin D/HIF interactions which promotethe entrance into quiescence. Figure 3.3 gives a sketch of the molecular network.
Biological description The variables used in the model are cyclin D (cycD), cyclinE (cycE), Retinoblastoma protein (in its unphosphorylated form) (Rb), HIF-1α (H),SCF complex (SCF ), the mass of the cell, and the different chemical forms of the E2Ftranscription factor. E2F exists in phosphorylated and unphosphorylated (E2F ) form,and free or linked to Rb (E2FRb). Thus, free E2F can be phosphorylated or unphospho-rylated. The free and unphosphorylated form (E2FA) is the active form. A chemicalequilibrium drives the transition between the phosphorylated and unphosphorylatedform of E2F. We named E2Ftot the total of all the chemical forms of E2F. As Novakand Tyson [97], we assume this total to be constant. Cyclin D liberates E2F by phos-phorylating Rb (that is to say by decreasing [Rb]). E2FA has a crucial role, since itpromotes the synthesis of cyclin E. Cell growth is the second factor influencing cyclin E

42 Hypoxie et cycle cellulaire : approche mathematique
Time
concen
tratio
n[SCF][cyc-CDK]
Concen
tratio
n
G1 R S-G2-M
Figure 3.2: The biological switch between cyclin E and its inhibitor is necessary to passthrough the G1/S restriction point. Schematic diagram showing the evolution of the concen-tration of SCF and cyc-CDK during the cell cycle. The vertical dotted line represents therestriction point : when the cell achieves the switch, it finishes the cycle. From [49]
synthesis, trough the variable m. HIF-1 inhibits cyclin D synthesis. As a consequence,hypoxia induces a decrease of E2FA maximal level, which decreases the synthesis rateof cyclin E. The core of the model is the molecular switch between cyclin E and itsinhibitor (SCF). Following the same idea as Novak and Tyson [97] and Alarcon et al.[49], this switch is driven by the mutual inhibition of SCF and cyclin E.
Mathematical formulation The model can be written with a system of coupledordinary differential equations (ODEs).Cyclin D is synthesized with rate a1 and naturally degraded with rate a2. We assumethat it is linearly decreasing with [H] [52] :
d[cycD]
dt= a1 − a3[H]− a2[cycD] (3.10)
The synthesis of cyclin E is induced by cell growth and E2FA, according to Novakand Tyson [97] and Alarcon et al. [49]. Its degradation is stimulated by the SCFcomplex :
d[cycE]
dt= b1m[E2FA]− b2[cycE]− b3[cycE][SCF ] (3.11)
SCF complex obeys the same equation as the APC/cdh1 complex of the previousmodels [49, 96, 97] :
d[SCF ]
dt=
e1(1− [SCF ])
J1 + 1− [SCF ]− e2
[SCF ][cycE]
J2 + [SCF ](3.12)
As in Alarcon et al. [49], Rb (unphosphorylated Rb) is synthetized with a d2 rate,and naturally degraded with a d3 rate. Cyclin D phosphorylates Rb. As a consequence,

3.2 Un modele plus complet 43
HiF-1α
Hypoxia
Cyc E
Cyc D
RbNP
Mass E2FA
SCF
Figure 3.3: Model of the G1/S transition in hypoxic conditions : schematic representationof the molecular network considered in our model. We modeled the action of cyclin D, whichphosphorylates Rb and liberates E2F. This transcription factor activates the synthesis ofcyclin E, which is degraded by SCF complex. HIF-1α negatively regulates cyclin D synthesis.RbNP=Non-phosphorylated Rb.
[Rb] decreases :
d[Rb]
dt= d2 − (d3 + d1[cycD])[Rb] (3.13)
The growth of the cell mass follows the same law as in Alarcon et al. [49], with agrowth rate α and a maximal size m0 :
dm
dt= αm(1−
m
m0
) (3.14)
The unphosphorylated form of E2F follows a dynamic equilibrium described byNovak and Tyson [97] :
d[E2F ]
dt= g1([E2F ]tot − [E2F ]) (3.15)
The equilibrium relationship between oxygen pressure and HIF-1α concentrationhas been derived from experiments [33] :
[H] = H0eβ1(1−P ) (3.16)
Following Novak and Tyson [97], we assume that at each time, the active E2F is

44 Hypoxie et cycle cellulaire : approche mathematique
the fraction of unphosphorylated ( [E2F ][E2F ]tot
) free ([E2F ]tot − [E2FRb) E2F factor :
[E2FA] =([E2F ]tot − [E2FRb])[E2F ]
[E2F ]tot(3.17)
The equilibrium between E2FRb, E2F and Rb is given by the equation from Novakand Tyson [97] :
[E2FRb] =2[E2F ]tot[Rb]
[E2F ]tot + [Rb] +√
([E2F ]tot + [Rb])2 − 4[E2F ]tot[Rb](3.18)
As in previous models, the core of the system is the molecular switch between acyclin and SCF. Mathematically, we consider that the cell passes through the G1 phasewhen [cycE] > [cycE]threshold and [SCF ] < [SCF ]threshold. We chose [SCF ]thresold =0.004 and [cycE]thresold = 0.15. When these values are reached, the cell divides.
Inhibition of cyclin D by HIF-1α
Eq.(3.10) and (3.16) describe the relationship between cyclin D, HIF-1α and theoxygen pressure P in the cell environment. This model considers the effects of a longterm (almost 48h) hypoxia. Thus, the level of HIF is stabilized. [cycD] is synthesizedwith rate a1, and degraded with rate a2. Its synthesis is inhibited by HIF-1α, whichconcentration depends on oxygen pressure following the expression given in eq. (3.16).The parameter a3 represents the action of HIF on the synthesis of cyclin D. The param-eter β1 is determined from Jiang et al. [33] (see Appendices A). The variable P standsfor the oxygen pressure in the cell environment, expressed as a normalized percentageof all the gases. As suggested by Jiang et al. [33], we consider that the reference pres-sure (P=1) is 6% O2. All the pressure will be normalized with this reference pressure.The parameters a1, a2 and a3 are estimated with data coming from Wen et al. [52] andYang et al. [112] (see Appendix A).
Control of E2F concentration
We denote [E2F ]tot the total concentration of E2F, E2FRB the complex E2F/Rb,E2F the unphosphorylated form of E2F and E2FA the free and unphosphorylated(active) form. We describe the equilibrium between these different variables fromEqs.(3.15),(3.17),(3.18) previously proposed by Novak and Tyson [97]. The first de-scribes the transition, mediated by g1, from phosphorylated to unphosphorylated E2F.The others are equilibrium equations modeling the relationship between the differentchemical species involving E2F.
Eq.(3.13) describes the evolution of the unphosphorylated Retinoblastoma proteinconcentration. [Rb] is synthesized with coefficient d2, naturally phosphorylated in thecell environment with coefficient d3, and phosphorylated by cyclin D with coefficient d1.
Molecular switch
Eqs.(3.11),(3.12) describe the biological switch which forms the core of the modelfor the G1/S transition. Besides, we suppose that the synthesis of cyclins E, represented

3.2 Un modele plus complet 45
by the variable cycE in our model, depends on the mass m and on the transcriptionfactor E2F in its active form (E2FA) [97]. The parameter b1 regulates the speed ofthe chemical synthesis. In the other hand, cycE is naturally degraded with coefficientb2, and suffers SCF-mediated degradation with coefficient b3. The aim is to simulatea switch similar to that obtained in these previous models of G1/S transition. As inNovak and Tyson [97], the dynamics of the inhibitor depends on cyclin E, and onthe transition between an active and inactive form. These dependencies are expressedthrough Michaelis-Menten terms with enzymatic constants J1 and J2 respectively. Theparameter e1 promotes the transition from inactive to active form, and e2 the transitionfrom active to inactive form.
Parameters
The parameters we used are given in Table 3.1. Their values were estimated fromprevious models [49, 97] and experimental data of molecular biology taken from theliterature (see Appendix A). We will show that we can reduce the variability of all theparameters to the variability of e2 and α, which control the dynamics of the system.These parameters can be easily adjusted to biological data.
Results
We simulated the G1/S transition by solving the system of equations Eqs.(3.10)-(3.18) for different values of P . We used a standard fourth order Runge-Kutta method,implemented in Matlab. The values of the parameters used in our first simulationsare given in Table 3.1. We chose the undetermined parameters in order to have a G1phase duration of about 400 minutes. This duration was chosen based on the work ofNovak and Tyson (2004) [97]. The rise of cyclin D and A levels, which was interpretedby Novak and Tyson, and by ourselves, as the signal for the G1/S transition, occursabout 6-7 hours after the beginning of the cycle. The initial conditions we used aregiven in Table 3.2. The initial values for the concentrations were chosen to have valuesof the same order of magnitude to that used by Alarcon et al. [49] and Novak [97]. Wecan notice that the initial concentrations do not influence the final state of the system(see Appendices B). We consider that the cell passes through the G1 phase when[cycE] > [cycE]threshold = 0.15 and [SCF ] < [SCF ]threshold = 0.04. These thresholdconditions were chosen to capture as precisely as possible the moment of the switchbetween the cyclin E and the SCF complex. In the rest of the paper, the notation [X]∞stands for the value of [X] when the system reaches its steady state.
Hypoxia induces entrance into quiescence Figure 3.4 shows simulations of theG1/S transition under three levels of hypoxia. When P diminishes, the molecular switchoccurs with a delay which increases when hypoxia becomes more severe. For a certainvalue of P (here, 0.01), this switch does not occur any more. As in [49], this inability forthe cell to pass through the G1 phase can be interpreted as the entry into the quiescentstate. P ∗ denotes the minimal pressure which enables the cell to pass through the G1phase.The parameters are given in Table 3.1, and P*=0.03.

46 Hypoxie et cycle cellulaire : approche mathematique
Model’s variables Notations Initial ValueMasse m 5
Cyclin D cycD 0.1Non-phosphorylated Rb Rb 1
Cyclin E cycE 0.01SCF complex SCF 0.9
Unphosphorylated E2F E2F 0.1
Table 3.1: Initial values taken for the simulations
We also plotted the duration of the G1 phase as a function of P (Figure 3.5). As hy-poxia becomes more intense, the G1 phase duration increases, in agreement with theliterature [3]. For the lowest value of the pressure, we observe an asymptotic behavior,which finishes by the entrance into quiescence.
In order to mathematically characterize the final state of the cell (quiescent orproliferating), the stationary state solutions of the system, depending on P , are nu-merically calculated. The details of the calculation are presented in the AppendicesB. Figure 3.6 presents the stable stationary states of the system as a function of P .When P < P ∗, the system exhibits three stable stationary states. With our initialconditions ([SCF ] high and [cycE] low), the equilibrium state of the system is reachedwith [SCF ] > [SCF ]threshold and [cycE] < [cycE]threshold. This situation correspondsto the quiescent state. When P > P ∗, the system has a unique stationary state. It ischaracterized by a high level of cycE and a low concentration of SCF , which leads thecell to achieve its cycle.
Influence of parameters variability Previous observations enable us to supposethat the two main features of the cell response to hypoxia are the increased durationof the G1 phase and the capacity to enter into quiescence. The latter can be quantifiedby the value of P ∗ (pressure for the bifurcation of the dynamics system). The core ofthe system is the molecular switch due to SCF and cycE interactions. The variationsof P have an influence on these dynamics by changing [E2FA] and m. Since these twovariables determine the synthesis rate of cycE, they affect the G1 phase duration andequilibrium values of SCF and cycE.
The equilibrium value of m never changes in our model. We call this maximal valueof mass m0, and we have m∞=m0. We can simulate its influence on the dynamics ofthe system by modifying b1, which buffers the variations of m0 in the production rateof cycE. Therefore, we do not consider m0 as a key parameter for the dynamics of thesystem. The variations of the growth rate, by modifications of the parameter α, justhave an influence on the cell cycle duration.
Final concentrations of the SCF and cycE directly depend on [E2FA]∞. We canexpress [E2FA]∞ as a function of [cycD]∞, d1, d2 (see Appendix B). [cycD]∞ dependson the parameters of Eq.(1) and (7) (a1, a2, a3, β1). As a consequence, the variabilityof all these parameters is totally buffered by the variability of b1, which controls theproduction rate of cycE.

3.2 Un modele plus complet 47
0 100 200 300 400 500 600 7000
0.1
0.2
0.3
0.4
0.5
0.6
0.7
0.8
0.9
1
SCFcycE
P=1
P=0.08
P=0.01
0 100 200 300 400 500 600 700 800 900 10000
0.1
0.2
0.3
0.4
0.5
0.6
0.7
0.8
0.9
1
0 1000 2000 3000 4000 5000 6000 7000 8000 9000 100000
0.1
0.2
0.3
0.4
0.5
0.6
0.7
0.8
0.9
1
[cycE] threshold[SCF]thresold
Figure 3.4: Evolution of [SCF ] (solid black line) and [cycE] (solid grey line). The sim-ulations were made for adimensionalized values of P , with P=1 (top), 0.08 (center), 0.01(bottom). When the molecular switch occurs, the cell passes through the G1 phase. ForP=0.01, the system does not generate a switch any more. The cell enters into a quiescentstate.

48 Hypoxie et cycle cellulaire : approche mathematique
parameter Value Referencea1 0.51 [123], [97]a2 1 [123], [97]
a3H0 0.0085 [52]β1 2.5 [33]b1 0.018b2 0.5 [49]b3 1 [49]J1 0.04 [49]J2 0.04 [49]d1 0.2 [97]d2 0.1 [49]e2 14e1 1α 0.005g1 0.016 [97]
[E2F]tot 1[cycE]threshold 0.15 [49][SCF ]threshold 0.004 [49]
Table 3.2: Parameters used in the model. The parameters we could not estimate areinitially determined in order to reach a G1 phase duration of about 400 min for proliferativecells in normoxic conditions
0 0.1 0.2 0.3 0.4 0.5 0.6 0.7 0.8 0.9 10
500
1000
1500
2000
2500
3000
P
G1ph
asedu
ratio
n(m
in)
Figure 3.5: Influence of hypoxia on the G1 phase duration. Value of the G1 phase duration(in min) given by the model as a function of the parameter P (adimensionalized).

3.2 Un modele plus complet 49
0 0.01 0.02 0.03 0.04 0.05 0.06 0.07 0.08 0.09 0.10
0.1
0.2
0.3
0.4
0.5
0.6
0.7
0.8
0.9
PP*
SCF
0 0.01 0.02 0.03 0.04 0.05 0.06 0.07 0.08 0.09 0.10.06
0.07
0.08
0.09
0.1
0.11
0.12
0.13
0.14
0.15
0.16
P* P
CycE
Figure 3.6: Influence of P (adimensionalized) on the stable fixed points of the system.[SCF ]∞ (top) and [cycE]∞ (bottom) are plotted as functions of P ∗. The dark line representthe stationary states reach by the system with the parameters we used. The point where wepass from three to one stable stationary state corresponds to P ∗ (limit of the quiescent state).
As it ensures the coupling between SCF and cycE, the parameter e2 also controlsthe dynamics of the molecular switch. If the coupling is weak, it is more difficult forthe system to generate a molecular switch. As a consequence, we can also consider theparameter e2 as a key factor influencing the behavior of the system.
Finally, the whole variability of the adjustment parameters can be simulated by thevariability of the parameters e2, b1 and α.
Figure 3.7 shows that the (b1, e2) couple determines the value of P ∗. When e2decreases, the coupling between SCF and cycE becomes weak, and it is necessary toincrease the hypoxic level to observe quiescence. As a consequence, P ∗ decreases. Inparallel, when b1 decreases, the production rate of cycE at the steady state is lessimportant. Therefore, the cell enters more easily into quiescence, and P ∗ increases. Wenote that, for a given value of b1, the variations of e2 are sufficient to simulate a largepanel of values for P ∗. As a consequence, in order to adjust the model to a given value ofthis limit pressure, we can set b1 and consider e2 as an adjustment parameter. Finally,

50 Hypoxie et cycle cellulaire : approche mathematique
12 13 14 15 16 17 180.014
0.0145
0.015
0.0155
0.016
0.0165
0.017
0.0175
0.018
0.0185
0.019
0.1
0.2
0.3
0.4
0.5
0.6
0.7
0.8
0.9
e2
b1
P*
Figure 3.7: Influence of b1 (synthesis rate of cycE) and e2 (coupling between cycE andSCF ) on the value of the bifurcation point P ∗. The value of P ∗ (color scale) is plotted as afunction of b1 and e2. The white zones correspond to non physiological values (the cell neveror always finishes its cycle).
the parameters controlling the dynamics of the system are e2 (coupling between cyclinE and SCF) and α (growth rate).
Discussion
This paper proposes a mathematical model of the G1/S transition in hypoxic con-ditions. Our model was calibrated with data from the literature, and the results fromother mathematical models of the G1 phase transition [49, 97]. The core of this modelis a molecular switch between a cyclin and an inhibitor (SCF). The passage throughthe G1 phase is determined by the possibility to realize this switch. If the switch doesnot occur, we consider that the cell is trapped into a quiescent state. Hypoxia was simu-lated by introducing HIF-1α. We modeled the inhibition between cyclin D and HIF-1α,in agreement with data from the literature [52]. The oxygen pressure determines, inthis way, the final concentration of cyclin D during the G1 phase. This level of cyclinD determines the maximum value of the active E2F concentration, which controls thesynthesis rate of cyclin E. If this rate is not high enough, the critical concentrationfor the cyclin E is not reached and the molecular switch cannot occur. The cell entersinto a quiescent state. As a consequence, if the oxygen pressure is low, the cyclin Dwill not reach a sufficient level to ensure the minimal amount of cyclin E the cell needsto achieve the G1 phase. We could define a limit pressure P ∗, which is the minimumoxygen pressure whereby the cell can pass through the G1 phase. Mathematically, itcorresponds to the bifurcation point of our system.
Thus, this model illustrates a simple mechanism of hypoxia-mediated slowing downof the cell cycle, and entrance into quiescence. It focuses on the influence of the interac-tions between HIF-1α and the cyclins on the G1 phase achievement. Notably, we showhow the inhibition of cyclin D by HIF-1α can affect the cell cycle. By inhibiting cyclinD activity, HIF promotes the entrance into quiescence. Thus, it provides a resistance

3.2 Un modele plus complet 51
to apoptosis for the proliferative cells. This result gives an explanation to the results ofWen et al. [52], which have shown that the HIF-mediated chemoresistance appearingin tumor cells is linked to the inhibition of the cyclin D. Indeed, they observed thatthe inhibition of cyclin D expression by siRNA induces an increase of the resistanceto chemically-induced apoptosis. They concluded than the negative regulation of thecyclin D induced by HIF can, at least partially, explain the chemoresistance which isassociated to cancerous HIF-1 over-stabilization. Thus, our model shows how a certainform of chemoresistance can be associated to HIF-1 in cancer cells. In the case of asimilar response to hypoxia between normal and cancer cells (non-mutated hypoxiapathway), the model highlights a possible mechanism for the chronic hypoxia-inducedentry into quiescence. In the case of a genetic over-stabilization of HIF-1, which is thecase for various type of cancers [75, 106], the increased ability of cancer cells to enterinto a quiescent state is well described by our model. Indeed, this case can be modeledby multiplying [H0] by an ǫ > 1 parameter to artificially increase the HIF-1 level. Asa consequence, for a same oxygen pressure, HIF-1 concentration will be more impor-tant in cancer cells than in normal cell. Thus, for a given hypoxic condition, a cancercell can enter into a quiescent (resistant) state whereas the normal cells continue theircycle (more sensitive to apoptosis). Our model thus captures the differential behaviorof cancer and normal cell. We can notice than this ǫ parameter could depend on thecell line, since Zhou et al. [122] showed that different cancer cell lines does not havethe same normoxic level of HIF-1. Compared to the model from Alarcon et al. [49],our work describes in a very general way the influence of HIF-1 on hypoxia-inducedquiescence of normal and cancer cells. Whereas the previous model was based on anarguable action of hypoxia on p27, we constructed a biologically more accurate systemof ODEs. This new model gives a possible explanation to the link between HIF-1, thecyclins and hypoxia-induced chemoresistance. Besides, our model can easily be com-pleted to study the influence of a genetic over-stabilization of HIF-1 by considering anǫ parameter, which can vary with considered cell line.
The α parameter, which drives the growth speed of the cell, was chosen to obtaina value of 400min for the G1 phase duration. It is important to notice that the resultsof our model are not influenced by the choice of the normoxic G1 phase duration. As itdoes not influence the final state of the mathematical system, this α parameter can bemodified to adjust the model to various G1 phase durations. It is biologically correct,because the duration of the G1 phase in the absence of an environmental stress isknown to be, at least for a part, driven by the growth rate of the cell [111].
Besides, the influence of HIF-1 on the cell metabolism was not taken into accountin this model. It is known that the glycolitic switch described by Gatenby and Gillies(2004) [124] is linked to the activity of HIF-1. Notably, it was shown that HIF-1 stim-ulates the synthesis of glycolitic enzymes, such as Pyruvate Kinase [44]. In parallel,Icreverzi et al. [125] observed that cyclin D enhances cell growth through the stim-ulation of mitobiogenesis. By inhibiting the synthesis of cyclin D, HIF-1 makes themitobiogenesis to decrease, which promotes the transition to a glycolytic phenotype.This switch allows cancer cells to compensate low aerobic metabolism by an increasedglucose consumption. This can be a way for the cell to escape the quiescence state. Itcould be interesting to add to our model a term describing the energetic production,

52 Hypoxie et cycle cellulaire : approche mathematique
and to link cell growth to this available energy.We also have to notice that our model only study the effect of a given oxygen
pressure on a single cell. In the reality of tumor growth, there is a gradient of oxygenwhich varies in space and time. To study the effects of such a dynamical hypoxiccondition, it would be necessary to consider some series of cycles, by reseting thevalues of the variables to their initial values after the G1/S transition is reached. Foreach new cycle, the oxygen level can change, and the cell response may also change.Besides, it is possible to extend this model to consider a population of cells, whichhave interactions with each others. These interactions can be, for instance, through thediffusion of growth factors which stimulate cell proliferation by enhancing the synthesisof cyclin D [119]. We can also consider the differential mechanical interactions betweenthe tumor cells, and between tumor cells and the stroma. These mechanical interactionsare known to influence cell division [126]. We can notice here that the kinetics of HIF-1accumulation is not considered in this model. We study the idealized case of a constanthypoxia, and we consider the effect of the equilibrium value of HIF-1. However, thesekinetics were measured ([57, 58]). HIF-1 shows a peak after 6h, and then decreases tostabilize at an equilibrium level after 24-48h. This equilibrium level depends on theintensity of hypoxia, and on the cellular type (normal and cancer cells). If we considerthe more complex case of a dynamical hypoxia, it should be necessary to take intoaccount these kinetics of HIF-1 accumulation.
We can notice that the exact relationships between HIF-1 and cyclin D is not totallyelucidated. Many reports show that HIF-1 inhibits cyclin D [52, 53] and cyclin E [47–49] leading to cell cycle arrest. However, an other report [127] show that HIF-1 alsocan stimulate the induction of cyclin D, leading to cell proliferation. In our work, weuse the first biological hypothesis, and we show that it can explains the cell cycle arrestphenomenon commonly observed.
Finally, we aim to calibrate the undetermined parameters with experimental data,by measuring the G1 phase duration under hypoxia and the value of P ∗. Since weshowed that only two parameters (α and e2) drive the dynamics of the system (G1phase duration and entrance into a quiescence state), experimental data will enable usto set the value of these parameters for different cell lines. Therefore, this would providea tool to compare different cancer cell lines on the basis of their ability to enter intoa quiescence state. It could be interesting to build a classification of different cancercells using the values of the parameters of our model. By comparing it with a knownclassification made on the basis of their resistance and aggressiveness, we could obtainsome information about the correlation between the ability to enter into quiescenceunder hypoxia and the aggressiveness.
Acknowledgements
We are very grateful to Francoise Giroud for her advices which helped us to buildand justify the hypotheses of the model.

3.2 Un modele plus complet 53
Appendix
Determination of the parameters
The parameter we did not adjust were taken from [49] and [97] models, or calculatedfrom the molecular biology literature. This first part presents the biological data usedto build the model.
HIF-1α and oxygen pressure In [33] the relationship between [H] (HIF-1 concen-tration) and P was experimentally determined. The authors have shown that the levelof HIF-1α varies with oxygen pressure in an exponential form, when the oxygen pres-sure is below 6%. The experimental curve they present was fitted in order to build thedimensionless expression describing the relationship between [H] and P . The normoxia(P=1) is reached for an oxygen pressure P=6%.
Hif-1α and cyclin D dynamic In [123], the level of cyclin D is quantified during thecycle : the protein is multiplied by a factor taken between 2 and 5 during the G1 phase.We adjust the maximum level of cyclin D to reach a concentration five times higher thanin the beginning of the G1 phase. We also used the dynamic of the cyclin D evolutionduring the G1 phase modeled by [97], with a rapid increase of cyclin D concentration(maximum level reached in less than one hour). In [52] experiments were realized toquantify the inverse correlation between HIF-1α and cyclin D. Their paper shows thatafter 20 hours of hypoxia (oxygen pressure P=0.21%) in a cell constitutively expressingthe cyclin D, its concentration reaches an equilibrium, and is divided by about 2 withrespect to normoxia. Considering that our model describes cells that have enduredseveral hours of hypoxia, and that the constitutive expression is equivalent to theinduction at the beginning of the G1 phase, the parameter a3 was adjusted to obtaina maximal value of [cycD] divided by 2 when P = 0.21%.
Phosphorylation of Rb We used the model developed by [97] to adjust the param-eters controlling the quantity of phosphorylated Rb : they obtained a phosphorylationof 50% of total Rb after 4 hours of cycle.
Fixed points
X∞ denotes the steady state concentration of the variable X. By equaling to zeroEqs.(1)-(6), it is possible to calculate the equilibrium values of the variables used inthe model. The calculation of cycD∞, Rb∞, E2F∞, m∞ is straightforward :
cycD∞ =a1 + a3H0e
β1(1−P )
a3
Rb∞ =d2
d2 + d1cycD∞
m∞ = m0
E2F∞ = [E2F ]total

54 Hypoxie et cycle cellulaire : approche mathematique
(3.19)
By equaling to zero Eqs.(2) and (3), we obtain an equation for cycE∞ :
cycE∞ =b1m0[E2F ]totb2 + b3SCF∞
and a third degree equation for SCF∞ :
0 = −b3e10cycE3∞+ cycE2
∞(b3e1 − e1J2b3 − e1b2 + e2b1m0[E2F ]tot)
+ cyc∞(e1J2b3 − e1J2b2 − e2J1b1m0[E2F ]tot − e2b1m0[E2F ]tot)
+ e1J2b2 (3.20)
The equation B.2 is solved numerically, for different values of P and of the param-eters α, b1, e2. The resolution gives us the number and the values of the fixed points ;we also numerically determined the stability of these fixed points.

3.3 Conclusion 55
3.3 Conclusion
Dans ce premier article, nous avons propose un modele mathematique de la tran-sition G1/S en conditions hypoxiques. Notre approche revisite le travail d’Alarcon etal. (2004) [49] a la lumiere de modeles classiques du cycle cellulaire et de donneesexperimentales recentes decrivant les effets de HIF-1α sur les proteines controlant laproliferation. Le cœur de notre modele reside en un ≪interrupteur moleculaire≫, im-pliquant la cycline E et son inhibiteur (SCF). Le passage de la transition G1/S estdetermine par l’activation de cet interrupteur, c’est a dire l’augmentation brutale del’abondance de la cycline. Si ce basculement ne s’opere pas, la cellule est bloquee enphase de quiescence. L’originalite de notre modele est l’introduction explicite des liensunissant HIF-1α aux proteines du cycle cellulaire. Plus precisement, nous avons con-sidere l’inhibition de la synthese de cycline D par HIF-1α, et reproduit par ce biais l’effetde l’hypoxie sur le niveau d’expression de la cycline E. Nous avons ainsi pu proposerun mecanisme possible expliquant l’apparition de chimioresistances liees a HIF-1α. Eneffet, la sur-expression de la proteine dans les cellules tumorales est a l’origine, selonnotre modele, d’une entree facilitee en quiescence lors d’un episode hypoxique. Or, laquiescence est connue pour induire une resistance accrue aux attaques cytotoxiques [56],en extrayant les cellules de l’etat proliferatif, dans lequel elles sont plus vulnerables.Ainsi, le mecanisme que nous presentons dans ce travail suggere une explication au lienobserve, dans la litterature, entre la chimioresistance et l’inhibition de la cycline D parHIF-1α [52]. Il decrit egalement l’existence d’une pression en oxygene seuil P ∗ en-decade laquelle la cellule rentre en quiescence. Dans les cas d’hypoxie moderee, seule laduree de la phase G1 est affectee. De toute evidence, la grande diversite des reponsesa l’hypoxie rend delicate la generalisation de ces resultats. Il est donc necessaire deles comparer a la realite experimentale, dans le cas precis des cellules HeLa-FUCCI.L’etude de l’effet de l’hypoxie sur ce modele cellulaire constitue ainsi la deuxieme etapede notre travail.

56 Hypoxie et cycle cellulaire : approche mathematique

4Hypoxie et cycle cellulaire : approche
experimentale
4.1 Introduction
4.1.1 Cadre de l’etude
Dans le chapitre precedent, nous avons etudie un des liens tisse entre l’hypoxieet le cycle cellulaire, via la modelisation de l’interaction de HIF-1α avec la cyclineD. Dans celui-ci, nous allons cherche a caracteriser experimentalement l’influence dumanque d’oxygene sur la proliferation, en utilisant les cellules HeLa-FUCCI. Les cel-lules FUCCI (Fluorescent Ubiquitination-Based Cell Cycle Indicator) constituent unelignee cellulaire recemment creee a partir de cellules HeLa [85]. Comme nous l’avonsdetaille en introduction, ce systeme utilise un couple de proteines oscillatoires, la cdt1et la geminine, couplees respectivement avec le Kusabira Orange et le vert Azami. Enconsequence, les phases G1, S et G2 sont marquees avec differentes couleurs. Cettelignee cellulaire permet donc de quantifier la duree de chaque phase de maniere non-destructive. Notamment, elle peut etre utilisee pour visualiser in vivo la progression ducycle [90, 91]. In vitro, c’est un outil de choix pour observer les effets sur la dynamiquecellulaire de differentes contraintes environnementales, telle que l’hypoxie. Cependant,l’etude de la reponse cellulaire a l’hypoxie en utilisant les cellules FUCCI est renduecompliquee par les effets du manque d’oxygene sur les fluorophores. En effet, commel’ont montre Kaida et al. (2012) [128, 129], le mauvais repliement des marqueurs dansces conditions eteint la fluorescence et rend donc la quantification de la dynamiquedu cycle impossible. En revanche, l’utilisation d’inducteurs chimiques de HIF-1α estenvisageable. Comme nous l’avons note dans le chapitre 2, il existe en effet plusieursmolecules couramment utilisees pour mimer l’hypoxie en induisant l’accumulation deHIF-1α (CoCl2, DMOG, DFO). L’action de ces molecules sur le cycle est variable, et
57

58 Hypoxie et cycle cellulaire : approche experimentale
depend etroitement de la concentration en agent chimique, du temps d’exposition, etde la lignee cellulaire utilisee. Nous avons donc choisi d’etudier l’influence de DFO etCoCl2 sur les cellules HeLa-FUCCI, afin de tester leur pertinence comme agent mimantl’hypoxie, et d’apporter une contribution a la comprehension de leur action cellulaireet moleculaire. Ce dernier point est d’importance, puisque les chelateurs du fer sontconsideres aujourd’hui comme de potentiels agents anti-cancer. Nous nous proposonsdonc, dans ce chapitre, d’etudier en premier lieu les effets de CoCl2 et DFO sur la dy-namique de proliferation des cellules HeLa-FUCCI. Une premiere etape est presenteesous la forme d’un article publie dans The Journal of Cell Biology and Cell Metabolism.Ces resultats sont completes par une etude de reversibilite des effets de DFO sur lecycle.Dans un second temps, nous avons utilise les cellules FUCCI pour etudier la reponsecellulaire a la reoxygenation. En effet, il a ete montre par Kaida et al. (2012) [128, 129]que la fluorescence, eteinte par le manque d’oxygene, etait recuperable apres le re-tour a la normoxie. Nous avons donc cherche a etudier l’evolution de la dynamique deproliferation lors d’un cycle hypoxie/reoxygenation.
4.1.2 Methode
Acquisition et traitement des donnees
Les trois themes traites dans ce chapitre (etude des effets de CoCl2 et de DFOsur le cycle, puis de leur reversibilite, et simulation d’un cycle hypoxie/reoxygenation)reposent sur la quantification de la dynamique de la proliferation en microscopie defluorescence. Nous avons presente en introduction les caracteristiques des cellules HeLa-FUCCI. De maniere generale, les resultats experimentaux presentes ici sont issus d’unememe methodologie, mise au point dans le but d’acquerir et de traiter les donnees defluorescence des cellules FUCCI. Celle-ci etant presentee en detail en annexe (AnnexesA et B), nous nous contentons ici d’en rappeler les grandes lignes. Les cellules sontcultivees dans du DMEM, auquel sont adjoints 10 000 U/ml de streptomycin et 10%de serum de veau. Le traitement des cellules est realise dans des chambres de cultureLabTex, permettant une observation directe en microscopie.Les images de fluorescence sont acquises a l’aide d’un microscope inverse Zeiss Axio Ob-server.Z1, muni d’une chambre d’incubation adaptee a l’imagerie biologique (regulationde la temperature et du CO2), et d’une platine motorisee. Cette derniere permet derealiser avec precision des experiences en time-lapse sur un grand nombre de champs.Un systeme d’imagerie en fluorescence offre la possibilite d’acquerir le signal en rouge(Texas Red) et en vert (GFP), et de le superposer a l’image obtenue en bright-field(transmission). Des images sont ainsi realisees au cours du temps avec trois canaux,sur environ quarante champs. Sur chacun de ces champs, un protocole de traitement desimages (Annexe B) permet de calculer la proportion de cellules en phase G0, G1, S etG2. Un traitement statistique est realise sur chaque lamelle, en groupant les champs enquatre echantillons contenant un grand nombre de cellules (200 au minimum). Chaqueexperience est ensuite repetee au moins trois fois afin de s’assurer de la reproductibilitedes resultats.

4.2 Etude des effet de DFO et CoCl2 sur le cycle cellulaire 59
Figure 4.1: Induction de HIF-1α par DFO. La presence du facteur de transcription HIF-1α est mise en evidence par immunomarquage (revelation a la peroxydase) apres 24h detraitement en presence de 250µM (A), 100µM (B), ou 0µM de DFO (C).
Immunomarquage
Nous avons egalement utilise un protocole d’immunomarquage indirect de la proteineHIF-1α. La methode choisie est une revelation enzymatique a la peroxydase, dont la de-scription complete est donnee dans l’Annexe C. Nous pouvons ainsi reperer la presenceintra-cellulaire de la proteine en microscopie a transmission (bright-field). La figure 4.1montre ainsi l’induction de HIF-1α par DFO. Les zones opaques signalent la presencedu facteur de transcription. On constate que l’abondance est relativement faible dansle groupe controle, et qu’elle est bien marquee apres un traitement de 24h avec 100et 250µM de DFO. Cette technique de marquage sera surtout utilisee dans le chapitresuivant.
4.2 Etude des effet de DFO et CoCl2 sur le cycle
cellulaire
4.2.1 Article : B.Bedessem, M-P.Montmasson, M. Hamel, F.Giroud,A.Stephanou, Effects of the hypoxia-mimetic agents DFO
and CoCl2 on HeLa-FUCCI cells, Journal of Cell Biol-ogy and Cell Metabolism, 2015
Resume
Le systeme FUCCI est un modele prometteur pour etudier le cycle cellulaire invivo et in vitro. En permettant de suivre la progression du cycle en utilisant la mi-croscopie de fluorescence, il peut etre utilise pour visualiser precisement les effets decontraintes exterieures sur la proliferation. Cependant, il a ete montre que le manqued’oxygene affecte fortement les fluorophores utilises dans la lignee HeLa-FUCCI, ce quilimite son utilisation en conditions hypoxiques. Afin d’etudier les effets de l’hypoxiesur la proliferation cellulaire en utilisant cette lignee, il est possible d’utiliser des in-ducteurs de HIF-1α, tels que CoCl2 ou DFO, qui sont souvent utilises comme agents

60 Hypoxie et cycle cellulaire : approche experimentale
hypoxie-mimetiques. Etant donne que ces molecules, inhibant l’utilisation du fer parles proteines qui le necessitent, sur ont egalement des proprietes anti-cancer, leurs effetsbiologiques ont ete etudies dans diverses conditions experimentales. Une grande vari-abilite d’action ont ete reportees. Dans cette etude, nous investiguons pour la premierefois leurs effets sur la proliferation des cellules HeLa-FUCCI. Nous montrons que CoCl2a un effet biphasique sur le cycle cellulaire, en promouvant ou en inhibant la progres-sion dans la phase G1. En presence de DFO, nous avons identifie un arret en phase G2,suivant un comportement “switch-like”. Ces observations sont originales, puisque leschelateurs du fer sont connus principalement pour induire un arret lors de la transitionG1/S. Ils offrent egalement des informations sur la possibilite d’etudier l’influence del’hypoxie sur le cycle cellulaire via les cellules FUCCI. Finalement, en considerant lescaracteristiques genetiques connues de la lignee HeLa-FUCCI, nous proposons une hy-pothese cherchant a expliquer sa reponse particuliere aux agents DFO et CoCl2. Nousproposons ainsi une action plausible de ces molecules sur la voie MAPK.
Abstract
The FUCCI system is a promising model to study cell cycle in vivo and in vitro.Because it enables to follow the progression of the cycle using fluorescent microscopy, itcan be used to precisely visualize the effects of external stains on proliferation. However,it was reported that the lack of oxygen strongly affects the fluorophores used in theHeLa-FUCCI cell line. As a consequence, it limits its use in hypoxic conditions. Tostudy the effects of hypoxia on cell proliferation by using this cell line, one could useHIF-1α inducers, such as CoCl2 and DFO, which are often used as hypoxia-mimeticagents. As these iron-chelators also have anti-cancer properties, their biological effectswere studied in various experimental conditions. A great variability of actions werereported. In this study, we investigate for the first time their effect on HeLa-FUCCIcells proliferation dynamics. We find that CoCl2 has a biphasic effect on cell cycle,by promoting or inhibiting the progression into the G1-phase. In presence of DFO,we identified an arrest in the G2-phase, which follows a switch-like behavior. Theseobservations bring original results since iron-chelators are mainly known to inducean arrest at the G1/S transition. They also provide specific informations about thepossibility to use FUCCI cells to study the influence of hypoxia on the cell cycle.Finally, by considering the known genetic characteristics of HeLa cells we propose ahypothesis to explain the particular response of FUCCI cells to DFO and CoCl2. Thediscussion proposes a plausible action of DFO and CoCl2 on the MAPK pathway.
Background
The FUCCI (Fluorescent Ubiquitination-Based Cell Cycle Indicator) cells is a re-cently created line of HeLa cells (cervix carcinoma) [85]. This system uses a couple ofoscillating cell cycle proteins, cdt1 and geminin, respectively labeled with monomericKusabira Orange 2 and monomeric Azami Green. As a consequence, the G1, S, andG2/M phases are labeled with different colors. This cell line is useful to quantify theduration of each phase of the cycle, and to determine the percentage of cycling and

4.2 Etude des effet de DFO et CoCl2 sur le cycle cellulaire 61
non-cycling cells in a non destructive way. Notably, it can be used to visualize in vivothe progression of the cycle [90, 91]. In vitro, it is a good tool to observe the effectson cell dynamics of various environmental strains, such as hypoxia. The study of thecellular and molecular effects of hypoxia is one of the important challenge of modernbiology. Indeed, it is well established that tumor cells undergo chronic hypoxia, due tothe limit of oxygen diffusion in the cancer tissue[13, 99]. This chronic hypoxia corre-lates with an increased resistance to chemotherapy [14, 130]. Notably, hypoxia activatesanti-apoptotic pathways [73] and can induce proliferation of cancer cells. Indeed, eventhough hypoxia is known to induce cell cycle arrest in G1 phase [3], it was shown thatchronic hypoxia can also stimulate proliferation in various cell lines[10–12, 131]. In ageneral way, it seems that a balance exists between death and survival/proliferatingpathways, depending on the duration and severity of the hypoxic event [46]. The com-plexity of the cellular response to hypoxia is controlled by the HIF-1α factor, whichaccumulates when oxygen is lacking [113]. This factor activates signaling pathwayswhich regulate proliferation and death. It was often observed that HIF-1α accumulatesin cancer cells[24, 35]. This accumulation can be due to the physiological chronic hy-poxia of cancer cells or genetically determined, for instance by the mutations affectingthe von Hippel-Lindau (VHL) gene [132].
However, the study of the effects of hypoxia using HeLa-FUCCI cell line is complexsince the lack of oxygen was shown to modify the fluorescence of Kusabira Orangeand Azami Green, as shown by Kaida et al. (2012) [128, 129]. This artefact makesdifficult the use of HeLa-FUCCI cells in real hypoxic conditions. As a consequence,the study of the effect of the hypoxia pathway, notably the stabilization of HIF-1α,on cell cycle dynamics using this cell line could be done through the use of hypoxia-mimetic chemicals. Indeed, various molecules can be used to mimic hypoxia by inducingHIF-1α accumulation, such as cobalt chloride (CoCl2), dimethyloxalylglycine (DMOG),desferrioxamine (DFO). These molecules are also studied for their anti-cancer effect,as iron-chelators [70, 71]. In a general way, they induce HIF-1α accumulation, butthey also have numerous HIF-1α-independent effects [72]. Notably, they are known toinduce apoptosis [73] and cell cycle arrest through complex interactions with regulatingproteins [71]. CoCl2 and DFO are certainly the most commonly used hypoxia-mimeticmolecules [74]. As a consequence, their biological effects were relatively well tested overthe last years. They both induce apoptosis when their concentration is high enough[73, 75, 76]. However, CoCl2 seems to promote cell survival during the first 6-8 hoursof treatment[45, 77]. Cell proliferation in presence of these agents was assessed usingdifferent cell lines. Dai et al (2012) [75] have shown that in presence of CoCl2, PC-2cells growth was stimulated during 72h. Then, a dose-dependent inhibition of growthwas observed, with an increase of the cell death rate. In a general way, CoCl2 andDFO are known to inhibit cell proliferation [74]. However, their precise influence oncell cycle is variable. In presence of CoCl2, some studies report an arrest in the G1
phase [74, 78], or in the G2 phase [79]. In the case of DFO, it is not clear if DFO blocksthe cell cycle in G1, S, or G2 phase. Many studies report an arrest on G1-phase or in Sphase, depending on dose and cell type [74, 80–82]. A recent paper by Siriwardana etal. (2013) [83] could precisely differentiate a mid-G1-phase arrest and a S-phase arrest.This result suggests that these two types of cell cycle blockage act more or less in

62 Hypoxie et cycle cellulaire : approche experimentale
presence of DFO, depending on cell line. In the other hand, some authors also noticedan arrest during the G2-phase [71, 84]. Clearly, the effects of DFO and CoCl2 on cellcycle dynamics closely depends on the dose used, the time of exposure, and the cellline studied.
As a consequence, the use of these molecules as HIF-1α inducers or anti-canceragents on HeLa-FUCCI cells needs a preliminary study of their biological effects onthis cell line. Notably, it is crucial to characterize their effect on cell cycle, using thefluorescent properties of FUCCI cells. It would also bring additional knowledge on thebiological response to these anti-cancer molecules. This work thus proposes, for thefirst time, to investigate the effects of iron-chelator DFO and CoCl2 on HeLa-FUCCIcells proliferation dynamics. We constructed our study as follows. We first verified thata lack of oxygen generates a fluorescence extinction, even in moderate hypoxia (3%O2). To evaluate the toxicity of DFO and CoCl2, we studied their influence on celldeath and cell growth of HeLa-FUCCI cells. This first step is necessary to rigorouslyinterpret the fluorescent data. It also provides interesting comparative results of thecellular effects of the two molecules. Then, we studied their actions on the cell cycledynamics of HeLa-FUCCI cells. We show that this cell line exhibits an original responseto iron-chelators DFO and CoCl2, quite different from observations obtained with othercell lines, mainly showing an arrest at the G1/S transition [71]. In our experimentalconditions, DFO generates a G2-phase arrest of the cell cycle when its concentrationpasses a threshold. CoCl2 acts on cell proliferation following a complex biphasic effect.Depending on dose and time of exposure, it promotes or inhibits the entry into thecycle. By using some known elements of the genetic characteristics of HeLa cells, wepropose a molecular mechanism to explain our observations. It gives hypothesis to testthe action of DFO and CoCl2 on the MAPK pathway.
Methods
Culture conditions HeLa cells expressing the FUCCI probes (HeLa-FUCCI) wereprovided by the RIKEN BRC through the National Bio-Resource Project of MEXT,Japan. Cells were maintained in DMEM (PAA, Piscataway, NJ ), with 10 000 U/ml ofpenicillin-streptomycin and 10% of fetal bovine serum at 37 ◦C in a 5% CO2 humid-ified atmosphere. For CoCl2 and DFO treatments, a 50mM solution of CoCl2 and a20mM solution of DFO were prepared by dissolving cobalt chloride (Cobalt(II) Chlo-ride hexahydrate, Sigma-Aldrich, Saint-Louis, MO) and DFO (Deferoxamine mesylate,Sigma-Aldrich, Saint-Louis, MO) in ultra-pure water. Defined volumes of these solu-tions were added to cells previously cultured for 12 hours on one chamber Lab-tekcover-glasses (initial concentration :1.105 cells per mL). All experiments are comparedto control groups. Cells in control groups were cultured in the same conditions thanthe DFO or CoCl2 groups, but without any chemicals. For the experiments in hypoxiawe used a SANYO MCO-5M cell culture incubator which allows one to impose variousconditions of oxygen pressure on the cells.
Cell death measurements The number of cells and the level of cell death weredetermined using Trypan Blue. After treatment with trypsin, 20µL of cells in DMEM

4.2 Etude des effet de DFO et CoCl2 sur le cycle cellulaire 63
were mixed with 20µL of Trypan Blue (Trypan Blue 0.4%, Invitrogen, Eugene, Ore-gon). Cell concentration and viability were automatically determined using InvitrogenCountess Automated Cell Counter R©. The experiments were performed in quadrupli-cate cultures. Statistical analysis was performed to compare mortality ratio and cellconcentration for the different experimental conditions. We applied Student tests tocompare average values.
Fluorescent imaging Fluorescent images were taken using a Z1 Axio Observer in-verted fluorescent microscope (ZEISS, Iena, Germany). This microscope is equippedwith a EMCCD Camera (Hamamatsu C9100-13) and is piloted with the AxioVisionsoftware. For each cover-glass, corresponding to the different experimental conditions,images were taken with three canals (GFP, Texas-Red and Bright Field), in 40-60 fields,representing a total of about 4000 cells after 48h of growth in normoxic conditions and10000 cells after 96h.
Cell cycle phases definition The definition of the different cell cycle phases wasoriginally presented by Sakaue-Sawano et al. (2008) [85]. It was then notably used byNagano et al. (2013) [89]. Figure 4.2A presents the classical definition of the cell cyclephases in the FUCCI system, and figure 4.2B presents a microscopic field where allphases are visible and can be distinguished Cells with a visible red fluoresence areconsidered to be in the G1 phase, green cells are in the G2 phase, red and green cells inthe S phase. Cells in M phase are not fluorescents. Since our study specifically considersthe entry into the G1 phase, we named G0/G1init the phase of the non-fluorescent cellswhich are not in the M phase. “G0” stands for the quiescent state and G1init stands forthe very beginning (i.e. initiation) of the G1 phase. Indeed, biologically, these cells canbe in a quiescent (G0) state or in early G1 phase [85]. The M and G0/G1init phases weredistinguished using a morphological criterion (figure 1). Indeed, cells in M phase presentcharacteristic features (spheric shape, absence of nucleus). This criterion is based on theclassical tools used to identify mitosis in cell cultures. This phase is highly recognizablesince the cells take a typical morphology, characterized by a spherical shape and theabsence of nucleus.
Images processing and statistics To study the influence of CoCl2 and DFO on thecell cycle, the fluorescent images were processed using ImageJ and Matlab (Mathworks2012a) to count, in each field, the number of fluorescent cells. An example of the imageswe used is given on Figure 1.B. We used ImageJ (ImageJ 1.46a) and Matlab (Mathworks2012a) to analyze these fluorescence data. The images are filtered to eliminate noise,and binarized to isolate the cells. We then create masks that we apply to the originalimages to extract the red and green fluorescences. If they are superior to the noise, theyare taken into account to identify the cell phase. The non-fluorescent cells (M or G0/G1
init) are manually counted. Thus, the percentage P of cells in each phase is obtainedfor each field of the cover-glass considered. To statistically estimate the mean valueof P, we consider in this cover-glass 10 samples of more than 500 cells. In this way,the value of P and its standard deviation is obtained for each experimental conditions.

64 Hypoxie et cycle cellulaire : approche experimentale
We statistically compared these values of P by using Student tests. Four independentseries of experiments were performed in order to test the reproducibility of the results.
Figure 4.2: Fluorescent images of HeLa-Fucci cells. A. Criteria for the classification ofFUCCI cells into each cell cycle phase. From the left to the right : red channel, green channel,and merge of red, green and bright-field channels. Red cells are in the G1 phase, cells with bothred and green fluorescence are in the S phase, green cells are in the G2 phase. Non-fluorescentcells are in M or G0/G1 init phase. These two phases are differentiated with morphologicalcriteria. B. Example of a microscopic field with FUCCI-cells in different phases of the cycle.
Results
Fluorescence extinction of HeLa-FUCCI cells in hypoxic conditions HeLa-FUCCI cells are known to lose their fluorescence under hypoxia [129]. According toKaida and Miura (2012) [128], this is due to the expression of proteins containing non-oxidized chromophores. We first submitted HeLa-FUCCI cells to moderate hypoxia toverify if the extinction occurs in such smoother condition. First observations made afteran exposure of 48h at 3% O2 confirm the existence of a phenomenon of fluorescenceextinction. The fluorescence is recovered after 3 hours in normoxia. Figure 4.3A showsthis effect of hypoxic loss and normoxic recovery of fluorescence in a representativefield of a cover-glass cultivated at 3% O2 and observed along time in normoxic con-ditions. Following the same methods as Kaida et al. (2012) [129], we quantified thisfluorescence recovery of Kusabira Orange 2 and monomeric Azami Green. After 48hat 3% O2, the cells were reoxygenated and we followed the time evolution of the max-imum fluorescence response for the two fluorescence channels. The results presentedwere obtained by sampling a cover-glass into forty microscopic fields, with more thanfifty cells in each one. Images were taken every twenty minutes for about five hours.The maximum fluorescence was extracted along time in each of these fields, and theaverage fluorescence calculated. Figure 4.3B shows that the maximum red fluorescenceincreases for almost 2 hours. Thus, even under moderate hypoxia, the artefact linked

4.2 Etude des effet de DFO et CoCl2 sur le cycle cellulaire 65
to the fluorescence extinction makes difficult the use of HeLa-FUCCI cells to study cellcycle dynamics under real hypoxia. That is why it is necessary to test the relevanceof the hypoxia-mimetic chemicals DFO and CoCl2 to simulate the effects of a lack ofoxygen on cell proliferation.
A
0 30 60 90 120 150 180 21040
50
60
70
80
90
100
110
120
0 50 100 150 200 250 300 3500
20
40
60
80
100
120
Time (min)
%Maximum
response
%Maximum
response
Time (min)
B C
*
*
*
*
20μm 20μm 20μm
Figure 4.3: Fluorescence recovery after reoxygenation of Hela-FUCCI cells exposed tomoderate hypoxia (3% O2 during 48h). A. Fluorescence imaging of FUCCI cells after 20, 120and 220 min of reoxgenation (from the left to the right). B. The red and C. the green fluores-cence signals after reoxygenation are plotted as functions of time. The values are calculatedby considering the average of the 10% most fluorescent pixels of each field, and normalizedto the maximal value, as done by Kaida et al. (2012) [129]. The statistics are calculatedusing Student’s test, with respect to the fluorescence measured 20min after reoxygenation.∗P<0.05, ∗∗P<0.01.
Estimation of DFO and CoCl2 toxicity In order to determine the range of con-centrations to be used, we first investigated the toxicity of DFO and CoCl2 after 48hof treatment for our cell line. For DFO, we found a significant increase of cell deathcompared to control for a concentration of 1mM, compared to a control cultured in thesame conditions but without DFO. In the case CoCl2, this threshold concentration is400µM (data not shown). Both values are much higher than those reported for othercell lines. For example, the apoptotic ratio is already significant at 200µM CoCl2 forPC-2 cells [75] and also for mouse embryonic stem cells where Lee et al. (2013) [76]have reported a mortality ratio of 40% after 48h at 150mM CoCl2. For DFO, Guo et al.(2006) [73] found an effect of a 48h exposure to DFO on cell death for a concentrationof 100µM. As a consequence, it appears that the toxicity of these molecules stronglydepends on the cell line. In order to isolate the effects of DFO and CoCl2 on the cell

66 Hypoxie et cycle cellulaire : approche experimentale
cycle from its influence in inducing cell death, we limited the use of these molecules totheir non-toxic concentration range. In the rest of the study, we then used concentra-tions up to 500µM for DFO, and up to 200µM for CoCl2.
0
0.5
1
1.5
2
2.5
3
3.5
4
4.5
5
*
*
24h 48h 72h 120h
250
500
Cellde
athratio
(normalized
)
0 20 40 60 80 100 1200
5
10
15
20
25
30
35
40
45
Control
*
*
*
*
Time (h)
Cellconcen
tration(10^
5cells/m
L)
500100
A
B
Figure 4.4: Effect of DFO on cell growthand mortality. A. Mortality of HeLa-FUCCIcells treated with DFO (100, 250 and 500µM)during 24h, 48h, 72h and 120h. The valueswere normalized, at each time, to the mortal-ity of the control group (red dotted line). B.Growth profile of HeLa-FUCCI cells treatedwith 100/500µM of DFO. Statistics were cal-culated using Student’s test, with respect tothe control group. ∗P<0.05, ∗∗P<0.01.
DFO promotes cell death and inhibits cell growth We first measured the mor-tality (or cell death ratio) for different concentrations of DFO, at 24h, 48h, 72h, and120h. Figure 4.4.A shows the evolution of mortality after a treatment from 24 to 120hours by 0, 100, 250 or 500 µM DFO. We observe that the influence of DFO on celldeath is visible after a relatively important delay. Indeed, for the concentrations weused, DFO has no effect before 120h of treatment. Thus, HeLa-FUCCI cells are rela-tively resistant to long-term toxicity of DFO, since Renton et al. (1996) [84] found atoxic effect at 10µM DFO after 3 days in glioma cells. We then built the cell growthprofile by evaluating the total cell concentration (live and dead cells) in the culture(Fig. 4.4.B). DFO inhibits cell growth, and this effect is not due to cell death. As aconsequence, it may be due to its influence on cell cycle dynamics.
Dose and time dependency of CoCl2 effect on cell death and growth Wedid the same work with CoCl2, for 0, 100 and 200µM (Fig.4.5). The results obtained

4.2 Etude des effet de DFO et CoCl2 sur le cycle cellulaire 67
0
0.2
0.6
0.8
1
1....2
1.....4
1.6
1.8
0.4
2.0
2.2
2.4
*
*
*
*
*
*
B
24h 48h 72h 120h
Time (h)
Control
200100
Cellc
once
ntra
tion
(10^
5ce
lls/m
L)
100
Celld
eath
ratio
(nor
mal
ized)
0.2
0.4
0.6
0.8
1
1.2
1.4
1.6
1.8
2
2.2
2.4 200
A
B
Figure 4.5: Effect of CoCl2 on cell growthand mortality. A. Mortality of HeLa-FUCCIcells treated with CoCl2 (100, 200µM) dur-ing 24h, 48h, 72h and 120h. The values werenormalized, at each time, to the mortalityof the control group (red dotted line). B.Growth profile of HeLa-FUCCI cells treatedwith 100/200µM CoCl2. Statistics were calcu-lated using Student’s test, with respect to thecontrol group. ∗P ¡0.05, ∗∗P¡0.01.
exhibit a more complex cellular response. We first observe three steps in the evolutionof the cell death ratio. At 24h, CoCl2 induces cell death (multiplied by 1.8 compared tocontrol for the 200µM group). After this first response of the cells to the chemical agent,CoCl2 has a zero (at 48h) or negative effect (at 72h, 100µM group) on mortality. Then,at 120h, CoCl2 induces cell death. The action of CoCl2 is time and dose dependent,with a complex evolution during the treatment. At short and long time-scale, CoCl2promotes cell death. At medium time-scale, it does not have any effects, or it reducescell death. The growth profile shows that at the beginning of the treatment (24h), thecells concentration in the CoCl2- treated groups is more important than in the controlgroup (increase of 50% for the 200µM group compared to control). This observationis statistically significant (P<0.05). Therefore, cell growth is stimulated by CoCl2. Asmortality is more important at 24h in CoCl2-treated group than in control group, thisincrease of cell concentration is certainly due to a stimulation of cell division. At theopposite, after 48h of treatment, an inhibition of cell growth is observed for the 200µM

68 Hypoxie et cycle cellulaire : approche experimentale
group (decrease of 45% at 72h). This behavior must be due to an inhibition of cell divi-sion, up to 120h. After this time, the increase of the dead cells ratio may influence thepopulation growth. The 100µM group grows with the same kinetic as the control group.
These results shows that CoCl2 and DFO have very different influences on celldeath and cell growth. DFO rapidly inhibits cell proliferation, and induces cell deathafter 120h. CoCl2 acts in a more complex manner. It promotes cell death or survival,and inhibits or promotes cell growth depending on dose and time of exposure. Thecomparison between mortality and population growth enables to estimate the divisionrate of the cell. For CoCl2, at 24h, a reasonable hypothesis is that the proliferation rateis necessarily much higher for the 200µM group than for the control group, since thepopulation growth is more rapid whereas the mortality is higher. As a consequence, ourresults with HeLa-FUCCI cells suggest that the biphasic effect observed in populationgrowth is most probably due to modifications of the cell cycle dynamics. In a similarway, the inhibition of cell growth in the DFO-treated groups is not due to an increaseof mortality, but certainly to a blockage of cell cycle progression.
DFO promotes cell cycle arrest in G2-phase of HeLa-FUCCI cells By usingfluorescent microscopy, we first imaged the progression of the cell cycle in control andDFO-treated groups. Figure 4.6 gives a representative example of the observed effectsof DFO on cell cycle. Compared to the control group, the cells treated during 24h witha 500µM solution of DFO show a very important proportion of green cells. This obser-vation suggests that DFO tends to block the cell cycle during the G2-phase. In order totest and precise this hypothesis, we evaluated the temporal evolution of the G2-phaseproportion for populations treated with a large range of DFO concentrations, from 10to 500µM. Figure 4.7 presents the results. They were calculated using the statisticalmethod described in the Material and Methods section. We first observe that DFO hasan effect on cell cycle for concentrations bigger than 10µM. For concentrations from25 to 500µM, the proportion of cells in the G2-phase is above 80% after 72h. It meansthat nearly all the cells are blocked in G2-phase. The kinetics of cell cycle arrest strictlydepends in this case on DFO concentration. Thus, the DFO-mediated cell cycle arrestin the G2 phase appears to be a switch-like phenomenon. At low concentration, there isno effect. When DFO level reaches a threshold, more than 80% of the cells are blockedafter 72h. The kinetics of this blockage at the population scale depends on the DFOconcentration.
CoCl2 has a biphasic effect on HeLa-FUCCI cells proliferation dynamicsWe then applied the same protocol to characterize the influence of CoCl2 on the cellcycle dynamics. By using the cell cycle phase definition described in the Material andMethods section, we could measure the ratio of non-cycling cells (G0/G1init cells). Weperformed this measurement for control, 100µM and 200µM groups, after 24h and 72hof treatment (Fig.4.2.1). At 24h, CoCl2 decreases the ratio of G0/G1init cells (decreaseof 35% for 100µM and 30% for 200µM compared to control). At 72h, the 100µM group

4.2 Etude des effet de DFO et CoCl2 sur le cycle cellulaire 69
Figure 4.6: Visualization of the effects of DFO on cell cycle progression of HeLa-FUCCIcells. A. Example of a representative field of a cover-glass cultivated during 24h in normalconditions (control group). B. Representative field of a cover glass cultivated during 24h with500µM DFO.
0 10 20 30 40 50 60 70 8010
20
30
40
50
60
70
80
90
100
Control10μM25μM50μM100μM250μM500μM
Time (h)
%G2
phase
Figure 4.7: Time evolution of the percent-age of cells in the G2 phase in cultures submit-ted to different levels of DFO. The ratio (ex-pressed in %) of HeLa-FUCCI cells in G2-phaseis measured along time, for various concentra-tions of DFO (from gray to black : control,10µM, 25µM, 50µM, 100µM, 250µM, 500µM).Statistics were calculated using Student’s test,with respect to the control group. ∗P<0.05,∗∗P<0.001, ∗ ∗ ∗P<0.0001.
does not show any significant changes in G0/G1init ratio compared to the control group.The 200µM group is characterized by an important increase of G0/G1init ratio comparedto control (increase of 150%). Interestingly, there is no significant change in the G2+Mand G0+G1 cells percentage (data not shown). The reproducibility of these results wastested with four independent series of experiments. These observations thus suggestthat CoCl2 influences the transition between G0/G1init and G1 phase, that is to saythe entry into the cycle. We conclude that the HIF-1α inducer CoCl2 modulates theability of the cells to begin their cycle. Interestingly, this influence of CoCl2 is biphasic,and determined by time and dose. After 24h of treatment, CoCl2 strongly promotesentry into the cycle. At 72h, this effect vanishes for the 100µM group, and is reversedfor the 200µM group. CoCl2 becomes an inhibitor of the entry into the cell cycle.

70 Hypoxie et cycle cellulaire : approche experimentale
0.5
1
1.5
2
2.5
%G0
/G1initph
ase(normalized
)
0 100 200
72h
* **
24h
[CoCl2]
Cell cycleinhibition
Cell cycleactivation
**
**
Figure 4.8: Effect of CoCl2 on the entryinto the cell cycle. The ratio of HeLa-FUCCIcells which have stopped cycling (G0/G1init
cells) is measured after a 24h or 72h treatmentwith 100 or 200µM CoCl2, and normalizedto the normoxic value (horizontal red dottedline). The statistics were calculated using Stu-dent’s test, with respect to the control group(without CoCl2).
∗P<0.001, ∗∗P<0.0005.
Discussion
In this work, we tested for the first time, on HeLa-FUCCI cells, the effect on celldeath, cell growth and cell cycle of two widely used hypoxia-mimetic molecules (DFOand CoCl2). Our principal result concerns the characterization of the cell cycle dynamicsusing fluorescent microscopy. We found that CoCl2 has a biphasic effect on this cellline. It first promotes the progression into the G0/G1 phase, and inhibits it in a secondtime. DFO was found to induce a cell cycle arrest in G2 phase, following a switch-likebehavior. When its concentration reach a threshold (10µM), more than 80% of the cellsstops in this phase with a kinetics depending on DFO concentration. This observationleads to various types of conclusions. First, it provides interesting informations aboutthe use of hypoxia-mimetic agents on FUCCI cells. We notably found that the effectsof the molecule used are different from the known cellular response of hypoxia, whichtends to promote cell cycle arrest in G1 phase [3, 48, 51]. We note here that the useof HeLa-Fucci cells allowed us to distinguish the G0 from a G1init phase, which wouldnot have been possible with other techniques such as flow cytometry. We could thusprecisely quantify the effects of CoCl2 on the entry into the cycle. From our work,it appears that DFO and CoCl2 certainly have a large range of biological effects onHeLa-FUCCI cells which hides the consequences of HIF-1α induction. This conclusionshows strong obstacles to the use of HeLa-FUCCI cells to study the effect of hypoxiaon the cell cycle. However, as we have shown that the fluorescence recovers after about2-3 hours in normoxia, this cell line can be a good tool to study the influence ofreoxygenation on cell cycle dynamics. The tools we developed in this study could beused towards this interesting perspective.
Second, the cellular response to Fe-depletion has been intensely studied over thislast years [71]. In this framework, the results we obtained with the HeLa-FUCCI cellline are surprising. Whereas these two molecules were often shown to promote cell cyclearrest in G1 or S phase, they act differently in HeLa-FUCCI cell line. The biphasic effectof CoCl2 on cell growth was reported in the study by Dai et al. (2012) [75], but the

4.2 Etude des effet de DFO et CoCl2 sur le cycle cellulaire 71
authors did not explain this observation by precisely studying the cell cycle dynamics.As the FUCCI cells allow us to follow the G0/G1 progression (non-colored to red cells),we could observe the biphasic effect of CoCl2 on the entry into the cycle. Moreover, theG2-phase arrest in presence of DFO was rarely observed [71]. How can we explain theparticular features of the response of HeLa-FUCCI to iron-chelators DFO and CoCl2 ?In their review, Yu et al. (2007) [71] note that one of the principal actor of the G1/Sarrest in presence of these molecules is the p53 protein, which inhibits the cyclins D andE. Yet, HeLa cells are known to have low p53 activity [133–135]. This could explainthe absence of a G1-phase arrest. This idea is confirmed by the fact that cell linesexhibiting a G1-phase arrest in presence of DFO or CoCl2 seem to present a wild-typep53 activity : hMSC [74], UCC-2 [78], T-Lymphocytes [80]. Interestingly, the studyby Brodie et al. (1993) [81] quantified the proliferation of two cell lines in presence ofDFO. The SKN-SH cell line (neuroblastoma) is very sensitive to G1 phase arrest. It hasa non-mutated p53 activity, as suggested by the results of Kim et al. (2002) [136]. Onthe contrary, the T98G cell line (glioblastoma) is not sensitive to G1 phase arrest, andit presents a low p53 activity [137]. The low p53 activity of HeLa cells is also coherentwith the high resistance to apoptosis we observed in this study. If p53 cannot explainthe cell response to DFO and CoCl2, which pathway could be involved ?
The MAPK signaling cascade is strongly activated by iron-chelators [71]. Morespecifically, it was shown that DFO and CoCl2 activate this pathway [79, 138–140].Besides, it is functional in the HeLa cell line [141, 142]. The enzymes of the MAPKfamily, notably p38, ERK and MEK have numerous effects on the cell cycle. First, theyare known to inhibit the G2/M transition, and to promote G2-phase arrest of the cellcycle [143]. Second, it was shown that they have an effect on G0/G1 progression. Onthe one hand, ERK1/2 can inhibit the progression into the G0/G1 phase by promotingthe synthesis of Mirk/Dyrk1B [144]. On the second hand, it was recently shown that inHeLa cells, ERK1/2 promotes proliferation by activating the progression into the G1
phase [145]. Thus, ERK can have two opposite effects on cell proliferation. It providesa promising approach to explain the biphasic response to CoCl2 we observed withHeLa-FUCCI cells. Interestingly, a biphasic effect related to MAPK activation by Cdand Hg was observed by Hao et al. (2009) [146]. As a consequence, our hypothesisthat the response of HeLa-FUCCI cells to CoCl2 treatment is due to the activationof the MAPK pathway may be relevant. Following this view, in presence of CoCl2,proteins activating cell proliferation are primarily synthesized. The work of Bai et al.(2015) [145] suggests that the p-c-fos protein could be involved in this step. Then,Mirk/Dyrk1B gene is expressed, and the progression into the G0/G1 phase is sloweddown. As our experiments show that the biphasic time-response to CoCl2 is coupled toa biphasic dose-response, we can suggest that the differential activation of the Mirk andp-c-fos pathways could also depend on the concentration of the chemical. However, inthis framework, it remains difficult to understand why DFO and CoCl2 have differentactions on the cell cycle dynamics. It may depend on the type of enzymes activated byeach of these agents. DFO would activate the MAPK-mediated G2-phase arrest, andCoCl2 the biphasic action of MAPK on the G0/G1 progression. The complexity of theMAPK pathway and the huge number of its targets do not allow to propose a moreprecise hypothesis. In all cases, the idea of a predominance of the MAPK pathway,

72 Hypoxie et cycle cellulaire : approche experimentale
because of the inactivity of p53 activity, is an interesting hypothesis. It could be testedwith molecular biology protocols. There would be many approaches to test. That iswhy we chose to limit our work to this first investigation at the cellular scale. Forinstance, it would be interesting to observe the effects of chemical inhibitions of theMAPK signaling cascade, as made in previous studies [143, 145]. If the hypothesis isverified, HeLa-FUCCI cells would be a good tool to precisely study the poorly knownimpact of iron-chelators agents on the MAPK pathway.
4.2.2 Conclusion
Dans ce deuxieme article, nous avons utilise les cellules HeLa-FUCCI pour testerles effets sur la proliferation de deux molecules largement utilisees pour mimer l’hy-poxie (DFO et CoCl2). Il est apparu tout d’abord que CoCl2 avait un effet biphasiquesur cette lignee cellulaire : la molecule promeut en un premier temps la progressiondans la phase G1, avant de l’inhiber. Nous avons egalement montre que DFO indui-sait un arret en phase G2, selon un comportement “switch-like”. Lorsque sa concen-tration depasse un certain seuil (10µM), plus de 80% des cellules arretent leur cycleen suivant une cinetique dependant de la concentration en DFO. Differents types deconclusions peuvent etre tirees de ces resultats. En premier lieu, ils fournissent desindications sur la pertinence de l’utilisation de molecules pour mimer l’hypoxie sur lalignee HeLa-FUCCI. Les effets observes s’ecartent notablement des reponses connuesau stress hypoxique, qui tend a induire un arret du cycle en phase G1 [3, 48, 51].Il semble donc que DFO et CoCl2 aient un grand eventail d’effets biologiques, quimasquent les consequences de l’induction de HIF-1α. Leur utilisation ne peut donc pasetre consideree comme equivamente a une hypoxie reelle. Notons que d’autres moleculesinductrices de HIF-α pourraient etre utilisees pour etudier les effets de l’hypoxie surles cellules HeLa-FUCCI. Le DMOG, par exemple, est un inhibiteur competitif desPHDs [147]. Par ce biais, il stabilise HIF-1α [148]. Cependant, le DMOG etant unanalogue du 2-oxoglutarate, il inhibe egalement les dioxygenases dependantes du 2-oxuglutarate [149]. Etant donne, en outre, le phenomene d’extinction de la fluorescenceque nous avons observe, il apparaıt donc que les cellules FUCCI ne sont pas un materielaise a utiliser pour etudier les effets de l’hypoxie sur la dynamique du cycle. Cepen-dant, elles offrent la possibilite de pouvoir suivre le comportement cellulaire lors d’unereoxygenation. Le retablissement de la fluorescence apres 2-3h en normoxie autoriseen effet a suivre la dynamique du cycle apres un cycle hypoxie/reoxygenation. Nousaborderons ce theme dans le chapitre suivant.
Deuxiemement, notre travail apporte des complements interessants a l’etude del’influence des molecules perturbant l’utilisation cellulaire du fer sur la dynamiquedu cycle cellulaire. Ce champs d’etude est particulierement dynamique actuellement,de part les proprietes anti-cancereuses de ce type de molecules [71]. L’utilisation descellules HeLa-FUCCI apporte ici une plus-value importante, puisqu’elles nous perme-ttent de suivre precisement la progression de la phase G1. Notamment, nous avons pudifferentier la phase G1 proprement dite d’une phase G0/G1init
, ce qui n’aurait pas etepossible en cytometrie de flux. Nous avons donc pu quantifier finement les effets de

4.2 Etude des effet de DFO et CoCl2 sur le cycle cellulaire 73
CoCl2 sur l’entree dans le cycle. Les resultats que nous avons obtenus avec les cel-lules HeLa-FUCCI sont surprenants. Alors que ces deux molecules sont connues pourprovoquer un arret du cycle en phase G1 ou S, leurs effets sont ici tres differents. Toutd’abord, l’effet biphasique de CoCl2 sur la croissance cellulaire a ete mis en evidencepar Dai et al. (2012) [75], mais les auteurs n’ont pas complete ce resultat par l’etudefine de la dynamique du cycle cellulaire. En suivant finement la progression dans laphase G1, nous avons montre que CoCl2 pouvait promouvoir ou inhiber l’entree dans lecycle. D’autre part, l’arret en phase G2 en presence de DFO n’a ete que tres rarementobserve [71]. Comment pouvons nous expliquer ces caracteristiques de la reponse descellules FUCCI aux agents DFO et CoCl2 ? Dans leur review, Yu et al. (2007) notentque l’un des principaux acteurs de l’arret en G1/S en presence de ces molecules estla proteine p53, qui inhibe les cyclines E et D. Or, les cellules FUCCI sont connuespour avoir une activite p53 tres faible [133–135]. Cela pourrait donc expliquer l’absenced’arret en G1/S. Cette idee est confirmee par le fait que les lignees cellulaires exhibantce type de blocage du cycle en presence de DFO ou de CoCl2 semble presenter uneactivite p53 normale : hMSD [74], UCC-2, [78], Lymphocytes-T [80]. De maniere sig-nificative, l’etude de Brodie et al. (1993) [81] quantifie la proliferation de deux ligneescellulaires en presence de DFO. Les cellules SKN-SH (neuroblastome) sont tres sensi-bles au blocage en G1/S ; elles presentent en outre une activite p53 normale [136]. Al’inverse, les cellules T98G (glioblastome) ne sont pas sensibles a l’arret en phase G1,et sont caracterisees par une faible activite de la proteine p53 [137]. L’idee d’une inhi-bition de la voie p53 dans les cellules HeLa-FUCCI est confirmee par la forte resistancea l’apoptose que nous avons constatee dans cette etude. Si la proteine p53 ne peut pasexpliquer les effets de DFO et CoCl2, quelle voie de signalisation est impliquee ?
La cascade de signalisation MAPK (MAP Kinases) est fortement activee par leschelateurs du fer [71]. Plus specifiquement, il a ete montre que DFO et CoCl2 activentcette voie [79, 138–140]. En outre, elle est fonctionnelle dans les cellules HeLa [141, 142].Les enzymes de la famille MAPK, notamment p38, ERK et MEK ont de nombreux effetssur le cycle cellulaire. Premierement, elles sont connues pour inhiber la transition G2/M,et pour promouvoir un arret en phase G2 du cycle cellulaire [143]. Deuxiemement, il aete montre qu’elles ont egalement un effet sur la progression en phases G0/G1. D’unepart, ERK1/2 peut inhiber la progression de la phase G1 en promouvant la synthesede Mirk/Dyrk1B [144]. D’autre part, il a ete montre recemment que dans les cellulesHeLa, ERK1/2 joue sur la proliferation en activant l’entree dans le cycle. Ainsi, lesERK peuvent avoir deux effets opposes sur la proliferation cellulaire. Cette donneefournit une approche prometteuse pour comprendre la reponse biphasique des cellulesFUCCI au CoCl2. De maniere interessante, un tel effet biphasique lie a l’activation dela voie MAPK a ete observe par Hao et al. (2009) [146]. Notre hypothese est alors lasuivante. En presence de CoCl2, les proteines activant le cycle cellulaire sont d’abordsynthetisees. Les travaux de Bai et al. (2015) [145] suggerent que la proteine p-c-fospourrait etre impliquee dans cette etape. Puis, le gene Mirk/Dyrik1B est exprime, etla progression dans la phase G1 est ralentie. Etant donne que nos experiences montrentque la reponse biphasique au CoCl2 depend du temps, mais egalement de la dose,nous pouvons suggerer que l’activation differentielle des voies Mirk et p-c-fos pourrait

74 Hypoxie et cycle cellulaire : approche experimentale
dependre egalement de la concentration de la molecule. Cependant, dans ce cadre,il reste difficile de comprendre pourquoi DFO et CoCl2 ont des effets differents sur ladynamique du cycle cellulaire. Cela pourrait dependre du type d’enzymes sur lesquellesjouent chacun de ces agents. DFO activerait l’arret en G2 medie par la voie MAPK, etCoCl2 l’action biphasique des MAPK sur la progression en phase G1. La complexite decette voie de signalisation, et le nombre important de ses cibles empeche de proposerun scenario plus precis. Dans tous les cas, l’idee d’une predominance de la voie MAPKdue a une inactivite de la proteine p53 est une hypothese interessante. Nous avonsresume nos conclusions sur la figure 4.9. Il serait necessaire, bien evidemment, de lestester dans le cadre d’une etude plus poussee de biologie moleculaire. Par exemple,il pourrait etre interessant d’observer les effets d’inhibitions chimiques de la voie designalisation MAPK. Si notre hypothese est verifiee, les cellules HeLa-FUCCI pourraitetre un bon outil pour etudier l’impact peu connu des molecules diminuant l’utilisationintra-cellulaire du Fer sur la cascade MAPK.
4.3 Recuperation apres blocage en phase G2
Dans l’article precedent, nous avons montre l’existence d’un blocage du cycle enphase G2 apres traitement au DFO. Pour des concentrations superieures a 10µM, lescellues HeLa-FUCCI subissent en effet un arret progressif en phase G2, dont la cinetiquedepend de la concentration en agent chimique. Afin de completer nos resultats, nousavons etudie la reversibilite de l’effet de DFO sur le cycle. Dans quelques publicationstraitant de la proliferation en presence de chelateurs du fer, cet aspect du problemeest aborde. Dans les travaux de Broodie et al. (1993) [81], le milieu contenant duDFO (40µM) est remplace par du milieu frais apres 48h de traitement. Les auteursobservent un redemarrage du cycle dans le cas de cellules de glioblastome, mais pasdans le cas du neuroblastome. Metzendorf et al (2010) [82] ont quant a eux montreque l’inhibition etait reversible apres 48h en presence de 10µM de DFO. Nous avonschoisi de realiser une etude plus systematique sur les cellules HeLa-FUCCI, afin dedetecter d’eventuels seuils d’irreversibilite pour l’action de DFO. Le protocole choisia ete le suivant. Apres differents temps d’exposition (24h ou 48h) a 50µM ou 250µMde DFO, les lames sont rincees plusieurs fois et le milieu remplace par du milieu frais.La dynamique du cycle est alors suivie et quantifiee en microscopie de fluorescence, ensuivant le methodologie decrite precedemment. La figure 4.10 donne a voir l’evolutionde la fluorescence dans un champs representatif, apres 24h de traitement avec 250µMde DFO puis changement du milieu. Il apparaıt qu’apres un certain temps de latence(une vingtaine d’heure), les cellules initialement bloquees en phase G2 tendent a rentreren mitose, initiant ainsi le redemarrage du cycle : de nombreuses cellules en phase G1
et S sont visibles apres 30h. Il semble donc qu’apres 24h de traitement, le blocagesoit reversible meme pour une forte dose de DFO. Afin de quantifier cette observation,nous avons calculer l’evolution de la proportion de cellules en phase G2 au cours dutemps apres le changement de milieu. Les resultats sont presentes sur la figure 4.11 A.On constate une baisse significative de la quantite de cellules encore bloquees apresenviron 20h. Apres environ 50h, la proportion de cellules en G2 se stabilise autour de

4.3 Recuperation apres blocage en phase G2 75
CoCl2
p-c-fosMirk
+ +
+
-
DFO
ERK/MEK ?
-
ERK ?+
+
p53
-
DFO CoCl2
+ +
Figure 4.9: Modele schematique des interactions possibles de DFO et CoCl2 avec la voieMAPK et le cycle cellulaire. Notre hypothese est la suivante : dans les cellules HeLa-FUCCI,en l’absence de proteine p53 active, la reponse des cellules HeLa-FUCCI a DFO et CoCl2passe par la voie MAPK. DFO pourrait induire ainsi un blocage en phase G2, et CoCl2 uneffet biphasique dose et temps dependant sur la progression de la phase G1.
25%. Cette valeur correspond a la valeur controle (proportion de cellules en phase G2
dans une population de cellules HeLa-FUCCI en croissance sans DFO). Nous pouvonsen deduire que la recuperation de cycle cellulaire est complete apres ce delai. La memedemarche a ete suivie apres 48h de traitement avec 250µM et 50µM de DFO. Lesresultats sont presentes sur la figure 4.11 B. Pour 250µM, le blocage est irreversible.Apres environ 60h, une apoptose massive des cellules a ete observee. En revanche, dansle groupe expose a 50µM, le blocage en phase G2 est reversible : a partir de 20h environ,la proportion de cellules en phase G2 diminue jusqu’a atteindre le niveau du groupecontrole apres 60h. Cette serie d’experiences montre donc que la reversibilite de l’actionde DFO sur le cycle cellulaire depend du temps d’exposition et de la concentration dela molecule. De maniere plus generale, ce resultat est interessant du point de vue destherapies anti-cancereuses. En effet, comme nous l’avons rappele, les chelateurs du fer

76 Hypoxie et cycle cellulaire : approche experimentale
sont largement etudies actuellement pour leurs vertus anti-tumorales. Ces moleculestendent en effet a promouvoir le blocage du cycle et l’apoptose [71]. Notamment, nousavons ici un exemple d’action synchronisatrice d’un agent chimique : sous l’effet deDFO, les cellules voient leur cycle bloque en phase G2. Lorsque l’agent est extrait dumilieu, les cellules relancent leur cycle, ce qui tend a les synchroniser en phase M.Or, la synchronisation des cellules tumorales est une strategie pouvant etre utiliseedans le cadre de therapies anti-tumorales : elle permet en effet de maximiser l’efficacitede drogues actives sur une phase donnee du cycle. Enfin, nous avons ici un nouvelexemple de l’interet des cellules HeLa-FUCCI pour suivre en direct les modificationsde la dynamique de proliferation.
4.4 Effets de la reoxygenation
S’il est difficile d’utiliser les cellules HeLa-FUCCI en conditions hypoxiques, ellespeuvent etre, en revanche, utiles pour etudier la dynamique du cycle lors du retour a lanormoxie. En effet, comme nous l’avons montre dans l’etude precedente, la fluorescenceest entierement recuperee 3h apres la fin de l’episode hypoxique. Il est donc possible,moyennant ce temps de latence, de quantifier la proliferation en microscopie de fluores-cence. Nous avons donc genere un episode d’hypoxie/reoxygenation en soumettant lescellules a un traitement de 24h a 0.3% O2, avant de les replacer en condition normox-ique. Nous avons ensuite suivi la methodologie habituelle pour quantifier la dynamiquedu cycle au cours du temps. Les resultats sont presentes sur la figure 4.4. Nous pouvonsobserver une augmentation significative de la proportion de cellules en phase S par rap-port au controle (multiplie par 3,5 apres 23h de reoxygenation). Si l’on regarde plusprecisement cette evolution, on peut mettre en evidence deux phases d’augmentation,suivi d’une diminution de la proportion, relative au controle, de cellules en phase S.L’interpretation que nous proposons est la suivante. Apres la reoxygenation, les cellulessortant de la phase G1 sont ralenties en phase S, ce qui explique la premiere phase decroissance. Les cellules en S et G2 accomplissent leur cycle, et sont bloquees en phaseS au cycle suivant, c’est a dire environ 24h apres la reoxygenation. Cela correspond aupic observe entre 20h et 25h. L’entree en phase G2 entraıne ensuite la diminution de laproportion de cellules en phase S. Cette hypothese merite d’etre testee plus rigoureuse-ment, ce que nous n’avons pas pu faire pour le moment. Notamment, il serait necessairede suivre la duree du cycle cellule par cellule, et pas seulement de maniere statistique.Il faudrait egalement etudier cette dynamique sur un plus long terme, afin de quantifierla cinetique du retour a la duree normale du cycle. Neanmoins, ce premier resultat, misau regard des donnees de la litterature, permet d’ouvrir quelques pistes de reflexion.
L’arret ou le ralentissement de la phase S du cycle lors d’episodes de reoxygenationest en effet connu. Seim et al. (2003) [150] l’ont notamment mis en evidence sur descellules T-47D. Kim et al. (2007) [151] ont quant a eux travaille sur l’effet de lareoxygenation sur le cycle des cellules mononucleaires sanguines peripheriques (PBMC).Ils ont mis en evidence une augmentation de la proportion de cellules en phase S, pas-sant de 20% en normoxie et en anoxie a 30% apres 3h ou 6h de reoxygenation. Lesauteurs ont lie ce resultat a l’activation du point de controle S/G2, dependant de la

4.4 Effets de la reoxygenation 77
Figure 4.10: Reprise du cycle cellulaire apres blocage en G2 sous DFO. Apres un traite-ment de 24h avec 250µM de DFO, le milieu de culture est renouvele, et des images enfluorescence sont prises regulierement. Les images sont prises dans un champ representatif, adifferents temps apres le changement de milieu : 0h (A), 20h (B), 22h (C), et 30h (D).
voie ATM. Cette idee est en accord avec plusieurs travaux de biologie moleculaire,montrant l’induction de proteines liees a la reparation de l’ADN, notamment les voiesATR et chk, ainsi que de p53 [152–154]. Cependant, il apparaıt que ces reseaux sontactives tout d’abord en hypoxie, en l’absence de lesions apparentes de l’ADN. Com-ment des lors expliquer l’activation de ces voies moleculaire ? L’hypothese retenue estque la reoxygenation induit un nombre important de lesions genetiques, qu’il con-vient de reparer afin de garantir la viabilite cellulaire [152, 153]. La cellule est ainsipremunie contre les dangers d’une accumulation d’anomalies genetiques lors du retour

78 Hypoxie et cycle cellulaire : approche experimentale
0 5 10 15 20 25 30 35 40 45 5010
20
30
40
50
60
70
80
90
100
Contrôle
A
Temps (h)
Changement du milieu
% p
hase
G2
250μM
0 10 20 30 40 50 60 7010
20
30
40
50
60
70
80
90
100
250μM
50μM
Temps (h)
%ph
aseG2
Changement du milieu
Contrôle
B
Figure 4.11: Evolution de la proportion de cellules en phase G2 apres traitement au DFOpendant 24h (A) et 48h (B). Le contole correspond a une population de cellules en croissancesans DFO.
a la normoxie. De fait, la phase S est particulierement sensible a l’apoptose liee ala reoxygenation : dans ces conditions, l’inhibition des voies de reparation de l’ADNconduit a l’apoptose [153, 154]. Nos resultats sont en coherence avec ces conclusions.Dans ce cadre, il est en effet permis de supposer que nos observations sont liees al’induction de dommages genetiques par la reoxygenation : leur reparation genere unralentissement de la phase S. L’utilisation de cellules FUCCI nous a en outre permisd’etudier ce phenomene en continu pendant 30h, ce qui est une contribution originale.Comme nous l’avons deja note, il reste cependant encore beaucoup a faire pour tirerpartie au maximum des informations que peuvent fournir les FUCCI sur cette ques-tion. Une etude cellule a cellule peut notamment permettre de preciser et de consoliderces premieres observations. Elle offrirait en effet la possibilite d’etudier finement ladynamique temporelle du phenomene de blocage/ralentissement.
3 8 13 18 23 28 33
1
1.5
2
2.5
3
3.5
4
4.5
0
Temps (h)
Prop
ortio
n de
cel
lule
s en
pha
se S
(n
orm
alis
atio
n au
con
trôle
)
Réoxygénation
Figure 4.12: Evolution du nombre decellules en phase S lors d’un episode dereoxygenation. Apres un traitement de 24h a0,3% O2, les cellules sont replacees en nor-moxie et l’evolution de la dynamique du cyclesuivie au cours du temps. Les resultats sontnormalises par rapport a un groupe controlecroissant en conditions normoxiques

4.5 Conclusion 79
4.5 Conclusion
Dans ce chapitre, nous avons cherche a etudier experimentalement l’influence del’hypoxie sur le cycle cellulaire, en tirant partie des cellules HeLa-FUCCI. Nous avonstout d’abord montre que la sensibilite des fluorophores a la pression d’oxygene rend diffi-cile l’utilisation de cette lignee cellulaire, meme dans des conditions d’hypoxie moderee.Nous avons alors axe notre etude selon deux grandes directions : l’influence de fer DFOet CoCl2, utilises tant comme inducteurs de HIF-1α que comme molecules anti-cancer,et l’impact de la reoxygenation sur la dynamique du cycle cellulaire. Nous avons ainsipu montrer l’existence d’un effet biphasique de CoCl2 sur l’entree dans le cycle, ainsique d’un blocage en phase G2 sous l’effet de DFO. Dans ce dernier cas, la concentrationet le temps d’exposition determinent l’irreversibilite du blocage. Ces resultats nous ontpermis de formuler une serie d’hypotheses, qui restent a tester, quant aux relations en-tre l’utilisation intra-cellulaire du fer et la voie MAPK. Dans un deuxieme temps, nousavons pu illustrer l’utilisation des cellules HeLa-FUCCI dans l’etude des effets de lareoxygenation. En soumettant une culture cellulaire a un cycle hypoxie/normoxie, nousavons mis en evidence l’existence d’un ralentissement en phase S, probablement lie al’activation des reseaux de reparation de l’ADN. Cette dynamique reste a preciser, maiselle apporte d’interessantes pistes de reflexion. Notamment, elle pose la question de laregulation moleculaire de HIF-1α. En effet, l’etude des consequences moleculaires dephenomenes de reoxygenation passe par une comprehension fine des dynamiques d’in-duction et de degradation de HIF-1α. Les experiences d’immunomarquage que nousavons pu realiser confirment la necessite de se pencher sur les mecanismes d’inductionde la proteine. La figure 4.13 presente des images obtenues apres immunomarquageindirect de HIF-1α, suivant la methodologie evoquee en 4.1.2. On constate tres claire-ment une variabilite dans la localisation de HIF-1α : la proteine est soit nucleaire,soit cytoplasmique (ou diffuse). Elle apparaıt donc comme compartimentee. Or, l’ac-tivite du facteur de transcription est determinee par sa concentration nucleaire. Sarepartition dans la cellule est donc un aspect crucial de son action. Dans le chapitresuivant, nous nous proposons donc de descendre d’un niveau d’echelle, et de cherchera decrire certains aspects de la biologie moleculaire de la reponse a l’hypoxie. Pourcela, nous formaliserons dans un premier temps un modele de regulation de HIF-1αprenant en compte son aspect compartimente. Dans un second temps, nous exploreronsexperimentalement la dynamique de cette compartimentation, en lien avec le cycle cel-lulaire et en s’appuyant sur les possibilites offertes par les cellules FUCCI.

80 Hypoxie et cycle cellulaire : approche experimentale
Figure 4.13: Localisation sub-cellulaire de HIF-1α. La proteine HIF-1α est revelee enimmunomarquage (methode peroxydase) apres un traitement de 24h en presence de 250µMde DFO. Ci-dessous, trois images realisees en microscopie optique a differents grossissements.Les zones opaques signalent la presence du facteur de trancription, soit dans le noyau (N),soit dans le cytoplasme (C).

5Regulation de HIF-1α
5.1 Introduction
5.1.1 Compartimentation de HIF-1α : aspects biologiques
Comme nous l’avons decrit precedemment, la cinetique d’accumulation de HIF-1αen hypoxie est bien connue. Le niveau de la proteine augmente rapidement, pour at-teindre un maximum apres un laps de temps variant de 1 a 5 heures selon le tissuconsidere [1]. Puis, le niveau cellulaire de HIF-1α diminue progressivement, jusqu’a re-joindre un niveau d’equilibre [57, 58]. Ce niveau d’expression final depend de l’intensitede l’episode hypoxique, selon une loi exponentielle caracterisee experimentalement parJiang et al. (1996) [33]. Ainsi, HIF-1α s’accumule de maniere significative lorsque lapression d’oxygene passe sous un seuil critique, que l’on peut situer approximativementa 1%O2. Cette accumulation, dite switch-like, est consideree comme une caracteristiqueimportante de la reponse cellulaire a l’hypoxie [34].
En normoxie, HIF-1α est rapidement degradee par le proteasome. La proteine aalors une demie-vie d’environ 4 min [64]. Plusieurs travaux experimentaux tendent amontrer que cette degradation est compartimentee. Il semble des lors que le scenariosuivant puisse etre dessine. En normoxie, le niveau de HIF-1α est tres bas, et lorsqu’elleest detectable, la proteine est majoritairement cytoplasmique. Lors d’un episode hy-poxique, HIF-1α s’accumule rapidement dans le noyau [155–157], suggerant, comme lenote Berchner-Pfannschmidt [158], que la proteine est constitutivement importee dansle noyau apres sa synthese dans le cytoplasme. Or, des etudes recentes ont montrequ’il existait une dynamique complexe d’import/export de HIF-1α entre le noyau et lecytoplasme. Cette dynamique est supposee etre cruciale pour reguler la degradation dela proteine [58, 158]. Parallelement, il a ete montre que la proteine pVHL est impliqueedans une navette constitutive entre le noyau et le cytoplasme [159, 160]. L’ensemblede ces donnees permet alors de formuler le modele propose par Groulx et al. (2002)
81
82 Regulation de HIF-1α
[66]. HIF-1α est synthetisee et importee dans le noyau de maniere constitutive. Ennormoxie, lorsque le complexe pVHL/HIF-1α peut se former, la proteine est exporteedans le cytoplasme via la navette pVHL. Elle y est alors degradee par le proteasome.En hypoxie, la faible affinite de HIF-1α pour pVHL cantonne la proteine dans le noyau,ou elle interviendra comme facteur de transcription. La figure 5.1, issue du travail deGroulx et al., illustre ce modele. Cependant, Zheng et al. on montre que la degradationde HIF-1α pouvait egalement s’operer dans le noyau [65]. Plus precisement, les celluleshautement proliferatives sont effectivement caracterisees par une degradation exclusive-ment cytoplasmique et une accumulation de HIF-1α dans le noyau [161]. A l’inverse,dans les cellules differenciees, en etat de quiescence, la degradation a lieu tant dansle cytoplasme que dans le noyau. L’activite proteasomale du noyau jouerait donc unrole important dans la regulation du niveau de HIF-1α. Selon le type de cellule con-sidere, cette degradation nucleaire est plus ou moins intense. L’existence d’une activiteproteasomale dans le noyau est l’hypothese utilisee par Moroz et al. pour expliquerleurs resultats experimentaux [58]. Dans leur etude, les auteurs visualisent, via le cou-plage a un fluorophore, l’evolution du niveau HIF-1α apres avoir bloque la syntheseproteique par du cycloheximide. De cette maniere, ils ont pu quantifier la cinetique dedegradation de HIF-1α en normoxie. D’apres leur etude, cette derniere repond a une loibi-exponentielle, caracterisee par deux temps de demi-vie : 6±1.1min et 217±53min.L’hypothese formulee par les auteurs tient compte de l’existence d’une degradationnucleaire, responsable de la composante la plus lente de leur loi cinetique (t 1
2
= 217min).
La degradation rapide (t 1
2
= 6min) est alors liee a l’activite proteasomale du cyto-plasme.
Cependant, l’importance biologique de cette compartimentation de la degradationde HIF-1α est toujours en debat. Le role exact de la navette HIF-1α/pVHL, ainsi quesa variabilite, sont encore mal comprises. La repartition de pVHL differe en effet selonl’etat quiescent ou proliferatif des populations cellulaires. Comme l’ont montre Lee etal. (1996) [159], la proteine est majoritairement presente dans le cytoplasme des cellulesnon-proliferantes, et dans le noyau des cellules cyclantes. De maniere interessante, cetteobservation est parfaitement symetrique de celle concernant la dynamique nucleaireou cytoplasmique de la degradation de HIF-1α [65] : dans les cellules quiescentes, ladegradation est surtout cytoplasmique, et se partage entre le noyau et le cytoplasmedans les cellules proliferantes. Il est des lors tentant d’interpreter ces donnees en faisantappel a la cinetique d’import/export de pVHL. On peut notamment faire l’hypotheseque les cellules non-proliferantes tendent a exporter plus efficacement pVHL vers lecytoplasme, diminuant ainsi l’accumulation nucleaire de HIF-1α, et augmentant doncla degradation cytoplasmique. La vitesse de degradation etant plus importante dans lecytoplasme que dans le noyau, le niveau de HIF-1α est ainsi maintenu tres faible. Al’inverse, les cellules ayant une haute activite proliferative verraient l’export de pVHL,et donc de HIF-1α, diminuer, entraınant ainsi une forte accumulation nucleaire. Demaniere interessante, les cellules tumorales rentreraient donc dans ce cas de figure, cequi est coherent avec la forte accumulation de HIF-1α observee en normoxie dans leslignees tumorales [35].

5.1 Introduction 83
Figure 5.1: Modele propose par Groulx et al. (2002) [66] pour expliquer la dynamiqued’import/export de HIF-1α.
5.1.2 Les effets de la reoxygenation
Si l’hypoxie chronique a des effets bien caracterises au niveau cellulaire commeau niveau moleculaire, il apparaıt depuis quelques annees que les phenomenes de cyclehypoxie/reoxygenation ont une importance physiologique certaine. En premier lieu, lorsde la tumorigenese, des cycles hypoxiques de frequences variables sont responsables del’emergence de phenotypes agressifs et resistants [17, 18]. L’expression de plus de 200genes specifiquement actives par une hypoxie intermittente a ainsi ete caracterisee [21].D’autre part, les dommages tissulaires causes par la reperfusion brutale suivant uneischemie sont bien connus [22, 23].
De ce fait, les consequences moleculaires des cycles hypoxie/reoxygenation commen-cent a etre caracterisees in vitro. Les etudes par Martinive et al. (2009) [60] demontrentque de tels cycles amplifient l’accumulation de HIF-1α par rapport a un simple episodehypoxique. Ce resultat confirme les etudes par Yuan et al. (2008) [61] et Dewhirst etal. (2007) [62]. Les effets de la reoxygenation sur l’expression de genes lies a l’hypoxieont egalement ete explores, notamment par Conde et al. (2012) [23]. Ces derniers,confirmant les resultats obtenus auparavant par Hsieh et al. (2009) [162], ont mis enevidence la sur-expression de genes dependant de HIF-1, codant des proteines tellesque le VEGF, l’EPO ou les PHD. De meme, Luo et al. (2010) [63] ont demontre quela proteine MICA, dont la synthese est placee sous le controle de HIF-1, est fortementinduite par la reoxygenation, suggerant une forte activite du facteur de transcription
84 Regulation de HIF-1α
suite au retour a la normoxie. En outre, la reoxygenation est connue pour induirel’apoptose [163, 164]. Wang et al. (2012) [59] ont montre que cette apoptose induitepar le retour brutal a la normoxie etait due a HIF-1α.
Ainsi, ces observations conduisent a supposer l’existence d’une reponse specifiquedu niveau de HIF-1α a la reoxygenation. L’etude de Conde et al. (2012) [23] confirmecette intuition, en montrant l’existence d’une instabilite de son niveau cellulaire apresla fin d’un episode hypoxique. Le niveau de la proteine baisse rapidement, puis aug-mente pour atteindre un niveau maximal 3h plus tard, similaire a celui observe dansune situation d’hypoxie. Le niveau de HIF-1α adopte un comportement relativementinstable lors d’episodes de reoxygenation -comportement dont les causes ne sont pasbien connues. La ou l’on attendrait une diminution progressive de sa stabilite, le facteurde transcription voit son activite amplifiee. Notons enfin que le retour brutal a la nor-moxie a ete incrimine comme un facteur pouvant declencher l’apoptose [59, 163, 164].Cette donnee ouvre une piste de reflexion interessante sur les liens unissant les reseauxde regulation lies a l’hypoxie et ceux lies a l’apoptose.
5.1.3 Modeles existants pour la regulation de HIF-1α
De nombreux modeles mathematiques de la regulation de HIF-1α ont ete developpesces dernieres annees. Leur but premier est d’expliquer les principales caracteristiques del’accumulation de cette proteine lors d’un episode hypoxique [34]. Depuis les travauxfondateurs de Kohn et al. (2004) [68], ces modeles cherchent a simuler la reponsemoleculaire a l’hypoxie en prenant en compte l’action, dependant de l’oxygene, desPHD (Prolyl Hydroxylase Domain). Dans de nombreuses etudes, la dynamique de HIF-1α est expliquee en considerant des phenomenes de retroactions, tels que la synthesedes PHD sous controle de HIF-1 (Kohn et al (2004) [68]), ou l’inhibition des PHDpar le succinate (Qutub et al. (2007) [69]). Le modele elabore par N’Guyen et al.(2013) [67] inclut l’influence de l’enzyme FIH (Factor Inhibiting HIF-1) sur l’activitetranscriptionnelle de HIF-1, et considere la compartimentation noyau/cytoplasme dela proteine. Afin de clarifier et de classer ces nombreux modeles, certains auteurs ontinitie une analyse theorique du systeme d’equations differentielles ordinaires donne parKohn et al. (2004) [68]. Dans ce cadre, Heiner et al. (2010) [165] ont realise une analysestructurelle, dans le but d’identifier les interactions responsables du comportementswitch-like et d’extraire ainsi le cœur du reseau moleculaire de regulation de HIF-1α.
Toutes les demarches citees ici partagent un certain souci d’exhaustivite quant ala modelisation des reactions enzymatiques complexes menant au controle de la sta-bilite de HIF-1α. De fait, les etudes biomoleculaires ont mis a jour de nombreusesretroactions, tissant un reseau de regulation complexe et mal caracterise. Notamment,il reste tres difficile de savoir quelles interactions sont cruciales pour expliquer lesdonnees empiriques. En miroir de cette complexite biologique, les travaux precedentsconsiderent tous un grand nombre d’acteurs biomoleculaires, et plusieurs boucles deretroactions, pour obtenir des resultats satisfaisants. Recemment, Bagnall et al. ontelabore un modele plus simple, considerant simplement la retroaction de HIF-1α surles PHDs [166]. Leur but etait d’expliquer une instabilite observee experimentalementdans le niveau d’expression de HIF-1α. Ce modele minimaliste, comportant simplement

5.2 Un modele compartimente pour la regulation de HIF-1α 85
deux agents, permet de reproduire fidelement leurs resultats experimentaux. Cepen-dant, il n’explique pas les pics observees dans le niveau du facteur de transcription ensituation de reoxygenation.
5.2 Un modele compartimente pour la regulation
de HIF-1α
5.2.1 Demarche et principaux resultats obtenus
Dans cette etude, nous avons decide de construire un modele de la regulation sim-plifiant au maximum la chaıne des reactions enzymatiques menant a la destabilisationde HIF-1α en normoxie. Rappelons pour memoire que lorsque la pression en oxygeneest haute, la proteine est hydroxylee par une serie d’enzymes specialisees dont l’activiteest elle-meme finement regulee. Ces modifications biochimiques augmentent l’affinitede pVHL pour HIF-1α, ce qui conduit a son adressage vers le proteasome. Dans l’arti-cle suivant, nous avons choisi de considerer principalement ces deux acteurs cles. Leurinteraction est regulee par une constante de complexation dont la valeur reflete la pres-sion cellulaire en oxygene. Nous utilisons egalement une unique retroaction, residantdans le controle de HIF-1 sur la synthese de pVHL. Cette retroaction n’a encore jamaisete prise en compte dans les modeles precedents, alors meme qu’elle est bien etayeeexperimentalement [46]. Deux arguments de poids peuvent etre apportes a l’appui decette hypothese. Tout d’abord, le promoteur du gene codant pour pVHL contient unesequence de fixation pour HIF-1, comme note par Blagosklonny et al. (2001) [167], surla base de resultats obtenus par Renbaum et al. (1996) [168]. La presence de cette HRE(HIF-1 Response Element) a ete confirmee par Kahrausen et al. (2005) [169]. En outre,ces auteurs ont mis en evidence la liaison directe de HIF-1 sur le promoteur de pVHL.Deuxiemement, Karhausen et al. [169] ont demontre que la proteine elle-meme, ainsique l’ARNm correspondant, voient leur niveau augmenter en hypoxie. La retroactionde HIF-1 sur la synthese de pVHL est donc une hypothese pertinente a etudier.
Nous considerons egalement, dans ce modele, l’existence de deux compartiments(noyau et cytoplasme), dans lesquels HIF-1α est degradee a des vitesses differentes.Une navette assure un flux constitutif de pVHL entre ces deux espaces. D’autre part,l’activite des PHDs est modelisee par un unique parametre, decrivant l’affinite oxygene-dependante de pVHL pour HIF-1α. Conformement aux donnees biochimiques a dis-position, lorsque la pression d’oxygene est importante, l’activite des PHDs l’est aussi,HIF-1α est hydroxylee et son affinite pour pVHL est haute. A l’inverse, quand l’activitedes PHDs est faible (hypoxie), cette affinite decroit. Sur la base de ces hypothesesbiologiques, nous avons bati un modele mathematique comprenant sept equationsdifferentielles ordinaires. De part la similarite entre les systemes de regulation pVHL/HIF-1α et p53/MdM2 [167], nous avons calque notre formulation du probleme sur cellede Hunziker et al. (2010) [170]. Dans chaque compartiment, nous considerons que lesysteme est conduit par la loi d’action de masse qui caracterise la dynamique d’assem-blage/desassemblage du complexe HIF-1α/pVHL. La formation de ce complexe mene,dans chaque compartiment, a la degradation de HIF-1α. Afin de prendre en compte

86 Regulation de HIF-1α
la retroaction sur la synthese de pVHL, la vitesse de transcription du gene correspon-dant est mise sous le controle de HIF-1. La navette nucleo-cytoplasmique est decritepar des vitesses d’import/export de pVHL, ce qui assure le couplage entre les deuxcompartiments.
A l’aide de ce modele simple, detaille dans l’article publie dans Plos one en 2014et presente ci-apres, nous parvenons a expliquer la dynamique de degradation bi-exponentielle de HIF-1α. Nous reproduisons egalement la cinetique d’induction dufacteur de transcription en hypoxie, ainsi que la caractere switch-like de son accumu-lation nucleaire. En outre, en simulant les effets d’un retour brutal a la normoxie,nous parvenons a donner une explication simple a l’augmentation contre-intuitivede la reponse hypoxique apres une reoxygenation. Nous montrons ainsi qu’un cyclehypoxie/reoxygenation induit une reponse oscillatoire du niveau de HIF-1α pouvantexpliquer les manifestations cellulaires observees dans des conditions experimentalesou physiologiques similaires (notamment, l’apoptose massive et l’expression de genesspecifiques). D’autre part, nous mettons en evidence que cet effet est directement lie ala compartimentation de la dynamique de degradation de HIF-1α. Enfin, notre modelepeut etre utilise pour modeliser les effets, sur l’activite du facteur de transcription,de differentes mutations cancereuses, et pour tester l’efficacite potentielle de plusieursstrategies therapeutiques.
5.2.2 Article : Bedessem B. and Stephanou A., Role of com-
partmentalization on HIF-1 degradation dynamics dur-ing changing oxygen conditions : a computational ap-proach, Plos One, 2014, 9(10)
Resume
HIF-1α est la proteine centrale regissant la reponse cellulaire a l’hypoxie. Son ac-cumulation dans les cellules tumorales est liee a l’apparition de phenotypes agressifs etchimioresistants. En consequence, comprendre les mecanismes de regulation du niveauintra-cellulaire de HIF-1α est un enjeu majeur en vue de la conception de therapies anti-cancer innovantes. Dans cet article, nous proposons un modele du reseau de regulationde cette proteine, impliquant HIF-1α et son inhibiteur pVHL. A partir de donnees issuesde la litterature, nous avons fait l’hypothese selon laquelle la degradation de HIF-1αse fait dans deux compartiments (le noyau et le cytoplasme). Une navette constitutiveassure l’existence d’un flux de proteines entre ces deux espaces. Nous avons en premierlieu montre que ce modele reproduit correctement les principales caracteristiques de ladynamique de HIF-1α, incluant le profil de degradation bi-exponentielle en normoxie,la cinetique d’induction en hypoxie, et son accumulation brutale selon un mecanismede type tout-ou-rien (switch-like). Dans un deuxieme temps, nous avons simule les ef-fets d’un episode de reoxygenation, et montre qu’un evenement de ce type genere uneforte instabilite du niveau de HIF-1α. Le niveau proteique augmente rapidement troisheures apres le debut de l’evenement, et emprunte un comportement oscillatoire. Ceteffet disparaıt si on ne considere pas la compartimentation de HIF-1α. Ce resultat peut

5.2 Un modele compartimente pour la regulation de HIF-1α 87
expliquer plusieurs observations contre-intuitives concernant la reponse moleculaire etcellulaire a la reoxygenation. Troisiemement, nous avons simule la dynamique de HIF-1α dans le cas tumoral. Nous avons considere differents types de mutations associeesa la tumorigenese, et compare leurs consequences sur la degradation de la proteine.Nous avons ainsi pu tester differentes strategies therapeutiques. Nous avons montrequ’une baisse de la concentration nucleaire de HIF-1α n’est pas forcement associee aune attenuation des instabilites induites par la reoxygenation. Autrement dit, il ap-paraıt que la conception de therapies anti-HIF-1α doit prendre en compte ces deuxaspects de sa regulation afin de maximiser leur efficacite.
Abstract
HIF-1α is the central protein driving the cellular response to hypoxia. Its accu-mulation in cancer cells is linked to the appearance of chemoresistant and aggressivetumor phenotypes. As a consequence, understanding the regulation of HIF-1α dynam-ics is a major issue to design new anti-cancer therapies. In this paper, we propose amodel of the hypoxia pathway, involving HIF-1α and its inhibitor pVHL. Based ondata from the literature, we made the hypothesis that the regulation of HIF-1α in-volves two compartments (nucleus and cytoplasm) and a constitutive shuttle of thepVHL protein between them. We first show that this model captures correctly themain features of HIF-1α dynamics, including the bi-exponential degradation profilein normoxia, the kinetics of induction in hypoxia, and the switch-like accumulation.Second, we simulated the effects of a hypoxia/reoxygenation event, and show that itgenerates a strong instability of HIF-1α. The protein concentration rapidly increases 3hours after the reoxygenation, and exhibits an oscillating pattern. This effect vanishesif we do not consider compartmentalization of HIF-1α. This result can explain variouscounter-intuitive observations about the specific molecular and cellular response to thereoxygenation process. Third, we simulated the HIF-1α dynamics in the tumor case.We considered different types of mutations associated with tumorigenesis, and we com-pared their consequences on HIF-1α dynamics. Then, we tested different therapeuticsstrategies. We show that a therapeutic decrease of HIF-1α nuclear level is not alwayscorrelated with an attenuation of reoxygenation-induced instabilities. Thus, it appearsthat the design of anti-HIF-1α therapies have to take into account these two aspectsto maximize their efficiency.
Introduction
The HIF-1 factor is the central protein involved in the intracellular signaling path-way of hypoxia [113]. This transcription factor, which enhances the expression ofnumerous genes, directs the very complex cellular response to hypoxia. HIF-1 is anheterodimeric protein, constituted of two sub-units : HIF-1β, which is constitutivelyexpressed, and HIF-1α. The concentration of HIF-1α is maintained at low levels inmost cells under normoxic conditions. Whereas its synthesis does not depend on oxy-gen level [171], its degradation is regulated by the hypoxic state of the cell [116]. Innormoxia, enzymes called prolyl-hydroxylase (PHD) are active and convert HIF-1α

88 Regulation de HIF-1α
into an hydroxylated form. This form of the protein has a great affinity for an ubiq-uitination complex linked to the pVHL protein [64]. As a consequence, it is rapidlydegraded by the proteasom pathway [116]. During a hypoxic event, the PHDs are in-active, and pVHL cannot bind to HIF-1α, which is not addressed to the proteasomanymore. Therefore, the transcription factor accumulates and drives the synthesis ofnumerous genes, involved in cell cycle arrest and apoptosis [3], or, on the contrary, inproliferation [12, 131] and survival [46].
It is well known that HIF-1α accumulates in most of tumor cells [35, 37, 41]. This ac-cumulation is first due to the chronic hypoxia underwent by tumor cells [14, 99]. Second,many mutations can deregulate HIF-1α level, by impairing the HIF-1α/pVHL inter-action [40, 75, 172], or its genetic expression [173–175]. Because of the anti-apoptoticeffects of HIF-1, this overexpression plays a crucial role in tumor growth [13]. Indeed,it was shown that hypoxia generates chemoresistant cells, and then participates to theemergence of very aggressive tumor phenotypes [14, 54]. As a consequence, the under-standing of the mechanisms driving the accumulation and degradation of HIF-1α iscrucial to identify new targets for anti-cancer therapies [117].
The features of HIF-1α accumulation under hypoxia are well known. HIF-1α rapidlyincreases after the beginning of a hypoxic event, and reaches a maximum after a cer-tain time depending on the tissue (1h-5h) [1]. Then, it gradually decreases down to anequilibrium level [57, 58]. This equilibrium level depends on the intensity of hypoxia,following an exponential law determined experimentally by Jiang et al. (1996) [33].As a consequence, HIF-1α begins to significantly accumulate when oxygen pressurepasses through a threshold (about 1% O2). This switch-like accumulation of HIF-1α isconsidered as an important feature of the response to hypoxia [34]. If hypoxia is veryintense (PO2
<0.1%) the apoptotic pathways modify the equilibrium value of HIF-1αand promote apoptosis [46, 71]. In this work, we do not consider the relationshipsbetween the hypoxic and apoptotic pathways. At the molecular scale, the pathwaysregulating HIF-1α induction and degradation are complex and not perfectly known.The formation of the pVHL/HIF-1α complex is essential to address the transcriptionfactor to the proteasom [120, 176]. The hydroxylation of a proline residue of a specificdomain of HIF-1α, called the ODD domain, makes possible the formation of the com-plex [177]. The chemistry of the pVHL/HIF-1α complex was studied in vitro. It wasnotably shown that during the passage from hypoxia to normoxia, the affinity of pVHLfor HIF-1α is multiplied by at least three orders of magnitude [178, 179].
In normoxia, when protein synthesis is blocked (by the cycloheximide), the degra-dation of HIF-1α follows a bi-exponential law experimentally identified by Moroz etal. (2009) [58]. The authors showed that in a line of normal cells (NIH3T3), the twohalf-times of the HIF-1α degradation law are 6±1.1min and 217±53min. They madethe hypothesis that the slow clearance of HIF-1α was due to its nuclear degradation,whereas the rapid one reflected the cytoplasmic degradation of HIF-1α. This idea isinteresting because it contributes to the debate concerning the sub-cellular localizationof the protein. A general description is given as follows : in normoxia, HIF-1α level is

5.2 Un modele compartimente pour la regulation de HIF-1α 89
very low and when it is detectable, the protein is mainly cytoplasmic. When hypoxiais important, HIF-1α rapidly accumulates in the nucleus [155–157]. Recently, some ex-perimental works have shown that there is a dynamics of export/import of HIF-1 fromthe nucleus to the cytoplasm, which is crucial to regulate its degradation. After its syn-thesis in the cytoplasm, HIF-1α is constitutively imported into the nucleus [58, 158].On the other hand, the pVHL protein is involved in a permanent shuttle between thenucleus and the cytoplasm [159, 160]. In normoxia, as the pVHL/HIF-1α complex canform, HIF-1α is exported to the cytoplasm, where it is degraded, as hypothesized byGroulx et al. (2002) [66]. The dynamics of the HIF-1α/pVHL shuttle may be highlyvariable. Zheng et al. (2006) [65] showed that for highly proliferating cells, HIF-1α ex-clusively accumulates in the nucleus during hypoxia, and its degradation mainly takesplace in the cytoplasm during normoxia. This result suggests that in this type of cells,the export rate is much more important than the import rate. This agrees with theresult that pVHL is mainly a cytoplasmic protein [161]. However, in differentiated,non-proliferating cells, HIF-1α degradation takes place equally in the cytoplasm andin the nucleus [65]. These results are coherent with the observation that pVHL is pre-dominantly in the cytoplasm of confluent (non-proliferating) cells, and in the nucleusof sparse cells [159]. We can thus suppose than the rate of pVHL export is highlyvariable depending on the cell type or state : high for quiescent/slowly proliferativecells, and low for proliferative cells. Besides, Zheng et al (2006) [65] supposed that theHIF-1α nuclear degradation observed is due to the activity of a nuclear proteasom.This hypothesis can be linked to that formulated by Moroz et al. (2009) [58]. However,it is still in debate, and the importance of the nucleo-cytoplasmic shuttle of HIF-1αis not well established. Notably, an important question is to understand why HIF-1αrapidly accumulates in the nucleus (switch-like behavior) when the oxygen pressurepasses through a threshold. How can the nuclear/cytoplasmic shuttle explain this typ-ical feature of HIF-1α dynamics ?
The effects of intermittent hypoxia on HIF-1α accumulation are well studied. Thestudies by Martinive et al. (2006) [180] and Martinive et al. (2009) [60] demonstratethat HIF-1α accumulates during hypoxia/reoxygenation cycles. This result was con-firmed by Yuan et al. (2008) [61] and Dewhirst et al. (2007) [62]. Besides, the effects ofa reoxygenation event on the expression of hypoxia related genes are well known. Vari-ous authors reported that reoxygenation stimulates the expression of HIF-1-dependentgenes. Conde et al. (2012) [23] demonstrate that classical genes related to HIF-1α ac-tivity, such as VEGF, PHD, EPO, are over-expressed during reoxygenation. Hsieh etal (2009) [162] obtained a similar result by using reporter genes. The authors inter-preted this result by an increase of HIF-1 activity during reoxygenation. Luo et al.(2010) [63] demonstrated that the protein MICA, present in cell overexpressing HIF-1α, is strongly expressed during reoxygenation. They showed that this expression waslinked to HIF-1α. Reoxygenation is also known to induce apoptosis [163, 164]. Wang etal. (2012) [59] showed that this reoxygenation-induced apoptosis was due to HIF-1α.These observations lead to formulate the hypothesis that there is a specific response ofHIF-1α level or genetic activity during reoxygenation, different from that of normoxia.The study by Conde et al. (2012) [23], confirms this idea, by showing an instability

90 Regulation de HIF-1α
of HIF-1 level during 6 hours after reoxygenation. The level rapidly decreases after 15min, and increases to reach a maximum at 3h (level close to the hypoxic level). Then,HIF-1 level decreases. The authors bring elements showing that this up-regulation ofHIF-1 was maybe due to the AKm/Tor pathway.Thus, there is clearly a tendency for HIF-1 level and genetic activity to become unsta-ble after reoxygenation. The causes of such a tendency are not perfectly known.
Many models of HIF-1 regulation pathways were developed over these last ten years,to explain the main features of HIF-1α accumulation during hypoxia [34], or its effectson cell cycle [92]. Since the work by Kohn et al. (2004) [68], these models aim to simu-late the principal features of HIF-1 response to hypoxia, mainly by taking into accountthe oxygen-dependent action of the PHDs. In various works, the HIF-1α dynamics isexplained by considering feedback phenomena, such as the HIF-1-dependent synthesisof PHDs (Kohn et al. (2004) [68]), or the inhibition of PHDs by succinate (Qutubet al. (2007) [69]). The model by NGuyen et al. (2013) [67] includes the influence ofFIH on transcriptional activity of HIF-1α, and also includes a compartmentalizationaspect. However, it does not consider the pVHL shuttle, and does not study the effectsof variations of the export/import dynamics of the PDHs/FIH on HIF-1α regulation.Yet, it appears that this dynamics is complex and depends on the cell type and on thecell state [181–183]. Some authors have made a theoretical analysis of the system ofODEs initially given by Kohn et al. (2004) [68]. Yu et al.(2007) [71] made an ExtremePathway Analysis, and Heiner et al. (2010) [165] a structural analysis. The aim of thisapproach is to identify the major pathways responsible for the switch-like behavior. Itis a way to extract the network corresponding to the complex response to hypoxia.
In this study, we decided to consider that a possible core pathway of HIF-1 regula-tion was its pVHL-dependent degradation, driven by an oxygen-dependent affinity ofpVHL for HIF-1, and the HIF-1α feedback on pVHL synthesis. First, it is well knownthat HIF-1α stability is driven by its affinity with pVHL [64]. This affinity varies withPHDs’ activity, which depends on the oxygen level, as assumed in the previous models[69]. Second, there is no model taking into account the interesting feedback of HIF-1αon pVHL mRNA synthesis. The existence of this feedback is well accepted in the litera-ture, as noticed in the recent review by Sermeus et al. (2011) [46]. Two main argumentscan be used to justify this hypothesis. First, the promotor of the pVHL gene exhibitsa putative site for HIF-1 fixation, as noticed by Blagosklonny et al. (2001) [167], basedon previous results of Renbaum et al. (1996) [168]. The presence of this HRE (HIF-1 re-sponsive element) was confirmed by Krausen et al. (2005). Besides, the authors show adirect binding of HIF-1 on the pVHL gene promotor. Second, Karhausen et al. (2005)demonstrate that pVHL mRNA and pVHL protein are upregulated during hypoxia[169]. This result was not contradicted by more recent studies [46]. As a consequence,we considered that the pVHL-HIF-1 feedback is a relevant hypothesis to study. Thatis why we consider it, for the first time, in a model of HIF-1α regulation dynamics.
Our model simulates the HIF-1α dynamics by taking into account, for the firsttime, the nucleo-cytoplasmic shuttle. We consider two compartments (nucleus and cy-toplasm), where HIF-1α is degraded at different rates. The action of PHDs is not

5.2 Un modele compartimente pour la regulation de HIF-1α 91
considered. However, we consider a parameter describing the oxygen-dependent affin-ity of pVHL for HIF-1α. The value of this parameter decreases with oxygen pressure.Thus, it reflects the activity of PHDs, following a well-known model : when the activityis high (normoxia), HIF-1 is hydroxylated and its affinity for pVHL is high. When theactivity is low (hypoxia), HIF-1 affinity for pVHL decreases. With this simple model,we can explain the bi-exponential degradation law of HIF-1α, and confirm the impor-tance of considering two compartments for the degradation. We also well describe thekinetics of HIF-1α under hypoxia, and its switch-like nuclear accumulation. We canalso provide a simple explanation to the counter-intuitive increase of the hypoxic re-sponse after reoxygenation. We show that a hypoxia/reoxygenation cycle induces anoscillatory pattern of HIF-1α level which can explain the specific cellular effects ofreoxygenation, notably apoptosis and enhanced expression of hypoxia-regulated genes.This instability is directly linked to the compartmentalization of HIF-1α degradationdynamics. Finally, our model can be used to model the effects on HIF-1α levels ofdifferent kinds of cancerous mutations, and to test the potential efficiency of differenttherapeutic strategies.
Model
Biological description On the basis of data from the literature about the dynam-ics of HIF-1α degradation and nucleo-cytoplasmic exchanges, we constructed a mathe-matical model comprising seven ordinary differential equations (ODEs). The variablesused in the model are presented in Table 5.1. Because of the similarities between thepVHL/HIF-1α system and the p53/MdM2 system [167], we used the same formula-tion as Hunziker et al. (2010) [170] to write our ODEs system. In each compartment,we consider that the system is driven by the mass-action law which characterizes thepVHL/HIF-1α complex assembly/disassembly dynamics. The formation of the com-plex leads, in both compartments, to HIF-1α degradation. As HIF-1α is constitutivelyimported into the nucleus after its synthesis, we hypothesized that it appears in thenucleus, with a synthesis rate belonging to the parameters of the system. The feedbackof HIF-1 on pVHL synthesis is modeled by a HIF-1-dependent rate of pVHL mRNAsynthesis. We chose the same expression for this dependency as Hunziker et al. (2010)[170]. We then consider, because of the presence of a nuclear-localization signal in pVHLprotein, that the protein is constitutively imported into the nucleus after its synthe-sis [184]. Its accumulation in the cytoplasm is due to the nucleo-cytoplasmic shuttle.This shuttle is described with an import and export rate of pVHL, which ensures thecoupling between the cytoplasm and the nucleus dynamics. Figure 5.2 represents thedifferent reactions modeled by the ODEs system. Table 5.2 gives the meanings of eachreaction represented in figure 5.2. Table 5.3 gives the link between the parameters andthese reactions.
ODEs system We present here the 7 ordinary differential equations used in ourmodel. We consider the following variables that account for the concentrations of thechemical species : h (total HIF-1), hn (nuclear HIF-1), hc (cytoplasmic HIF-1), vn

92 Regulation de HIF-1α
Table 5.1: Variables of the model
Model variable Associated moleculehc Cytoplasmic HIF-1αhn Nuclear HIF-1αvm pVHL mRNAvn Nuclear pVHLvc Cytoplasmic pVHLcn Nuclear pVHL/HIF-1α complexcc Cytoplasmic pVHL/HIF-1α complex
Biological molecules considered in the model, and their mathematical symbol
Table 5.2: Reactions of the model
Number on thefigure 1
Reaction
1 Synthesis of HIF-1α2 pVHL-independent degradation of HIF-1α3 Release of pVHL by pVHL-dependent and pVHL-independent degra-
dation of HIF-1α4 Formation of the pVHL/HIF-1α complex5 Dissociation of the pVHL/HIF-1α complex6 pVHL natural degradation7 Release of HIF-1α by pVHL degradation8 HIF-1-dependent synthesis of pVHL mRNA9 pVHL mRNA degradation10 Synthesis of pVHL11 pVHL-import rate into the nucleus12 pVHL-export rate into the cytoplasm
Meaning of the reactions of the model. The numbers refer to the figure 5.2.
(nuclear pVHL), vc (cytoplasmic pVHL), vm (pVHL mRNA), cn (nuclear (pVHL/HIF-1α complex), cc (cytoplasmic pVHL/HIF-1α complex). The meaning and the value ofthe parameters are summarized in Tables 5.3 and 5.4. The equations were solved usinga Runge-Kutta method, implemented in Matlab.
h = hc + hn (5.1)
This first equation accounts for the total conservation of HIF-1α which is distributedbetween the cytoplasm and nucleus of the cell.

5.2 Un modele compartimente pour la regulation de HIF-1α 93
Table 5.3: Parameters of the model
Parameter Description Reactions of thefigure 1
σ Synthesis rate of HIF-1 1α pVHL-independent degradation of
HIF-12,3
kf pVHL/HIF-1 complex formationrate
4
kb pVHL/HIF-1 complex dissociationrate
5
γ Degradation rate of pVHL 6,7kt Synthesis rate of pVHL mRNA 8β Degradation rate of pVHL mRNA 9ktl Synthesis rate of pVHL protein 10δn pVHL-dependent degradation rate
of HIF-1 in the nucleus3
δc VHL-dependent degradation rateof HIF-1 in the cytoplasm
3
Ac,n Import rate of pVHL/HIF-1 com-plex into the nucleus
11
An,c Export rate of pVHL/HIF-1 com-plex into the cytoplasm
12
Definition of the parameters used in the model.Each parameter quantifies the speedof a reaction represented in figure 5.2.
dhn
dt= σ + (kb + γ)cn − kfvnhn − αhn (5.2)
The nuclear HIF-1 is synthesized with rate σ, spontaneously degraded with rate α, andis engaged into a chemical equilibrium with the pVHL/HIF complex. kf and kb are theassembly/disassembly rates of the complex. The degradation of pVHL in the nuclearcomplex liberates HIF-1α with rate γ
dhc
dt= (kb + γ)cc − kfhcvc − αhc (5.3)
Equation similar to that for the nuclear HIF-1, but without the synthesis term. Indeed,HIF-1α is constitutively imported into the nucleus after its synthesis [58, 158]. We thusconsider that it appears in the nucleus, and that its presence in the cytoplasm is dueto the nucleo/cytoplasmic shuttle

94 Regulation de HIF-1α
Figure 5.2: Molecular network of HIF-1α regulation. Sketch of the molecular net-work considered in the model.
dvm
dt= kth
2n − βvm (5.4)
Equation for pVHL mRNA. Its synthesis is promoted by HIF-1 with rate kt, and it isdegraded with rate β. We chose the same law as Hunziker et al. (2010) [170] for theMdM2/p53 system.
dvn
dt= ktlvm + kbcn + (δn + α)cn + Ac,nvc − kfvnhn − γvn − An,cvn (5.5)
Equation for the nuclear pVHL. It is synthesized from mRNA with rate ktl, and natu-rally degraded with rate γ. It is engaged in a chemical equilibrium with the pVHL/HIFcomplex. kf and kb are the assembly/disassembly rates of the complex. This complexleads to the nuclear proteasomal degradation of HIF-1 with rate δn which liberatespVHL. The spontaneous degradation of HIF-1α also liberates pVHL with rate α.
dvc
dt= kbcc + (δc + α)cc + An,cvn − kfvchc − γvc − Ac,nvc (5.6)

5.2 Un modele compartimente pour la regulation de HIF-1α 95
Table 5.4: Values of the parameters for normal, slowly proliferating cells
Parameter Default value Range of varia-tions
Reference
σ 1000nM.h−1 [200 8000] Moroz et al.(2009)
α 0.27h−1 Moroz et al.(2009)
kf 1000nM−1.h−1 [0 1000] Moroz et al.(2009)
kb 7200h−1 Hunziker et al.(2010)
γ 0.8h−1 Yang et al.(2013)
kt 0.001nM.h−1 Moroz et al.(2009)
β 0.6h−1 Hunziker et al.(2010)
ktl 1.4h−1 Hunziker et al.(2010)
δn 1h−1 Moroz et al.(2009)
δc 7h−1 Moroz et al.(2009)
Ac,n 10h−1 Moroz et al.(2009)
An,c 1000h−1 [10 1000] Moroz et al.(2009)
Default values of the parameters, for a normal, non-proliferating cell, and range ofvariations of the parameters used in the simulations. The default values were fixedusing previous models (Hunziker et al. (2010)), or experimental data (Moroz et al.
(2009),Yang et al. (2013)).
Equation for the cytoplasmic pVHL. Similar as that for the nuclear pVHL, but with-out the synthesis term. Indeed, we made the hypothesis that pVHL is constitutivelyimported into the nucleus after its synthesis. We thus consider that it appears in thenucleus, and that its presence in the cytoplasm is due to the nucleo/cytoplasmic shuttle
dcn
dt= kfhnvn + Ac,ncc − kbcn − δncn − (γ + α)cn − An,ccn (5.7)

96 Regulation de HIF-1α
Equation for the nuclear pVHL/HIF-1 complex. It is assembled with rate kf , and dis-assembled with rate kb. The spontaneous degradations of pVHL and HIF-1α, and thepVHL-induced HIF-1 degradation decreases its concentration with rates α, γ and δnrespectively. The nuclear complex is exported to the cytoplasm with rate Anc, and thecytoplasmic complex is imported with rate Acn.
dcc
dt= kfhcvc + An,ccn − kbcc − δccc − (γ + α)cc − Ac,ncc (5.8)
Equation for the cytoplasmic complex. Similar as that for nuclear complex.
The method used to solve this system and run the simulations are presented asSupplementary Materials. A first file (A) describes the methods we used to find thestationary state of the system, and to simulate hypoxia or reoxygenation events. TheSupplementary Material B gives the Matlab code used to obtain the main results ofthe paper.
Determination of some parameters The value of the natural degradation rate ofHIF-1α (α) can be determined by using data from Moroz et al. (2009) [58]. The authorsshowed that in ODD-mutant cells, the half-time of HIF-1α degradation was 160 min(2.7h). Since the ODD-mutant cells cannot form HIF-1α/complex, this experimentaltime can easily be used to estimate the value of the α rate. We fix α=0.27h−1. We alsohave a value for the pVHL degradation rate (γ), from Yang et al. (2013) [185]. Theauthors measured a half-life of 3.8 hours for pVHL, which corresponds to a parameterγ=0.2h−1. The other parameters are not precisely known. To reduce the number ofdegrees of freedom of the system, we used the analysis of Hunziker et al. (2010) [170]on the modeling of the p53/MdM2 dynamics. The authors fixed the value of the MdM2mRNA natural degradation rate β to 0.6h−1, corresponding to a half-time of about1 hour. Besides, they noticed that this value was not important to determine thedynamics of the system, and we verified that it was also the case in our model. Thus,we chose to fix β=0.6h−1. In a similar way, the translation rate ktl of MdM2 wasfixed in order to ensure small values of free p53 at the equilibrium (about 100nM)[170]. As the experimental observations made on HIF-1α are coherent with this idea(undetectable levels of HIF-1α in normoxia), we fix ktl=1.4h−1. We also verified thatits variations do not influence the dynamics of the system. The other parameters (HIF-1α synthesis rate σ, formation and disassembly of pVHL/HIF-1α kf and kb, pVHL-dependent degradation rates of HIF-1α δc and δn, pVHL export and import rates Anc
and Acn, HIF-1α dependent induction rate of pVHL kt) are the degrees of freedom ofour system. As the pVHL/HIF-1α complex level depends on the kf/kb ratio, we canconsider that only one of this two parameters drives the dynamics of the system. Thus,we chose to fix kb (disassembly rate of the pVHL/HIF-1α complex), and to consideronly the variations of kf (formation rate of the complex, depending on the oxygen level).We chose the default value given by Hunziker et al. (2010) for the p53/MdM2 system :kb=7200h−1. To give a default value to the remaining undetermined parameters, we

5.2 Un modele compartimente pour la regulation de HIF-1α 97
then used the bi-exponential HIF-1 degradation law given by Moroz et al. [58].
Results
Simulation of HIF-1α degradation in normoxia We first consider the experi-mental situation described by Moroz et al. (2009) [58]. Cycloheximide is added to aculture of NIH3T3 cells (differentiated, slowly proliferating cells) in normoxia in or-der to block protein synthesis. Then, HIF-1α concentration is measured along timein order to construct its degradation curve. The authors determined a bi-exponentialdegradation law for HIF-1 degradation : [HIF-1](t)= [HIF−1]0
2(e−k1t + e−k2t) with [HIF-
1](t) the level of [HIF-1] along time, [HIF-1]0 its initial level, and ki a characteristic
parameter such as ti12
= ln(2)ki
. Searching for a bi-exponential law of degradation means
searching the value of these two parameters. The experimental values of these twohalf-times are : 6±1.1min and 217±53min. This experimental protocol corresponds, inour model, to the calculation of the stationary state of the system, and then to fix σ
(HIF-1α synthesis rate) and ktl (pVHL mRNA translation rate)=0. We then calculatedthe degradation curve, that is to say the evolution of total HIF-1 concentration alongtime. By using a least-square method, we searched for the better bi-exponential lawfitting this curve, following the same approach as Moroz et al. (2009) [58]. We madethis simulation for σ (HIF-1α synthesis rate), kf (complex formation rate), kt (HIF-1α induced pVHL synthesis rate), Anc, Acn (pVHL export and import rates), and δc,δn (cytoplasmic and nuclear pVHL-dependent HIF-1α degradation rates) varying inbiologically relevant ranges. For each set of parameters tested, the bi-exponential lawobtained was compared to the experimental data from Moroz et al. (2009) [58]. Wecould thus identify a set of parameters ensuring a very good fit between theoretical andexperimental degradation laws. Figure 5.3 shows the comparison between the simulatedand the experimental degradation curves, obtained with the parameters presented inTable 5.4. The default values of the parameters correspond to the values ensuring thebest fit. We reproduced the rapid clearance, corresponding to cytoplasmic degradation,and the slow one, corresponding to nuclear degradation. These parameters have a goodbiological relevance. The synthesis rate of HIF-1α is the same as the one used by Hun-ziker et al. (2010) [170] for p53, and the value of the complex formation rate (kf ) isin the range determined for the p53/MdM2 complex. This agrees with the idea of thesymmetry between the p53/MdM2 and the HIF-1α/pVHL couple. The values of thepVHL-dependent HIF-1α nuclear and cytoplasmic degradation rates (δn and δc) corre-spond to a bigger proteasomal activity in the cytoplasm than in the nucleus for normalcell, which agrees with experimental data [65]. Finally, the pVHL export rate (Anc) ismuch bigger than its import rate (Acn), which corresponds to the experimentally ob-served massive export of pVHL out of the nucleus of non-proliferating cells [159, 161].We notice that even if we have many undetermined parameters (σ, Anc, Anc, δc, δn,kt, kf ), the bi-exponential curve is sufficient to constrain the parameters of the modelsto realistic values. Indeed, it gives the characteristic times of nuclear and cytoplasmicdegradations, which impose the degradation rate in each compartment, the exchangesbetween them, and the HIF-1α/pVHL interactions.

98 Regulation de HIF-1α
Figure 5.3: Experimental and simulated HIF-1α degradation curves. Blue : ex-perimental degradation curve determined by Moroz et al. (2009) [58] after the addition of cy-cloheximide. Solid line : mathematical bi-exponential law determined with experimental data.Dotted lines : uncertainty on the bi-exponential law. Red : simulated degradation curve. Thetotal HIF-1α level (free and complexed, cytoplasmic and nuclear) is plotted as the percentageof its initial value.
Simulation of HIF-1α level in hypoxia We then consider a hypoxic event. Hy-poxia strongly diminishes the affinity of pVHL for HIF-1α [64, 178, 179]. This effectcan be simulated by decreasing the value of the complex formation rate (kf ). The equi-librium levels of cytoplasmic and nuclear HIF-1α were calculated with different valuesof kf , with kfhypoxia < kfnormoxia
= 1000, in order to simulate the effects of hypoxia onHIF-1α accumulation. Figure 5.4 shows the nuclear and cytoplasmic level of HIF-1αfor kf in the range [0.1 100]. We notice that our simulated HIF-1α accumulation is verysimilar to the exponential curve determined by Jiang et al. (1996) [33]. Our model re-produces well the switch-like accumulation of HIF-1α when oxygen pressure diminishes.When kf passes a threshold (kf ≈ 2), HIF-1α accumulates in the nucleus. This value iscoherent with data from the literature measuring the affinity of pVHL for HIF-1α as afunction of HIF-1α hydroxylation. Illingworth et al. (2010) [178] and Hon et al. (2002)[179] showed that hydroxylation of the ODD-domain multiplied kf by three orders ofmagnitude at least. When kf > 100, HIF-1α is close to its normoxic level (obtained forkf = 1000), and is present in equal concentration in the nucleus and in the cytoplasm.The value of kf which determines the switch (accumulation of HIF-1α in the nucleus)is linked to the nucleo-cytoplasmic export rate (Anc) of the pVHL/HIF-1α complex.As shown in the literature, this export rate is supposed to vary between cells lines,and notably between proliferating and quiescent cells. As we noticed in the introduc-tion, differentiated and slowly proliferating cells can be characterized by high values of

5.2 Un modele compartimente pour la regulation de HIF-1α 99
the pVHL-export rate Anc, whereas non-differentiated, proliferating cells export pVHLwith a lower rate.
Figure 5.4: Accumulation of HIF-1α under hypoxia. Nuclear (red curve) and cyto-plasmic (blue curve) equilibrium levels of HIF-1α are plotted as functions of the pVHL/HIF-1α complex formation rate (kf ). kf varies over a [1 100] range (A), and a [0.1 10] range(B).
We aim to study the influence of hypoxia and pVHL export rate (Anc) on HIF-1αlevel and localization. We made a map of the total (nuclear and cytoplasmic) HIF-1α, normalized to its concentration in normoxia for a non-proliferating cell (kf=1000,Anc=1000), as a function of kf and Anc (Figure 5.5 A). We also represented the ra-tio between nuclear and cytoplasmic HIF-1α concentrations : R=[HIF-1α]nucleus/[HIF-1α]cytoplasm (Figure 5.5 B). We can notice that when Anc is close to its default value(1000, case of slowly-proliferating cells), HIF-1α is homogeneously present in the nu-cleus and in the cytoplasm during normoxia (R ≈1). When hypoxia is intense (kf < 1),HIF-1α accumulates in the nucleus (R > 1). When Anc is low (proliferating cells), HIF-1α tends to accumulate in the nucleus even in normoxia.
Simulation of HIF-1α kinetics under hypoxia We now simulate the kinetics ofnuclear HIF-1α accumulation under hypoxia. To that end, we first fix the system to itsequilibrium state in normoxia, determined by the parameters presented in Table 5.4.In that case the HIF-1α concentration at the equilibrium is 141nM. Then, we run asimulation with a new value of kf , taking the equilibrium state as the initial conditionof the system. This protocol simulates a hypoxic event, because we perturb the systemat the equilibrium state by choosing hypoxic values of kf , such as kfnormoxia
> kfhypoxia .Figure 5.6 represents the temporal evolution of nuclear HIF-1α after the beginning of

100 Regulation de HIF-1α
Figure 5.5: HIF-1α accumulation and localization as a function of hypoxia in-tensity and pVHL export rate. A. The total (nuclear+cytoplasmic) HIF-1α equilibriumlevel, normalized to its value obtained with the default parameters, is plotted as a functionof the pVHL-export rate (Anc) and of the pVHL/HIF-1α complex formation rate (kf ). Tothe left of the red dotted line, total HIF-1α significantly increases with respect to the defaultvalue. B. Ratio between nuclear and cytoplasmic HIF-1α levels as a function of Anc and kf .To the left of the red dotted line, HIF-1α accumulates in the nucleus.
three hypoxic events of increasing intensities : kfhypoxia=10, 5, 1. The evolution of HIF-1α concentration is in agreement with data from the literature, with a rapid increasefor about two hours up to a maximum value, and a decrease down to an equilibriumvalue. When it reaches its maximal value, HIF-1α concentration is multiplied by 4-8with respect to its normoxic value, depending on the intensity of hypoxia. This resultis coherent with data from the literature [57, 58].
Simulation of the effects of reoxygenation We now test the effect of reoxygena-tion on HIF-1α level. To do so, we follow the same approach than in the simulation ofhypoxic events. We calculate the stationary state of the system with a hypoxic valueof kf (kf <1000). Then, we take this hypoxic stationary state as the initial value of thesystem, and we run the simulation with the normoxic value of kf (kf=1000). This situa-tion simulates a reoxygenation event. We plotted the evolution of nuclear HIF-1α level.Figure 5.7.A shows this temporal evolution during a sequence hypoxia/reoxygenationmade for kfhypoxia=1 or 10. We note that reoxygenation leads to a destabilization ofHIF-1α level, which enters an oscillatory mode with a delay depending on hypoxiaintensity. The maximal value reached after reoxygenation by the nuclear concentra-tion of HIF-1α is about 2.5-fold its normoxic value. In the case of a moderate hypoxia(kf=10), it is more important than the stationary value in hypoxia.
We can notice that the oscillations are exclusively nuclear. The cytoplasmic level ofHIF-1α remains low after reoxygenation (data not shown). Besides, we could show thatthis reoxygenation-induced instability of nuclear HIF-1α level is linked to the pVHL im-port/export dynamics. Figure 5.7.B compares the molecular response to reoxygenation

5.2 Un modele compartimente pour la regulation de HIF-1α 101
Figure 5.6: Simulation of the temporal evolution of HIF-1α during a hypoxicevent. From the red curve to the black curve : simulations for increased levels of hypoxia,with kfhypoxia=10, 5, 1.
of our compartmentalized model and of a non-compartmentalized model. To considera non-compartmentalized model, we imposed Anc = 0 and we plotted the temporalevolution of HIF-1α, normalized to the value for normoxia. The instabilities of thenuclear HIF-1α level are strongly attenuated in this case. Thus, compartmentalizationof HIF-1α is crucial to generate reoxygenation-induced instabilities.
Simulation of HIF-1α level in tumor cells Different types of mutations canaffect HIF-1α regulation in cancer cells, leading to its pathological accumulation [118].Genetic deregulation of HIF-1α synthesis can promote a 3-8-fold increase of HIF-1αmRNA level [173–175]. In our model, this corresponds to a 3-8-fold increase of theHIF-1α synthesis rate (σ). Yoshikawa et al. (2006) [174] observed in peritoneal cancersa 3-fold increase of mRNA and a 2-fold increase in VEGF mRNA expression. As VEGFis a target gene of HIF-1, we can consider that an increase of VEGF expression reflectsa similar increase in HIF-1α protein level. Second, pVHL activity can be impaired. Itis notably the case in Renal Clear Carcinoma (RCC), known to be due to differenttypes of pVHL mutations [40, 172]. In these types of cancer, HIF-1 level is not due togenetic overexpression, since some authors have found a constant level of HIF-1 mRNA[39, 186]. Wiesener et al.(2001) [39] found a 6-7-fold increase of VEGF mRNA in RCC.
First, we aim to simulate the effects of a genetic deregulation of HIF-1α expressionin the normoxic level of the protein. We calculated the stationary value of the total

102 Regulation de HIF-1α
Figure 5.7: Effect of a hypoxia/reoxygenation sequence on nuclear HIF-1α level.A. The level of nuclear HIF-1α is plotted during two 30h hypoxic events of different intensities,followed by reoxygenation. Red : kf=10. Black : kf=1. The dotted blue line corresponds to theHIF-1α concentration in normoxia. B. Response to reoxygenation in our compartmentalizedmodel (red curve) and in a non-compartmentalized model of HIF-1α regulation (black curve).The nuclear HIF-1α was normalized to its value at normoxia
(nuclear and cytoplasmic) HIF-1α level as a function of the HIF-1α synthesis rate(σ), and of the pVHL export rate (Anc). We considered this last parameter becauseit is supposed to vary with cell state. As explained previously, non-proliferative anddifferentiated cells are supposed to exhibit a high value for Anc, whereas proliferativecells have a low pVHL-export rate. We normalized this value with the level of HIF-1αcalculated for a normal cell, characterized by the default values of Table 5.4. Figure5.8.A presents the value of this ratio R=[HIF-1α]cancer/[HIF-1α]normal as a function ofAnc and σ. The increase of HIF-1α synthesis rate (σ) makes HIF-1α to accumulatein normoxia compared to the non-mutated case. The calculated increase of HIF-1α(multiplied by 1-4) is coherent with data from the literature. We could place on thediagram the position of the peritoneal cancer studied by Yoshikawa et al. (2006) [174].The space we delimited corresponds to a 2-fold increase of HIF-1α protein and a 3-foldincrease of HIF-1α mRNA, corresponding to a 3-fold of σ. We also notice that lowvalues of the pVHL export rate (Anc) enhances the effect of mutations related to thealteration of the HIF-1α production rate (σ).
We then compare the response to a hypoxia/reoxygenation signal of normal cells,and cells presenting a deregulation of HIF-1α expression (σ mutated cells). We simu-lated the effects of a reoxygenation after a hypoxic event, and we plotted (Fig. 5.8.B)the evolution of total HIF-1α for σ=1000 (normal cells) and 5000 (tumor cells). Wenote that the oscillations are amplified in the tumor cells. Indeed, the ratio betweenthe maximal value of the oscillations and the normoxic stationary level of HIF-1α is

5.2 Un modele compartimente pour la regulation de HIF-1α 103
Figure 5.8:Consequences of a pathological overexpression of HIF-1α. A. Accumu-lation of HIF-1α in σ mutated cells, compared to normal cells. The ratio [HIF-1α]cancer/[HIF-1α]normal is plotted as a function of σ (HIF-1α synthesis rate) and Anc (pVHL export rate).The black dotted square indicates the location of the peritoneal cancer studied by Yoshikawaet al. (2006) [174], characterized by a 2-fold increase of HIF-1α protein and a 3-fold increaseof HIF-1α mRNA. B. Effects of reoxygenation on normal cells, and mutated cells. Reoxy-genation after hypoxia is simulated, and the evolutions of nuclear HIF-1α concentration areplotted in the case of normal (σ=1000, red curve), and σ mutated cells (σ=5000, black curve).The dotted lines represents the normoxic equilibrium levels in each case.
equal to ≈ 3.2 for tumor cells, and to ≈ 2.5 for normal cells. Thus, our model pre-dicts that mutations of the HIF-1 σ synthesis rate promotes tumorigenesis because itincreases the cellular level of HIF-1α, and because it amplifies the instabilities due toreoxygenation.
Second, we aim to quantify the effects of pVHL mutations on HIF-1α accumu-lation. We plotted the value of R=[HIF-1α]cancer/[HIF-1α]normal as a function of thepVHL/HIF-1α complex formation rate (kf ), and of the pVHL export rate (Anc). Theresult was plotted in a (Anc, kf ) diagram (Figure 5.9). We can locate on this diagramthe RCC cancer cells studied by Wiesener et al. (2001) [39]. These cells present a mu-tation on pVHL, and a 6-7-fold increase of HIF-1α genetic activity. Our model leadsto the hypothesis that the pVHL/HIF-1α complex formation rate is divided by about100 in this type of cancer.
Simulation of the effects of therapies Since it is overexpressed in many can-cer, HIF-1α became a target for anti-cancer therapies [116]. We can use our modelto predict the efficiency of different therapeutic strategies. Our model suggests thata therapy which aims to regulate HIF-1α has to reduce its nuclear normoxic level,but also to attenuate the instabilities induced by reoxygenation. A first therapeutic

104 Regulation de HIF-1α
Figure 5.9: Consequences of pVHL mutations. Accumulation of HIF-1α in tumorcells with mutated pVHL. The value of R=[HIF-1α]cancer/[HIF-1α]normal is plotted as afunction of kf (pVHL/HIF-1α complex formation rate) and Anc (pVHL export rate). Thewhite line limits the space of the RCC cancer cells studied by Wiesener et al. (2001) [39].
strategy we can test consists in using siRNA to reduce the synthesis of HIF-1α [187].This corresponds to a decrease of the synthesis rate of HIF-1α from its default value(σ=1000). We consider a cancer cell presenting mutations of pVHL (kf < 1000), andwe calculated the ratio R=[HIF-1α]cancer/[HIF-1α]normal in the nucleus as a functionof Anc (pVHL export rate) and kf (pVHL/HIF-1α complexation rate) for σ < 1000.We chose σ=200. We consider here the nuclear level because it is responsible for thegenetic activity of HIF-1α. This decrease of the HIF-1α synthesis rate (σ) simulates theaction of the siRNA. Figure 5.10 compares the nuclear HIF-1α accumulation withouttherapy and with siRNA therapy. We note that a 5-fold decrease of HIF-1α expressionis efficient to decrease the HIF-1α level. For instance, the RCC cells localized in thediagram, presenting a 6-7-fold increase of nuclear HIF-1α level without treatment, anda 2-fold increase after treatment. We then test if the siRNA therapy is able to attenuatethe instabilities generated by reoxygenation. Figure 5.11 shows that a decrease of σattenuates the oscillations. HIF-1α does not exceed any more the normoxic value for anormal cell.
Then, we test an other therapeutic strategy, which consists in promoting the pVHL-dependent degradation of HIF-1α [188]. We modeled this effect by increasing the pVHL-dependent cytoplasmic and nuclear HIF-1α degradation rates, δc and δn. We first com-pute the effects of this therapy on nuclear HIF-1α normoxic level for a tumor cellpresenting a deregulation of HIF-1α expression (σ-mutated cells). We considered a 10-fold increase of the pVHL-dependent degradation rates (δc and δn). Figure 5.12 showsthe value of R=[HIF-1α]cancer/[HIF-1α]normal in the nucleus as a function of σ (HIF-1α

5.2 Un modele compartimente pour la regulation de HIF-1α 105
Figure 5.10: Effects of siRNA therapy in pVHL mutated cells. Nuclear Accu-mulation of HIF-1α in the tumor case, without or with therapy. We calculated the value ofR=([HIF-1α]cancer/[HIF-1α]normal) (in the nucleus) as a function of kf (complexation rate)and Anc (pVHL export rate). A. Without siRNA therapy (HIF-1α synthesis rate σ=1000).B. With siRNA therapy (σ=200).
Figure 5.11: Effects of siRNA therapy on HIF-1α level evolution after reoxy-genation. Reoxygenation after a hypoxic event is simulated for the HIF-1α synthesis rateσ=1000 (black curve) and σ=200 (red curve). The blue dotted line represents the normoxiclevel for a normal cell.
synthesis rate) and Anc (pVHL export rate). We notice that HIF-1α level strongly de-creases when the treatment is applied in normoxia. For instance, the peritoneal cancer

106 Regulation de HIF-1α
localized in the diagram presents a 2-fold increase of HIF-1α level when untreated,and a 1.2-fold increase after treatment. We then test if this therapy attenuated theinstabilities due to reoxygenation. Figure 5.13 shows the evolution of HIF-1α afterreoxygenation for a σmutated tumor cell (σ=3000), with or without treatment. We no-tice that the oscillations are not significantly attenuated. Even if the pVHL-dependentdegradation rate had been multiplied by 10, the amplitude would still exceeds the nor-moxic level. Thus, our model predicts that this strategy is not efficient to suppress theeffects of reoxygenation on HIF-1α accumulation.
Figure 5.12: Effects of an increased proteasomal activity on nuclear HIF-1αlevel of σ-mutated cells. The value of R=[HIF-1α]cancer/[HIF-1α]normal is plotted as afunction of Anc (pVHL export rate) and σ (HIF-1α synthesis rate). Left : non-treated cells.Right : result after a 10-fold increase of pVHL-dependent degradation of cytoplasmic andnuclear HIF-1α degradation rates (δc and δn).
Discussion
In this paper, we construct and use a mathematical model of HIF-1α regulation.We consider, in agreement with the literature, that the protein is present both inthe nucleus and in the cytoplasm. One originality of the model is that the protein isdegraded in these two compartments in a pVHL-dependent manner. The constitutivepVHL-shuttle ensures the exchanges of HIF-1α between the cytoplasm and the nucleus.We consider a simple regulatory model, directed by the oxygen-dependent affinity ofpVHL for HIF-1α, and a feedback of HIF-1α on pVHL synthesis.
This point of view is original and interesting, because it changes the traditionalsimulation approach of HIF-1α regulation. Indeed, a current field of research tries tofind the core pathways of the complete HIF-1α regulation network responsible for itsobserved behavior, notably the switch-like accumulation [165]. To answer this question,the previous models often consider the oxygen-dependent action of PHDs, and someof the numerous feedbacks on the HIF-1α regulation system, such as the activation ofPHDs synthesis by HIF-1 [67], or the product inhibition by succinate [69]. However,

5.2 Un modele compartimente pour la regulation de HIF-1α 107
Figure 5.13: Effects of an increased proteasomal activity on HIF-1α evolutionafter reoxygenation. Reoxygenation after a hypoxic event was simulated for non-treatedcells (black curve), and with a 10-fold increase of pVHL-dependent HIF-1α degradation rateσ (red curve). The cell considered is a tumor cell, with a deregulation of HIF-1α expression(σ=3000) The blue dotted line represents the normoxic level for this cell.
the feedback on pVHL synthesis was never considered. Here, we aim to show that thesimple pVHL/HIF-1α system, together with a compartmentalization aspect, can ex-plain all essential behavior of HIF-1α regulation.
First, we show that our model explains well the dynamics of HIF-1α degradation innormoxia, measured by Moroz et al. (2009) [58]. Besides, the dynamics of HIF-1α accu-mulation is simulated in agreement with experimental data. Finally, we could quantifythe nuclear and cytoplasmic equilibrium accumulation of the protein under hypoxia.We found a switch-like evolution of the cellular level of HIF-1α, with a strong accu-mulation when the pVHL-HIF-1α complex formation rate is decreased by three ordersof magnitude, as demonstrated experimentally [178]. Since our model differentiatescytosolic and nuclear HIF-1α, we could compare the protein level in these two com-partments, as a function of hypoxia and of the pVHL export rate. We found that theaccumulation of HIF-1α is nuclear in hypoxia, as known in the literature. In normoxia,cytoplasmic and nuclear levels are low and equivalent. Thus, a threshold value of thecomplexation rate, k∗
f , determines the beginning of the nuclear accumulation. Whenkf < k∗
f , HIF-1α accumulates in the nucleus. Our model predicts that the dynamicsof the pVHL shuttle is important to determine the value of k∗
f . Cells with high pVHL-export rate (corresponding, according to the literature, to slowly proliferating cells)

108 Regulation de HIF-1α
exhibits a lower k∗
f than highly proliferating cells, with a weak pVHL-export rate. Thisresult is consistent with experimental data, showing that quiescent, differentiated cellstend to accumulate HIF-1α equally in the cytoplasm and the nucleus, whereas highlyproliferating cells exhibit a strong nuclear accumulation [65]. Thus, our model confirmsthat the difference observed between cells in the pVHL export rate [159] can explainthe differences in HIF-1α localization. As a consequence, the bi-compartments model,with a cytoplasmic and nuclear degradation, explains in a satisfactory way various ex-perimental data about HIF-1α localization, induction, and degradation dynamics.
Second, our model provides interesting results about the molecular responses to re-oxygenation. Experimentally, it was observed that reoxygenation causes specific molec-ular and cellular response. HIF-1α-dependent apoptosis observed during reoxygenation,and the enhancement of the synthesis of HIF-1α-related genes show that HIF-1α activ-ity exhibits an interesting behavior during reoxygenation. The observation of a counter-intuitive increase of HIF-1α level by Conde et al. (2012) [23] confirms this idea. Ourmodel is able to generate a specific response to reoxygenation event which is in agree-ment with these experimental observations.During a simulated hypoxic event, HIF-1α accumulation does not generate instabili-ties. The protein rapidly reaches an equilibrium level, depending on oxygen pressurein a switch-like manner. On the contrary, brutal reoxygenation generates strong in-stabilities of the protein level. It decreases suddenly, and after 3 hours, enters intoan oscillatory mode, with a large amplitude. The maximal value of HIF-1α reachedafter hypoxia/reoxygenation is about 2.5-fold higher than the normoxic level, and canexceed the hypoxic level. We also observed that this reoxygenation-induced instabilitywas specific to our compartmentalized model. If we do not consider exchanges betweencytoplasm and nucleus, the oscillations are strongly attenuated. Thus, the presenceof HIF-1α instabilities is directly due to the compartmentalization of its degradationdynamics. This oscillatory behavior is biologically relevant. Indeed, it is well knownthat the oscillatory pattern of transcription factors promotes the expression of spe-cific genes, which are not activated in the case of a stable level of the protein. Thus,reoxygenation-mediated oscillations of HIF-1α can explain the synthesis of proteinswhich are not synthesized during a hypoxic event. Besides, the links existing betweenHIF-1 and the p53-dependent apoptosis pathways can lead to formulate the followinghypothesis [46]. The oscillations of HIF-1α generate strong oscillations of p53, whichis a known death signal [170]. Thus, it could explain the HIF-1-dependent massiveapoptosis observed in some cells after reoxygenation [59]. Besides, our model predictsthat these oscillations are exclusively nuclear. The cytoplasmic level remains low afterreoxygenation. The biological interest of this behavior is clear. Since HIF-1α is a tran-scription factor, its activity is concentrated in the nucleus. Thus, the biological effectsof the oscillations are maximized. Clearly, more experimental works are needed to testif these oscillations are effectively present after a hypoxia/reoxygenation event. Thefact that they were not observed until now can be due to a lack of data, or to the factthat other unidentified biological mechanisms attenuate HIF-1α instabilities. However,the important conclusion of this paper is that our model of HIF-1α regulation, based onexperimental data, simulates a specific molecular response to hypoxia/reoxygenation

5.2 Un modele compartimente pour la regulation de HIF-1α 109
signal. More precisely, we show that our simple HIF-1α/pVHL system generates stronginstabilities of HIF-1α level following reoxygenation. Thus, it gives a possible factorcontributing to the similar tendency experimentally observed on HIF-1α level and ge-netic activity.
Finally, we used our model to simulate the effects of known mutations of HIF-1αpathways in tumor cells. Notably, we could test the influence of mutations impairingpVHL function, and compare this to a case of Renal Cell Carcinoma studied in theliterature [39]. Reciprocally, we used the model to quantify the efficiency of differenttherapeutic strategies, such as siRNA-mediated inhibition of HIF-1α expression, andpromotion of its proteasomal degradation. Clearly, as it is an over-simplified model, itcannot reflect the exact response of the HIF-1α regulation system to mutations andanti-cancer therapies. However, it provides methods to include these aspects in a ODEsmodel of HIF-1α regulation, in a compartmentalized context. For instance, our modelenables us to underline that efficient anti-HIF-1α strategies have to decrease its equi-librium level, but also to attenuate the instabilities generated by reoxygenation. In thefuture, it would be necessary to plug this pVHL/ HIF-1α model into a more completesystem, including the PHDs and all the feedbacks known in literature, to make our testof therapies more useful.
As a conclusion, we can notice that the principal interest of our model is to find anew core-system of the HIF-1α regulation network. Our system is based on a oxygen-dependent affinity of pVHL for HIF-1α, a feedback of HIF-1α on pVHL mRNA syn-thesis, and the existence of a nucleo-cytoplasmic pVHL shuttle. We show that thissimple model, built on the basis of experimental data, explains all the well known es-sential behaviors of HIF-1α regulation. Besides, our model exhibits a specific responseto reoxygenation event, which provides a possible factor contributing to experimentalobservations about HIF-1α level and genetic activity during reoxygenation. Finally, ourmodel also provides a method to take into account the HIF-1α/pVHL feedback, andthe compartmentalization aspect in a future more complete model.
5.2.3 Conclusion
Dans cet article, nous avons propose un modele de regulation du niveau intra-cellulaire de HIF-1α. Avec un nombre restreint d’acteurs et de relations biochimiques,nous reproduisons les caracteristiques principales de la reponse moleculaire a l’hy-poxie. A l’oppose des travaux precedents, considerant dans leur detail les nombreusesreactions enzymatiques, et les boucles de retroactions associees, des resultats simi-laires sont obtenus ici a minima. Nous avons pu montrer, ainsi, que la retroaction deHIF-1 sur la synthese de pVHL suffisait a expliquer une grande partie des observa-tions experimentales. D’autre part, notre approche met l’accent sur la compartimen-tation de la degradation de HIF-1α, tout en fournissant un cadre formel permettantde l’apprehender mathematiquement. Cette premiere serie de conclusions est d’impor-tance, car elle ouvre une voie nouvelle dans les travaux de modelisation des reseauxbiochimiques lies a l’hypoxie. En outre, ce travail offre un eclairage interessant sur les

110 Regulation de HIF-1α
phenomenes moleculaires et cellulaires associes au retour a la normoxie apres un episodehypoxique. Comme nous l’avons decrit precedemment, la reoxygenation entraıne unereponse remarquable, observee in vitro et en conditions physiologiques : augmentationde l’activite de HIF-1α, expression de genes specifiques, apoptose. La simulation d’unesituation de reoxygenation se solde, dans notre etude, par l’apparition de fortes insta-bilites du niveau de HIF-1α. Le niveau de la proteine entre dans un regime oscillant,dont la valeur maximale peut depasser le niveau atteint en hypoxie. Ce resultat estinteressant, car il fournit une explication possible aux observations experimentales. L’-expression de genes specifiques, par exemple, peut etre facilement liee au signal oscillantdu facteur de transcription HIF-1. Afin d’approfondir nos conclusions, nous avons for-mule un modele preliminaire decrivant les relations biochimiques tissees entre les voiesde l’hypoxie et celles de l’apoptose. Nous avons alors pu montrer comment le regimeoscillant de HIF-1 etait capable de generer un signal du meme type pour la proteinep53. Ce type de signal etant connu pour declencher l’apoptose, nos resultats s’averentdonc etre une explication possible, parmi d’autre, des vagues d’apoptose observees lorsde reoxygenations brutales (cas des ischemies). Cependant, cette idee doit etre testeeexperimentalement. Notamment, il serait interessant de suivre, avec precision et sur lelong terme, l’evolution intra-cellulaire de HIF-1α et de p53 lors de retours a la nor-moxie, de maniere a tester l’existence d’un tel regime oscillatoire. Notons d’ores et dejaque la grande quantite d’acteurs non pris en compte dans notre modele de la regulationde HIF-1α (la voie mTOR notamment) pourront ici jouer un role important, complex-ifiant par la meme l’interpretation des donnees experimentales. Finalement, l’interetprincipal de ce travail est de presenter le pouvoir explicatif d’un modele tres simple,prenant en compte deux agents principaux (HIF-1α et pVHL). Nous rendons ainsicompte du comportement, au premier ordre, du systeme de regulation de HIF-1α. Lesresultats obtenus, s’ils sont a relativiser au vu de la colossale complexite que nousoccultons deliberement, trouvent donc leur utilite dans l’analyse d’une strategie demodelisation jusqu’ici negligee. Par exemple, les demarches de modelisation des liensentre les voies de l’apoptose et celles de l’hypoxie possedent, avec la relation yin-yang,une base de travail interessante a creuser. Notre etude fournit un premier cadre perme-ttant d’aborder cette question avec des outils relativement simples et efficaces. Dansla section suivante, nous proposons une extension du formalisme presente dans notrearticle, incluant les liens unissant les voies de l’hypoxie et celles de l’apoptose au seind’un modele yin-yang simplifie.
5.3 Comment la reoxygenation peut-elle induire
l’apoptose ?
L’article precedent a permis de mettre en evidence le role de la compartimentationde HIF-1α dans la dynamique de sa degradation d’une part, et d’autre part, dansla generation d’instabilites oscillatoires lors d’episodes de reoxygenation. Nous avonsevoque, en discussion, l’influence potentielle de ce signal sur l’apoptose. En effet, commenous l’avons note, le retour a la normoxie lors d’episodes hypoxiques tend a declencherl’entree en apoptose, dans des conditions experimentales in vitro [164] ou physiologiques

5.3 Comment la reoxygenation peut-elle induire
l’apoptose ? 111
(ischemie). D’autre part, l’intrication etroite des voies de regulation dependantes dep53 (proteine cle regissant les processus d’apoptose) et celles dependantes de HIF-1autorise la formulation de l’hypothese suivante : les oscillations apparaissant lors d’uneremontee du niveau d’oxygene peuvent generer un signal periodique du niveau de p53.Or, ce type de signal est bien connu dans la litterature consacree a l’apoptose. Enimposant un stress genotoxique, Geva-Zatorsky et al.(2006) [189] ont, par exemple,genere des oscillations de p53, et de MdM2, avec un periode d’environ 5 heures. Demaniere generale, un signal oscillant de p53 est un fort promoteur d’apoptose [170, 190].Nous avons donc cherche a illustrer ce point en proposant un modele preliminaire desrelations biochimiques existant entre HIF-1, p53, et leur regulateur directs (pVHL etMdM2).
5.3.1 Les interconnexions des voies hypoxiques et apoptotiques :la relation yin-yang
Les interactions complexes entre les voies de regulation liees a l’hypoxie, domineespar la proteine HIF-1, et celles liees a l’apoptose, dominees par p53, sont un domained’intense recherche depuis plus d’une decennie [46]. Rappelons tout d’abord que lesdeux proteines sont regulees selon un principe similaire de retroaction positive sur leurinhibiteur [167]. Cette propriete a d’ailleurs ete utilisee pour construire notre modele deregulation de HIF-1α [94]. En vertu de ces schemas de regulations, nos deux proteinesont la capacite de s’accumuler rapidement lorsque les signaux de stress depassent unseuil critique. En outre, il a ete observee, lorsque l’hypoxie est severe ou prolongee, quep53 est induit et provoque l’apoptose [5, 191]. De maniere interessante, cette induc-tion n’est notable qu’en condition d’hypoxie extreme (<0.02% O2), ou durable (>16h)[191, 192]. Si les conditions sont plus moderees, p53 ne semble pas etre induit ; a l’in-verse, il peut avoir tendance a decroıtre [193], mettant en evidence l’existence d’effetscontradictoires de l’hypoxie sur l’apoptose en fonction de l’intensite et de la dureede l’episode [45]. Sermeus et al. (2011) [46] ont generalise cette idee en proposant unmodele de balance entre HIF-1 et p53 [46]. En normoxie, les deux proteines ont un faibleniveau d’expression. Lorsque la pression d’oxygene diminue, le niveau de HIF-1 s’eleve,ce qui diminue encore le niveau de p53. La cellule entre dans une phase de resistancea l’apoptose. Lorsque l’hypoxie devient severe, p53 augmente, HIF-1 decroit, et la cel-lule entre en apoptose. Comment expliquer cette balance a l’echelle moleculaire ? Denombreuses relations d’interactions proteiques ont ete mises en evidences entre p53,HIF-1α, et leurs regulateurs, MdM2 et pVHL. Afin de formaliser les relations biochim-iques mises en evidences experimentalement, Roe et al. (2006) [194] ont propose unschema qu’ils ont baptise equilibre yin-yang. Ce modele a ete repris et complete dansles annees suivantes [46]. Il presente un reseau complexe d’interactions au sein duquelchaque proteine peut affecter les trois autres. L’ensemble de ces relations proteiquessont representees sur la figure 5.14, issue du travail de review de Sermeus et al. Outreles mecanismes de regulation de HIF-1α par pVHL et de p53 par MdM2, les auteursrelevent un effet negatif de p53 sur HIF-1α. L’absence de proteine p53 fonctionnelle

112 Regulation de HIF-1α
Figure 5.14: Representation schematiquedes modulations reciproques de HIF-1α, p53,pVHL et MdM2. D’apres [46]
semble en effet promouvoir la stabilite de HIF-1α [195]. Reciproquement, HIF-1α sem-ble avoir un effet positif sur p53. Deux mecanismes peuvent etre a la source de cetteobservation. Suzuki et al ont propose que la dephosphorylation de HIF-1α durantune hypoxie severe pouvait engendrer une augmentation du niveau intracellulaire dep53 [196]. D’autre part, l’existence averee d’interactions biochimiques entre HIF-1αet MdM2 peut jouer un role crucial dans les interactions entre les voies de l’hypoxieet celles de l’apoptose [197, 198]. La formation de complexe, outre un potentiel effetde stabilisation de HIF-1α, fait baisser le niveau de MdM2 libre, et inhibe ainsi ladegradation de p53. Enfin, des preuves experimentales accumulees notamment par Roeet al. (2006) [194] tendent a montrer que pVHL regule positivement le niveau de p53et son activite genetique. Reciproquement, p53 inhibe l’expression de pVHL.
Dans cette partie, nous avons choisi d’illustrer le role de la balance yin-yang dansla reponse de p53 au signal de reoxygenation. Pour cela, nous avons considere les deuxsystemes de regulation “miroirs” p53/MdM2 et HIF-1α/pVHL. Nous y avons adjointla formation de complexes MdM2/HIF-1α comme exemple des liens biochimiques tissesentre les deux reseaux. Le systeme etudie est donc relativement simple eu egard a lacomplexite des interactions biologiques ; il sert avant tout de point de depart a unemodelisation plus exhaustive de la balance yin-yang.
5.3.2 Formulation du modele yin-yang
Ce modele se base sur notre travail, presente precedemment, concernant la regulationde HIF-1α [94]. Rappelons que nous considerions la degradation de HIF-1α commecontrolee par pVHL, dont l’expression genetique est reciproquement induite par HIF-1α. La dynamique de ce systeme est compartimentee, la communication entre le noyauet le cytoplasme etant assuree par une navette constitutive de la proteine pVHL. Nousconsiderons ici, parallelement a ce systeme, un modele de regulation de p53 similairea celui utilise par Hunziker et al. [170]. Les couples HIF-1α/pVHL et p53/MdM2presentent les memes types d’interactions, a cette exception pres que l’on neglige la

5.3 Comment la reoxygenation peut-elle induire
l’apoptose ? 113
compartimentation de p53, sa dynamique spatiale etant complexe et mal connue. Onconsidere donc que p53 et MdM2 sont exclusivement nucleaires. L’equation de couplageentre les deux systemes decrit la formation d’un complexe HIF-1α nucleaire/MdM2.La formulation mathematique est donnee ci-dessous. Les equations (5.10) a (5.16) sontidentiques a celles presentees dans l’article precedent [94]. Les equations (5.17) a (5.20)modelisent la dynamique du systeme p53/MdM2. Elles sont exactement similaires auxequations regissant la regulation de HIF-1α, la compartimentation en moins. Ellesdecrivent respectivement l’evolution temporelle des niveaux de p53 (p), de l’ARNm co-dant pour MdM2 (mm), de MdM2 (m), du complexe MdM2/p53 (c). Enfin, l’equation(5.20) decrit la formation du complexe HIF-1α/MdM2 (cmh). Ce complexe, en dimin-uant le niveau de MdM2 libre, regule positivement le niveau de p53. En plus desparametres introduits dans Bedessem et al. [94], nous considerons ainsi λ, µ, ν (degradationchimique de p53, MdM2, et des ARNm codant pour MdM2), ρ (vitesse de synthese dep53), kf,pm (taux de formation du complexe p53/MdM2), kb,pm (taux de degradation ducomplexe p53/MdM2), kf,mh (taux de formation du complexe HIF-1α/MdM2), kb,mh
(taux de degradation du complexe HIF-1α/MdM2), kt,m (vitesse de transcription desARNm codant pour MdM2), ktl,m (vitesse de traduction de ces ARNm), et δ (vitessede degradation de p53 mediee par MdM2).
dhn
dt= σ − αhn − kfvnhn + (kb + γ)cn (5.9)
dhc
dt= (kb + γ)cc − kfhcvc − αhc (5.10)
dvm
dt= kth
2n − βvm (5.11)
dvn
dt= ktlvm − kfvnhn + kbcn + (δn + α)cn − γvn + Ac,nvc − An,cvn (5.12)
dvc
dt= kbcc − kfvchc + (δc + α)cc − γvc − Ac,nvc + An,cvn (5.13)
dcn
dt= kfhnvn− kbcn − δncn − (γ + α)cn − An,ccn + Ac,ncc (5.14)
dcc
dt= kfhcvc − kbcc − δccc − (γ + α)cc + An,ccn − Ac,ncc (5.15)
dp
dt= ρ− λp− kf,pmpm+ kb,pmc+ µc (5.16)
dmm
dt= kt,mp
2 − νmm (5.17)
dm
dt= ktl,mmm − kf,pmpm+ (kb,pm + δ)c
− µm− kf,mh[hn][m] + kb,mh[cmh] (5.18)
dc
dt= kf,pmpm− kb,pmc− δc− µc (5.19)
dcmh
dt= kf,mhhnm− kb,mhcmh − (µ+ α)cmh (5.20)

114 Regulation de HIF-1α
5.3.3 Resultats
Nous avons cherche a illustrer, a l’aide de ce systeme, les effets des instabilites duniveau de HIF-1α induites par la reoxygenation sur le niveau de p53. La valeur desparametres pour le systeme pVHL/HIF-1α a ete choisie egale aux valeurs par defautdeterminees dans notre travail precedent [94]. Pour le systeme p53/MdM2, nous avonsutilise les valeurs par defaut issues du travail de Hunziker et al. [170]. Enfin, pour decrirele couplage entre les deux sous-systemes (equation 5.20), nous avons du fixer des valeurspour les taux d’association et de dissociation de HIF-1α et MdM2. L’objectif de cettesection etant simplement d’illustrer la liaison des voies de regulation de l’hypoxie et del’apoptose, nous avons fixe des valeurs similaires aux constantes de complexation dessystemes p53/MdM2 et HIF-1α/pVHL, soit kf,mh=1000 et kb,mh=7200. La valeur desparametres pour le systeme pVHL/HIF-α a ete choisie egale aux valeurs par defautdeterminees dans notre travail precedent [94]. Pour le systeme p53/MdM2, nous avonsutilise les valeurs par defaut issues du travail de Hunziker et al. [170]. Nous supposonsegalement, en premiere approximation, que la liaison a MdM2 n’affecte pas le systemede regulation de HIF-1α. Autrement dit, la proteine pVHL peut adresser HIF-1α auproteasome meme si la proteine est liee a MdM2. Les conditions initiales, c’est a direl’etat des niveaux proteiques avant l’episode de reoxygenation, sont presentees dans latable 5.5. La methode decrite dans notre travail precedent a ete utilisee pour determinerl’etat d’equilibre pour le systeme HIF-1α/pVHL en hypoxie. Afin de fixer des valeurs al’equilibre pour les nouvelles variables introduites (p, mm, m, c, cmh), nous avons laissele systeme evoluer en imposant des conditions hypoxiques (kf=1) jusqu’a atteindreun etat stationnaire. Les valeurs des niveaux proteiques prises par nos variables apresstabilisation du systeme ont alors ete utilisees comme conditions initiales. Nous avonsainsi pu simuler un episode de reoxygenation, en imposant au systeme la valeur pardefaut du parametre kf : kf=1000. La figure 5.15 represente l’evolution du niveau dep53 apres une reoxygenation brutale (a t=0). Le passage de l’hypoxie a la normoxiegenere des instabilites du niveau de p53, qui entame une dynamique oscillatoire dixheures apres la reoxygenation, avec une periode d’environ 5h. Comme nous l’avons noteprecedemment, un signal periodique similaire a ete observe experimentalement dans lecas d’un stress genotoxique. Il est connu, dans ce cadre, pour conditionner l’entree enapoptose. Autrement dit, les oscillations de p53 generees par la reoxygenation sont sus-ceptibles de declencher la mort cellulaire. Or, comme nous l’avons note, les phenomenesde reoxygenation sont connus pour promouvoir, dans certaines conditions, l’entree enapoptose. C’est notamment le cas lors des phenomenes d’ischemie : un retour brutaldu flux sanguin dans les zones ischemiques genere des vagues d’apoptose. Ce modelesimple ouvre donc une piste interpretative permettant d’eclairer le lien existant entrele retour a la normoxie et la mort cellulaire. Selon ce modele, la compartimentation deHIF-1α entre le noyau et le cytoplasme est a l’origine d’une reponse oscillante de laproteine lors d’un episode de reoxygenation. Les relations bio-chimiques liant le systemede regulation de HIF-1α a celui de p53 generent alors une dynamique du meme type quecelle observee pour la proteine pro-apoptotique. Ce signal declenche la mort cellulaire.Avec toutes les reserves liees aux simplifications notables qui le sous-tendent, notremodele presente donc l’interet de fournir une explication biologiquement coherente a

5.3 Comment la reoxygenation peut-elle induire
l’apoptose ? 115
Variable Niveau initial (nM)hn 510hc 262vm 433vn 28vc 2898cn 1.9cc 105p 77
mm 302m 1.7c 860
cmh 90
Table 5.5: Conditions initiales avant reoxygenation. Ces valeurs correspondent a l’etatdu systeme sous une hypoxie caracterisee par kf=1
Figure 5.15: Simulation de l’evolutiondu niveau de p53 apres un episode dereoxygenation
de nombreuses observations cliniques et experimentales. Des perspectives interessantess’ouvrent alors afin de tester la validite de cette interpretation. Notamment, il seraitpertinent de suivre l’evolution du niveau de p53 lors d’episodes de reoxygenation, afin detenter d’imager d’eventuelles oscillations. Au niveau de la modelisation du phenomene,le modele peut-etre grandement ameliore afin de prendre en compte de maniere plussatisfaisante la complexite biologique de la situation etudiee. La question de la com-partimentation de p53 meriterait par exemple d’etre consideree. Les outils que nousavons mis au point pour modeliser le systeme de regulation de HIF-1α pourraient alorsetre etendus au couple pVHL/MdM2 afin de completer le modele yin-yang.

116 Regulation de HIF-1α
5.4 Localisation de HIF-1α et cycle cellulaire
5.4.1 Introduction
L’article precedent a mis en evidence l’importance de la compartimentation de HIF-1α dans sa regulation. Notamment, la navette nucleo-cytoplasmique de pVHL pourraitjouer un role crucial dans l’accumulation et la degradation du facteur de transcription.Or, nous avons egalement rappele l’existence de donnees experimentales mettant enevidence une variabilite de la repartition de pVHL en fonction de la dynamique pro-liferative des cellules [159]. Rappelons egalement que la localisation de la degradationde HIF-1α semble dependre en partie de leur etat quiescent ou non [65]. La distri-bution spatiale de la proteine pourrait donc avoir un lien avec le cycle cellulaire. Or,comme nous l’avons note a la fin du chapitre precedent, la visualisation en immuno-marquage de la localisation sub-cellulaire de HIF-1α fait apparaıtre une variabilite desa distribution. La proteine est en effet soit concentree dans le noyau, soit dans le cy-toplasme, soit repartie de maniere homogene. Cette observation pose de nombreusesquestions. En effet, l’accumulation nucleaire de HIF-1α est une caracteristique com-mune a un grand nombre de cancers [35]. La comprehension des mecanismes regulantla repartition du facteur de transcription est donc d’importance. En particulier, ilest legitime de se demander si la variabilite observee est liee a la dynamique du cy-cle (variabilite intra-cellulaire) ou a une difference de comportements entre cellules(variabilite inter-cellulaire). Pour repondre a cette question, il peut etre interessantde chercher une eventuelle correlation entre la phase du cycle dans laquelle se trouveune cellule donnee, et la localisation de HIF-1α. Or, les cellules HeLa-FUCCI per-mettent justement de mener ce genre d’investigations. Ces dernieres rendent en effetpossible la determination precise de l’avancement du cycle par la simple observationnon-destructive d’une population cellulaire. Cette population pourra ensuite etre fixeeet soumise a un immunomarquage dirige contre HIF-1α, afin de completer les donneesde microscopie de fluorescence par la localisation de la proteine.
5.4.2 Methode
La reussite d’une telle demarche experimentale passe par la possibilite de collectera la fois les donnees de fluorescence et d’immunomarquage sur un grand nombre decellules. Pour ce faire, nous avons opte pour le protocole suivant. HIF-1α est induitpar DFO (24h a 100µM). La fluorescence des cellules HeLa-FUCCI est ensuite imageesur une vingtaine de champs, dont les positions precises dans la chambre de culturesont enregistrees, selon une methodologie similaire a celle presentee dans le chapitreprecedent. Les cellules sont ensuite fixees, puis un immunomarquage indirect de HIF-1αest realise. Nous avons opte pour une methode classique de revelation enzymatique a laperoxydase. Le protocole precis est presente en annexe C. Enfin, les positions initialesdans la chambre de culture sont retrouvees, grace a la platine motorisee dont est munile microscope utilise. Il est donc possible de collecter, en transmission, les donnees sur larepartition sub-cellulaire de HIF-1α. La figure 5.16 montre le type de resultat obtenu,sur trois champs. On obtient, parallelement, la fluorescence permettant de determiner

5.4 Localisation de HIF-1α et cycle cellulaire 117
l’avancement du cycle, et les informations relatives a la presence de HIF-1α.

118 Regulation de HIF-1α
Figure 5.16: Imagerie couplee de la localisation sub-cellulaire de HIF-1α et de la progres-sion du cycle. A, C, E : images prises en microscopie a fluorescence apres 24h de traitementpar 100µM de DFO. B,D,F : champs correspondants apres fixation et immunomarquage(methode peroxydase) de HIF-1α

5.4 Localisation de HIF-1α et cycle cellulaire 119
Figure 5.17: Methode d’analyse couplee de la progression du cycle et de la localisationsub-cellulaire de HIF-1α. Sur un champs donne, on dispose de la donnee de fluorescence(A,C) et du marquage anti-HIF-1α (B,D). Cela permet de correler la phase (G1,S,G2) avecla localisation nucleaire (N) ou cytoplasmique/diffuse (C) de HIF-1α

120 Regulation de HIF-1α
Ces donnees sont ensuite traitees en correlant, cellule a cellule, la phase du cycleet la localisation de la proteine. Un exemple est donne sur la figure 5.17. Il faut noterque l’immunomarquage n’est parfois pas suffisamment precis pour trancher de maniereclaire sur la repartition de HIF-1α. Nous nous contentons donc de differencier les casde nette accumulation nucleaire des cas ou la proteine est plus diffuse. Dans ce derniercas, il peut s’agir soit d’une localisation cytoplasmique, soit d’une induction plus faible.Cette experience a ete menee sur une vingtaine de champs, contenant chacun environ50 cellules.
5.4.3 Resultats
Les vingt champs sur lesquels ont ete collectees les donnees de fluorescence et d’im-munomarquage ont donc ete traites en suivant la demarche decrite precedemment. Engroupant ces champs en quatre echantillons contenant un minimum de 200 cellules,nous avons pu etablir une statistique de la proportion de cellules de chaque phasepresentant un niveau d’expression clairement nucleaire de HIF-1α. Les resultats sontpresentes sur la figure 5.18. Il apparaıt que la pourcentage de localisation nucleaireest situe entre 30 et 40 % pour les phases G1, S et G2. On observe neanmoins unevaleur significativement plus faible en S qu’en G1 (p-value=0.04), et surtout qu’en G2
(p-value=0.0001). Cependant, ces resultats doivent etre interpretes avec precaution.En effet, de nombreuses sources d’incertitudes viennent brouiller l’interpretation. Toutd’abord, l’imprecision relative de l’immunomarquage ne permet de ne prendre encompte que les cellules presentant une tres claire accumulation nucleaire. D’autre part,il est difficile de differencier les cas ou la repartition est cytoplasmique ou diffuse descas ou HIF-1α est tout simplement peu induit. Il est donc hasardeux de conclure a unerelocalisation partielle dans le cytoplasme durant la phase S. La legere (mais significa-tive) difference observee pourrait dans ce cadre s’expliquer plutot par une diminutionde la synthese de la proteine durant la phase S. De maniere generale, la variabilitedans la repartition ou l’induction de HIF-1α semble etre independante de la progres-sion du cycle. Il s’agit donc en grande partie d’une variabilite inter-cellules. Celle-cipeut etre liee a un grand nombre de parametres : niveau d’induction aleatoire, muta-tions genetiques... Dans ce dernier cas, notre travail a montre que des modificationsdans le systeme de transport de pVHL pouvaient influer sur la repartition de HIF-1α.Le niveau d’expression du facteur de transcription avant l’induction peut egalementjouer un role. Notre demarche a donc permis de mettre en evidence qu’il existe unevariabilite dans la localisation/l’induction de HIF-1α au sein d’un meme population decellules, qui ne s’explique pas par la seule dynamique du cycle. En outre, de maniereplus generale, cette etude met en avant une utilisation originale des cellules HeLa-FUCCI, et demontre leur utilite pour realiser des etudes couplees de biologie cellulaire(progression du cycle) et de biologie moleculaire (expression d’une proteine).

5.5 Conclusion 121
0
10
20
30
40
50
60
G1 S G2
% lo
calis
atio
n nu
cléa
ire * * *
* ** Figure 5.18: Phases du cycle et localisation
de HIF-1α. Sur quatre echantillons d’environ400 cellules, nous avons calcule le pourcentagede cellules de chaque phase presentant claire-ment une concentration nucleaire de HIF-1α.∗P<0.05, ∗∗P<0.001.
5.5 Conclusion
Dans ce chapitre, nous avons etudie quelques aspects de la regulation intra-cellulairedu niveau de HIF-1α. En premier lieu, nous avons mis sur pied un modele simpledecrivant les relations entre HIF-1α et pVHL dans un contexte compartimente. Cemodele reproduit les principales caracteristiques connues de la reponse a l’hypoxie(induction et accumulation de HIF-1α, dynamique de la degradation) en utilisantuniquement une boucle de retroaction, et en prenant en compte l’importance de lacompartimentation nucleo-cytoplasmique de la regulation. La cinetique de la navettenucleo-cytoplasmique de pVHL est alors un des parametres cles determinant le niveaucellulaire de HIF-1α. Ce resultat ouvre des perspectives interessantes de verificationsexperimentales : il est notamment possible de travailler sur les proteines connues pourfaire partie de ce systeme d’import/export.
Notre modele predit egalement une reponse specifique du niveau de HIF-1α lorsd’episodes de reoxygenation. Au lieu d’etre rapidement degradee, la proteine entredans un mode instable (oscillations), et voit son niveau s’elever parfois au dessus duniveau d’equilibre hypoxique. Ce resultat, qui demande de plus amples verificationsexperimentales, est encourageant. En effet, il peut etre mis en relation avec plusieursdonnees recentes de la litterature, montrant une augmentation transitoire du niveaude HIF-1α, ainsi qu’une synthese de genes specifiques jouant un role crucial dans lareponse cellulaire a la reoxygenation. Il serait interessant, afin de batir un pont entrenotre modele et nos resultats experimentaux obtenus sur les cellules FUCCI apres uncycle hypoxie/normoxie, de creuser les liens entre cette possible induction de HIF-1α enreoxygenation et le ralentissement de la phase S par activation des voies de reparation del’ADN. Cette reponse oscillatoire peut egalement etre reliee a la dynamique d’apoptoseconnue pour etre declenchee par le retour brutal a la normoxie. Afin de mettre l’accentsur ce point, nous avons etendu notre formalisation aux inter-relations entre les couplesHIF-1α/pVHL et p53/MdM2. Une premiere analyse de ce modele plus complexe montrecomment la reoxygenation peut induire un comportement oscillatoire du niveau de p53,connu pour etre un signal d’apoptose.
Enfin, nous avons mis au point un protocole permettant d’etudier experimentalement

122 Regulation de HIF-1α
la dynamique de la compartimentation de HIF-1α, en relation avec le cycle cellu-laire. Nos resultats suggerent que la variabilite de la localisation de la proteine esten grande partie inter-cellulaire : elle ne depend pas, ou peu, de la phase du cycle,mais de parametres internes a chaques cellules. Notre modele mathematique permetde supposer que differents types de mutations genetiques peuvent expliquer cette vari-abilite. Celles-ci peuvent affecter la dynamique d’import/export de pVHL, la vitesse desynthese de HIF-1α, ou l’affinite du couple pVHL/HIF-1α. La encore, cette observationouvre donc la voie a de nombreuses investigations experimentales.

6Conclusion generale
Dans cette these, nous avons explore plusieurs aspects de la reponse cellulaire a l’hy-poxie. En utilisant a la fois des outils de modelisation et une approche experimentale,nous avons pu degager des resultats originaux, ouvrant plusieurs directions de recherche.
Dans une premiere partie, nous avons propose un modele pour la transition G1/Ssous hypoxie. Ce dernier fournit une explication possible a la mise en quiescence descellules tumorales lorsque la pression d’oxygene diminue. Nous avons ensuite cherchea tester ces premiers resultats experimentalement, en utilisant les proprietes des cel-lules HeLa-FUCCI. Or, la sensibilite des fluorophores au manque d’oxygene rend cetteetude delicate. En consequence, nous avons choisi de centrer notre demarche surl’effet de chelateurs du fer souvent utilises, outre leurs effets anti-cancereux, commemolecules stabilisatrices de HIF-1α (DFO et CoCl2). Les cellules FUCCI nous ont alorspermis de suivre temporellement, en microscopie de fluorescence, les modifications dela dynamique du cycle en presence de ces agents chimiques. Nous avons ainsi mis enevidence, tout d’abord, un effet bi-phasique du chlorure de cobalt sur l’entree dans lecycle. C’est la possibilite de suivre precisement, grace aux cellules FUCCI, la progres-sion au sein de la phase G1 qui a permis d’obtenir ce resultat. D’autre part, nous avonsmis en evidence un blocage du cycle en phase G2 en presence de DFO. La reversibilitede cet arret est determinee a la fois par le temps d’exposition et par la concentrationde l’agent chimique. Ces resultats, originaux au vu des etudes anterieures, pourraients’expliquer par une action privilegiee des chelateurs du fer sur la voie MAPK dans lescellules HeLa. Cette hypothese doit etre testee par des etudes approfondies de biologiemoleculaire.
Nous avons ensuite utilise les cellules HeLa-FUCCI afin d’etudier les consequencesd’un retour a la normoxie apres un episode hypoxique. De maniere interessante, nousavons pu observer un ralentissement, sur le long terme, de la phase S, ce qui est coherentavec les donnees de la litterature faisant etat d’une activation des voies de reparation
123

124 Conclusion generale
de l’ADN lors d’une reoxygenation. En outre, les experiences de marquage immunocy-tochimique de HIF-1α que nous avons menees afin de tester l’induction du facteur detranscription par les chelateurs du fer ont revele une grande variabilite de sa localisa-tion. La proteine est soit clairement concentree dans le noyau, soit plus diffuse dans lacellule, ou concentree dans le cytoplasme.
Ces observations posent donc la question de la regulation intra-cellulaire du niveauet de la localisation de HIF-1α, en hypoxie, en normoxie, et en reoxygenation. Nousavons donc choisi d’eclairer ces donnees experimentales par l’etablissement d’un modelecompartimente des voies moleculaires de controle du niveau de HIF-1α. Le modele rel-ativement simple que nous avons mis en place permet d’expliquer les caracteristiquesmajeures de la reponse moleculaires a l’hypoxie. En outre, il montre que la comparti-mentation de la degradation de HIF-1α pourrait avoir un role dans les specificites dela reponse a la reoxygenation. En effet, notre modele genere de fortes instabilites dela concentration nucleaire du facteur de transcription lors d’un retour a la normoxie.Notamment, apres avoir chute rapidement, elle entre dans un regime oscillatoire quila conduit a des valeurs pouvant etre superieures a celles atteintes en hypoxie. Cetteobservation peut etre analysee en regard des donnees experimentales portant sur leseffets biologiques et moleculaires de la reoxygenation : accumulation de HIF-1α, ex-pression de genes specifiques, activation des voies de reparation de l’ADN, apoptose.Ici, les resultats obtenus en modelisation doivent etre couples a un travail experimentalproposant une etude precise de la dynamique du niveau de HIF-1α et de p53 lors d’unretour brutal a la normoxie.
Enfin, la compartimentation de HIF-1α a ete etudiee experimentalement. Les cel-lules HeLa-FUCCI permettent en effet de mener des travaux originaux couplantl’analyse de la progression dans le cycle, et le marquage immunologique d’une proteinedonnee. Des etudes anterieures ont mis en evidence les liens existants entre la pro-liferation cellulaire et la localisation de pVHL. En vertu des hypotheses biologiquessous-tendant notre modele mathematique, l’hypothese d’un lien entre la presence cyto-plamsique ou nucleaire de HIF-1α et la progression dans le cycle apparaıt donc commeplausible. En consequence, nous avons choisi d’observer conjointement les phases ducycle et la localisation intracellulaire de HIF-1α. Il nous est apparu que la variabilitedans la compartimentation de la proteine ne pouvait que tres modestement s’expliquerpar la dynamique du cycle cellulaire. Il est donc necessaire de faire intervenir d’autreshypotheses pour l’expliquer. On peut notamment envisager des differences genetiquesinter-cellulaires. Par exemple, le modele de regulation que nous avons mis en placenous permet de supposer que des mutations dans le systeme d’import/export de pVHLpeuvent affecter la repartition spatiale de HIF-1α. Cette hypothese ouvre la voie ade futures travaux experimentaux. Ceux-ci pourraient apporter de precieux renseigne-ments quant a la dynamique de regulation de HIF-1α, et a sa modification dans lesprocessus de tumorigenese.
Notons pour finir qu’outre nos resultats concernant la reponse a l’hypoxie, cettethese illustre les divers interets que presentent les cellules HeLa-FUCCI dans l’etude ducycle cellulaire. Notamment, nous avons montre comment elles permettaient de quan-tifier l’evolution de la dynamique de proliferation au cours du temps dans differentesconditions : ajout, puis retrait de drogues, reoxygenation. Le systeme FUCCI offre

125
egalement la possibilite de suivre tres precisement la progression dans les differentesphases. En particulier, il rend relativement aisee l’analyse de l’entree dans le cycle(transition G0/G1). Enfin, la derniere partie de ce travail presente une methodologieinteressante permettant de coupler, cellule a cellule, l’analyse de la dynamique du cyclea l’etude de l’expression et de la localisation des proteines. Dans le cas de HIF-1, cetype de demarche a donne de precieuses indications quant a la dynamique de regulationdu facteur de transcription.
De maniere plus generale, les deux directions de recherche que nous avons suiv-ies (modelisation mathematique et experimentation sur une lignee cellulaire donnee)temoignent de la multiplicite des types de discours scientifiques que l’on peut construireautour de l’objet “cancer”. Chacun de ces types de discours possede ses regles propres ;celles-ci sont elaborees et perpetuees au sein de communautes aux contours clairementdefinis, qui leur offrent une legitimite epistemologique. La confrontation de ces differentsstyles de raisonnement avec le monde exterieur met au jour leurs limites respectives.Ainsi, les modeles mathematiques sont-il, par essence, toujours parcellaires, jamais ex-haustifs. Les resultats experimentaux, quant a eux, sont evidemment tributaires deslignees cellulaire utilisees ; celles-ci ne sont finalement que des objets d’etude generesau sein des laboratoires. Elles aussi, finalement, ne sont que des modeles. Dans les deuxcas, le statut epistemique des jugements produits pose question : tout en fournissant uncertain type de savoir, ils portent en effet sur eux, de maniere plus ou moins ostenta-toire, les defauts inherents aux pratiques scientifiques qui les ont engendres. Comment,des lors, penser la multidisciplinarite, c’est a dire la coexistence, ou la cooperation, deces differents types de discours ?
Il est tentant, en un premier temps, de plaider pour une necessaire integration desapproches : les resultats experimentaux abreuvent les entree des modeles mathematiques,et en retour, ces derniers fournissent une certaine forme d’explication aux observa-tions. Les deux styles de raisonnement se justifient ainsi mutuellement, et se felicitentde la legimite epistemique supplementaire ainsi acquise. La vocation d’un modelemathematique sera donc forcement d’etre confronte a des observations experimentales.Cependant, a y regarder de plus pres, cette demarche n’est applicable de maniere sat-isfaisante qu’a un nombre restreint de cas : elle n’offre que rarement de meilleuresdescriptions du monde naturel. A l’inverse, loin de depasser les defauts individuels desdifferentes approches, elle les cumule souvent ; de fait, au lieu d’atteindre un plus hautdegre de generalite, elle tend a particulariser d’autant plus les enonces. Un exempleconcret permet d’illustrer cette idee. Dans mon modele de regulation de HIF-1α, jepars de l’hypothese, confirmee par des observations, que la cinetique d’induction de laproteine ne comporte pas d’instabilites, alors que la reoxygenation en provoque [93]. J’aialors construit un modele permettant de reproduire cette observation. Parallelement,Bagnall et al. [166] ont construit un autre modele mathematique de la regulation deHIF-1α, afin d’expliquer des observations exactement inverses : l’induction de HIF-1α genere des instabilites, et le niveau d’expression de la proteine se contente debaisser regulierement lors du retour a la normoxie. Le point important est que lesdeux demarches sont justifiees : les reactions modelisees sont attestees empiriquement,et les phenomenes a expliquer ont bien ete observes. Les defauts des deux approchesse combinent ici. D’une part, la complexite des reponses cellulaires a l’hypoxie rend

126 Conclusion generale
les observations tres sensibles aux conditions experimentales. D’autre part, les modelesmathematiques utilises ont un degre de liberte suffisant pour s’ajuster a des donneescontradictoires. Finalement, l’integration des discours ne nous apprend rien de neuf :elle ne nous permet pas de formaliser des enonces de plus haut niveau de generalite.Plutot, elle forme un troisieme type d’approche, comportant elle aussi ses limites pro-pres. La vision integrative de la multidisciplinarite n’offre donc aucune garantie quanta la valeur epistemique du discours qu’elle engendre. En d’autres termes, elle ne per-met pas forcement d’identifier des mecanismes explicatifs generaux aux phenomenescomplexes. En consequence, cette forme de multidisciplinarite n’est pas forcement unhorizon a atteindre pour la comprehension generale de la carcinogenese.
Faut-il donc se contenter d’une coexistence des types de discours ? Certains av-ocats du pluralisme, tels que H.Longino, plaident pour cette description de la mul-tidisciplinarite [199]. L’existence de differentes communautes scientifiques clairementdelimitees ne serait alors que la consequence inevitable de la complexite des objetsnaturels. La diversite des types de discours doit alors etre acceptee comme la meilleuredescription de la realite a laquelle nous puissions avoir acces. Rechercher a tout prixl’integration serait, dans ce cadre, une erreur. Il faudrait alors abandonner tout pretentiona la decouverte des mecanismes fondamentaux caches derriere les phenomenes. Cesconsiderations sont particulierement adaptees au cas du cancer. En effet, la com-plexite de cet objet le rend interessant pour differentes communautes scientifiques,qui ne sont pas necessairement en communication les unes avec les autres. S’interrogersur le sens et la valeur epistemique de la multidisciplinarite dans ce cadre est doncparticulierement stimulant. On mettant en valeur plusieurs types d’approches possi-bles, autour du probleme de l’hypoxie tumoral, cette these participe pleinement a cequestionnement.

Bibliographie
[1] D. M. Stroka, T. Burkhardt, I. Desbaillets, R. H. Wenger, D. A. Neil, C. Bauer,M. Gassmann, and D. Candinas. Hif-1 is expressed in normoxic tissue and dis-plays an organ-specific regulation under systemic hypoxia. FASEB J 15(13), 2445(2001). URL http://dx.doi.org/10.1096/fj.01-0125com.
[2] I. Papandreou, A. Powell, A. L. Lim, and N. Denko. Cellular reaction to hypoxia :sensing and responding to an adverse environment. Mutat Res 569(1-2), 87(2005). URL http://dx.doi.org/10.1016/j.mrfmmm.2004.06.054.
[3] L. B. Gardner, Q. Li, M. S. Park, W. M. Flanagan, G. L. Semenza, and C. V.Dang. Hypoxia inhibits g1/s transition through regulation of p27 expression.J Biol Chem 276(11), 7919 (2001). URL http://dx.doi.org/10.1074/jbc.
M010189200.
[4] R. M. Douglas and G. G. Haddad. Genetic models in applied physiology : invitedreview : effect of oxygen deprivation on cell cycle activity : a profile of delay andarrest. J Appl Physiol (1985) 94(5), 2068 (2003). URL http://dx.doi.org/
10.1152/japplphysiol.01029.2002.
[5] T. G. Graeber, J. F. Peterson, M. Tsai, K. Monica, A. J. Fornace, and A. J.Giaccia. Hypoxia induces accumulation of p53 protein, but activation of a g1-phase checkpoint by low-oxygen conditions is independent of p53 status. Mol CellBiol 14(9), 6264 (1994).
[6] P. Carmeliet, Y. Dor, J. M. Herbert, D. Fukumura, K. Brusselmans, M. Dew-erchin, M. Neeman, F. Bono, R. Abramovitch, P. Maxwell, C. J. Koch, P. Rat-cliffe, L. Moons, R. K. Jain, D. Collen, E. Keshert, and E. Keshet. Role of hif-1alpha in hypoxia-mediated apoptosis, cell proliferation and tumour angiogenesis.Nature 394(6692), 485 (1998). URL http://dx.doi.org/10.1038/28867.
[7] K. J. Banasiak and G. G. Haddad. Hypoxia-induced apoptosis : effect of hypoxicseverity and role of p53 in neuronal cell death. Brain Res 797(2), 295 (1998).
[8] E. M. Hammond, N. C. Denko, M. J. Dorie, R. T. Abraham, and A. J. Giaccia.Hypoxia links atr and p53 through replication arrest. Mol Cell Biol 22(6), 1834(2002).
[9] V. Falanga and R. S. Kirsner. Low oxygen stimulates proliferation of fibroblastsseeded as single cells. J Cell Physiol 154(3), 506 (1993).
[10] J. D. Wohrley, M. G. Frid, E. P. Moiseeva, E. C. Orton, J. K. Belknap, and K. R.Stenmark. Hypoxia selectively induces proliferation in a specific subpopulation of
127

128 Bibliographie
smooth muscle cells in the bovine neonatal pulmonary arterial media. J ClinInvest 96(1), 273 (1995).
[11] A. Sahai, C. Mei, T. A. Pattison, and R. L. Tannen. Chronic hypoxia inducesproliferation of cultured mesangial cells : role of calcium and protein kinase c.Am J Physiol 273(6 Pt 2), F954 (1997).
[12] G.-Y. Gwak, J.-H. Yoon, K. M. Kim, H.-S. Lee, J. W. Chung, and G. J. Gores.Hypoxia stimulates proliferation of human hepatoma cells through the inductionof hexokinase ii expression. J Hepatol 42(3), 358 (2005).
[13] A. L. Harris. Hypoxia–a key regulatory factor in tumour growth. Nat Rev Cancer2(1), 38 (2002). URL http://dx.doi.org/10.1038/nrc704.
[14] M. Kunz and S. M. Ibrahim. Molecular responses to hypoxia in tumor cells. MolCancer 2, 23 (2003).
[15] A. R. A. Anderson, A. M. Weaver, P. T. Cummings, and V. Quaranta. Tumormorphology and phenotypic evolution driven by selective pressure from the mi-croenvironment. Cell 127(5), 905 (2006). URL http://dx.doi.org/10.1016/
j.cell.2006.09.042.
[16] S. Rockwell, I. T. Dobrucki, E. Y. Kim, S. T. Marrison, and V. T. Vu. Hypoxiaand radiation therapy : past history, ongoing research, and future promise. CurrMol Med 9(4), 442 (2009).
[17] M. W. Dewhirst. Relationships between cycling hypoxia, hif-1, angiogenesis andoxidative stress. Radiat Res 172(6), 653 (2009). URL http://dx.doi.org/10.
1667/RR1926.1.
[18] L. I. Cardenas-Navia, D. Mace, R. A. Richardson, D. F. Wilson, S. Shan, andM. W. Dewhirst. The pervasive presence of fluctuating oxygenation in tu-mors. Cancer Res 68(14), 5812 (2008). URL http://dx.doi.org/10.1158/
0008-5472.CAN-07-6387.
[19] Q. Zhang, S.-Y. Wang, A. C. Nottke, J. V. Rocheleau, D. W. Piston, and R. H.Goodman. Redox sensor ctbp mediates hypoxia-induced tumor cell migration.Proc Natl Acad Sci U S A 103(24), 9029 (2006). URL http://dx.doi.org/10.
1073/pnas.0603269103.
[20] T. Y. Reynolds, S. Rockwell, and P. M. Glazer. Genetic instability induced bythe tumor microenvironment. Cancer Res 56(24), 5754 (1996).
[21] N. R. Prabhakar. Oxygen sensing during intermittent hypoxia : cellular andmolecular mechanisms. J Appl Physiol (1985) 90(5), 1986 (2001).
[22] D. L. Carden and D. N. Granger. Pathophysiology of ischaemia-reperfusion in-jury. J Pathol 190(3), 255 (2000). URL http://dx.doi.org/3.0.CO;2-6.
[23] E. Conde, L. Alegre, I. Blanco-Sanchez, D. Saenz-Morales, E. Aguado-Fraile,B. Ponte, E. Ramos, A. Saiz, C. Jimenez, A. Ordonez, M. Lopez-Cabrera, L. delPeso, M. O. de Landazuri, F. Liano, R. Selgas, J. A. Sanchez-Tomero, and M. L.Garcia-Bermejo. Hypoxia inducible factor 1-alpha (hif-1 alpha) is induced duringreperfusion after renal ischemia and is critical for proximal tubule cell survival.

Bibliographie 129
PLoS One 7(3), e33258 (2012). URL http://dx.doi.org/10.1371/journal.
pone.0033258.
[24] Q. Ke and M. Costa. Hypoxia-inducible factor-1 (hif-1). Mol Pharmacol 70(5),1469 (2006). URL http://dx.doi.org/10.1124/mol.106.027029.
[25] G. L. Semenza, M. K. Nejfelt, S. M. Chi, and S. E. Antonarakis. Hypoxia-inducible nuclear factors bind to an enhancer element located 3’ to the humanerythropoietin gene. Proc Natl Acad Sci U S A 88(13), 5680 (1991).
[26] G. L. Semenza, P. H. Roth, H. M. Fang, and G. L. Wang. Transcriptional regu-lation of genes encoding glycolytic enzymes by hypoxia-inducible factor 1. J BiolChem 269(38), 23757 (1994).
[27] G. L. Semenza, B. H. Jiang, S. W. Leung, R. Passantino, J. P. Concordet,P. Maire, and A. Giallongo. Hypoxia response elements in the aldolase a, enolase1, and lactate dehydrogenase a gene promoters contain essential binding sites forhypoxia-inducible factor 1. J Biol Chem 271(51), 32529 (1996).
[28] G. L. Wang and G. L. Semenza. Purification and characterization of hypoxia-inducible factor 1. J Biol Chem 270(3), 1230 (1995).
[29] B. Keith, R. S. Johnson, and M. C. Simon. Hif1alpha and hif2alpha : siblingrivalry in hypoxic tumour growth and progression. Nat Rev Cancer 12(1), 9(2012). URL http://dx.doi.org/10.1038/nrc3183.
[30] C. W. Pugh, J. F. O’Rourke, M. Nagao, J. M. Gleadle, and P. J. Ratcliffe.Activation of hypoxia-inducible factor-1 ; definition of regulatory domains withinthe alpha subunit. J Biol Chem 272(17), 11205 (1997).
[31] H. Tian, S. L. McKnight, and D. W. Russell. Endothelial pas domain protein1 (epas1), a transcription factor selectively expressed in endothelial cells. GenesDev 11(1), 72 (1997).
[32] Y. Makino, A. Kanopka, W. J. Wilson, H. Tanaka, and L. Poellinger. Inhibitorypas domain protein (ipas) is a hypoxia-inducible splicing variant of the hypoxia-inducible factor-3alpha locus. J Biol Chem 277(36), 32405 (2002). URL http:
//dx.doi.org/10.1074/jbc.C200328200.
[33] B. H. Jiang, G. L. Semenza, C. Bauer, and H. H. Marti. Hypoxia-inducible factor1 levels vary exponentially over a physiologically relevant range of o2 tension.Am J Physiol 271(4 Pt 1), C1172 (1996).
[34] M. A. Cavadas, L. K. Nguyen, and A. Cheong. Hypoxia-inducible factor (hif)network : insights from mathematical models. Cell Commun Signal 11(1), 42(2013). URL http://dx.doi.org/10.1186/1478-811X-11-42.
[35] H. Zhong, A. M. D. Marzo, E. Laughner, M. Lim, D. A. Hilton, D. Zagzag,P. Buechler, W. B. Isaacs, G. L. Semenza, and J. W. Simons. Overexpression ofhypoxia-inducible factor 1alpha in common human cancers and their metastases.Cancer Res 59(22), 5830 (1999).
[36] T. Hofer, I. Desbaillets, G. HA¶pfl, R. H. Wenger, and M. Gassmann. Character-ization of hif-1 alpha overexpressing hela cells and implications for gene therapy.Comp Biochem Physiol C Toxicol Pharmacol 133(4), 475 (2002).

130 Bibliographie
[37] H. Zhong, F. Agani, A. A. Baccala, E. Laughner, N. Rioseco-Camacho, W. B.Isaacs, J. W. Simons, and G. L. Semenza. Increased expression of hypoxia in-ducible factor-1alpha in rat and human prostate cancer. Cancer Res 58(23), 5280(1998).
[38] V. Pansare. Increased expression of hypoxia-inducible factor 1a in type i and typeii endometrial carcinomas. Modern Pathology (2007).
[39] M. S. Wiesener, P. M. MA14nchenhagen, I. Berger, N. V. Morgan, J. Roigas,
A. Schwiertz, J. S. JA14rgensen, G. Gruber, P. H. Maxwell, S. A. LA¶ning,
U. Frei, E. R. Maher, H. J. GrA¶ne, and K. U. Eckardt. Constitutive acti-vation of hypoxia-inducible genes related to overexpression of hypoxia-induciblefactor-1alpha in clear cell renal carcinomas. Cancer Res 61(13), 5215 (2001).
[40] M. Krieg, R. Haas, H. Brauch, T. Acker, I. Flamme, and K. H. Plate. Up-regulation of hypoxia-inducible factors hif-1alpha and hif-2alpha under normoxicconditions in renal carcinoma cells by von hippel-lindau tumor suppressor geneloss of function. Oncogene 19(48), 5435 (2000). URL http://dx.doi.org/10.
1038/sj.onc.1203938.
[41] K. L. Talks, H. Turley, K. C. Gatter, P. H. Maxwell, C. W. Pugh, P. J. Ratcliffe,and A. L. Harris. The expression and distribution of the hypoxia-inducible factorshif-1alpha and hif-2alpha in normal human tissues, cancers, and tumor-associatedmacrophages. Am J Pathol 157(2), 411 (2000).
[42] E. B. Rankin and A. J. Giaccia. The role of hypoxia-inducible factors in tumori-genesis. Cell Death Differ 15(4), 678 (2008). URL http://dx.doi.org/10.
1038/cdd.2008.21.
[43] G. L. Semenza. Targeting hif-1 for cancer therapy. Nat Rev Cancer 3(10), 721(2003). URL http://dx.doi.org/10.1038/nrc1187.
[44] I. Papandreou, R. A. Cairns, L. Fontana, A. L. Lim, and N. C. Denko. Hif-1mediates adaptation to hypoxia by actively downregulating mitochondrial oxygenconsumption. Cell Metab 3(3), 187 (2006). URL http://dx.doi.org/10.1016/
j.cmet.2006.01.012.
[45] J.-P. Piret, D. Mottet, M. Raes, and C. Michiels. Is hif-1alpha a pro- or ananti-apoptotic protein ? Biochem Pharmacol 64(5-6), 889 (2002).
[46] A. Sermeus and C. Michiels. Reciprocal influence of the p53 and the hypoxicpathways. Cell Death Dis 2, e164 (2011).
[47] S. Hammer, K. K.-W. To, Y.-G. Yoo, M. Koshiji, and L. E. Huang. Hypoxicsuppression of the cell cycle gene cdc25a in tumor cells. Cell Cycle 6(15), 1919(2007).
[48] N. Goda, S. J. Dozier, and R. S. Johnson. Hif-1 in cell cycle regulation, apoptosis,and tumor progression. Antioxid Redox Signal 5(4), 467 (2003).
[49] T. Alarcon, H. M. Byrne, and P. K. Maini. A mathematical model of the effectsof hypoxia on the cell-cycle of normal and cancer cells. J Theor Biol 229(3), 395(2004). URL http://dx.doi.org/10.1016/j.jtbi.2004.04.016.

Bibliographie 131
[50] N. Goda, H. E. Ryan, B. Khadivi, W. McNulty, R. C. Rickert, and R. S. Johnson.Hypoxia-inducible factor 1alpha is essential for cell cycle arrest during hypoxia.Mol Cell Biol 23(1), 359 (2003).
[51] A. H. Box and D. J. Demetrick. Cell cycle kinase inhibitor expression andhypoxia-induced cell cycle arrest in human cancer cell lines. Carcinogenesis25(12), 2325 (2004). URL http://dx.doi.org/10.1093/carcin/bgh274.
[52] W. Wen, J. Ding, W. Sun, K. Wu, B. Ning, W. Gong, G. He, S. Huang, X. Ding,P. Yin, L. Chen, Q. Liu, W. Xie, and H. Wang. Suppression of cyclin d1 byhypoxia-inducible factor-1 via direct mechanism inhibits the proliferation and 5-fluorouracil-induced apoptosis of a549 cells. Cancer Res 70(5), 2010 (2010). URLhttp://dx.doi.org/10.1158/0008-5472.CAN-08-4910.
[53] C. Frei and B. A. Edgar. Drosophila cyclin d/cdk4 requires hif-1 prolyl hydroxylaseto drive cell growth. Dev Cell 6(2), 241 (2004).
[54] M. A. Hernandez-Luna, L. Rocha-Zavaleta, M. I. Vega, and S. Huerta-Yepez. Hy-poxia inducible factor-1 induces chemoresistance phenotype in non-hodgkin lym-phoma cell line via up-regulation of bcl-(xl). Leuk Lymphoma 54, 1048 (2012).URL http://dx.doi.org/10.3109/10428194.2012.733874.
[55] L. Zhang and R. P. Hill. Hypoxia enhances metastatic efficiency by up-regulatingmdm2 in kht cells and increasing resistance to apoptosis. Cancer Res 64(12),4180 (2004). URL http://dx.doi.org/10.1158/0008-5472.CAN-03-3038.
[56] T. Alarcon and H. J. Jensen. Quiescence : a mechanism for escaping the effectsof drug on cell populations. J R Soc Interface 8(54), 99 (2011). URL http:
//dx.doi.org/10.1098/rsif.2010.0130.
[57] C. D. Kamat, D. E. Green, L. Warnke, J. E. Thorpe, A. Ceriello, and M. A. Ihnat.Mutant p53 facilitates pro-angiogenic, hyperproliferative phenotype in response tochronic relative hypoxia. Cancer Lett 249(2), 209 (2007). URL http://dx.doi.
org/10.1016/j.canlet.2006.08.017.
[58] E. Moroz, S. Carlin, K. Dyomina, S. Burke, H. T. Thaler, R. Blasberg, andI. Serganova. Real-time imaging of hif-1alpha stabilization and degradation. PLoSOne 4(4), e5077 (2009). URL http://dx.doi.org/10.1371/journal.pone.
0005077.
[59] X. Wang, S. Ma, and G. Qi. Effect of hypoxia-inducible factor 1-alpha onhypoxia/reoxygenation-induced apoptosis in primary neonatal rat cardiomyocytes.Biochem Biophys Res Commun 417(4), 1227 (2012). URL http://dx.doi.org/
10.1016/j.bbrc.2011.12.115.
[60] P. Martinive, F. Defresne, E. Quaghebeur, G. Daneau, N. Crokart, V. Gregoire,B. Gallez, C. Dessy, and O. Feron. Impact of cyclic hypoxia on hif-1alpha regula-tion in endothelial cells–new insights for anti-tumor treatments. FEBS J 276(2),509 (2009). URL http://dx.doi.org/10.1111/j.1742-4658.2008.06798.x.
[61] G. Yuan, J. Nanduri, S. Khan, G. L. Semenza, and N. R. Prabhakar. Inductionof hif-1alpha expression by intermittent hypoxia : involvement of nadph oxidase,ca2+ signaling, prolyl hydroxylases, and mtor. J Cell Physiol 217(3), 674 (2008).URL http://dx.doi.org/10.1002/jcp.21537.

132 Bibliographie
[62] M. W. Dewhirst. Intermittent hypoxia furthers the rationale for hypoxia-induciblefactor-1 targeting. Cancer Res 67(3), 854 (2007). URL http://dx.doi.org/10.
1158/0008-5472.CAN-06-4744.
[63] L. Luo, J. Lu, L. Wei, D. Long, J. Y. Guo, J. Shan, F. S. Li, P. Y. Lu, P. Y. Li,and L. Feng. The role of hif-1 in up-regulating mica expression on human renalproximal tubular epithelial cells during hypoxia/reoxygenation. BMC Cell Biol11, 91 (2010). URL http://dx.doi.org/10.1186/1471-2121-11-91.
[64] P. H. Maxwell, M. S. Wiesener, G. W. Chang, S. C. Clifford, E. C. Vaux,M. E. Cockman, C. C. Wykoff, C. W. Pugh, E. R. Maher, and P. J. Rat-cliffe. The tumour suppressor protein vhl targets hypoxia-inducible factors foroxygen-dependent proteolysis. Nature 399(6733), 271 (1999). URL http:
//dx.doi.org/10.1038/20459.
[65] X. Zheng, J. L. Ruas, R. Cao, F. A. Salomons, Y. Cao, L. Poellinger, andT. Pereira. Cell-type-specific regulation of degradation of hypoxia-inducible factor1 alpha : role of subcellular compartmentalization. Mol Cell Biol 26(12), 4628(2006). URL http://dx.doi.org/10.1128/MCB.02236-05.
[66] I. Groulx and S. Lee. Oxygen-dependent ubiquitination and degradation ofhypoxia-inducible factor requires nuclear-cytoplasmic trafficking of the von hippel-lindau tumor suppressor protein. Mol Cell Biol 22(15), 5319 (2002).
[67] L. K. Nguyen, M. A. S. Cavadas, C. C. Scholz, S. F. Fitzpatrick, U. Bruning,E. P. Cummins, M. M. Tambuwala, M. C. Manresa, B. N. Kholodenko, C. T.Taylor, and A. Cheong. A dynamic model of the hypoxia-inducible factor 1alpha(hif-1alpha) network. J Cell Sci 126(Pt 6), 1454 (2013). URL http://dx.doi.
org/10.1242/jcs.119974.
[68] K. W. Kohn, J. Riss, O. Aprelikova, J. N. Weinstein, Y. Pommier, and J. C.Barrett. Properties of switch-like bioregulatory networks studied by simulationof the hypoxia response control system. Mol Biol Cell 15(7), 3042 (2004). URLhttp://dx.doi.org/10.1091/mbc.E03-12-0897.
[69] A. A. Qutub and A. S. Popel. Three autocrine feedback loops determine hif1 alphaexpression in chronic hypoxia. Biochim Biophys Acta 1773(10), 1511 (2007).URL http://dx.doi.org/10.1016/j.bbamcr.2007.07.004.
[70] E. Potuckova, H. Jansova, M. Machacek, A. Vavrova, P. Haskova, L. Tichotova,V. Richardson, D. S. Kalinowski, D. R. Richardson, and T. Simunek. Quantitativeanalysis of the anti-proliferative activity of combinations of selected iron-chelatingagents and clinically used anti-neoplastic drugs. PLoS One 9(2), e88754 (2014).URL http://dx.doi.org/10.1371/journal.pone.0088754.
[71] Y. Yu, Z. Kovacevic, and D. R. Richardson. Tuning cell cycle regulation with aniron key. Cell Cycle 6(16), 1982 (2007).
[72] H. Xiao, Z. Gu, G. Wang, and T. Zhao. The possible mechanisms underlying theimpairment of hif-1 pathway signaling in hyperglycemia and the beneficial effectsof certain therapies. Int J Med Sci 10(10), 1412 (2013).

Bibliographie 133
[73] M. Guo, L.-P. Song, Y. Jiang, W. Liu, Y. Yu, and G.-Q. Chen. Hypoxia-mimeticagents desferrioxamine and cobalt chloride induce leukemic cell apoptosis throughdifferent hypoxia-inducible factor-1alpha independent mechanisms. Apoptosis11(1), 67 (2006).
[74] H.-L. Zeng, Q. Zhong, Y.-L. Qin, Q.-Q. Bu, X.-A. Han, H.-T. Jia, and H.-W. Liu.Hypoxia-mimetic agents inhibit proliferation and alter the morphology of humanumbilical cord-derived mesenchymal stem cells. BMC Cell Biol 12, 32 (2011).URL http://dx.doi.org/10.1186/1471-2121-12-32.
[75] Z.-J. Dai, J. Gao, X.-B. Ma, K. Yan, X.-X. Liu, H.-F. Kang, Z.-Z. Ji, H.-T. Guan,and X.-J. Wang. Up-regulation of hypoxia inducible factor-1 by cobalt chloridecorrelates with proliferation and apoptosis in pc-2 cells. J Exp Clin Cancer Res31, 28 (2012).
[76] J.-H. Lee, S.-H. Choi, M.-W. Baek, M.-H. Kim, H.-J. Kim, S.-H. Kim, S.-J.Oh, H.-J. Park, W.-J. Kim, and J.-Y. Jung. Cocl2 induces apoptosis through themitochondria- and death receptor-mediated pathway in the mouse embryonic stemcells. Mol Cell Biochem 379(1-2), 133 (2013).
[77] T. D. Ardyanto, M. Osaki, N. Tokuyasu, Y. Nagahama, and H. Ito. Cocl2-inducedhif-1alpha expression correlates with proliferation and apoptosis in mkn-1 cells :a possible role for the pi3k/akt pathway. Int J Oncol 29(3), 549 (2006).
[78] S. Bae, H.-J. Jeong, H. J. Cha, K. Kim, Y. M. Choi, I.-S. An, H. J. Koh, D. J.Lim, S.-J. Lee, and S. An. The hypoxia-mimetic agent cobalt chloride induces cellcycle arrest and alters gene expression in u266 multiple myeloma cells. Int J MolMed 30(5), 1180 (2012). URL http://dx.doi.org/10.3892/ijmm.2012.1115.
[79] A. Triantafyllou, P. Liakos, A. Tsakalof, E. Georgatsou, G. Simos, and S. Bo-nanou. Cobalt induces hypoxia-inducible factor-1alpha (hif-1alpha) in hela cellsby an iron-independent, but ros-, pi-3k- and mapk-dependent mechanism. FreeRadic Res 40(8), 847 (2006).
[80] J. J. Lucas, A. Szepesi, J. Domenico, K. Takase, A. Tordai, N. Terada, and E. W.Gelfand. Effects of iron-depletion on cell cycle progression in normal humant lymphocytes : selective inhibition of the appearance of the cyclin a-associatedcomponent of the p33cdk2 kinase. Blood 86(6), 2268 (1995).
[81] C. Brodie, G. Siriwardana, J. Lucas, R. Schleicher, N. Terada, A. Szepesi,E. Gelfand, and P. Seligman. Neuroblastoma sensitivity to growth inhibition bydeferrioxamine : evidence for a block in g1 phase of the cell cycle. Cancer Res53(17), 3968 (1993).
[82] C. Metzendorf and M. I. Lind. The role of iron in the proliferation of drosophilal(2) mbn cells. Biochem Biophys Res Commun 400(3), 442 (2010). URL http:
//dx.doi.org/10.1016/j.bbrc.2010.08.100.
[83] G. Siriwardana and P. A. Seligman. Two cell cycle blocks caused by iron chelationof neuroblastoma cells : separating cell cycle events associated with each block.Physiol Rep 1(7), e00176 (2013). URL http://dx.doi.org/10.1002/phy2.176.

134 Bibliographie
[84] F. J. Renton and T. M. Jeitner. Cell cycle-dependent inhibition of the proliferationof human neural tumor cell lines by iron chelators. Biochem Pharmacol 51(11),1553 (1996).
[85] A. Sakaue-Sawano, H. Kurokawa, T. Morimura, A. Hanyu, H. Hama, H. Os-awa, S. Kashiwagi, K. Fukami, T. Miyata, H. Miyoshi, T. Imamura, M. Ogawa,H. Masai, and A. Miyawaki. Visualizing spatiotemporal dynamics of multicellularcell-cycle progression. Cell 132(3), 487 (2008).
[86] M. Mechali and M. Lutzmann. The cell cycle : now live and in color. Cell 132(3),341 (2008). URL http://dx.doi.org/10.1016/j.cell.2008.01.031.
[87] G. Carlier, A. Maugein, C. Cordier, S. Pechberty, M. Garfa-TraorA c©, P. Martin,R. Scharfmann, and O. Albagli. Human fucci pancreatic beta cell lines : new toolsto study beta cell cycle and terminal differentiation. PLoS One 9(9), e108202(2014). URL http://dx.doi.org/10.1371/journal.pone.0108202.
[88] A. Kaida, N. Sawai, K. Sakaguchi, and M. Miura. Fluorescence kinetics in helacells after treatment with cell cycle arrest inducers visualized with fucci (fluores-cent ubiquitination-based cell cycle indicator). Cell Biol Int 35(4), 359 (2011).URL http://dx.doi.org/10.1042/CBI20100643.
[89] T. Nagano, T. Hashimoto, A. Nakashima, S. ichi Hisanaga, U. Kikkawa, andS. Kamada. Cyclin i is involved in the regulation of cell cycle progression. CellCycle 12(16), 2617 (2013).
[90] N. Zielke, J. Korzelius, M. van Straaten, K. Bender, G. F. P. Schuhknecht,D. Dutta, J. Xiang, and B. A. Edgar. Fly-fucci : A versatile tool for study-ing cell proliferation in complex tissues. Cell Rep 7(2), 588 (2014). URLhttp://dx.doi.org/10.1016/j.celrep.2014.03.020.
[91] M. Sugiyama, A. Sakaue-Sawano, T. Iimura, K. Fukami, T. Kitaguchi,K. Kawakami, H. Okamoto, S. ichi Higashijima, and A. Miyawaki. Illuminat-ing cell-cycle progression in the developing zebrafish embryo. Proc Natl Acad SciU S A 106(49), 20812 (2009).
[92] B. Bedessem and A. Stephanou. A mathematical model of hif-1-mediated responseto hypoxia on the g1/s transition. Math Biosci 248, 31 (2014). URL http:
//dx.doi.org/10.1016/j.mbs.2013.11.007.
[93] B. Bedessem, M.-P. Montmasson, M. Hamel, F. Giroud, and A. Stephanou. Ef-fects of the hypoxia-mimetic agents dfo and cocl2 on hela-fucci cells. Journal ofCell Biology and Cell Metabolism 2 :1 (2015).
[94] B. Bedessem and A. Stephanou. Role of compartmentalization on hif-1alphadegradation dynamics during changing oxygen conditions : A computational ap-proach. PLoS One 9(10), e110495 (2014). URL http://dx.doi.org/10.1371/
journal.pone.0110495.
[95] A. Csikasz-Nagy. Computational systems biology of the cell cycle. Brief Bioinform10(4), 424 (2009). URL http://dx.doi.org/10.1093/bib/bbp005.
[96] J. J. Tyson and B. Novak. Regulation of the eukaryotic cell cycle : molecularantagonism, hysteresis, and irreversible transitions. J Theor Biol 210(2), 249(2001). URL http://dx.doi.org/10.1006/jtbi.2001.2293.

Bibliographie 135
[97] B. Novak and J. J. Tyson. A model for restriction point control of the mammaliancell cycle. J Theor Biol 230(4), 563 (2004). URL http://dx.doi.org/10.1016/
j.jtbi.2004.04.039.
[98] J. L. Cherry and F. R. Adler. How to make a biological switch. J Theor Biol203(2), 117 (2000). URL http://dx.doi.org/10.1006/jtbi.2000.1068.
[99] A.-C. Lesart, B. van der Sanden, L. Hamard, F. Esteve, and A. Stephanou. On theimportance of the submicrovascular network in a computational model of tumourgrowth. Microvasc Res 84(2), 188 (2012). URL http://dx.doi.org/10.1016/
j.mvr.2012.06.001.
[100] J. A. Royds, S. K. Dower, E. E. Qwarnstrom, and C. E. Lewis. Response oftumour cells to hypoxia : role of p53 and nfkb. Mol Pathol 51(2), 55 (1998).
[101] O. Letonqueze, J. Lee, and S. Vasudevan. Microrna-mediated posttranscriptionalmechanisms of gene expression in proliferating and quiescent cancer cells. RNABiol 9(6), 871 (2012). URL http://dx.doi.org/10.4161/rna.20806.
[102] G. G. Powathil, K. E. Gordon, L. A. Hill, and M. A. J. Chaplain. Modelling theeffects of cell-cycle heterogeneity on the response of a solid tumour to chemother-apy : biological insights from a hybrid multiscale cellular automaton model. JTheor Biol 308, 1 (2012). URL http://dx.doi.org/10.1016/j.jtbi.2012.
05.015.
[103] Y. Leshem and O. Halevy. Phosphorylation of prb is required for hgf-inducedmuscle cell proliferation and is p27kip1-dependent. J Cell Physiol 191(2), 173(2002). URL http://dx.doi.org/10.1002/jcp.10089.
[104] C. Park, I. Lee, and W. K. Kang. Lovastatin-induced e2f-1 modulation and itseffect on prostate cancer cell death. Carcinogenesis 22(10), 1727 (2001).
[105] S. L. Green, R. A. Freiberg, and A. J. Giaccia. p21(cip1) and p27(kip1) regulatecell cycle reentry after hypoxic stress but are not necessary for hypoxia-inducedarrest. Mol Cell Biol 21(4), 1196 (2001). URL http://dx.doi.org/10.1128/
MCB.21.4.1196-1206.2001.
[106] J. I. Bardos and M. Ashcroft. Negative and positive regulation of hif-1 : a complexnetwork. Biochim Biophys Acta 1755(2), 107 (2005).
[107] O. Hashimoto, K. Shimizu, S. Semba, S. Chiba, Y. Ku, H. Yokozaki, and Y. Hori.Hypoxia induces tumor aggressiveness and the expansion of cd133-positive cellsin a hypoxia-inducible factor-1alpha-dependent manner in pancreatic cancer cells.Pathobiology 78(4), 181 (2011).
[108] B. Bao, S. Ali, A. Ahmad, A. S. Azmi, Y. Li, S. Banerjee, D. Kong, S. Sethi,A. Aboukameel, S. B. Padhye, and F. H. Sarkar. Hypoxia-induced aggressivenessof pancreatic cancer cells is due to increased expression of vegf, il-6 and mir-21,which can be attenuated by cdf treatment. PLoS One 7(12), e50165 (2012).
[109] W.-T. Chen, C.-J. Huang, M.-T. Wu, S.-F. Yang, Y.-C. Su, and C.-Y. Chai.Hypoxia-inducible factor-1alpha is associated with risk of aggressive behavior andtumor angiogenesis in gastrointestinal stromal tumor. Jpn J Clin Oncol 35(4),207 (2005).

136 Bibliographie
[110] A. CsikA¡asz-Nagy, D. Battogtokh, K. C. Chen, B. NovA¡k, and J. J. Tyson.Analysis of a generic model of eukaryotic cell-cycle regulation. Biophys J 90(12),4361 (2006). URL http://dx.doi.org/10.1529/biophysj.106.081240.
[111] M. Barberis, E. Klipp, M. Vanoni, and L. Alberghina. Cell size at s phase initi-ation : an emergent property of the g1/s network. PLoS Comput Biol 3(4), e64(2007). URL http://dx.doi.org/10.1371/journal.pcbi.0030064.
[112] K. Yang, M. Hitomi, and D. W. Stacey. Variations in cyclin d1 levels through thecell cycle determine the proliferative fate of a cell. Cell Div 1, 32 (2006). URLhttp://dx.doi.org/10.1186/1747-1028-1-32.
[113] G. L. Semenza. Hypoxia-inducible factor 1 (hif-1) pathway. Sci STKE 2007(407),cm8 (2007).
[114] S. Salceda and J. Caro. Hypoxia-inducible factor 1alpha (hif-1alpha) proteinis rapidly degraded by the ubiquitin-proteasome system under normoxic condi-tions. its stabilization by hypoxia depends on redox-induced changes. J Biol Chem272(36), 22642 (1997).
[115] J. M. Brown and W. R. Wilson. Exploiting tumour hypoxia in cancer treatment.Nat Rev Cancer 4(6), 437 (2004).
[116] G. L. Semenza. Targeting hif-1 for cancer therapy. Nat Rev Cancer 3(10), 721(2003).
[117] G. L. Semenza. Hypoxia-inducible factors : mediators of cancer progression andtargets for cancer therapy. Trends Pharmacol Sci 33(4), 207 (2012). URL http:
//dx.doi.org/10.1016/j.tips.2012.01.005.
[118] S. Filippi, P. Latini, M. Frontini, F. Palitti, J.-M. Egly, and L. Proietti-De-Santis.Csb protein is (a direct target of hif-1 and) a critical mediator of the hypoxicresponse. EMBO J 27(19), 2545 (2008). URL http://dx.doi.org/10.1038/
emboj.2008.180.
[119] J. T. Winston and W. J. Pledger. Growth factor regulation of cyclin d1 mrnaexpression through protein synthesis-dependent and -independent mechanisms.Mol Biol Cell 4(11), 1133 (1993).
[120] P. H. Maxwell, C. W. Pugh, and P. J. Ratcliffe. The pvhl-hif-1 system. a keymediator of oxygen homeostasis. Adv Exp Med Biol 502, 365 (2001).
[121] F. van Drogen, O. Sangfelt, A. Malyukova, L. Matskova, E. Yeh, A. R. Means,and S. I. Reed. Ubiquitylation of cyclin e requires the sequential function of scfcomplexes containing distinct hcdc4 isoforms. Mol Cell 23(1), 37 (2006). URLhttp://dx.doi.org/10.1016/j.molcel.2006.05.020.
[122] W. Zhou, T. L. Dosey, T. Biechele, R. T. Moon, M. S. Horwitz, and H. Ruohola-Baker. Assessment of hypoxia inducible factor levels in cancer cell lines uponhypoxic induction using a novel reporter construct. PLoS One 6(11), e27460(2011). URL http://dx.doi.org/10.1371/journal.pone.0027460.
[123] D. W. Stacey. Cyclin d1 serves as a cell cycle regulatory switch in actively pro-liferating cells. Curr Opin Cell Biol 15(2), 158 (2003).

Bibliographie 137
[124] R. A. Gatenby and R. J. Gillies. Why do cancers have high aerobic glycolysis ?Nat Rev Cancer 4(11), 891 (2004).
[125] A. Icreverzi, A. F. de la Cruz, W. A. V. Voorhies, and B. A. Edgar. Drosophilacyclin d/cdk4 regulates mitochondrial biogenesis and aging and sensitizes animalsto hypoxic stress. Cell Cycle 11(3), 554 (2012). URL http://dx.doi.org/10.
4161/cc.11.3.19062.
[126] P. P. Provenzano and P. J. Keely. Mechanical signaling through the cytoskeletonregulates cell proliferation by coordinated focal adhesion and rho gtpase signaling.J Cell Sci 124(Pt 8), 1195 (2011).
[127] M. Baba, S. Hirai, H. Yamada-Okabe, K. Hamada, H. Tabuchi, K. Kobayashi,K. Kondo, M. Yoshida, A. Yamashita, T. Kishida, N. Nakaigawa, Y. Nagashima,Y. Kubota, M. Yao, and S. Ohno. Loss of von hippel-lindau protein causes celldensity dependent deregulation of cyclind1 expression through hypoxia-induciblefactor. Oncogene 22(18), 2728 (2003). URL http://dx.doi.org/10.1038/sj.
onc.1206373.
[128] A. Kaida and M. Miura. Visualizing the effect of hypoxia on fluorescence kineticsin living hela cells using the fluorescent ubiquitination-based cell cycle indicator(fucci). Exp Cell Res 318(3), 288 (2012).
[129] A. Kaida and M. Miura. Differential dependence on oxygen tension during thematuration process between monomeric kusabira orange 2 and monomeric azamigreen expressed in hela cells. Biochem Biophys Res Commun 421(4), 855 (2012).
[130] M. A. Hernandez-Luna, L. Rocha-Zavaleta, M. I. Vega, and S. Huerta-Yepez. Hy-poxia inducible factor-1 induces chemoresistance phenotype in non-hodgkin lym-phoma cell line via up-regulation of bcl-xl. Leuk Lymphoma 54(5), 1048 (2013).
[131] C. Michiels, F. D. Leener, T. Arnould, M. Dieu, and J. Remacle. Hypoxiastimulates human endothelial cells to release smooth muscle cell mitogens : roleof prostaglandins and bfgf. Exp Cell Res 213(1), 43 (1994). URL http:
//dx.doi.org/10.1006/excr.1994.1171.
[132] R. E. Banks, P. Tirukonda, C. Taylor, N. Hornigold, D. Astuti, D. Cohen, E. R.Maher, A. J. Stanley, P. Harnden, A. Joyce, M. Knowles, and P. J. Selby. Geneticand epigenetic analysis of von hippel-lindau (vhl) gene alterations and relationshipwith clinical variables in sporadic renal cancer. Cancer Res 66(4), 2000 (2006).
[133] E. May, J. R. Jenkins, and P. May. Endogenous hela p53 proteins are easilydetected in hela cells transfected with mouse deletion mutant p53 gene. Oncogene6(8), 1363 (1991).
[134] Y. Minagawa, J. Kigawa, H. Itamochi, Y. Kanamori, M. Shimada, M. Takahashi,and N. Terakawa. Cisplatin-resistant hela cells are resistant to apoptosis via p53-dependent and -independent pathways. Jpn J Cancer Res 90(12), 1373 (1999).
[135] R. Koivusalo, E. Krausz, H. Helenius, and S. Hietanen. Chemotherapy compoundsin cervical cancer cells primed by reconstitution of p53 function after short inter-fering rna-mediated degradation of human papillomavirus 18 e6 mrna : oppositeeffect of sirna in combination with different drugs. Mol Pharmacol 68(2), 372(2005). URL http://dx.doi.org/10.1124/mol.105.011189.

138 Bibliographie
[136] S. S. Kim, H.-S. Chae, J.-H. Bach, M. W. Lee, K. Y. Kim, W. B. Lee, Y.-M.Jung, J. V. Bonventre, and Y.-H. Suh. P53 mediates ceramide-induced apoptosisin skn-sh cells. Oncogene 21(13), 2020 (2002). URL http://dx.doi.org/10.
1038/sj.onc.1205037.
[137] C.-M. Park, M.-J. Park, H.-J. Kwak, S.-I. Moon, D.-H. Yoo, H.-C. Lee, I.-C.Park, C. H. Rhee, and S.-I. Hong. Induction of p53-mediated apoptosis andrecovery of chemosensitivity through p53 transduction in human glioblastoma cellsby cisplatin. Int J Oncol 28(1), 119 (2006).
[138] C. Gaitanaki, T. Kalpachidou, I.-K. S. Aggeli, P. Papazafiri, and I. Beis. Cocl2induces protective events via the p38-mapk signalling pathway and anp in theperfused amphibian heart. J Exp Biol 210(Pt 13), 2267 (2007). URL http:
//dx.doi.org/10.1242/jeb.003178.
[139] T. A. Markel, P. R. Crisostomo, M. Wang, C. M. Herring, T. Lahm, K. K.Meldrum, K. D. Lillemoe, F. J. Rescorla, and D. R. Meldrum. Iron chelationacutely stimulates fetal human intestinal cell production of il-6 and vegf whiledecreasing hgf : the roles of p38, erk, and jnk mapk signaling. Am J PhysiolGastrointest Liver Physiol 292(4), G958 (2007). URL http://dx.doi.org/10.
1152/ajpgi.00502.2006.
[140] S.-K. Lee, H.-J. Jang, H.-J. Lee, J. Lee, B.-H. Jeon, C.-D. Jun, S.-K. Lee, andE.-C. Kim. p38 and erk map kinase mediates iron chelator-induced apoptosisand -suppressed differentiation of immortalized and malignant human oral ker-atinocytes. Life Sci 79(15), 1419 (2006). URL http://dx.doi.org/10.1016/j.
lfs.2006.04.011.
[141] W. wei An, X. feng Gong, M. wei Wang, S. ichi Tashiro, S. Onodera, and T. Ike-jima. Norcantharidin induces apoptosis in hela cells through caspase, mapk, andmitochondrial pathways. Acta Pharmacol Sin 25(11), 1502 (2004).
[142] W. Zhong, H. Zhu, F. Sheng, Y. Tian, J. Zhou, Y. Chen, S. Li, and J. Lin.Activation of the mapk11/12/13/14 (p38 mapk) pathway regulates the tran-scription of autophagy genes in response to oxidative stress induced by a novelcopper complex in hela cells. Autophagy 10(7), 1285 (2014). URL http:
//dx.doi.org/10.4161/auto.28789.
[143] P. Astuti, T. Pike, C. Widberg, E. Payne, A. Harding, J. Hancock, andB. Gabrielli. Mapk pathway activation delays g2/m progression by destabiliz-ing cdc25b. J Biol Chem 284(49), 33781 (2009). URL http://dx.doi.org/10.
1074/jbc.M109.027516.
[144] J. Gao, Y. Zhao, Y. Lv, Y. Chen, B. Wei, J. Tian, Z. Yang, F. Kong, J. Pang,J. Liu, and H. Shi. Mirk/dyrk1b mediates g0/g1 to s phase cell cycle progressionand cell survival involving mapk/erk signaling in human cancer cells. Cancer CellInt 13(1), 2 (2013). URL http://dx.doi.org/10.1186/1475-2867-13-2.
[145] L. Bai, R. Mao, J. Wang, L. Ding, S. Jiang, C. Gao, H. Kang, X. Chen, X. Sun,and J. Xu. Erk1/2 promoted proliferation and inhibited apoptosis of human cervi-cal cancer cells and regulated the expression of c-fos and c-jun proteins. Med On-col 32(3), 490 (2015). URL http://dx.doi.org/10.1007/s12032-015-0490-5.

Bibliographie 139
[146] C. Hao, W. Hao, X. Wei, L. Xing, J. Jiang, and L. Shang. The role of mapkin the biphasic dose-response phenomenon induced by cadmium and mercury inhek293 cells. Toxicol In Vitro 23(4), 660 (2009). URL http://dx.doi.org/10.
1016/j.tiv.2009.03.005.
[147] R. K. Bruick. Expression of the gene encoding the proapoptotic nip3 protein isinduced by hypoxia. Proc Natl Acad Sci U S A 97(16), 9082 (2000).
[148] S. Nagel, M. Papadakis, R. Chen, L. C. Hoyte, K. J. Brooks, D. Gallichan,N. R. Sibson, C. Pugh, and A. M. Buchan. Neuroprotection by dimethyloxa-lylglycine following permanent and transient focal cerebral ischemia in rats. JCereb Blood Flow Metab 31(1), 132 (2011). URL http://dx.doi.org/10.1038/
jcbfm.2010.60.
[149] Q. Yuan, O. Bleiziffer, A. M. Boos, J. Sun, A. Brandl, J. P. Beier, A. Arkudas,M. Schmitz, U. Kneser, and R. E. Horch. Phds inhibitor dmog promotes thevascularization process in the av loop by hif-1a up-regulation and the preliminarydiscussion on its kinetics in rat. BMC Biotechnol 14, 112 (2014). URL http:
//dx.doi.org/10.1186/s12896-014-0112-x.
[150] J. Seim, P. Graff, O. Amellem, K. S. Landsverk, T. Stokke, and E. O. Pettersen.Hypoxia-induced irreversible s-phase arrest involves down-regulation of cyclin a.Cell Prolif 36(6), 321 (2003).
[151] B.-M. Kim, J. Y. Choi, Y.-J. Kim, H.-D. Woo, and H. W. Chung. Reoxygenationfollowing hypoxia activates dna-damage checkpoint signaling pathways that sup-press cell-cycle progression in cultured human lymphocytes. FEBS Lett 581(16),3005 (2007). URL http://dx.doi.org/10.1016/j.febslet.2007.05.053.
[152] M. Olcina, P. S. Lecane, and E. M. Hammond. Targeting hypoxic cells throughthe dna damage response. Clin Cancer Res 16(23), 5624 (2010). URL http:
//dx.doi.org/10.1158/1078-0432.CCR-10-0286.
[153] E. M. Hammond, M. J. Dorie, and A. J. Giaccia. Inhibition of atr leads toincreased sensitivity to hypoxia/reoxygenation. Cancer Res 64(18), 6556 (2004).URL http://dx.doi.org/10.1158/0008-5472.CAN-04-1520.
[154] R. A. Freiberg, A. J. Krieg, A. J. Giaccia, and E. M. Hammond. Checking in onhypoxia/reoxygenation. Cell Cycle 5(12), 1304 (2006).
[155] S. Hara, C. Kobayashi, and N. Imura. Nuclear localization of hypoxia-induciblefactor-2alpha in bovine arterial endothelial cells. Mol Cell Biol Res Commun2(2), 119 (1999). URL http://dx.doi.org/10.1006/mcbr.1999.0160.
[156] H.-P. Kubis, N. Hanke, R. J. Scheibe, and G. Gros. Accumulation and nuclearimport of hif1 alpha during high and low oxygen concentration in skeletal musclecells in primary culture. Biochim Biophys Acta 1745(2), 187 (2005). URLhttp://dx.doi.org/10.1016/j.bbamcr.2005.05.007.
[157] D. Cao, M. Hou, Y. song Guan, M. Jiang, Y. Yang, and H. feng Gou. Expressionof hif-1alpha and vegf in colorectal cancer : association with clinical outcomesand prognostic implications. BMC Cancer 9, 432 (2009).

140 Bibliographie
[158] U. Berchner-Pfannschmidt, S. Frede, C. Wotzlaw, and J. Fandrey. Imaging ofthe hypoxia-inducible factor pathway : insights into oxygen sensing. Eur RespirJ 32(1), 210 (2008). URL http://dx.doi.org/10.1183/09031936.00013408.
[159] S. Lee, D. Y. Chen, J. S. Humphrey, J. R. Gnarra, W. M. Linehan, and R. D.Klausner. Nuclear/cytoplasmic localization of the von hippel-lindau tumor sup-pressor gene product is determined by cell density. Proc Natl Acad Sci U S A93(5), 1770 (1996).
[160] S. Lee, M. Neumann, R. Stearman, R. Stauber, A. Pause, G. N. Pavlakis, andR. D. Klausner. Transcription-dependent nuclear-cytoplasmic trafficking is re-quired for the function of the von hippel-lindau tumor suppressor protein. MolCell Biol 19(2), 1486 (1999).
[161] M. Los, G. H. Jansen, W. G. Kaelin, C. J. Lips, G. H. Blijham, and E. E. Voest.Expression pattern of the von hippel-lindau protein in human tissues. Lab Invest75(2), 231 (1996).
[162] C.-H. Hsieh, J.-W. Kuo, Y.-J. Lee, C.-W. Chang, J. G. Gelovani, and R.-S. Liu.Construction of mutant tkgfp for real-time imaging of temporal dynamics of hif-1signal transduction activity mediated by hypoxia and reoxygenation in tumors inliving mice. J Nucl Med 50(12), 2049 (2009). URL http://dx.doi.org/10.
2967/jnumed.108.061234.
[163] B. C. Yang, D. S. Zander, and J. L. Mehta. Hypoxia-reoxygenation-induced apop-tosis in cultured adult rat myocytes and the protective effect of platelets and trans-forming growth factor-beta(1). J Pharmacol Exp Ther 291(2), 733 (1999).
[164] P. M. Kang, A. Haunstetter, H. Aoki, A. Usheva, and S. Izumo. Morphologicaland molecular characterization of adult cardiomyocyte apoptosis during hypoxiaand reoxygenation. Circ Res 87(2), 118 (2000).
[165] M. Heiner and K. Sriram. Structural analysis to determine the core of hypoxiaresponse network. PLoS One 5(1), e8600 (2010). URL http://dx.doi.org/10.
1371/journal.pone.0008600.
[166] J. Bagnall, J. Leedale, S. E. Taylor, D. G. Spiller, M. R. H. White, K. J. Sharkey,R. N. Bearon, and V. See. Tight control of hypoxia-inducible factor transientdynamics is essential for cell survival in hypoxia. J Biol Chem 289(9), 5549(2014). URL http://dx.doi.org/10.1074/jbc.M113.500405.
[167] M. V. Blagosklonny. Do vhl and hif-1 mirror p53 and mdm-2 ? degradation-transactivation loops of oncoproteins and tumor suppressors. Oncogene 20(3),395 (2001). URL http://dx.doi.org/10.1038/sj.onc.1204055.
[168] P. Renbaum, F. M. Duh, F. Latif, B. Zbar, M. I. Lerman, and I. Kuzmin. Isolationand characterization of the full-length 3’ untranslated region of the human vonhippel-lindau tumor suppressor gene. Hum Genet 98(6), 666 (1996).
[169] J. Karhausen, T. Kong, S. Narravula, and S. P. Colgan. Induction of the vonhippel-lindau tumor suppressor gene by late hypoxia limits hif-1 expression. J CellBiochem 95(6), 1264 (2005). URL http://dx.doi.org/10.1002/jcb.20489.

Bibliographie 141
[170] A. Hunziker, M. H. Jensen, and S. Krishna. Stress-specific response of the p53-mdm2 feedback loop. BMC Syst Biol 4, 94 (2010). URL http://dx.doi.org/
10.1186/1752-0509-4-94.
[171] P. Kooner, P. K. Maini, and D. J. Gavaghan. Mathematical modelling of the hif-1 mediated hypoxic response in tumours. Proceedings of the 2005 InternationalSymposium on Mathematical & Computational Biology BIOMAT 2005 pp. 281–315 (2006).
[172] M. P. Rechsteiner, A. von Teichman, A. Nowicka, T. Sulser, P. Schraml, andH. Moch. Vhl gene mutations and their effects on hypoxia inducible factor hif :identification of potential driver and passenger mutations. Cancer Res 71(16),5500 (2011). URL http://dx.doi.org/10.1158/0008-5472.CAN-11-0757.
[173] K. J. Turner, J. W. Moore, A. Jones, C. F. Taylor, D. Cuthbert-Heavens, C. Han,R. D. Leek, K. C. Gatter, P. H. Maxwell, P. J. Ratcliffe, D. Cranston, and A. L.Harris. Expression of hypoxia-inducible factors in human renal cancer : relation-ship to angiogenesis and to the von hippel-lindau gene mutation. Cancer Res62(10), 2957 (2002).
[174] T. Yoshikawa, A. Tsuburaya, Y. Miyagi, H. Sekiguchi, M. Kimura, H. Cho, andO. Kobayashi. Up-regulation of hypoxia-inducible factor-1 alpha and vegf mr-nas in peritoneal dissemination of patients with gastric cancer. Anticancer Res26(5B), 3849 (2006).
[175] T. Matsuyama, K. Nakanishi, T. Hayashi, Y. Yoshizumi, S. Aiko, Y. Sugiura,T. Tanimoto, M. Uenoyama, Y. Ozeki, and T. Maehara. Expression of hypoxia-inducible factor-1alpha in esophageal squamous cell carcinoma. Cancer Sci 96(3),176 (2005). URL http://dx.doi.org/10.1111/j.1349-7006.2005.00025.x.
[176] M. Ivan, K. Kondo, H. Yang, W. Kim, J. Valiando, M. Ohh, A. Salic, J. M. Asara,W. S. Lane, and W. G. Kaelin. Hifalpha targeted for vhl-mediated destructionby proline hydroxylation : implications for o2 sensing. Science 292(5516), 464(2001). URL http://dx.doi.org/10.1126/science.1059817.
[177] P. Jaakkola, D. R. Mole, Y. M. Tian, M. I. Wilson, J. Gielbert, S. J. Gaskell,A. von Kriegsheim, H. F. Hebestreit, M. Mukherji, C. J. Schofield, P. H. Maxwell,C. W. Pugh, and P. J. Ratcliffe. Targeting of hif-alpha to the von hippel-lindauubiquitylation complex by o2-regulated prolyl hydroxylation. Science 292(5516),468 (2001). URL http://dx.doi.org/10.1126/science.1059796.
[178] C. J. R. Illingworth, C. Loenarz, C. J. Schofield, and C. Domene. Chemicalbasis for the selectivity of the von hippel lindau tumor suppressor pvhl for prolyl-hydroxylated hif-1alpha. Biochemistry 49(32), 6936 (2010). URL http://dx.
doi.org/10.1021/bi100358t.
[179] W.-C. Hon, M. I. Wilson, K. Harlos, T. D. W. Claridge, C. J. Schofield, C. W.Pugh, P. H. Maxwell, P. J. Ratcliffe, D. I. Stuart, and E. Y. Jones. Structural basisfor the recognition of hydroxyproline in hif-1 alpha by pvhl. Nature 417(6892),975 (2002). URL http://dx.doi.org/10.1038/nature00767.

142 Bibliographie
[180] P. Martinive, F. Defresne, C. Bouzin, J. Saliez, F. Lair, V. Gregoire, C. Michiels,C. Dessy, and O. Feron. Preconditioning of the tumor vasculature and tu-mor cells by intermittent hypoxia : implications for anticancer therapies. Can-cer Res 66(24), 11736 (2006). URL http://dx.doi.org/10.1158/0008-5472.
CAN-06-2056.
[181] T. Jokilehto, K. Rantanen, M. Luukkaa, P. Heikkinen, R. Grenman, H. Minn,P. Kronqvist, and P. M. Jaakkola. Overexpression and nuclear translocation ofhypoxia-inducible factor prolyl hydroxylase phd2 in head and neck squamous cellcarcinoma is associated with tumor aggressiveness. Clin Cancer Res 12(4), 1080(2006). URL http://dx.doi.org/10.1158/1078-0432.CCR-05-2022.
[182] E. Y. Tan, L. Campo, C. Han, H. Turley, F. Pezzella, K. C. Gatter, A. L. Harris,and S. B. Fox. Cytoplasmic location of factor-inhibiting hypoxia-inducible factoris associated with an enhanced hypoxic response and a shorter survival in invasivebreast cancer. Breast Cancer Res 9(6), R89 (2007). URL http://dx.doi.org/
10.1186/bcr1838.
[183] A. Hyseni, P. van der Groep, E. van der Wall, and P. J. van Diest. Subcellularfih-1 expression patterns in invasive breast cancer in relation to hif-1alpha ex-pression. Cell Oncol (Dordr) 34(6), 565 (2011). URL http://dx.doi.org/10.
1007/s13402-011-0053-5.
[184] K. Mekhail, L. Rivero-Lopez, A. Al-Masri, C. Brandon, M. Khacho, and S. Lee.Identification of a common subnuclear localization signal. Mol Biol Cell 18(10),3966 (2007). URL http://dx.doi.org/10.1091/mbc.E07-03-0295.
[185] C. Yang, K. Huntoon, A. Ksendzovsky, Z. Zhuang, and R. R. Lonser. Proteostasismodulators prolong missense vhl protein activity and halt tumor progression. CellRep 3(1), 52 (2013). URL http://dx.doi.org/10.1016/j.celrep.2012.12.
007.
[186] A. Lidgren. Hypoxia-inducible factor-1 mrna and protein levels in renal cell car-cinoma. Journal of Cancer Molecules 4(5), 153 (2008).
[187] S. Fujiwara, K. Nakagawa, H. Harada, S. Nagato, K. Furukawa, M. Teraoka,T. Seno, K. Oka, S. Iwata, and T. Ohnishi. Silencing hypoxia-inducible factor-1alpha inhibits cell migration and invasion under hypoxic environment in malig-nant gliomas. Int J Oncol 30(4), 793 (2007).
[188] P. Gao, H. Zhang, R. Dinavahi, F. Li, Y. Xiang, V. Raman, Z. M. Bhujwalla,D. W. Felsher, L. Cheng, J. Pevsner, L. A. Lee, G. L. Semenza, and C. V. Dang.Hif-dependent antitumorigenic effect of antioxidants in vivo. Cancer Cell 12(3),230 (2007). URL http://dx.doi.org/10.1016/j.ccr.2007.08.004.
[189] N. Geva-Zatorsky, N. Rosenfeld, S. Itzkovitz, R. Milo, A. Sigal, E. Dekel,T. Yarnitzky, Y. Liron, P. Polak, G. Lahav, and U. Alon. Oscillations andvariability in the p53 system. Mol Syst Biol 2, 2006.0033 (2006). URLhttp://dx.doi.org/10.1038/msb4100068.
[190] C. J. Proctor and D. A. Gray. Explaining oscillations and variability in the p53-mdm2 system. BMC Syst Biol 2, 75 (2008). URL http://dx.doi.org/10.1186/
1752-0509-2-75.

Bibliographie 143
[191] E. M. Hammond and A. J. Giaccia. The role of p53 in hypoxia-induced apoptosis.Biochem Biophys Res Commun 331(3), 718 (2005). URL http://dx.doi.org/
10.1016/j.bbrc.2005.03.154.
[192] T. Schmid, J. Zhou, and B. BrA14ne. Hif-1 and p53 : communication of tran-
scription factors under hypoxia. J Cell Mol Med 8(4), 423 (2004).
[193] B. Chen, M. S. Longtine, Y. Sadovsky, and D. M. Nelson. Hypoxia downregulatesp53 but induces apoptosis and enhances expression of bad in cultures of humansyncytiotrophoblasts. Am J Physiol Cell Physiol 299(5), C968 (2010). URLhttp://dx.doi.org/10.1152/ajpcell.00154.2010.
[194] J.-S. Roe and H.-D. Youn. The positive regulation of p53 by the tumor suppressorvhl. Cell Cycle 5(18), 2054 (2006).
[195] R. Ravi, B. Mookerjee, Z. M. Bhujwalla, C. H. Sutter, D. Artemov, Q. Zeng,L. E. Dillehay, A. Madan, G. L. Semenza, and A. Bedi. Regulation of tumor an-giogenesis by p53-induced degradation of hypoxia-inducible factor 1alpha. GenesDev 14(1), 34 (2000).
[196] H. Suzuki, A. Tomida, and T. Tsuruo. Dephosphorylated hypoxia-inducible fac-tor 1alpha as a mediator of p53-dependent apoptosis during hypoxia. Oncogene20(41), 5779 (2001). URL http://dx.doi.org/10.1038/sj.onc.1204742.
[197] A.-L. Nieminen, S. Qanungo, E. A. Schneider, B.-H. Jiang, and F. H. Agani.Mdm2 and hif-1alpha interaction in tumor cells during hypoxia. J Cell Physiol204(2), 364 (2005). URL http://dx.doi.org/10.1002/jcp.20406.
[198] G. A. LaRusch, M. W. Jackson, J. D. Dunbar, R. S. Warren, D. B. Donner,and L. D. Mayo. Nutlin3 blocks vascular endothelial growth factor inductionby preventing the interaction between hypoxia inducible factor 1alpha and hdm2.Cancer Res 67(2), 450 (2007). URL http://dx.doi.org/10.1158/0008-5472.
CAN-06-2710.
[199] H. Longino. Studying Human Behavior. How Scientists Investigate Agression andSexuality, (The Unversity of Chicago Press, 2013).
[200] D. Hanahan and R. A. Weinberg. The hallmarks of cancer. Cell 100(1), 57(2000).
[201] C. Tomasetti and B. Vogelstein. Cancer etiology. variation in cancer risk amongtissues can be explained by the number of stem cell divisions. Science 347(6217),78 (2015). URL http://dx.doi.org/10.1126/science.1260825.
[202] K. Strebhardt and A. Ullrich. Paul ehrlich’s magic bullet concept : 100 years ofprogress. Nat Rev Cancer 8(6), 473 (2008). URL http://dx.doi.org/10.1038/
nrc2394.
[203] B. A. Chabner and T. G. Roberts. Timeline : Chemotherapy and the war oncancer. Nat Rev Cancer 5(1), 65 (2005). URL http://dx.doi.org/10.1038/
nrc1529.
[204] C. Lengauer, K. W. Kinzler, and B. Vogelstein. Genetic instabilities in humancancers. Nature 396(6712), 643 (1998). URL http://dx.doi.org/10.1038/
25292.

144 Bibliographie
[205] H. Rajagopalan, M. A. Nowak, B. Vogelstein, and C. Lengauer. The significanceof unstable chromosomes in colorectal cancer. Nat Rev Cancer 3(9), 695 (2003).URL http://dx.doi.org/10.1038/nrc1165.
[206] J.-P. Capp. Nouveau regard sur le cancer (2012).
[207] C.Sonnenshein and A-M.Soto. The society of cells : cancer and control of cellproliferation. (1999).
[208] A. M. Soto and C. Sonnenschein. Emergentism as a default : cancer as a problemof tissue organization. J Biosci 30(1), 103 (2005).
[209] C. Sonnenschein and A. M. Soto. Somatic mutation theory of carcinogenesis :why it should be dropped and replaced. Mol Carcinog 29(4), 205 (2000).
[210] A. M. Soto and C. Sonnenschein. The somatic mutation theory of cancer : growingproblems with the paradigm ? Bioessays 26(10), 1097 (2004). URL http://dx.
doi.org/10.1002/bies.20087.
[211] A. M. Soto and C. Sonnenschein. Emergentism by default : A view from thebench. Synthese 151, 361 (2006).
[212] C. Sonnenschein and A. M. Soto. Theories of carcinogenesis : an emerging per-spective. Semin Cancer Biol 18(5), 372 (2008). URL http://dx.doi.org/10.
1016/j.semcancer.2008.03.012.
[213] D. L. Vaux. In defense of the somatic mutation theory of cancer. Bioessays 33(5),341 (2011). URL http://dx.doi.org/10.1002/bies.201100022.
[214] A. M. Soto and C. Sonnenschein. The tissue organization field theory of cancer :a testable replacement for the somatic mutation theory. Bioessays 33(5), 332(2011). URL http://dx.doi.org/10.1002/bies.201100025.
[215] C. Sonnenschein and A. M. Soto. Response to ”in defense of the somatic mutationtheory of cancer”. doi : 10.1002/bies.201100022. Bioessays 33(9), 657 (2011).URL http://dx.doi.org/10.1002/bies.201100072.
[216] D. Satge. On somatic mutations and tissue fields in cancer : additional ob-servations challenge the smt. Bioessays 33(12), 922 (2011). URL http:
//dx.doi.org/10.1002/bies.201100117.
[217] S. G. Baker. Toft better explains experimental results in cancer research thansmt (comment on doi 10.1002/bies.201100025 and doi 10.1002/bies.201100022).Bioessays 33(12), 919 (2011). URL http://dx.doi.org/10.1002/bies.
201100124.
[218] S.-G. Baker. Recognizing paradigm instability in theories of carcinogenesis.British Journal of Medicine and Medical Research 4(5), 1149 (2013).
[219] S.-G. Baker. Paradox-driven cancer research. Disruptive Science and Technology1(3), 143 (2012).
[220] A. M. Soto and C. Sonnenschein. Paradoxes in carcinogenesis : There is lightat the end of that tunnel ! Disrupt Sci Technol 1(3), 154 (2013). URL http:
//dx.doi.org/10.1089/dst.2013.0008.

Bibliographie 145
[221] S. Rosenfeld. Are the somatic mutation and tissue organization field theoriesof carcinogenesis incompatible ? Cancer Inform 12, 221 (2013). URL http:
//dx.doi.org/10.4137/CIN.S13013.
[222] C. Sonnenschein, A. M. Soto, A. Rangarajan, and P. Kulkarni. Competing viewson cancer. J Biosci 39(2), 281 (2014).
[223] D. Smithers and M. Cantab. Cancer : an attack on cytologism. The Lancet 279,493 (1962).
[224] J-W.Orr and A-T.Spencer. Transplantation studies of the role of the stromain epidermal carcinogenesis, Tissue Interactions in Carcinogenesis (AcademicPress, 1972).
[225] W. W. Barclay, R. D. Woodruff, M. C. Hall, and S. D. Cramer. A system forstudying epithelial-stromal interactions reveals distinct inductive abilities of stro-mal cells from benign prostatic hyperplasia and prostate cancer. Endocrinology146(1), 13 (2005). URL http://dx.doi.org/10.1210/en.2004-1123.
[226] S. M. McDaniel, K. K. Rumer, S. L. Biroc, R. P. Metz, M. Singh, W. Porter,and P. Schedin. Remodeling of the mammary microenvironment after lactationpromotes breast tumor cell metastasis. Am J Pathol 168(2), 608 (2006). URLhttp://dx.doi.org/10.2353/ajpath.2006.050677.
[227] M. V. Maffini, A. M. Soto, J. M. Calabro, A. A. Ucci, and C. Sonnenschein.The stroma as a crucial target in rat mammary gland carcinogenesis. J Cell Sci117(Pt 8), 1495 (2004). URL http://dx.doi.org/10.1242/jcs.01000.
[228] M. H. Barcellos-Hoff and S. A. Ravani. Irradiated mammary gland stroma pro-motes the expression of tumorigenic potential by unirradiated epithelial cells. Can-cer Res 60(5), 1254 (2000).
[229] P. J. Stephens, C. D. Greenman, B. Fu, F. Yang, G. R. Bignell, L. J. Mudie,E. D. Pleasance, K. W. Lau, D. Beare, L. A. Stebbings, S. McLaren, M.-L. Lin,D. J. McBride, I. Varela, S. Nik-Zainal, C. Leroy, M. Jia, A. Menzies, A. P. But-ler, J. W. Teague, M. A. Quail, J. Burton, H. Swerdlow, N. P. Carter, L. A.Morsberger, C. Iacobuzio-Donahue, G. A. Follows, A. R. Green, A. M. Flanagan,M. R. Stratton, P. A. Futreal, and P. J. Campbell. Massive genomic rearrange-ment acquired in a single catastrophic event during cancer development. Cell144(1), 27 (2011). URL http://dx.doi.org/10.1016/j.cell.2010.11.055.
[230] C. A. Hudis. Trastuzumab–mechanism of action and use in clinical prac-tice. N Engl J Med 357(1), 39 (2007). URL http://dx.doi.org/10.1056/
NEJMra043186.
[231] J-J.Kupiec. Ni Dieu ni genes : pour une autre theorie de l’heredite (2000).
[232] I.Lakatos. Falsification and the methodology of scientific research programmes.(Cambridge University Press., 1970).
[233] T.Kuhn. The Structure of Scientific Revolutions (1962).
[234] J.-A. Marcum. Cancer : complexity, causation, and systems biology. MatierePremiere 1, 171 (2010).

146 Bibliographie
[235] C. M. Nelson and M. J. Bissell. Modeling dynamic reciprocity : engineeringthree-dimensional culture models of breast architecture, function, and neoplastictransformation. Semin Cancer Biol 15(5), 342 (2005). URL http://dx.doi.
org/10.1016/j.semcancer.2005.05.001.
[236] S. D. Mitchell. Integrative pluralism. Biology and Philosophy 17, 55 (2002).
[237] S. D. Mitchell. Why integrative pluralism ? E :CO 6, 81 (2004).
[238] J. A. Coffman. On reductionism, organicism, somatic mutations and cancer.Bioessays 27(4), 459 ; author reply 460 (2005). URL http://dx.doi.org/10.
1002/bies.20216.
AAcquisition des images en microscopie
Materiel
L’acquisition des images s’est faite a l’aide d’un microscope inverse Zeiss Axiovi-sion Z.1, equipe d’une source de lumiere HxP 120. Ce type de lampe, base sur deshalogenures metalliques, permet d’exciter des fluorophores sur une bande assez large(environ 40nM). Pour visualiser la fluorescence verte (Azami Green), nous avons utilisela bande Alexa488, excitee autour de 499nm et emettant autour de 519nm. Pour le Ka-subira Orange, la longueur d’onde d’excitation utilisee est celle du Texas Red (589nm,emission autour de 615nm). Enfin, les images en lumiere blanche sont faites en trans-mission (bright-field). Le microscope est egalement muni d’une enceinte d’incubation,avec regulation de la temperature (37˚) et du CO2 (5%). Le deplacement sur la lamelleest assure par un systeme de platine motorisee, permettant d’enregistrer les positionsou les donnees doivent etre acquises en time-lapse (acquisition de donnees automatiquea des intervals de temps fixes par l’utilisateur). Les images sont captees par une cameraHamamatsu EM-CCD.
Acquisition
Les cellules sont observees directement dans une chambre de culture (Lab-TekChambered 1.0 Borosilicate Coverglass System, 1 chamber). En se deplacant sur lalamelle en lumiere naturelle (transmission), on choisit les positions a imager enechantillonnant de maniere la plus homogene possible dans l’espace de croissance descellules. Chaque champ couvre une surface de 395×395µm. Les donnees sont ensuiteacquises, eventuellement en time-lapse, avec les trois canaux. La figure A.1 donne, enexemple, l’ensemble des donnees enregistrees sur une position, pendant 24h d’acquisi-tion, avec une image toutes les 2h.
147

148 Acquisition des images en microscopie
Figure A.1: Exemple de donnees acquises sur une position, pendant 24h avec une imagetoutes les 2h. Colonne A : fluorescence verte. Colonne B : fluorescence rouge. Colonne C :lumiere blanche. Colonne D : superposition.

149
Les donnees sont ensuite exportees en TIFF pour etre traitees avec Matlab etImageJ, comme decrit dans l’Annexe B.

150 Acquisition des images en microscopie
BTraitement des images
Principe
Comme nous l’avons presente dans l’annexe A, nous obtenons, pour chaque champtraite, trois images, correspondant aux trois canaux utilises (rouge, vert et bright-field).Le but est de calculer, dans chaque champ, la proportion de cellules en phase G0, G1, S,G2 et M. Nous avons developpe une methode semi-automatique, permettant de realisercette operation pour tous les champs consideres sur une lame donnee. Le principe estclassique en traitement d’images : il passe tout d’abord par la creation d’un masque del’image, permettant d’enregistrer les positions des cellules. Puis ce masque est projetesur les donnees de fluorescence, et un seuillage de l’intensite de fluorescence permet detrancher quant a la phase du cycle a laquelle elles appartiennent. Ce travail est realisesous Matlab (R2012A) et ImageJ (1.46a). Nous detaillons ci-dessous un exemple de lademarche mise au point.
Methode
Soit le champ presente sur la figure B.1. La superposition des trois canaux permet,a l’œil, de reperer certaines phases du cycle. Les trois canaux constituant cette imagesont presentes sur la figure B.2.
Ces donnees sont donc acquises pour une quarantaine de champs a chaque experience.Il s’agit de les traiter de maniere a en extraire les donnees recherchees sur la dynamiquedu cycle. La premiere etape du traitement est la superposition des canaux de fluores-cence et la binarisation (seuillage des niveaux de gris) de l’image. La figure B.3 illustreces etapes. Une fois l’image vert+rouge creee via Matlab, on utilise ImageJ pour ap-pliquer un filtre passe-bande permettant d’eliminer le bruit. Puis, cette nouvelle imageest binarisee, en seuillant les valeurs en niveau de gris. Cette etape permet de reperer
151

152 Traitement des images
Figure B.1: Imagerie de cellules HeLa-FUCCI en microscopie de fluorescence. La su-perposition des trois canaux (rouge, vert, etbright-field) permet de reperer les phases ducycle.
Figure B.2: Canaux constitutifs de l’image presentee sur la figure B.1. A=bright-field,B=vert (GFP), C=rouge (Texas-Red)
toutes les cellules fluorescentes.Il s’agit ensuite de realiser, en utilisant Matlab, un masque de l’image binarisee. La
figure B.4 presente le masque finalement obtenu a partir des images initiales. Chaquecellule est reperee par un numero ; sur la figure, ceux-ci sont codes par des couleurs.
Ce masque permet ensuite, par projection sur les images de microscopie, d’acquerirles valeurs de fluorescence (rouge et verte) pour chaque cellule. Un seuil est fixe auprealable pour chaque canal, sur la base de la presence ou non de fluorescence visible enrouge et en vert. La donnee de fluorescence recueillie ainsi pour chaque cellule permetalors de les classer en S (rouge et vert), G1 (rouge) et G2 (vert). Pour les cellulesnon-fluorescentes (M et G0), le comptage est fait manuellement. La morphologie descellules en mitose permet de les reperer facilement. Toutes ces donnees permettent alorsde calculer, sur un ensemble de champs, la proportion de cellules dans chaque phasedu cycle.

153
Figure B.3: Binarisaton de l’image. A : les canaux de fluorescence sont superposes. B :on applique un filtre passe-bande, et C : on seuille l’image
Figure B.4: Masque de l’image initiale,realise avec Matlab a partir de l’image bina-risee. A chaque cellule est attribue un numero.

154 Traitement des images

CProtocole d’immunomarquage de HiF-1α
Principe
Il s’agit d’un immunomarquage indirect, utilisant un anticorps (Ac) primaire anti-HiF-1α (Abcam, Ref : ab16066), et un anti-corps secondaire couple a la peroxydase(GAM-PO, Jackson, Ref : 115-036-062/0817). Ce dernier est revele par reaction surun kit de revelation (Sigma-Aldrich) contenant du DAB et du H2O2. Le produit de lareaction colore la preparation en brun aux endroits contenant du HiF-1α.
Protocole
1)Fixation : La fixation est faite dans le paraformaldehyde pendant 10 min a temperatureambiante (room temperature, RT). Les lames sont ensuite rincees au PBS 3×5 min.
2)Pretraitements : Les cellules sont mises au contact d’une solution de Triton a0.3% dans du PBS pendant 30min RT, puis 60min RT dans du serum de chevre a 1%.
3)Incubation premier Ac : Le premier anti-corps (anti-HiF-1α) est dilue au vingtiemedans du PBS (0.3% Triton, 1% BSA), et laisse une nuit sur la lame, a 4˚C. Celle-ciest ensuite rincee 5×5 min au PBS.
4)Blocage de la peroxydase endogene : Une solution de MeOH/H2O2 a 0.3%dans du PBS (30min RT) permet de neutraliser la peroxydase endogene. La lame estensuite rincee 2×5 min RT dans du PBS, et 3× 5min dans du PBS + 0.1% T20.
155

156 Protocole d’immunomarquage de HiF-1α
5)Incubation deuxieme Ac : Le deuxieme Ac (GAM-PO) est dilue au trentiemedans de l’eau physiologique (+0.1% T20), et laisse 30min RT en chambre humide aucontact des cellules. Les cellules sont ensuite rincees au PBS (+0.1% T20) pendant3×5min, et au PBS pendant 2×5min.
6)Revelation peroxydase : Elle est realisee en utilisant le kit de revelation Sigma-Aldrich, 10min a l’obscurite. La lame est rincee a l’eau distille 5×5min, avant d’etremontee dans du XAM mounting medium.

DArticle scientifique : Bedessem B. and
Ruphy S., SMT or TOFT? How the twomain theories of carcinogenesis weremade (artificially) incompatible, Acta
Biotheoretica, 2015
Cet article s’inscrit dans le cadre d’un master 2 de philosophie realise a l’UPMFen parallele de cette these. Ce master 2 a donne lieu a un travail de recherche meneen collaboration avec le laboratoire Philosophie, Pratiques et Langages de l’UPMF(Grenoble). L’article qui suit a ete publie suite a ce travail de recherche.
Abstract
The building of a global model of carcinogenesis is one of modern biology’s greatestchallenges. The traditional Somatic Mutation Theory (SMT) is now supplemented bya new approach, called the Tissue Organization Field Theory (TOFT). According toTOFT, the original source of cancer is loss of tissue organization rather than geneticmutations. In this paper, we study the argumentative strategy used by the advocatesof TOFT to impose their view. In particular, we criticize their claim of incompatibilityused to justify the necessity to definitively reject SMT. First, we note that since itis difficult to build a non-ambiguous experimental demonstration of the superiority ofTOFT, its partisans add epistemological and metaphysical arguments to the debate.This argumentative strategy allows them to defend the necessity of a paradigm shift,with TOFT superseding SMT. To do so, they introduce a notion of incompatibility,
157

158
Article scientifique : Bedessem B. and Ruphy S., SMT or TOFT? How thetwo main theories of carcinogenesis were made (artificially) incompatible, Acta
Biotheoretica, 2015
which they actually use as the Kuhnian notion of incommensurability. To justify thisso-called incompatibility between the two theories of cancer, they move the debate toa metaphysical ground by assimilating the controversy to a fundamental oppositionbetween reductionism and organicism. We show here that this argumentative strategyis specious, because it does not demonstrate clearly that TOFT is an organicist theory.Since it shares with SMT its vocabulary, its ontology and its methodology, it appearsthat a claim of incompatibility based on this metaphysical plan is not fully justifiedin the present state of the debate. We conclude that it is more cogent to argue thatthe two theories are compatible, both biologically and metaphysically. We propose toconsider that TOFT and SMT describe two distinct and compatible causal pathways tocarcinogenesis. This view is coherent with the existence of integrative approaches, andsuggests that they have a higher epistemic value than the two theories taken separately.
Introduction
The basis of the Somatic Mutation Theory (SMT) is well known, and summarized inHanahan and Weinberg’s famous review [200]. Cancer is described as a disease causedby genetic mutations, which can be due to inherited predisposition, or to the geno-toxic action of carcinogens. Recently, it was also shown that spontaneous mutationsoccurring during stem cells division can cause carcinogenesis, at least in some tissues[201]. This approach is based on various empirical evidence, and led to therapeuticsuccess [202, 203]. However, voices are rising to point out that SMT does not accu-rately describe the complex phenomenon of carcinogenesis. First, cancer cells oftenexhibit large scale genetic perturbations, with a hight number of local mutations andchromosomal anomalies [204, 205]. This is contradictory with the classical version ofSMT, which considers that tumorigenesis is due to punctual genetic mutations. Theseobservations have led some authors to develop an alternative view of cancer, whichhave become quite influential in the last ten years [206]. The Tissue Organization FieldTheory (TOFT) was popularized by Soto and Sonnenschein in 1999 in their book Thesociety of cells [207]. During a first phase, from 2000 to 2010, the advocates of TOFTpublished a series of articles to present and defend their description of cancer [208–212]. During this period, TOFT was defended mainly by Soto and Sonnenschein. Theircentral idea is that the original cause of cancer is not genetic mutations, but disruptionof tissue cohesion. This disorganization can be due to the chemical alteration of theextra-cellular matrix by carcinogens. In this perspective, the default state of the cell isnot quiescence, but proliferation. As a consequence, the control of cell division vanisheswhen the surrounded tissues loose their structure. Soto and Sonnenschein describe thedifferences between the two theories as follows : for SMT, cancer comes from a uniquesomatic cell which accumulated mutations of genes controlling cell cycle, and quies-cence is the default state of the cell ; for TOFT, the first event of carcinogenesis is aloss of tissue organization, and not mutations in a single cell. Through this scientificdescription, the authors build a first biological opposition between the two approaches :tissue is opposed to genes and proliferation to quiescence.

159
This theory remained relatively marginal during its first ten years. However, ithas generated a more intense debate over the past few years, as shown by the recentwork of J-P.Capp [206]. This author studies the history of the developments of SMTand TOFT, and proposes an ontophylogenetic theory which establishes links betweenTOFT and the random expression of the genes in a context of tissue disruption. No-tably, the year 2011 was marked by an interesting exchange of ideas in the reviewBioessays [213–217]. From 2011 up to now, the actors of the controversy have beentrying to find a way out of the conflict [218–222]. Two radically different orientationshave been chosen. A first option favors an integrative approach, which aims at buildinga comprehensive model of carcinogenesis taking into account all the scales involved inthe process of carcinogenesis, from the gene to the tissue [221]. The second option,strongly defended by the advocates of TOFT, postulates that the two theories areincompatible, and that all attempts at conciliation would be an obstacle to scientificprogress [219]. To defend this view, they use three levels of argumentation : empiri-cal, epistemological, and metaphysical. In this article, we first analyze how these threelevels are articulated. The lack of non ambiguous experimental proofs makes the firstlevel of argumentation insufficient to irrevocably choose one of the two theories. As aconsequence, we interpret the use of epistemological and metaphysical arguments asan argumentative strategy of the partisans of TOFT to be heard. More precisely, weshow how they build an irreconcilable opposition between the two theories of cancer,leading to the necessity of an exclusive choice of one of them. First, they present SMTas a regressive program of research, to defend the need for a paradigm shift. We showthat this view is based on an ambiguous use of the term paradigm, and is justified bymetaphysical considerations defending a fundamental incompatibility between the twotheories. Indeed, the partisans of TOFT assimilate the conflict between the two cancertheories to a fundamental debate between reductionism and holism. This move allowsSoto and Sonnenschein to claim that explanations of the process of carcinogenesis bythese two theories belong to distinct levels of biological complexity and, therefore, areincompatible, as are their philosophical stances (reductionism versus organicism) [212].By linking this idea of incompatibility with the need for a paradigm shift, they purportto establish the necessity of definitively giving up SMT and adopting TOFT. Sincesuch a claim of incompatibility has important consequences on our understanding ofcarcinogenesis, it is crucial to investigate whether it is justified. We show in this paperthat the argumentative strategy based on the projection of the controversy on a meta-physical ground is specious and incoherent. It eliminates useful attempts at conciliationwith no valid reason. By contrast, the concrete approach aiming at integrating all thescales involved in carcinogenesis seems to be more epistemologically accurate.
SMT or TOFT? The role of empirical evidence
The articles published by the advocates of TOFT report various experimental evi-dence. Some of it shows, including through recombination experiments, that a stromacoming from a cancerous tissue is able to generate tumors on a healthy one, or to in-crease the metastatic potential of tumors cells [223–226]. Other studies investigate the

160
Article scientifique : Bedessem B. and Ruphy S., SMT or TOFT? How thetwo main theories of carcinogenesis were made (artificially) incompatible, Acta
Biotheoretica, 2015
influence of known carcinogens on stroma organization [227, 228]. They show that thestructure of the whole tissue is sensitive to chemical molecules known for producingcancers. For the partisans of TOFT, this series of evidence is sufficient to irrevocablydemonstrate the superiority of their approach. However, the adverse faction has also itssay. In 2011, Vaux published an article entitled In Defense of The Somatic MutationTheory [213]. In this work, he gives three lines of evidence to support SMT. First,he raises cases of tumors which are clearly known for being due to genetic mutations,such some leukemia and lymphoma. Second, he notices that modifications of SMT weremade to include new observations, notably the massive chromosomal rearrangementsobserved in many tumors [229]. These massive rearrangements are not well describedby the classical version of SMT, which mainly considers the role of punctual mutations.Finally, the success of targeted therapies in some types of cancers is used as an argu-ment to defend the validity of SMT. Based on the central assumption of SMT (canceris due to genetic mutations), this therapeutic strategy tries to modify the activity ofthe proteins suspected to cause tumorigenesis. Consequently, the success of targetedtherapy in some cancers can be considered as a relevant element to prove the valid-ity of the genetic approach of cancer. Besides, as noticed by Soto and Sonnenscheinthemselves[214], objections were made to conclusions drawn from experiments aimingat confirming TOFT. Notably, the experiments of stroma modifications of Maffini et al.[227] and Barcellos-Hoff/Ravani [228] suggest the possibility of mutations affecting thecells during the protocol. Therefore, a non ambiguous demonstration of the superiorityof TOFT is not easy to deliver with the current experimental methods. More impor-tantly, it appears that both theories are supported by strong experimental arguments.For instance, the clear success of some targeted therapies is a important argumentto defend SMT : the use of Trastuzumab against breast cancer presenting an overex-pression of HER2 receptor is a good example [230]. Reciprocally, the experiments ofBarcellos-Hoff and Ravani [228] bring strong arguments in favor of the TOFT approach.By modifying the molecular composition of the mammary gland stroma of mice, theyshow that it gained a tumorigenic potential : when recombined with non-tumorigenicepithelial cells, it induces carcinogenesis. Inversely, many observations cannot be ac-counted for by SMT or TOFT, taken separately.
S.Rosenfeld clearly summarizes this situation in a recent paper [221] : Argumentsin favor of both TOFT and SMT are numerous and strong (...). At the same time, alarge grey zone of empirical facts and clinical cases exists which poses questions thatare difficult to resolve from either of these viewpoints. As a consequence, it is difficult tofind a set of empirical evidence allowing to choose one of the two theories. It is thereforeproblematic for the advocates of TOFT to impose their new view on empirical grounds.We suggest that this is the reason why the articles defending TOFT often mix threelevels of arguments [211, 214, 218] : empirical, epistemological, metaphysical, the twolast levels being used to compensate the deficiency of the empirical demonstration. Letus see now how this is done.
161
Do we need a paradigm shift ?
As in other instances in science, the zeitgeist has played a significant role in accept-ing untested claims of the SMT without major objections [214]. Soto and Sonnenscheinexplain the domination of SMT by the popularity of the genetic approaches for de-scribing biological phenomena. That is why the lack of evidence in favor of SMT wasnot an obstacle to its adoption of the Somatic Mutation Theory. The criticism of thedomination of the genetic dogma has been widespread since J-J. Kupiec’s work [231].It is used by Soto and Sonnenschein to describe SMT as a regressive program of re-search [214]. The idea is that to survive, SMT has to add ad hoc hypotheses to explaincarcinogenesis. Indeed, the existence of facts that the classical versions of SMT cannotdescribe, such as the massive chromosomal rearrangements observed in tumors, led thedefenders of SMT to make new hypothesis. The idea of early genetic instabilities is oneof these attempts [204, 205]. Soto and Sonnenschein describe these modifications ofSMT as a proof of its epistemic inferiority. But this argument is specious since TOFTitself had to evolve to take into account some empirical observations. As noted by Capp(2012) [206], the original version of TOFT gives a negligible role to genetic mutationsduring cancer progression. Its ontophylogenetic theory, which can be seen as a modifiedTOFT approach, considers that punctual mutations or chromosomal translocations areimportant to describe carcinogenesis. However, Soto and Sonnenschein argue that SMTis a regressive program of research [214], in Lakatos ? sense of the notion [232] : a re-gressive program of research is characterized by a continual need for locally adjustingthe theory to experimental evidence. The advocates of TOFT add to this idea thenotion of paradigm shift [214, 218], which allows them to affirm the need to abandonSMT in favor of TOFT. The structure of this argument is interesting. To define theword paradigm, Soto and Sonnenschein use an expression taken from the famous bookby the historian and philosopher Thomas Kuhn, The Structure of Scientific Revolution(SSR) [233] : a paradigm is a universally recognized scientific achievement(s) that for atime provide model problems and solutions to a community of practitioners [214]. How-ever, the concept of paradigm is multiform. Different meanings can be found in Kuhn’swork (in the SRS and in his subsequent articles), and the definition given by Soto andSonnenschein can be considered as rather moderate. By using this concept, Soto andSonnenschein can then introduce the more radical notion of paradigm shift [214, 218].According to Kuhn, scientific revolutions which occurred during the history of sciencecan be described as paradigm shifts. With this notion of paradigm, the advocates ofTOFT present their theory as a new approach which has to eliminate SMT. SMT isthus considered as an old paradigm we have to give up in order to promote scientificprogress [218]. But this use of the notion does not fit with the explicit definition theygive. On a moderate reading of the notion of paradigm, the necessity of giving up SMTdoes not follow. The argument developed by the partisans of TOFT seems in fact toappeal implicitly to the Kuhnian notion of incommensurability. When two paradigmsare incommensurable, it is necessary to adhere to one of them, and to definitively aban-don the other. The word paradigm then refers to a global representation of the world.In that case, indeed, when adopting a paradigm, one has to reject the others. In spiteof the fact that the authors do not use explicitly the notion of incommensurability, the
162
Article scientifique : Bedessem B. and Ruphy S., SMT or TOFT? How thetwo main theories of carcinogenesis were made (artificially) incompatible, Acta
Biotheoretica, 2015
necessity of an exclusive choice is clearly expressed in Soto and Sonnenschein’s articles :it is left to the reader to decide whether one approach to understanding cancer appearsmore promising than the other [222]. Even if Soto and Sonnenschein do not speak hereof a quasi religious conversion that characterizes the shift to a new paradigm in theradical sense of the notion, but only of rational decision, they nevertheless appeal tothis radical meaning when defending the necessity to supersede SMT by TOFT. In-deed, they promote the adhesion to a general system of explanation, which is explicitlyassimilated to a metaphysical position : the reader has to choose between reductionismand holism [212, 222]. By using this metaphysical opposition, they can build the ideaof a fundamental incompatibility between TOFT and SMT [212]. It is now crucial toanalyze the arguments raised to defend this incompatibility.
Are the TOFT and SMT incompatible ?
In one of their recent papers, Soto and Sonnenschein contend that : according to thephilosopher D. C. Dennett, there is no such thing as philosophy-free science ; there isonly science whose philosophical baggage is taken on board without examination. There-fore, ignoring the philosophical underpinnings of the postulates adopted by researcherswhen designing experiments is bound to hinder the interpretation of the data collected.For this reason we address the difference between the cell-based and the tissue-basedstances [214]. Soto and Sonnenschein aim at exhibiting the philosophical, more pre-cisely the metaphysical, choices influencing scientific theorizing. What are, then, themetaphysical basis of TOFT and SMT? The partisans of TOFT claim that SMT isreductionist [211]. More generally, they consider molecular biology as the typical reduc-tionist approach [206]. The concept of reductionism is traditionally opposed to holismor organicism [234]. A reductionist approach aims at analyzing the complex systemsby looking at their fundamental components. On the opposite, an holistic approachconsiders that the natural phenomena can be explained only by studying them as awhole. As a consequence, it is epistemologically useless to consider the smallest scalesto study a given object. In biology, holism translates into organicism, defined as followsby the philosopher J-A.Marcum : Organicism (...) is an idea utilizing organic unity or awhole to explain biological processes at the level of higher-order entities and their prop-erties rather than simply invoking their elemental composition [234]. This definition isinteresting since Marcum presents TOFT as an organicist theory. As a consequence,it is a way to investigate the coherence of this claim. Why do the advocates of TOFTuse these concepts ? For Soto and Sonnenschein, reductionism, applied to biology, sup-poses that the cell is the unit of the organism, and that all the observations madeat the tissue level should find an explanation at the cell level. As anti-reductionists,the partisans of TOFT consider themselves as organicist [211]. When combining thedefinition of organicism given previously and the argument of Soto and Sonnenschein,it follows that the biological process to explain is cancer, the high-order entities are thetissues, and the elemental composition are the cells. Is this assimilation of TOFT to aform of organicism cogent ? In order to answer this question, it is necessary to carefully

163
characterize the concept of reductionism. J-A. Marcum defines three types of reduction-ism [234]. Theoretical reductionism aims at reducing the terms of a high-level theoryto terms belonging to low-level theories. For instance, the biological processes can bedescribed by using concepts borrowed from physics and chemistry. Ontological reduc-tionism deals with the description of the elementary components of natural objects orphenomena. Complex phenomena are analyzed by assuming that they are composed ofsimple elements whose properties explain the general behavior of the system. Appliedto biology, ontological reductionism would mean that the observed properties at theorganism scale can be explained by the molecular composition of the cells. Finally,methodological reductionism is related to the scientific techniques used to decomposethe hight-order entities into their low-order elements. In light of these definitions, letus see if TOFT can be considered as an anti-reductionist approach. One can first no-tice that Soto and Sonnenschein’s works rigorously use the same vocabulary as theone used in classical molecular biology. TOFT talks about cells, stroma, genes. It doesnot consider new terms that we could not be reduced to words referring to elemen-tary components. In other words, the semantic organization of the biological world isexactly the same. Various examples can be found in the articles published by the advo-cates of TOFT to illustrate this point. The response to the article of Vaux (2011) [213]published by Baker (2011) [217] explicitly uses a typical reductionist vocabulary, suchas intercellular signals or oncogenes. Thus, as regards theoretical reductionism, TOFTcannot be said to be anti-reductionnist. Second, the ontology of TOFT is not distinctfrom the ontology of SMT. The components of the considered biological objects arethe same. TOFT gives more importance to tissues, but the tissues are considered as anensemble of cells, and the cancer remains a cellular disease. An anti-reductionist viewwould consider the tissue as a whole, without taking into account its cellular/molecularcomposition. Thus, it does not make sense to argue that TOFT is opposed to reduc-tionism in an ontological reading of the notion. Finally, methodological reductionismis also adopted by the partisans of TOFT. Indeed, they consider the modificationsof the molecular composition of the stroma when it is exposed to carcinogens. Moreprecisely, the identification of the types of molecules affected is taken into account bySoto and Sonnenschein to build their theory. For instance, they notice in their 2011article of [214] : Barcellos-Hoff and Ravani irradiated the mammary gland stroma ofmice to affect their extracellular matrix composition, cytokine production and receptorsinvolved in cell-to-cell interactions [228]. The experimental protocols developed by thepartisans of TOFT do consider cells and molecules, hence their methodologically reduc-tionist stance. This rapid analysis shows that if we consider the classical conception ofreductionism given by Marcum (2010) [234], assimilating TOFT to an anti-reductionistapproach is not legitimate. If we now follow the definition of reductionism given by thepartisans of TOFT, we can also conclude that their argumentation is contradictory.As we already said, they judge as reductionist all approaches using the cell as the fun-damental unit of the organism [214]. But according to TOFT, cancer is still locatedin individual cells. In particular, one of the theoretical basis of TOFT deals with thedefault state of the cell (proliferative or quiescent). This means that the advocates ofTOFT need to consider that the cell is the fundamental unit of the organism. The rea-son for this is simple : in TOFT as in SMT, cancer is a cellular disease. More generally,

164
Article scientifique : Bedessem B. and Ruphy S., SMT or TOFT? How thetwo main theories of carcinogenesis were made (artificially) incompatible, Acta
Biotheoretica, 2015
according to TOFT, modifications of the molecular composition of the stroma causecancer. If we return to a more classical meaning of the concept, this is clearly a reduc-tionist stance. SMT looks into the cell, by considering the structure of the DNA, andTOFT looks outside the cell, by considering the molecular relationships between eachcells and the stroma. We also have to notice that the partisans of TOFT often acceptthat genetic mutations have a role in carcinogenesis ; they just refuse to consider thatmutations are the initiators of the disease [206]. Thus, it is not obvious that TOFT isan organicist theory. By considering current conceptions of this notion, it appears thatthe assimilation of TOFT to organicism is not sufficiently justified. It is not relevantin the present state of the debate, and therefore it cannot be used to demonstrate theincompatibility between the two theories.
If SMT and TOFT are metaphysically similar, how can we characterize the differentrepresentations of cancer they propose ? In particular, if they are metaphysically com-patible, are TOFT and SMT biologically incompatible ? Our suggestion is that, from abiological perspective, the two theories have to be thought as proposing two distinct,and compatible, causal pathways which can initiate and promote carcinogenesis. Bothmechanisms are experimentally and clinically relevant [221]. When reasoning in termof causal pathways, it is possible to make a case for the compatibility of the two theo-ries, by arguing that both the genes and the stroma can influence carcinogenesis. Theactual existence of approaches which conciliate TOFT and SMT is a strong biologicalargument in support of this view. Indeed, J-A. Marcum notes that the two theoriescan converge in the frame of system biology : system biology avoids locating causationwithin a single, hierarchical level, so that the flow of causation is in one direction only-whether bottom-up or top-down. Rather, that approach advocates a flow of causationthat is bidirectionally or reciprocal in nature [234]. The notion of hierarchical levelsis not easy to use in our case. Considering TOFT as a theory belonging to a higherorganizational level than SMT poses the same types of problems we already discussedabout the supposed organicism of TOFT. As a consequence, it is not so obvious thatTOFT and SMT belongs to distinct organizational levels. Thus, rather than consider-ing a cellular and a tissular scale, we prefer to use the notions of interior and exteriorof the cell. The notion of bidirectional causation is then still interesting, since it con-siders that carcinogenesis can be influenced by molecular events taking place in thecell, or outside the cell. In the frame of system biology, TOFT and SMT are thus notconsidered as two irreconcilable approaches. The dynamic reciprocity theory (DRT) ofMina Bisell and coworkers explains how the organization of the stroma has an influenceon gene expression and control cell proliferation [235]. The existence of adhesion pro-teins joining the intracellular environment to the stroma makes possible the buildingof a bridge between the genetic and tissular approaches. It is then possible to considercausal relationships between the interior and the exterior of the cell. Insofar as TOFTand SMT describe two compatible causal pathways, they can be integrated in a singleapproach to explain carcinogenesis. And this integration is of a higher epistemologicalvalue than SMT or TOFT taken separately.

165
Discussion
The controversy between the two main theories of carcinogenesis (SMT and TOFT)is interesting because it uses three levels of argumentation : experimental, epistemolog-ical and metaphysical. We have seen that the experimental data are not sufficient toclearly favor one of the two theories. Each approach can explain some biological facts ;but numerous observations are difficult to resolve from either of these viewpoints. Tobe competitive, the partisans of TOFT build an argumentative strategy based on apurported incompatibility of their theory with SMT. They appeal to this purportedincompatibility to justify the need to reject one of the two theories altogether, in thesame way than in Kuhn’s scheme, the incommensurability of two theories justifiesabandonning one in favor of the other. Naturally, the reader is strongly invited to keepTOFT and abandon SMT.
To justify this key incompatibility-argument, the partisans of TOFT assimilatethe conflict between the two theories to a metaphysical opposition between holism andreductionism. We showed that this argument is specious, since, it is not clear that TOFTis an organicist theory. It shares its semantics, its ontology and its methodology withSMT. This remark does not mean that TOFT is strictly reductionist, in all the possiblemeanings of this concept. It just shows that the assertion that TOFT is an organicisttheory is not coherent with the conception of reductionism and organicism it is basedon. This idea is not only applicable to Soto and Sonnenschein’s work, since otherauthors, as Marcum [234], consider TOFT as an organicist theory without coherentand strong arguments. Yet, as we shown, the assimilation of TOFT to a strict anti-reductionist approach can lead to a non-justified claim that the two theories are notcompatible. Thus, if the defenders of TOFT cannot justify more precisely why TOFTcan be considered as an organicist theory, it seems more judicious to fully abandon theframe of the reductionism/organicism opposition.
We also claimed that from a biological point of view, the best refutation of Soto andSonnenschein’s view is the actual existence of approaches which conciliate both theo-ries. We finally proposed that SMT and TOFT should be considered as two distinct,and compatible, causal pathways. We insist on the idea of distinct causal pathwaysthat have to be integrated in order to build a more accurate and satisfying descriptionof carcinogenesis. This view is closed to the ideas exposed by Sandra D. Mitchell aboutbiological complexity [236, 237]. The author defends the idea of an integration of thedifferent causal pathways describing complex biological objects into a unified explana-tion. According to Mitchell, the idealized character of biological models make necessarythe emergence of partial theories, considering only one causal pathway. Often, the com-patibility of these theories stems from the possibility of a theoretical integration. Wehave seen that this integration can be achieved in the frame of system biology, whichconsiders the multiple causal relationships linking the cell, the stroma, and the devel-opment of cancers. We can notice that such causal relationships make carcinogenesisa strongly non-linear phenomenon. As a consequence, the development of integrativeapproaches can depend on the ability to build global models of carcinogenesis. Progressin computational modeling in biology favors the development of these approaches. Theexistence of these new tools for investigating carcinogenesis is a strong argument against

166
Article scientifique : Bedessem B. and Ruphy S., SMT or TOFT? How thetwo main theories of carcinogenesis were made (artificially) incompatible, Acta
Biotheoretica, 2015
the sterile postulate of incompatibility.Finally, let us recall that this claim for an integration of TOFT and SMT is not
new [221, 234, 238]. However, our original contribution is the theoretical justificationshowing the lack of relevance of the idea of a fundamental incompatibility between thetwo theories. Whereas the previous discussions about the possibility of an integrationof TOFT and SMT do not question the relevance of the reductionism/organicism oppo-sition in the field of carcinogenesis, we suggest that in the present state of the debate,this frame should be abandoned.
Copyright © 2022 FDOKUMEN