Application du radar Doppler (VOLDORAD) à l'étude de la ...
277
HAL Id: tel-00731252 https://tel.archives-ouvertes.fr/tel-00731252 Submitted on 12 Sep 2012 HAL is a multi-disciplinary open access archive for the deposit and dissemination of sci- entific research documents, whether they are pub- lished or not. The documents may come from teaching and research institutions in France or abroad, or from public or private research centers. L’archive ouverte pluridisciplinaire HAL, est destinée au dépôt et à la diffusion de documents scientifiques de niveau recherche, publiés ou non, émanant des établissements d’enseignement et de recherche français ou étrangers, des laboratoires publics ou privés. Application du radar Doppler (VOLDORAD) à l’étude de la dynamique des éruptions Stromboliennes de l’Etna Mathieu Gouhier To cite this version: Mathieu Gouhier. Application du radar Doppler (VOLDORAD) à l’étude de la dynamique des érup- tions Stromboliennes de l’Etna. Volcanologie. Université Blaise Pascal - Clermont-Ferrand II, 2008. Français. NNT : 2008CLF21888. tel-00731252
-
Upload
khangminh22 -
Category
Documents
-
view
1 -
download
0
Transcript of Application du radar Doppler (VOLDORAD) à l'étude de la ...

HAL Id: tel-00731252https://tel.archives-ouvertes.fr/tel-00731252
Submitted on 12 Sep 2012
HAL is a multi-disciplinary open accessarchive for the deposit and dissemination of sci-entific research documents, whether they are pub-lished or not. The documents may come fromteaching and research institutions in France orabroad, or from public or private research centers.
L’archive ouverte pluridisciplinaire HAL, estdestinée au dépôt et à la diffusion de documentsscientifiques de niveau recherche, publiés ou non,émanant des établissements d’enseignement et derecherche français ou étrangers, des laboratoirespublics ou privés.
Application du radar Doppler (VOLDORAD) à l’étudede la dynamique des éruptions Stromboliennes de l’Etna
Mathieu Gouhier
To cite this version:Mathieu Gouhier. Application du radar Doppler (VOLDORAD) à l’étude de la dynamique des érup-tions Stromboliennes de l’Etna. Volcanologie. Université Blaise Pascal - Clermont-Ferrand II, 2008.Français. NNT : 2008CLF21888. tel-00731252

Université Blaise Pascal – Clermont-Ferrand II (U.F.R. de Recherche Scientifique et Technique)
ÉCOLE DOCTORALE DES SCIENCES FONDAMENTALES
THÈSE
Présentée pour obtenir le grade de
DOCTEUR D’UNIVERSITÉ
Spécialité : Volcanologie
par
Mathieu GOUHIER Diplômé de Master Recherche
Application du radar Doppler (VOLDORAD) à l’étude de la dynamique des éruptions Stromboliennes de l’Etna
Soutenue publiquement le 28 Novembre 2008 devant la commission d’examen composée de : Patrick ALLARD Laboratoire Pierre Süe, CE – Saclay Rapporteur Mauro COLTELLI INGV – Sezione di Catania (Italia) Rapporteur Sylvie VERGNIOLLE Institut de Physique du Globe de Paris Examinatrice Jean-François LÉNAT Université Blaise Pascal, Clermont-Ferrand II Président Franck DONNADIEU Université Blaise Pascal, Clermont-Ferrand II Directeur de thèse Timothy DRUITT Université Blaise Pascal, Clermont-Ferrand II Directeur de thèse


Université Blaise Pascal – Clermont-Ferrand II (U.F.R. de Recherche Scientifique et Technique)
ÉCOLE DOCTORALE DES SCIENCES FONDAMENTALES
THÈSE
Présentée pour obtenir le grade de
DOCTEUR D’UNIVERSITÉ
Spécialité : Volcanologie
par
Mathieu GOUHIER Diplômé de Master Recherche
Application of Doppler radar (VOLDORAD) to the study of Strombolian eruptions dynamics at Etna
Soutenue publiquement le 28 Novembre 2008 devant la commission d’examen composée de : Patrick ALLARD Laboratoire Pierre Süe, CE – Saclay Rapporteur Mauro COLTELLI INGV – Sezione di Catania (Italia) Rapporteur Sylvie VERGNIOLLE Institut de Physique du Globe de Paris Examinatrice Jean-François LÉNAT Université Blaise Pascal, Clermont-Ferrand II Président Franck DONNADIEU Université Blaise Pascal, Clermont-Ferrand II Directeur de thèse Timothy DRUITT Université Blaise Pascal, Clermont-Ferrand II Directeur de thèse


F. Liszt (Mazeppa)


REMERCIEMENTS


Tout d’abord, je tiens à remercier aussi sincèrement que chaleureusement Franck Donnadieu pour son encadrement sur ce sujet technique et tout à fait nouveau. Merci de m’avoir fait confiance en me laissant notamment beaucoup d’autonomie et d’indépendance dans la réalisation de mon travail de thèse. Tu as été encadrant et collaborateur à mon sens, ce qui m’a permis, je crois, une vraie émancipation dans ma démarche de recherche, grâce notamment, aux nombreux conseils et discussions que nous avons pu avoir. J’ai beaucoup apprécié nos relations de travail, avec simplicité et bonne humeur, ce qui est à mon avis, indispensable au bon déroulement d’un travail en collaboration. Dès le DEA, où nous avons fait du terrain ensemble au Costa Rica, mais aussi par la suite, j’ai pu apprécier tes qualités humaines qui m’ont rendu ces quatre années fort agréables. J’espère ainsi que nous aurons à nouveau l’occasion de travailler ensemble. Merci à mon deuxième directeur de thèse: Tim Druitt, notamment pour son aide quant à la rédaction des articles de ma thèse, mais aussi pour ses précieux conseils et son expérience. Merci au Laboratoire Magmas et Volcans et les deux directeurs que j’ai connu pendant ces quatre années, Olivier Merle et Pierre Schiano, pour m’avoir permis la réalisation de ce travail de thèse. Mes remerciement se tournent maintenant vers les personnes sans qui ce travail sur VOLDORAD n’aurait pas pu être réalisé, je veux parler de tous ceux qui ont contribué de près ou de loin à la réalisation de ce projet à Clermont-Ferrand, depuis sa germination jusqu'à la fabrication du radar et à l'acquisition des données à l'Etna, en particulier J. Kornprobst, G. Dubosclard, Roland Cordesses, Claude Hervier, Jacques Fournet-Fayard ainsi que l'ensemble des membres du Service de Développement Technique de l'OPGC. Les soutiens durables de Jean-François Lénat, Timothy Druitt, Claude Jaupart (contrat INSU-PNRN) et de Patrick Allard (contrat CEE MVRRS: Monitoring Volcanic Risks by Remote Sensing, ENV4-CT96-288, coordonné par Peter Francis) ont également été très précieux. Un grand merci à Sylvie Vergniolle, tout d’abord pour avoir mis à disposition ses données acoustiques, mais surtout pour son aide indispensable sur ce travail de corrélation radar-acoustique. Merci a Patrick Allard qui a contribué aux mesures radar des 4, 7, 13 Juillet 2001, pour avoir effectué seul les mesures radar des 29 et 31 Juillet, et fourni ses enregistrements vidéo. Je tiens aussi à remercier le jury d’avoir accepté de juger mon travail, et permis l’amélioration de mon manuscrit de thèse : les rapporteurs Patrick Allard et Mauro Coltelli, Sylvie Vergniolle en tant qu’examinatrice, et le président du jury Jean-François Lénat. A présent mes remerciements se tournent vers mes collègues : des thésards avant tout ! Je vais être bref et non exhaustif sinon je crois que je devrais écrire une seconde thèse rien que de « private jokes » et autres spéciales dédicaces. Alors un grand merci à tous pour ces trois années passées entre les quatre murs du LMV où les cinq continents se côtoyèrent tous les jours pour mon plus grand plaisir. Je n’oublie pas non plus les extérieurs J/E/R qui se reconnaîtront…il est loin le temps du gormen’s. Je souhaite maintenant remercier ma famille qui fut toujours à mes coté pendant toutes ces années d’études…et même avant ! Enfin, mes plus grands mercis se tournent vers la personne la plus chère à mon cœur, ma mie : Armelle, qui a aussi passé pas mal de temps avec VOLDORAD ces trois dernières années. Elle m’a apporté tellement que ces quelques mots ne suffisent évidemment pas à retranscrire l’importance et la nécessité de sa présence à mes cotés.


Abstract VOLDORAD, a low power UHF Doppler radar, is a portable ground-based system, developed by the Observatoire de Physique du Globe de Clermont-Ferrand (France), especially for the study of explosive volcanic activity. The capabilities of such remote sensing methods to probe safely hazardous eruption jets and plumes constitute a real step forward regarding the in-depth analysis of physical processes controlling the dynamics of volcanic eruptions. The main objective of this work is to bring more stringent constraints, particularly from the development of methodological procedures, on the interpretation of Doppler radar data, with the final aim of better understanding the explosive dynamics. This study has been achieved from Doppler radar measurements carried out at Etna Southeast crater during the eruption of July 4, 2001, and focused on the Strombolian activity. However, processing methods, theoretical forward models and inversion procedures developed here have been achieved with the scope of a more general application, i.e., for various types of eruptions. The thorough analysis of Strombolian explosions by ground-based Doppler radar has permitted to obtain a wide range of source parameters, mainly related to kinetic, loading and geometrical features. Accurate quantitative assessment of these parameters and their evolution with time is crucial for (1) monitoring and early warning of active volcanoes, and (2) to provide better constraints on assumptions included in models of eruptive dynamics, useful for the volcanological community, as well as for ash dispersal prediction models used for risk mitigation.
Résumé VOLDORAD, un radar Doppler UHF moyenne puissance, est un système portable basé au sol, développé par l’Observatoire de Physique du Globe de Clermont-Ferrand (France), spécifiquement pour l’étude de l’activité volcanique explosive. La capacité de ces méthodes de télédétection à sonder l’intérieur des jets et des panaches volcaniques dangereux constitue un vrai pas en avant concernant l’analyse des paramètres physiques qui contrôlent la dynamique des éruptions volcaniques. L’objectif principal de cette thèse est d’apporter des contraintes plus précises, notamment à partir du développement de procédures méthodologiques, sur l’interprétation des données radar Doppler, dans le but final d’améliorer notre compréhension de la dynamique explosive. Ce travail a été réalisé à partir de mesures radar Doppler acquises pendant l’éruption du cratère Sud-est de l’Etna en Juillet 2001, et s’intéresse plus particulièrement à l’activité Strombolienne. Cependant, les méthodes de traitement, les modèles directs et les procédures d’inversion développés dans cette étude ont été réalisés dans une optique plus générale, et applicable sur différents types de dynamismes. L’étude détaillée de l’activité Strombolienne par la méthode radar Doppler a permis d’obtenir une large gamme de paramètres sources, notamment : les vitesses et masses de gaz et de particules, ainsi que les caractéristiques géométriques des jets. L’estimation quantitative précise de ces paramètres, et de leur évolution au cours du temps est cruciale pour (1) la surveillance et la détection précoce de l’activité volcanique, ainsi que (2) pour l’apport de contraintes sur les hypothèses formulées dans les modèles de dynamique éruptive et dans les modèles de prédiction de dispersion des cendres, indispensables à la minimisation des risques.
3


CONTENTS
11
17
37
61
95
123
161
199
211
217
227
Introduction Chapter I – Basics of explosive dynamics at Mt. Etna and introduction to remote
measurements methods in volcanology
Chapter II –VOLDORAD (Volcano Doppler Radar): technical characteristics and theoretical considerations
FIRST PART: DOPPLER RADAR STUDY
Chapter III – Kinetic features of Strombolian jets: insight from coupled Doppler radar and numerical modelling approach, and correlation with video data
Chapter IV– Loading features of Strombolian jets: insight from inversion of Doppler radar measurements
Chapter V – Geometrical features of Strombolian jets: insight from numerical modelling of Doppler-radar spectra
SECOND PART: MULTI-METHOD APPROACH
Chapter VI – Acoustic-video correlations: The last steps of a Strombolian bubble approaching the top of the magma column
Chapter VII – Acoustic-radar correlations: constraints on the shallow dynamics of Strombolian explosions
Conclusions and further works References Appendix
5

Contents
11
17
19 19 19 20 21 22
24 24 26 27 28
29 29 30 30 32 33
37
39 39 42
44 44 44 44 46 46 48
49 49 51 53
61
63 64 64 65
Introduction Chapter I - Basics of explosive dynamics at Mt. Etna and introduction to remote sensing methods in volcanology I.1. Mt. Etna Volcano and its explosive dynamisms
I.1.1. Volcanological context of Mt. Etna I.1.1.1. Geodynamical setting I.1.1.2. Past activity and Etna edification
I.1.2. Eruptive dynamics at Etna I.1.3. The July-August 2001 eruption
I.2. Dynamics of explosive basaltic eruptions
I.2.1. Strombolian vs. Hawaiian activity I.2.2. Deep origin of explosive basaltic eruptions
I.2.2.1. Collapsing foam (CF) model I.2.2.2. Rise speed dependent (RSD) model
I.3. Introduction to remote sensing techniques
I.3.1. Satellite-based methods I.3.2. Ground-based methods
I.3.2.1. Spectroscopic remote sensing techniques I.3.2.2. Acoustic measurements I.3.2.3. Doppler radar systems
Chapter II - VOLDORAD (Volcano Doppler Radar): Technical characteristics and
theoretical considerations II.1. Presentation of VOLDORAD
II.1.1. VOLDORAD technical characteristics II.1.2. VOLDORAD setting at Etna on July 4, 2001
II.2. VOLDORAD parameters acquisition
II.2.1. Radar power and velocity II.2.1.1. Recorded power II.2.1.2. Recorded velocity
II.2.2. Calculation of the spectral moments II.2.2.1. Doppler spectra II.2.2.2. Time series
II.3. Doppler radar: theoretical considerations
II.3.1. Formulation of the radar equation II.3.2. Calculation of the radial velocity II.3.3. Calculation of the power spectral density
FIRST PART: DOPPLER RADAR STUDY
Chapter III - Kinetic features of Strombolian jets: insight from coupled Doppler radar and numerical modelling approach, and correlation with video data III.1. Introduction III.2. Insight from video analysis method
III.2.1. Lava-bubble vs. lava-jet explosions III.2.2. Video-derived gas measurements
6

Contents
III.2.3. Video-derived particles measurements 66 68 69 70 72
74 74 75 75
77 77 79
81 82 84 86
89 89 90 91
92
95
97
98
99
103
105 105 107 108 108 109
110
111
114 114 116 117
118
III.2.4. Radar/video correlations of particles velocities III.2.4.1. Lava-jet explosions III.2.4.2. Lava-bubble explosions
III.2.5. Radar/video correlations of gas velocities III.3. Insight from numerical ballistic model
III.3.1. Ballistic model definition III.3.2. Parametric constraints III.3.3. Gas vs. particles velocities
III.4. Source parameters retrieval method
III.4.1. Initial gas velocity retrieval III.4.2. Initial particle velocity and mean diameter retrieval
III.5. A case study: explosion at 2141:56 UT
III.5.1. Initial gas and particles velocities III.5.2. Comparison of radar/video initial gas velocities III.5.3. Gas velocity decrease: insight from radar and video methods
III.6. Long sequence analysis of Strombolian activity
III.6.1. Doppler radar data III.6.2. Kinetic parameters retrieval III.6.3. Loading parameters retrieval
II.7. Discussion Chapter IV - Loading features of Strombolian jets: insight from inversion of Doppler radar measurements IV.1. Introduction IV.2. Acquisition of radar power parameters IV.3. Electromagnetic scattering model IV.4. Inversion method IV.5. Polydisperse particle size model
IV.5.1. Particle size distribution IV.5.2. Parameter constraints
IV.5.2.1. Shape factor, k IV.5.2.2. Shift factor, Λ IV.5.2.3. Scale factor, Nmax
IV.6. Monodisperse particle size model IV.7. Radar data IV.8. Results
IV.8.1. Particle loading parameters IV.8.2. Derived parameters IV.8.3. Possible effects of outsized particles
IV.9. Discussion
7

Contents
Chapter V - Geometrical features of Strombolian jets: insight from numerical 123
125
126 126 128
131 132 135 137
138 138 141 142
144 144 147
150
150 151 153
159
161
165
164
165 165 166 167 169 169 170 171 172 174 175
modelling of Doppler-radar spectra V.1. Introduction V.2. Recorded Volcano Doppler spectra (VOLDORAD)
V.2.1. Data acquisition with VOLDORAD V.2.2. Spectral moment calculations
V.3. Synthetic Volcano Doppler spectra (numerical modelling) V.3.1. Ballistic model V.3.2. Electromagnetic scattering model V.3.3. Synthetic Doppler spectra
V.4. Parametric tests V.4.1. Ejection angle vs. particle sizes distribution sensitivity V.4.2. Ejection angle anisotropy V.4.3. Mean ejection angle inclination
V.5. Geometrical properties of two contrasted Strombolian explosions V.5.1. Top-hat-shaped spectra V.5.2. Triangular-shaped spectra
V.6. Statistical analysis of geometrical features for a large number of characteristic Strombolian explosions
V.6.1. Relationship between radial velocity and ejection angle V.6.2. Statistical analysis of isotropic distributions V.6.3. Ejecta concentration inside the dispersion cone
V.7. Discussion
SECOND PART: MULTI-METHOD APPROACH Chapter VI - Acoustic-video correlations: the last steps of a Strombolian bubble
approaching the top of the magma column VI.1. Introduction VI.2. Setting and material VI.3. Acoustic and video observations data
VI.3.1. Description of video data VI.3.1.1. Bubble radius measurement procedure VI.3.1.2. Instabilities on the magma-air interface VI.3.1.3. Bubble vibration mode VI.3.1.4. Magmatic film rupture
VI.3.2. Description of acoustic data VI.3.2.1. Acoustic waveforms of typical Strombolian explosions VI.3.2.2. Detailed analysis on 9 large bubbles VI.3.2.3. Bubble depth estimate corresponding to the first acoustic precursor VI.3.2.4. Spectral content analysis on a 300-s sequence
8

Contents
176 176 176 178
180 181 182 185
186
186 186 188 193 194
196
199
201
201 201 203 204
205 205 206 207 208
209
211
217
227
229
235
245
VI.4. Theoretical features VI.4.1. Possible sources of sound generation
VI.4.1.1. Acoustic precursors: bubble vibration at depth VI.4.1.2. Main acoustic pulse: bubble nose vibration at the magma-air interface VI.4.1.3. Last acoustic event: bubble bottom vibration VI.4.1.4. Summary of possible mechanisms at work
VI.4.2. Synthetic modelling of acoustic waveform VI.4.3. Video-derived modelling of acoustic waveform
VI.5. Results: Comparison between measured, synthetic and video-derived acoustic waveforms
VI.5.1. Bubble Vibration as a source of sound VI.5.1.1. Synthetic vs. measured acoustic waveform comparison VI.5.1.2. Synthetic vs. video-derived acoustic waveform comparison VI.5.1.3. Video-derived vs. measured acoustic waveform comparison
VI.5.2 Alternative mechanism: balloon bursting model VI.6. Conclusion Chapter VII - Acoustic-radar correlations: constraints on the shallow dynamics of Strombolian explosions VII.1. Introduction VII.2. Temporal correlations of acoustic and radar measurements
VII.2.1. The case of four large bubbles VII.2.2. Analysis of a 100-s sequence of Strombolian activity VII.2.3. Acoustic pressure as a function of the radial velocity
VII.3. Gas velocity correlations from acoustic and radar measurements
VII.3.1. Calculation of the gas velocity from acoustic measurements VII.3.2. Example on 9 large bubbles VII.3.3. Analysis of a 100-s sequence of Strombolian activity VII.3.4. Long period correlation between acoustic and radar measurements
VII.4. Conclusion Conclusions and further works References Appendix
Appendix A: Ballistic model equations and code Appendix B: Electromagnetic scattering model equations, code and graphical interface Appendix C: Gouhier, M., and F. Donnadieu (2008), Mass estimation of ejecta from
Strombolian explosions by inversion of Doppler radar measurements, J. Geophys. Res., 113, B10202.
9


INTRODUCTION


Introduction
Volcanoes: a dynamic phenomenon actively displaying tremendous spectacles, remain the
seat of too often unexpected killing disasters, reminding us the importance of better
understanding eruptive mechanisms.
The study of eruptive dynamics is however very complex, particularly because of the spatial
evolution of physicochemical processes integrated over the whole edifice scale. Indeed, the
diversity of volcanic surface activities is the result of deeply rooted mechanisms emerging
from the chamber (bubble nucleation and coalescence, foam collapsing, etc.) and evolving in
the conduit (exsolution, coalescence, gas overpressurisation and fragmentation) up to the free
surface of the magma column (bubble expansion and bursting, lava clots ejection). Moreover,
the evolution of these processes on various time scales adds to the difficulties of
understanding eruption dynamics. Besides, some technical difficulties of measurements
related to huge and hazardous volcanic phenomena also make the study of volcanic activity
not easy. Indeed, in some cases, in situ measurements are unfeasible, particularly for the
explosive dynamics (Strombolian activity, ash plumes or pyroclastic flows), but also
regarding deep mechanisms occurring from the magma chamber to the conduit surface.
Therefore, remote sensing instruments turn out to be key tools for in-depth analysis of
integrated eruptive processes. Many remote sensing techniques have been used for a few
decades in order to better understand the dynamics of explosive eruptions. Satellite imagery
and ground-based weather radars have been used rather to monitor the long-range evolution of
ash dispersion than dynamics itself.
A major challenge is now to measure physical quantities closer to the vent in order to retrieve
directly the true source parameters (1) that potentially provide more stringent constraints on
the eruption dynamics, and (2) that permits close volcano monitoring for early warnings and
risks mitigation: such is the purpose of this thesis.
In this work, we focus on the study of Strombolian dynamics at Mount Etna volcano by
means of a pulsed ground-based Doppler radar (VOLDORAD = Volcano Doppler Radar)
developed by the Observatoire de Physique du Globe de Clermont-Ferrand (France)
specifically for the sounding of explosive volcanic activity. First studies, carried out at Etna
during the eruption of October 1998 (Dubosclard et al., 1999, 2004) for the testing of
VOLDORAD, had pointed out the great potential of Doppler radar techniques for volcanic
applications. Further works realized at Etna (Italy) during the eruption of July-August 2001,
13

Introduction
and at Arenal volcano (Costa Rica) in February 2004, have proved the powerful capabilities
of VOLDORAD to retrieve quantitative estimates of source parameters on various types of
volcanic activity (Donnadieu et al., 2003, 2005). A second step has been achieved in this
thesis with the retrieval of loading parameters (Gouhier and Donnadieu, 2008). In addition,
some efforts have been made in the understanding of Doppler radar signals for a better
interpretation of kinetic and geometric parameters particularly.
The analysis of surface processes by ground-based Doppler radar potentially permits to obtain
two sets of fundamental parameters: (1) velocimetric parameters (e.g., particle and gas
velocities, gas fluxes, kinetic energy), and (2) loading parameters (e.g., ejected particle mass,
ejecta concentration, volume, mean particle diameter, mass fluxes, thermal energy).
Furthermore, information on geometrical features of lava jets and plumes can also be
assessed.
This thesis work has particularly focused on the development of methodological procedures
that aimed at improving our interpretation of the Doppler radar data, with the final goal of
better understanding eruption processes and source parameters valuable to the volcanological
community. This work has been achieved from Doppler radar measurements carried out at
Etna southeast crater (SEC) during episodes of Strombolian activity in July 2001.
Nevertheless, processing methods, theoretical forward models and inversion procedures
developed in this study have been realized with the scope of a more general application, i.e.,
for various types of eruptive dynamisms, ranging from mild Strombolian activity to large ash
plumes. Thus, we did not aim at investigating in depth physical mechanisms at work at Etna
but rather to develop some general tools that could be further used routinely in volcano
monitoring as well as for scientific investigations of a given eruptive behaviour. Mount Etna
is rather used as first-rate example of explosive basaltic volcano to test and improve the
interpretations of Doppler radar data.
Also, comparisons with other techniques (video, acoustic) probing the same object but with
different angle shots has been carried out. Video methods portray the surface activity as well
as VOLDORAD and hence permit close correlations valuable to validate interpretations of
Doppler radar signals. Acoustic methods are particularly interesting to describe shallow
processes at the interface between the surface and the chamber. Comparisons with Doppler
radar signals must bring interesting constraints on the decoupling of physical processes from
depth to the surface. Comparisons between Doppler radar and other techniques that represent
14

Introduction
a smaller part of this thesis have to be regarded as preliminary works. However, they appear
promising in the study of eruption dynamics to unravel the links between degassing processes
at depth and the surface eruptive behaviour of a volcano.
The first chapter of this manuscript gives a brief overview of the volcanological context at
Mt. Etna: the explosive basaltic dynamism and particularly the description of the eruption that
took place in July, 2001. We then review remote sensing techniques applied to volcanic
eruptions described in the literature.
The second chapter is devoted to the detailed presentation of VOLDORAD, whose data have
been used extensively, and more generally to the Doppler radar technique.
In a first part, that comprises the chapters III, IV and V, we focus on the study of Doppler
radar data, in particular for the analysis of kinetic, loading and geometrical features:
- The third chapter is devoted to the study of Doppler radar velocity measurements from
a coupled approach with ballistic numerical modelling and video analysis. We
particularly focus on gas/particle discrimination, and quantitative assessment of source
parameters such as initial gas and particle velocities.
- In chapter four we present a method to estimate particle loading parameters (mass,
volume, concentration, mean particle diameter particularly) of eruptive jets by
inversion of echo-power data measured by VOLDORAD. The automatic inversion
algorithm uses the complete Mie (1908) formulation of electromagnetic scattering
waves. We also present an alternative approximation specifically devoted to the rapid
assessment of loading parameters for real-time volcanic monitoring purposes.
- The fifth chapter presents a complete synthetic model of Doppler radar spectra
devoted to the understanding of geometrical properties of Strombolian jets, based on
both ballistic and electromagnetic scattering models mentioned previously.
The second part, which comprises the chapters VI and VII, is devoted to the correlations of
acoustic-video and acoustic-radar methods:
- In chapter six we focus on acoustic and video measurements for the study of bubble
oscillation and bursting mechanisms at the top of the magma column. In spite of some
difficulties related to the visual observations, the thorough analysis of video snapshots
permits to build video-derived acoustic waveforms subsequently compared with
15

Introduction
recorded acoustic waveforms. In addition, by best fit matching of synthetic acoustic
waveforms generated by a theoretical bubble vibration model with video-derived and
recorded acoustic waveforms, we can estimate crucial physical parameters such as
bubble overpressure and volume.
- In the last chapter, we have carried out preliminary correlations between acoustic and
radar measurements. Processes recorded by these two methods are different but
directly linked, as the overpressurized bubble bursting is at the origin of the
fragmentation and ejection of lava clots subsequently recorded by VOLDORAD.
16

CHAPTER I
Basics of explosive dynamics at Mt. Etna and
introduction to remote sensing methods in volcanology


Chapter I – Basics of explosive dynamics at Mt. Etna
I.1 Mt. Etna Volcano and its explosive dynamisms
We present here some general elements related to the geological framework of Mount Etna
Volcano and some basics related to the explosive dynamism. However, bearing in mind the
technical purposes of this thesis that shed light on methodological aspects rather than focusing
on the volcanic dynamism itself, we just aim at giving a brief introduction necessary to the
understanding of that work.
I.1.1. Volcanological context of Mt. Etna
I.1.1.1. Geodynamical setting
Mount Etna is the largest European active volcano covering an area of 1250 km² and reaching
3340 m elevation. It lies on the Sicilian continental crust (30 km thick), at the boundary with
the African and European plates (Figure I.1), and the Ionian micro-plate constituted by a
thinner (10-12 km) oceanic crust that undergoes subsidence and consumption below Calabria
(Scandone et al., 1981).
Figure I.1. Satellite-based view of Mt. Etna (Sicily) showing its focal position between
African/European plates, and the Ionian micro-plate (courtesy of NASA).
19

Chapter I – Basics of explosive dynamics at Mt. Etna
The geodynamical context of Mt. Etna volcano is complex and the origin of the volcanism is
still a matter of debate. Hotspot origin has long been suggested associated with upwelling of
deep mantle material (e.g., Tanguy et al., 1997; Clocchatti et al., 1998), but more recent
studies have also pointed out the possible contribution of subduction-related mechanisms
(Schiano et al., 2001). Further shallow structural processes have been proposed to explain the
edification of Mt. Etna. As many volcanoes, it was first assumed that Etna derives from an
extensional strain field. On the contrary, taking into account the regional framework of
eastern Sicily, Lentini (1982) concludes that Etna functions in a sector undergoing
compression. More recent studies, owing to the distribution of the discontinuities have
suggested that recent volcanic activity at Etna is controlled by deep-seated “rift zones”
oriented mainly N-S, (e.g., Tanguy and Kieffer., 1993; Lanzafame et al., 1997b). Numerous
geophysical studies (e.g., Chiarabba, 2000; Patanè et al., 2002) have provided some
constraints on the structure of the crust that revealed two main units: the first one is
constituted (0 – 3.5 km) of flysch nappes and the second one (3.5 – 10 km) of carbonated
nappes. These sediments lie on 8 – 10 km of crystalline crust constituted of metamorphic
rocks. This substratum is intersected by a wide plutonic body that represents the dykes’
network of the feeding system.
I.1.1.2. Past activity and Etna edification
The earliest geological studies of Etna volcano were performed during the first half of the 19th
century (e.g., Gemmellaro, 1858). They compiled the first geological map of Etna and
performed the first stratigraphic studies that allowed them to recognize the polygenetic origin
of the volcano. More recent stratigraphic and structural data (e.g., Rittman, 1973, Branca et
al., 2004) have allowed subdividing the almost continuous evolution of Etnean volcanism into
four main phases lying from about 600 Ka to present day.
(1) The first phase, called pre-etnean (600-250 ka) consists mainly of sub-alkaline tholeiitic
basalts (Condomines et al., 1995). (2) The Timpe phase, (250-100 ka) is related to a
volcanism that crop out in the lower and intermediate portion of tectonic escarpments locally
known as Timpe (Corsaro et al., 2002). In the volcanic succession formed during that period,
the transition from sub-alkaline to alkaline lavas is recorded. (3) During the Valle del Bove
phase (80- 40 ka), the products emitted are essentially lava flows. These rocks mostly outcrop
in the walls of the Valle del Bove, forming stratigraphic sections (Gillot et al., 1994). Lavas
compositions vary from hawaiitic to benmoreitic. (4) The stratovolcano phase, (40 ka to
20

Chapter I – Basics of explosive dynamics at Mt. Etna
present day), is related to an eruptive activity that was essentially fed by two central volcanic
edifices: Ellitico and Mongibello, which lavas composition range from alkali-basalts to
trachytes. If current Etna’s activity is at the present time considered to be the site of mild
explosive eruptions, such as Strombolian activity, to effusive eruptions, note however that in
the past 100 ka, several main periods of subplinian to plinian activity have been recorded
(Coltelli et al., 2000, Del Carlo et al., 2004). After the end of Ellitico activity, Mongibello
activity started filling the caldera with its products and built the volcano edifice from which
the historical and present activity originates (Gillot et al., 1994; Condomines et al., 1995).
Nowadays, the Mt. Etna activity is mainly located north-westward to the Valle del Bove, and
centred on four summit craters: Northeast crater, Voragine, Bocca Nuova and Southeast
Crater.
I.1.2. Eruptive dynamics at Etna
Mount Etna is among the few volcanoes on Earth that erupt nearly continuously, emitting
large amount of gas even during quiescence periods (Allard et al., 1991). As a comparison,
SO2 emissions of Mt. Etna volcano represent about 10% of the total amount produced by
volcanoes on earth. However, its activity undergoes significant fluctuations in time. The
analysis of the eruptive dynamics at Etna (Allard et al., 2006) has revealed the existence of
long-term eruptive cycles lasting several centuries, and assumed to reflect a general magma
draining from the shallow plumbing system (FigureI.2). On the other hand, short-term
eruptive cycles extending over several decades have been pointed out corresponding mostly to
the refill of the plumbing system (Behncke and Neri, 2003a,b). Long-term cycles consist of
three phases, beginning with low-level activity followed by nearly continuous summit activity
and culminating with a series of flank eruptions, the last commonly being the most
voluminous. In contrast, short-time eruptive cycles consist of three distinct phases, starting
with a short period of quiescence following by increasing activity centred at the summit and
ending with a series of flank eruptions (Behncke et al., 2004).
The feeding system at Mt. Etna is complex; nevertheless, many studies carried out in the last
few decades, particularly from the tomography, geochemistry and gas analyses have permitted
the understanding of the present plumbing system. It has become widely accepted that no
major shallow magma reservoir currently exists beneath Etna, the magma thus rises rapidly
from the mantle, about 18 – 20 km under the volcano, although shallow magma storage area
are necessary to account for the magma differentiation (Corsaro and Pompilio, 2004a,b).
21

Chapter I – Basics of explosive dynamics at Mt. Etna
Indeed, geophysical studies (De Gori et al., 2005; Murru et al., 2005) suggest the presence of
two main active magma ponding zones at depths of 10±2 km and 5±1 km below the sea level,
included in a large plutonic complex 5 – 10 km wide emplaced in the sedimentary basement.
Further results, based on the analysis of melt inclusions depth entrapment during flank
eruptions of 2001 and 2002-2003, confirm the existence of such a shallow ponding area
(Métrich et al., 2004; Spilliaert et al., 2006). Seismic and ground deformation data acquired
since 1993, suggest that Etna’s magmas ascend across the plutonic body, generating internal
overpressures, the shallower ponding zone acting as a temporary storage system that regulates
the eruptive activity (Patanè et al., 2003a). Additional studies based on volcanic gas fluxes
show that between 1975 – 1995, about 4 times more magma had degassed than extruded,
implying that magma degassing is predominantly intrusive in the long term (Allard, 1997).
Figure I.2. Plot of cumulated erupted lava volume at Etna between 1865 and 2001 (plain line), and the
variation of effusion rate averaged on 10 years (dotted line), from Behncke and Neri (2003a)
I.1.3. The July-August 2001 eruption
The July-August 2001 eruption takes part in a new short-term cycle, initiated in 1993, after a
major flank eruption that drained all magma from the shallow plumbing system (Rymer et al.,
1995). From April 1993 until July 1995 the activity is characterized by a profound quiescence
and only non-eruptive degassing from the summit craters. From late July 1995, the eruptive
activity increased progressively, but still confined at the summit craters until the flank
eruption of July 17, 2001. Indeed, over 6 years the summit activity had increased
progressively starting with lava fountains at Northeast Crater (NEC), followed by explosive
paroxysms sometimes reaching Sub-Plinian intensity (Crater Voragine, 1998). Finally, series
22

Chapter I – Basics of explosive dynamics at Mt. Etna
of about 100 lava fountains of high intensity arose at Southeast Crater (SEC) in 09/1998 –
02/1999; 01/2000 – 07/2000; and 05/2001 – 07/2001. The progressive increase of the summit
activity stresses the refilling of the shallow plumbing system pressurizing until the surfacing
of the flank eruption in July 17, 2001 (Figure I.3). Note that flank eruptions are not related to
simple magma drainage of the central conduits but rather to the intrusion of distinct dykes
propagating from depth.
(b)
(a)
Figure I.3. (a) Plot of SO2 flux at Mount Etna from January, 2001 to October, 2002 showing
particularly a progressive augmentation from May to early July, 2001 followed by a sudden dramatic
increase of the SO2 flux during the flank eruption of July 17, 2001 (courtesy INGV). (b) Focus plot of
the maximum radial velocity and radar power evolution during the eruption of July 4, 2001 showing
successive periods of quiescence and intense activity with a paroxysm phase between 2100:00 UT
and 2200:00 UT as shown simultaneously by the tremor signal (Donnadieu et al., in prep).
In this general context, and after more than 8 months of minor activity (slow lava flows,
degassing, light ash emission, and low-level Strombolian activity), a new episode of vigorous
activity began at the Southeast Crater on 9 May 2001. From then until July 17, 2001,
eruptions occurred at Etna SEC every 3-5 days, each lasting on average a few hours and
involving multiple Strombolian explosions and lava fountaining. Doppler radar measurements
used for this thesis were carried out over about 5 hours during the eruption of July 4, 2001.
The activity began at about 18:00 UT and at first involved small explosions repeated every
~10 s in average. The intensity then increased progressively, culminating in very powerful
Strombolian explosions every 2-3 s, with the bursting of very large bubbles sometimes rising
above the crater rims, between 21:00 UT and 22:00 UT but without real lava fountains. The
23

Chapter I – Basics of explosive dynamics at Mt. Etna
eruption intensity then decreased rapidly from 22:00 UT and ended at 23:00 UT after about
five hours of mainly Strombolian activity. This eruption with especially high eruptive
intensity showed a typical Strombolian activity, and constitutes an ideal framework for the
study of explosive dynamics by mean of remote sensing techniques. Radar measurements
carried out in July 7, 13 at Etna SEC, showed an increase in eruptive intensity until the flank
eruption. Additional radar measurements were realized by P. Allard in July 29-31 on laghetto
(~2700 m a.s.l) newly formed cone.
I.2. Dynamics of explosive basaltic eruptions
I.2.1. Strombolian vs. Hawaiian activity
Strombolian activity takes its name from the frequent, small-scale, transient explosions
exhibited by Stromboli, a volcano which forms one of the Aeolian Islands north of Sicily. The
term ‘‘Strombolian’’ is most commonly used to denote the relatively mild explosions that
occur from the accumulation of gas beneath the cooled upper surface of a magma column
(e.g., Blackburn et al., 1976; Wilson, 1980). But in a more general way, the Strombolian and
Hawaiian activities are the end members’ expression of explosive basaltic eruptions.
Strombolian activity is associated with discrete explosions at the surface of the magma
column owing to the bursting of a large overpressurized bubble (Figure I.4). The overlying
magmatic film thus breaks into fragmented lava clots ejected violently in the surrounding air
by the gas release. Note that in Strombolian explosion, the gas amount can exceed the solid
fraction (e.g., Chouet et al., 1974; Allard et al., 1994a,b), showing a possible gas separation at
depth. Nevertheless some difficulties remain on understanding of shallow two-phase flow
mechanisms.
24

Chapter I – Basics of explosive dynamics at Mt. Etna
Figure I.4. Photograph of typical Strombolian explosion by B. Chouet in December 1969, showing a
close view of Stromboli Volcano (Italy) erupting incandescent molten lava fragments.
Hawaiian activity, although less frequent at Etna, displays tremendous spectacle in form of
fire fountains. They are almost continuous jets propelling fragmented magma rather vertically
with a high gas fraction. (Figure I.5).
Figure I.5. Scene of a ~ 200-m-tall fountain of lava appeared at Etna (Sicily) on 24 July 2001. The
fountain emerged from a 150-m-wide crater formed along a fissure at ~ 2,500 m. Copyrighted photo
provided by courtesy of Tom Pfeiffer.
Although these eruptions are generally much less violent than their more silicic counterparts
they are, nonetheless, explosive and need to be considered as part of a continuum of explosive
activity that embraces not only the familiar explosive basaltic eruption styles (Hawaiian and
Strombolian) but includes sub-Plinian, Plinian, and ultra-Plinian (Figure I.6). Walker (1973)
proposed a classification of explosive eruption styles based on the magma fragmentation
degree and the dispersal of pyroclasts. At Etna, excluding some exceptional sub-plinian (July
22, 1998) or plinian (122 BC) eruptive phase (Coltelli et al., 2005), the very large majority of
explosive episodes present a Strombolian activity associated with discrete explosions, and less
frequently Hawaiian activity related to lava fountains.
Our understanding of the mechanisms of explosive basaltic eruptions has advanced
considerably during the past ~30 years due to the collection and analysis of new field data
(e.g., McGetchin et al., 1974; Self, 1976; Parfitt, 1998), volcano monitoring (e.g., Chouet et
al., 1974; Blackburn et al., 1976; Vergniolle and Brandeis, 1994, 1996; Ripepe, 1996; Hort
and Seyfried, 1998; Dubosclard et al., 2004; Allard et al., 2005), laboratory studies (e.g.,
25

Chapter I – Basics of explosive dynamics at Mt. Etna
Jaupart and Vergniolle, 1988; Seyfried and Freundt, 2000) and through mathematical
modelling (Sparks, 1978; Wilson, 1980; Vergniolle and Jaupart, 1986; Jaupart and
Vergniolle, 1988; Woods, 1993; Parfitt and Wilson, 1995, 1999).
Figure I.6. Diagram showing Walker’s (1973) classification scheme for explosive volcanic eruptions
which is based on the degree of fragmentation (F) of the magma and the dispersal area (D) of the
tephra.
I.2.2. Deep origin of explosive basaltic eruptions
It is now widely accepted that Strombolian eruptions result from the formation and bursting of
a gas pocket (slug) close to the surface (e.g., Blackburn et al., 1976; Wilson, 1980; Vergniolle
and Brandeis, 1994, 1996), although some details of the mechanism are still disputed. Indeed,
two contrasting models of the dynamics of explosive basaltic eruptions are in current usage:
the rise speed dependent (RSD) model (Wilson, 1980; Head and Wilson, 1987; Fagents and
Wilson, 1993; Parfitt and Wilson, 1994, 1999; Parfitt 2004) and the collapsing foam (CF)
model (Vergniolle and Jaupart, 1986, 1990; Jaupart and Vergniolle, 1988, 1989; Vergniolle,
1996). Both models do not differ very much in their view of Strombolian activity. They both
treat this explosive activity as occurring from gas accumulation forming large bubbles that
cause a raising and up-doming of the surface of the magma column. Actually, the main
difference between the models concerns where and how does gas accumulation occur within
the magmatic system. More recent studies (Burton et al., 2007) demonstrate that gas slugs
may originate from as deep as the volcano-crust interface ( 3 km at Stromboli volcano),
where both structural discontinuities and differential bubble-rise speed can promote slug
coalescence. The observed decoupling between deep slug genesis and shallow ( 250-meter)
26

Chapter I – Basics of explosive dynamics at Mt. Etna
explosion quakes may be a common feature of strombolian activity, determined by the
geometry of plumbing systems.
I.2.2.1. Collapsing foam (CF) model
In the CF model, magma is assumed to be stored within some sort of storage area (a shallow
magma chamber or a dike system) at a depth at which gas can exsolve from the magma. The
gas bubbles, once formed, rise and accumulate at the roof of the storage area and become
close-packed into a foam layer. When the foam layer reaches a critical thickness, it becomes
unstable and collapses, with bubbles coalescing to form a gas pocket. The slug then rises up
an open vent system and is erupted. Strombolian eruptions, represent repeated partial foam
collapse events, called “slug flow” (Figure I.7a) whereas fire fountains occur from complete
and almost instantaneous foam collapse called “annular flow” (Figure I.7b). This model is
based on separated two-phase flow regime, and implies a differential transfer of the gas phase.
(a)
Strombolian explosions
SLUG (b)
Fire fountains
ANNULAR
Figure I.7. Experiments of the alternating regimes of foam build up and collapse model (from Jaupart
and Vergniolle, 1989). After bubble accumulation at the roof of the tank, the foam collapses at a critical
thickness (a) either partially into successive pulsed single gas pockets (slug flow) which start erupting
as Strombolian explosions, (b) or completely and continuously (annular flow) with a central gas jet
erupting as fire fountains (experiments from Vergniolle and Jaupart, 1990).
27

Chapter I – Basics of explosive dynamics at Mt. Etna
I.2.2.2. Rise speed dependent (RSD) model
The RSD model is based on the observation that larger bubbles rise faster than smaller ones
and therefore have the opportunity to overtake and coalesce with smaller bubbles. However,
coalescence is possible if bubbles have the opportunity to move upwards relative to the
magma, i.e., as long as the magma rise speed is low (Figure I.8a). For low magma rise speed,
bubbles can coalesce easily, leading in extreme case to the formation of a single large slug
producing a Strombolian explosion at the surface. In contrast, if the magma rise speed is high,
there is no bubble coalescence leading to the formation of fire fountains. At a given gas
content, the eruptive style is therefore directly dependent on the magma rise speed
(Figure I.8b). This model is based on homogeneous two-phase flow regime, and implies
mainly syn-eruptive gas segregation.
(a) (b)
Figure I.8. (a) Plot showing the relationship between final bubble size and magma rise speed. (b) Plot
showing the controls of magma rise speed and gas content on basaltic eruption style as predicted by
the RSD model (Parfitt and Wilson, 1995).
Both models show the importance of the gas phase in the dynamics of explosive basaltic
eruption. However, they significantly depart on the origin of the gas phase which should
betray different chemical signature. In situ measurements of the gas composition inside lava
fountains have been carried out at Etna from Open-Path Fourier Transform Infrared (OP–
FTIR) and revealed a separated two-phase flow mechanism (CF model) implying differential
gas transfer primarily accumulated in a shallow ponding zone at about 1.5 – 2 km under the
crater (Allard et al., 2005).
28

Chapter I – Introduction to remote sensing techniques in volcanology
I.3. Introduction to remote sensing techniques Remote sensing, in the simplest words, means obtaining information about an object without
touching the object itself. Human eye is the best example of such a remote data acquisition
technique using passively natural electromagnetic waves scattered by surrounding objects to
build a coloured image of our environment. In situ measurements of volcanic eruptions are
one of the major challenges left in geophysical Volcanology. Bearing in mind obvious
difficulties to study hazardous explosive eruptions, remote sensing techniques turn out to be a
very powerful tool for direct observations and quantitative measurements inside eruptive jets.
The volcanological community has rapidly perceived the great ability of remote sensing
systems to the monitoring and risk assessment of dangerous volcanoes.
I.3.1. Satellite-based methods
Satellite-based remote sensing systems have been used abundantly for volcanic applications.
Large spatial coverage is one of the main important advantages of satellite-based methods,
which can be advantageously used for tracking the long range evolution of large ash plumes.
Bearing in mind the profusion of these systems, we just aim at giving some key example of
satellite-based studies. Particularly infrared systems such as MODIS (Moderate Resolution
Imaging Spectroradiometer), have a low earth polar orbit satellite with a good spatial
resolution up to 250 m (e.g., Gu et al., 2003; Watson et al., 2004), and a poor temporal
resolution inherent to its orbit. MSG (Meteosat second generation), has a high earth
geosynchronous orbit with a low spatial resolution (2.5 km) and very high temporal resolution
(1 image per 15 min) related to its geosynchronous orbit (Prata et al., 2007). Such systems are
complementary and permit both the detailed analysis and real-time monitoring of large ash
plumes dispersal.
In contrast, Ultra-violet systems such as TOMS (Total Ozone Mapping Spectrometer;
Krueger, 1983; Bluth et al., 1993) or more recently OMI (Ozone Monitoring Instrument;
Krotkov et al., 2007; Carn et al., 2008) are both low earth polar orbit satellite and are rather
devoted to volcanic SO2 retrieval.
29

Chapter I – Introduction to remote sensing techniques in volcanology
However, these satellite-based methods operating at small wavelengths (ultra-violet to
infrared) compared to radar techniques meet real difficulties for the quantitative assessment of
ash and gas loading. Indeed, micrometric wavelengths are very sensitive to fine particles that
constitute the earth’s atmosphere, and hence the contribution of water vapour reflectivity for
instance remains problematic for the estimation of volcanic products dispersed into the
atmosphere. In addition, satellite-based techniques often fail to probe early eruptive processes
or even low intensity eruption because of either low temporal or spatial resolutions, and hence
they cannot be used easily routinely for early warnings.
I.3.2. Ground-based methods
Simultaneously to the development of satellite-based systems, a wide range of ground-based
remote sensing devices had emerged. First we present a group of tools devoted to the
determination of volcanic gas release and composition, based on the spectroscopic techniques.
Then we give some details on radar techniques used particularly for determination of volcanic
clasts loading and velocity.
I.3.2.1. Spectroscopic remote sensing techniques
Most of the spectroscopic methods are geared toward quantifying the SO2 input into
atmosphere because SO2 is believed to be one of the most important volcanic gases and has a
strong short-term influence on the global climate. The application of spectroscopic remote
sensing techniques turns out to be a key tool for the monitoring of hazardous volcanoes. In
addition to real-time capabilities, these techniques permit the thorough study of various
volcanic gas species inside the eruptive jet providing stringent constraints on the state of the
plumbing system.
COSPEC
The Correlation Spectrometer (COSPEC) is the first and most common spectroscopic remote
sensing technique employed at volcanoes. This UV sensitive opto-mechanical instrument is
able to measure slant or vertical SO2 column, which is purely volcanic and NO2 purely
atmospheric. The retrieval of gas abundance is based on the comparison between blue-sky,
calibration cell (without volcanic gas), and a volcanic plume scan. Gas flux can hence be
30

Chapter I – Introduction to remote sensing techniques in volcanology
determined multiplying the integrated SO2 cross-section by estimated plume transport
velocity, derived from simultaneous measurements of wind speed and direction. However, the
accuracy of gas velocity estimation is crucial for evaluating reliable volcanic gas fluxes. The
uncertainty of the wind speed at high altitude contributes greatly to the error in the flux
evaluation outlined by COSPEC users. The uncertainty (15–25% according to Caltabiano et
al., 1994) does not invalidate remote COSPEC SO2 measurements as flux variations are
considered significant. For 30 years, the correlation spectrometer (COSPEC) has been the
principal tool for remote monitoring of volcanic SO2 fluxes, particularly at Mt. Etna (e.g.,
Haulet et al., 1977; Bruno et al., 2001). During this time, the instrument has played a
prominent role in volcanic hazard assessment. Though innovative for its time, COSPEC is
now outdated in several respects.
DOAS
The Differential Optical Absorption Spectroscopy (DOAS) is a proven method for accurate
spectral analysis that has been recently applied to volcanic gas monitoring (e.g., McGonigle et
al., 2002), and turns out to be a serious alternative to COSPEC instruments. There are a
number of advantages to such spectrometers including the collection of broadband ultraviolet
spectra, which gives the potential to sense other atmospheric trace gases and to model the
radiative transfer. Furthermore, ultra-compact and light-weight mini-DOAS systems recently
developed offers the possibility to obtain plume SO2 measurements with the minimum of
logistical support. Note that in some cases radars such as VOLDORAD can be used to
provide an accurate transport speed of ash cloud and hence be coupled advantageously with
DOAS for estimating SO2 gas flux.
FTIR
The Fourier Transform Infrared (FTIR) spectroscopy is a technique that has first been widely
used in laboratory analyses, and has provided excellent results in open path air for volcano
monitoring (Francis et al., 1996). At Etna for instance, Allard et al. (2005) proved the
emptying of a large gas bubble layer previously accumulated at about 1.5 km depth below the
erupting crater. This technique represents an important step forward as it permits to obtain
real-time measurements of absolute column abundances, and relative concentration ratio for
different gas species. Indeed, OP-FTIR can determine the identity and molar path amount of a
large range of gas species (H20, CO2, SO2, N2O, HCL, HF and CO) along the beam path
31

Chapter I – Introduction to remote sensing techniques in volcanology
length from spectral absorption lines of the infrared radiation emitted by hot bodies
(pyroclasts or lava flows), or simply from solar occultation.
Digital camera
Forward Looking Infrared Radiometer (FLIR) cameras offer a unique view of explosive
volcanism by providing an image of calibrated temperatures. FLIR camera operates at typical
temporal resolution up to 30 Hz. The FLIR is able to detect both ash plumes and coarse
ballistic scoria, meet in various styles of eruptions (e.g., Patrick et al., 2007). In addition to
temperature information, this technique also permits the estimation of particle and gas
velocities.
More recently, a ultra-violet digital camera has been developed for imaging and quantification
of volcanic plume SO2 (Bluth et al., 2007). This camera utilizes a bandpass filter to collect
photons in the ultra-violet (UV) region where SO2 selectively absorbs UV light. SO2 is
quantified by imaging calibration cells of known SO2 concentrations. Reliable images can be
acquired from distances ranging from 4 to 16 km away from the volcanic target, with a
temporal resolution of up to 6 images per minute. In addition to a very short set-up time
capabilities, the camera can observe variable in-plume concentrations, and accurate plume
speeds (or rise rates) can readily be determined by tracing individual portions of the plume
within sequential images.
I.3.2.2. Acoustic measurements
A different technique, also based on the Doppler shift during acoustic sounding (SODAR)
was used by Weill et al. (1992) who carried out measurements of eruption velocities at
Stromboli Volcano. They measured more than 100 explosions from which vertical velocities
close to the vent ranging from 20 to 80 m/s were determined. This technique allows
continuous monitoring of volcanic eruption, but the weight (~500 kg) and high energy
consumption of the antenna do not make this instrument easy to operate in difficult areas. In
addition, the speed of sound is a strong function of the temperature; therefore its accurate
knowledge is necessary for calculating eruption velocities.
I.3.2.3. Doppler radar systems
32

Chapter I – Introduction to remote sensing techniques in volcanology
Radar (Radio detection and ranging) is an active remote sensing system for the detection and
location of reflecting objects. By contrast to passive remote sensing systems, radars operate
by radiating their own electromagnetic source into space with a wavelength (Figure I.9)
typically ranging from 1–8 cm (apart for VOLDORAD) for volcanic applications (X, C, or S-
band). The spectral region investigated by radar systems permit the detection of solid particles
as fine as few millimetres up to several dozens of centimetres thus covering the particle size
range of typical volcanic eruptions. Systems are typically amplitude modulated (AM), based
on short pulses of very high power. In addition to their capability to detect the amount of
particle inside distinct sampling volumes (the so-called range gates), most radar systems
utilize Doppler shift-based techniques to measure the velocity of moving targets. Such radar
systems have long been employed for meteorological purposes, and utilized opportunistically
for volcanic applications.
Figure I.9. Electromagnetic spectrum showing spectral bands of most common radars. Weather
radars usually utilized for volcanic applications operate at wavelengths ranging typically from 1 – 8 cm
(X, C, or S-band). We also focus on VOLDORAD system that operates at the singular wavelength of
23.5 cm (L-band), and specifically devoted to the sounding of explosive volcanic activity.
Weather radars
Since nearly three decades ground-based weather radars were used to track the long range
evolution and some physical characteristics (ash plume velocity, ash concentration,
geometrical extent of the volcanic plume) of large ash clouds derived from explosive
eruptions of various volcanic targets, such as Mount St. Helens (e.g., Harris et al., 1981;
Harris and Rose, 1983). But these radar systems are fixed and have to be used
opportunistically in a maximum distance range of about 500 km to the target. At such a
distance, the sampling volume resolution is low leading to some incapability to detect small
33

Chapter I – Introduction to remote sensing techniques in volcanology
eruptive events and obtain accurate information on internal structure dynamics. Moreover, the
earth curvature impedes weather radars to provide information on early ash plume component
(Lacasse et al., 2004). Therefore, they just permit to probe the upper convective part of high
eruption columns and provide information on fine ash only that ultimately constitute the distal
volcanic products (Marzanno et al., 2006a,b). Most of all, considering their real-time
capabilities, weather radar systems are devoted to the tracking of large ash clouds dispersal,
valuable for the risk mitigation related to air transport for instance. In addition, some weather
radars operate at small wavelength, lower than a centimetre (mm to X-band), and hence
serious difficulties arise for the detection and quantification of ash particles loading under
rainy conditions.
Volcanological Doppler radars
A major challenge is henceforth to measure physical parameters such as ash masses and
velocities closer to the vent in order to retrieve directly the true source parameters that permit
the understanding of the explosive dynamics.
In this aim, portable Doppler radar system has allowed a great step forward, providing
velocities and mass estimates of pyroclasts right above the crater. Particularly, VERDEMOS
(Hort and Seyfried, 1998; Seyfried and Hort, 1999) is a system constituted of a Doppler radar
operating with a frequency-modulated continuous wave (FMCW) and working at 1.24 cm
wavelength (Ku-band). Note that in this spectral region some difficulties related to the
detection of volcanic ash may arise under harsh rain condition. Such radar systems give a very
high velocity resolution (~0.2 m/s) but the location of the target is rendered much more
difficult. Hort et al. (2003) have provided at Stromboli from Doppler radar measurements
average velocities of 19 and 8 m/s for ascending and descending particles respectively, with a
maximum vertical velocity of 60–70 m/s. Under some assumptions based on the terminal
settling velocities of particles they obtain a mean particle size of 3 mm at Stromboli. Three
coupled FMCW radar were also used at Erebus volcano to determine the directivity of
Strombolian explosions (Gerst et al., 2008). Finally, another version of FMCW radar
operating at about 3 cm wavelength was used at Merapi volcano for active lava dome
monitoring (Voge and Hort, 2009).
34

Chapter I – Introduction to remote sensing techniques in volcanology
Besides, VOLDORAD is a Doppler radar exclusively devoted to the study of volcanic
activity. It operates with a pulsed wave at a 23.5 cm wavelength (L-band) that permits the
detection of fine ash under any weather conditions. The resolution (~0.9 m/s) and maximum
range (>1000 m/s) velocity of VOLDORAD is suitable, as well as the temporal resolution
(>10 Hz), for the detailed analysis of explosive activity. Dubosclard et al. (1999, 2004) have
provided initial particle velocities of 80–90 m/s and maximum particle radial velocity inside
the beam of about 60 m/s at Etna during the eruption of October, 1998. Donnadieu et al.,
(2003, 2005) obtained maximum radial particle velocities of 90 m/s and 110 m/s for the
eruption of July 13, and July 29, 2001 respectively. Gouhier and Donnadieu (2008) give mean
particle diameter ranging from 1.3 to 1.6 cm and ejecta mass estimate between 60–200 tons
for a typical Strombolian explosion at Etna during the eruption of July 4, 2001.
Portable ground-based Doppler radar techniques allow direct kinetic and loading
measurements on volcanic gas and/or particles immediately above the vent. Therefore, in
addition to their significant monitoring potential and early warnings, these radar systems
permit us to study, under any weather conditions, explosions of lesser intensity barely imaged
by satellites or weather radars, so as to retrieve physical source parameters.
35


CHAPTER II
VOLDORAD (Volcano Doppler Radar): technical
characteristics and theoretical considerations


Chapter II – VOLDORAD (Volcano Doppler Radar)
II.1. Presentation of VOLDORAD
We wanted to provide a chapter exclusively devoted to the thorough description of
VOLDORAD as it was extensively utilized for the study of this thesis. After a detailed
presentation of VOLDORAD and its derived parameters, we give some theoretical elements
related the Doppler radar method.
II.1.1. VOLDORAD technical characteristics
ANTENNA
RADAR
Figure II.1. Photograph of the sounding conditions during the radar acquisition campaign of July, 2001
at Mt. Etna SEC, and we provide close views of the 4-Yagi antenna array, and radar core.
VOLDORAD literally VOLcano DOppler RADar, belongs to the family of pulsed ground-
based Doppler radars, and was developed by the Observatoire de Physique du Globe de
Clermont-Ferrand (France), specifically for the remote sensing of volcanic jets and plumes. A
first prototype was successfully used at Etna during the eruption of October 1998 (Dubosclard
et al., 1999, 2004), operating at 1238 MHz (equivalent wavelength of 24.2 cm) with a high-
power transmitter up to 1 kW. The second version of VOLDORAD, more compact, was used
at Etna during the eruption of the Southeast crater (SEC) on July 4, 7, and 13, 2001 and at the
Laghetto cone on July 29 and 31, 2001 (Figure II.1). This version works with a low-power
transmitter (60W), and an array of 4 Yagi antenna with a beamwidth α = 9° for a total weight
of about 70 kg. These improvements permit the radar to be set up easily in the field with a
four-wheel-drive and supplied by an electric generator. The VOLDORAD antenna radiation
39

Chapter II – VOLDORAD (Volcano Doppler Radar)
pattern, like typical Doppler radar, is not focussed such as a laser, but comprises a main lobe
surrounded by several side lobes. The aperture angle is defined at -3 dB beamwidth of the
main lobe (Figure II.2). However, side lobes may reach the slopes of the crater and hence be
responsible for ground clutter echoes, readily eliminated with basic treatments.
Figure II.2. Sketch of a typical radar beam pattern showing the multiple lobes, and the beam aperture
angle (α=9°) as calculated from the beamwidth of the main lobe at -3dB of P0.
VOLDORAD is designed to monitor all types of explosive volcanic activity of variable
magnitude. It operates at a medium distance range (0.2 – 12 km), at a wavelength (λ) of
23.5 cm (equivalent frequency of 1274 MHz), and with a high sampling rate ≥10 Hz, which
permit the sounding under any weather conditions and the detailed analysis of early eruptive
processes. Note that the intensity of the scattered signal is a strong function of the particle size
and can be separated into three regions of strictly different behaviour, depending on the
relation of particle diameter (D) and the wavelength (λ) of the transmitted wave. In many
cases the power of the scattered signal (P) is proportional to the number of particles in the
volume, where scattering takes place. For D>>λ, the theory of geometrical optics is
applicable, and the scattered power P is proportional to the square of the particle diameter (P
∝ D2). The range D ≈ λ is called the Mie region after the first theoretical approach to the
complete scattering theory by Mie (1908). Here the scattered power P becomes a function of
the transmitted frequency and the location around the particle (see Appendix B for more
details). Rayleigh scattering takes place for D<<λ with the scattered power being proportional
40

Chapter II – VOLDORAD (Volcano Doppler Radar)
to the sixth power of the particle diameter (P ∝ D6). Bearing in mind the large wavelength
used by VOLDORAD (23.5 cm), we show that for volcanic ejecta size in the millimetre
range, mostly Rayleigh scattering occurs, and beyond a particle diameter threshold found to
be around 6 cm, Mie scattering starts to become dominant (Gouhier and Donnadieu, 2006).
Considering the wide range of particle sizes for Strombolian explosions exceeding the
diameter threshold by far, the Mie scattering formulation is required for any modelling of the
scattering field. Note that for smaller wavelengths, as it is the case for most of Doppler radars
used for volcanological applications, the Rayleigh approximation validity limit arises at even
lower diameter threshold.
Figure II.3. Sketch showing the principle of emission/reception of an electromagnetic (EM) signal by a
Doppler radar, and used for the characterization of the range resolution of the sampling volumes
(range gates). The range resolution is directly defined by the pulse duration (PD) taken as τ = 0.8 µs at
Etna, and corresponds to half the travel distance of the transmitted wave through the pulse duration
cτ/2 = 120 m. Actually the radar is able to record the backscattered signal only during the receive time
interval PRI-PD, thus characterizing the minimum and maximum unambiguous distance range.
Pulsed Doppler radars also permit to define easily distinct sampling volumes (the so-called
range gates), which make possible the localization of the plume inside the beam. The range
resolution of successive sampling volumes can be determined directly from the pulse
duration (τ). At Etna, the pulse duration was taken as 0.8 µs, which corresponds to a radial
range resolution of 120 m, i.e., half of the travel distance of the transmitted wave through the
pulse duration (cτ/2), c being the celerity of light. The azimuthal and elevation range
resolution depends on the aperture of the antenna beam (α) and hence varies with the distance
41

Chapter II – VOLDORAD (Volcano Doppler Radar)
between the considered range gate and the antenna. At Etna, we defined a mean azimuthal
range resolution of about 165 m at 1 km. Likewise, we characterize a minimum and maximum
unambiguous range from the pulse duration (τ) and the pulse repetition interval (tr) taken as
100 µs at Etna of 120 m and 15 km respectively (Figure II.3).
The pulsed repetition interval (tr) and the number of coherent integrations (6 – 10) of radar
pulses in the time domain selected at Etna permit to define a maximum radial velocity range
of about 59 and 98 m/s from Vrad = λ/(4Nctr), with a radial velocity resolution of 1.8 m/s and
3 m/s respectively. The principal technical characteristics of VOLDORAD are summarized in
Table II.1.
Table. II.1. Technical characteristics of VOLDORAD version 2.
* Parameters set for the sounding at Etna SE crater on 4 July 2001.
Technical characteristics of VOLDORAD 2 Symbols Values Transmitted frequency (MHz) ft 1274 Wavelength (cm) λ 23.5 Peak power (W) Pt 60 Pulse repetition interval (µs) * tr 100 Pulse duration (µs) * τ 0.8 Radial range resolution (m) * L 120 Mean azimuthal/elevation range resolution (m) * H 165 Antenna beamwidth (°) α 9
II.1.2. VOLDORAD setting at Etna on July 4, 2001
VOLDORAD was set up at an altitude of about 3000 m, at a horizontal distance of 930 m to
the centre of the crater, 280 m below the summit of the SEC, and with an antenna elevation
angle θ = 23°. Moving particles were detected in successive range gates (G1 to G4)
corresponding to a slant distance of 807-1167 m to the radar antenna with a mean gate width
of 120 m and a gate height ranging from 127-184 m (Figure II.4). The centre of range gates
G1 and G2 are located at 78° and 34° respectively to the south of the vertical axis, whereas
range gate G3 and G4 are oriented at 23° and 43° respectively to the north of the vertical axis.
The centre of the range gate G3 is located at a horizontal distance of 54 m and an elevation of
127 m to the center of the crater. Note however that echo-power can be recorded as soon as
particles enter the range gate G3, i.e., about 40 m above the crater rims. In this configuration,
42

Chapter II – VOLDORAD (Volcano Doppler Radar)
most of the volcanic material ejected is recorded in the range gate G3. Geometrical parameters
of the ranges gates G1 to G4 are summarized in the table II.2.
NS
1000 m
RADAR
~ 1000 m
Figure II.4. Sketch of the radar sounding geometry used for the acquisition campaign on Mt. Etna,
4 July, 2001.VOLDORAD was set up at an altitude of 3000 m, at a horizontal distance of 930 m to
crater rim, 280 m below the summit of the SE crater, and with an elevation angle of 23°. Note that
range G3 is centred above the vent and provides most of the echo-power. We also provide a map
the summit craters area during the July-August eruption showing the location of VOLDORAD.
Table II.2. Gate-centre coordinates (G1 to G4) for an antenna beam elevation angle of 23°. Antenna beam elevation (θ =23°) G1 G2 G3Gate angle to the vertical (°) 78 34 -23 Slanting distance to the radar (m) 807 927 1047 11Horizontal distance to the crater (m) -166 -56 54 1Elevation above crater rim (m) 33 80 127 1Gate height (m) 127 146 165 1
43
on
the
the
of
G4-4367657484

Chapter II – VOLDORAD (Volcano Doppler Radar)
II.2. VOLDORAD parameters acquisition
II.2.1. Radar power and velocity
II.2.1.1. Recorded power
VOLDORAD is a Doppler radar, it means that it is able to record both the backscattered
power and radial velocity of particles crossing the antenna beam axis, and sampled in
successive range gates. The echo-power received to the radar is a complex function depending
on the characteristic of the radar utilized (Cr), the physical properties (number, sizes shape,
composition, etc.) of the targets (η), the distance (r) and attenuation (L) of the medium
between the radar and the target (see section II.3 for more details).
22
rLCP rr
η= (II.1)
For convenience, the radar reflectivity factor is often employed because it is a quantity
characteristic of the targets only and hence permits the comparison measurements carried out
by different radars with different characteristics.
1825
4
10K
Zπηλ
= (II.2)
The reflectivity factor Z is often expressed in logarithmic units as dBZ. For instance, we have
found for 2 distinct typical Strombolian explosions at Etna, a reflectivity factor ranging from
85 – 94 dBZ. As a comparison, very harsh rain gives a maximum reflectivity of ~60 dBZ.
II.2.1.2. Recorded velocity
Doppler radars work by using the so called Doppler Effect, this physical phenomenon was
discovered by Christian Doppler in 1842 from a study based on acoustic wave. The Doppler
Effect (or Doppler shift) is the change in frequency of a wave received by an observer moving
relative to the emitting source of the waves (Figure II.5). Such a physical phenomenon meets
44

Chapter II – VOLDORAD (Volcano Doppler Radar)
fundamental applications in the domain of sound waves as well as in the domain of
electromagnetic waves. The best illustration of both applications are first the variation of the
pitch commonly heard when an object emitting sound is moving, such as the horn of
firetrucks, and then the variation of colour when an object emitted light is moving such as
stars (this example is often cited as evidence for an expanding universe).
Figure II.5. Sketch showing the Doppler Effect principle: when a target moves away from the
observer, wavelength of the emitted wave is increased, leading to lower pitch of the sound and red-
shift of the light from the observer. At the opposite, when the target draws closer to the observer, the
emitted wavelength is reduced, leading to higher pitch of the sound and blue-shift of the light from the
observer position.
For volcanic application, when ejecta cross the radar beam, it generates radar echoes
backscattered to the receiver with a frequency shift between the transmitted and the received
signal that is related to the particle velocity along the beam axis. Therefore, the radial velocity
(Vr) of a moving target can be determined from the Doppler frequency (fd) and the wavelength
of the transmitted wave as:
(II.3) 2λd
rf−
V =
When the target moves away from the radar (Vr>0), the Doppler shift is negative. It is the
opposite when the target draws closer (see section II.3 for more details).
45

Chapter II – VOLDORAD (Volcano Doppler Radar)
II.2.2. Calculation of the spectral moments
II.2.2.1. Doppler spectra
Finally, echo-power data acquired from successive range gates are displayed in real time as
Doppler spectra representing the power spectral density (y-axis) as a function of the radial
velocity (x-axis) at every moment. We show in Figure II.6, an example of Doppler spectra
recorded by VOLDORAD, as displayed in real time in the field for a Strombolian explosion,
occurring at 2135:35 UT in July 4, 2001 at Etna SEC. Six successive range gates are reported
here ranging from 567 to 1167 m.
Most of the signal is centred on the range gate at 1047 m (i.e., G3), taking a maximum power
value close to -80 dBW. The range gate G3 is located right above the Southeast crater and
present both positive (ascending particles) and negative (ascending and descending particles)
radial velocities.
Gate : 567 m Gate : 687 m
Gate : 1167 m Gate : 1047 m
Gate : 927 m Gate : 807 m
Figure II.6. VOLDORAD Doppler spectra occurring at 2135:35 UT on July 4, 2001 at Etna SEC, as
displayed in real-time during the radar sounding. Each spectrum corresponds to the power
backscattered by particles crossing the several successive sampling volumes of the antenna beam
(so-called range gates), 120-m wide, ranging from 567 to 1167 m from the radar location.
46

Chapter II – VOLDORAD (Volcano Doppler Radar)
From the processing of the series of Doppler spectra in the range gates above the crater and on
either side of the jet axis, times series can be computed for three sets of positive (indexed +)
and negative (indexed -) parameters corresponding theoretically to ascending and descending
ejecta respectively (Figure II.7).
Figure II.7. Sketch of a typical volcano Doppler spectrum showing the spectral moments (power,
maximum and mean radial velocity, and spectral width) as calculated from the power spectral density.
They are indexed (+) and (-) for ejecta with the radial component of their velocity vector moving away
and towards the antenna respectively, except for the spectral width that represents the standard
deviation of the whole spectrum.
Firstly we characterize the maximum radial velocities where the power spectral density is
equal to the background noise level. Therefore, we can define the spectral moment of order 0
that corresponds to the power backscattered by particles moving toward (P-) or away (P+)
from the radar within the sampling volume. The backscattered power is derived from the
integral of the power spectral density S(v) over the range of radial velocity intervals dv, i.e.,
from 0 to for ascending particles and from to 0 for descending particles: +maxV −
maxV
( )∫+
=+max
0
V
dvvSP and (II.4) ( )∫−
=−0
maxV
dvvSP
47

Chapter II – VOLDORAD (Volcano Doppler Radar)
Secondly, we define the spectral moment of first order that corresponds to the mean velocity
weighted by the power spectral density over the positive or negative velocity range. ±meanV
( )+
+∫+
=P
dvvvSV
V
mean
max
0 and
( )
−−
∫−
=P
dvvvS
V Vmean
0
max (II.5)
Finally, we define the spectral moment of second order that represents the spectral width of
the Doppler spectrum from to , which can be described as the variance of the
spectral distribution:
−maxV +
maxV
( ) ( )∫+
−
±−=max
max
22V
Vmean dvvSVvσ (II.6)
Originally, the spectral moments were characterised from weather-radar Doppler spectra. In
meteorological applications, in particular, the backscattered power parameter provides an
estimate of the amount of water droplet, which is related to the precipitation rate. The mean
velocity parameter gives the average velocity of sinking water droplets, and the spectral width
parameter is commonly used to assess the turbulence of the air, related for example to shear
stresses caused by the wind. However, the study of Strombolian volcanic activity is far
different and more localized, so that the interpretation of the spectral moments has to be
considered cautiously, taking into account the radar sounding conditions, along with the
complex kinematics and the wide range of volcanic particles sizes.
II.2.2.2. Time series
We show in Figure II.8 time series of the maximum radial velocity ( ) and the total power
derived from the processing of the Doppler spectra during the eruptive episode of July 4, 2001
at Etna SEC. The total power is simply the sum of P
+maxV
- and P+ over the whole range gates, and
is calculated from the range gate G+maxV 3 (1047 m). Time series have been calculated at a
sampling rate of about 1 Hz and displayed with a 10-s running average. Both parameters show
48

Chapter II – VOLDORAD (Volcano Doppler Radar)
the long range evolution of the eruption velocity and power, with alternating periods of
quiescence and periods of intense activity.
Figure II.8. Time series of the maximum radial velocity in gate G3 (1047 m) and the total power
integrated over the whole range gate during the eruption of July 4, 2001 at Etna SEC.
II.3. Doppler radar: theoretical considerations
II.3.1. Formulation of the radar equation
The radar equation expresses the relationship between the average power of the received
signal and the properties of the scattering targets inside the sampling volume located at range
r, as a function of the technical characteristics of the radar and the conditions of propagation
between the radar and the target. We commonly assume that the target radiates isotropically
the intercepted radar power, and hence can be characterized by its backscattering cross section
σ. Note that the value of σ is different from the geometric cross section of the target, and
depends on many factors: shape and dimension of the target, orientation, dielectric factor and
conductivity of the material. If the target (σ) is in direction (θ,φ), at a distance r, the power
flux density returned by the target and arriving at the reception antenna is (Sauvageot, 1992):
49

Chapter II – VOLDORAD (Volcano Doppler Radar)
( )( )22
220
4
,
r
LfPtGS n
rπ
σφθ= (II.7)
where Pt is the transmitted power, G0 is the antenna gain and L being the attenuation on the
radar-target path. fn is the function that represents the power distribution in the main lobe
(Figure II.2). The power of the echo collected by the antenna with effective aperture Ae is
Pr=AeSr. Therefore, for a monostatic radar (i.e., the same antenna is used for emission and
reception) the received power scattered by a single target is:
( )( ) 4
23
2220
4,
rL
LfGPP rnt
rσ
π
λφθ⎟⎟
⎠
⎞
⎜⎜
⎝
⎛= (II.8)
Where Lr is the attenuation due to the finite width of the pass band of the receiver, and λ is the
radar wavelength. For a “distributed target” (i.e., consisting of a large number of scatterers
simultaneously present in the same resolution volume V, randomly distributed and assumed
homogeneous), the radar backscattering cross section is simply the summation made over the
entire resolution volume as:
∑ ∑ =⎟⎠
⎞⎜⎝
⎛=
V Vii VVV ησσ / (II.9)
The quantity η is the average cross section of the target per unit volume, called the radar
reflectivity and expressed in cm-1. Using Equation II.8 for a distributed target we obtain:
( )( )∫⎟⎟⎠
⎞⎜⎜⎝
⎛=
V
nrtr dV
rfLLGP
P 4
2
3
2220 ,4
φθ
πηλ (II.10)
In most cases we can assume that the distribution in the main lobe can be conveniently
represented by a Gaussian function of the form:
( )⎥⎥⎦
⎤
⎢⎢⎣
⎡⎟⎟⎠
⎞⎜⎜⎝
⎛+−= 2
2
2
22
22exp,
φθ σφ
σθφθnf (II.11)
50

Chapter II – VOLDORAD (Volcano Doppler Radar)
where σθ and φθ are the standard deviations of the distribution. Under these conditions and
neglecting side lobes we finally obtain:
( )2ln8
, 044 φπθφθ =Ω∫
Ω
df (II.12)
where θ0 and φ0 are the -3dB beamwidth, ln2 is the natural logarithm of 2, and dΩ is the
element of solid angle of the antenna beam. When r is large compared to the resolution
volume cτ/2, we finally obtain:
( )( ) 2
2300
220
4 rL
LcGPP rt
rη
πτφθλ
⎟⎟⎠
⎞⎜⎜⎝
⎛= (II.13)
That is,
22
rLCP rr
η= (II.14)
This form is convenient because it permits to identify easily each contributor to the received
echo-power: Cr is the constant related to technical characteristics of the radar, L is related to
the attenuation of the medium, η is characteristic to the properties of the scatterers and r is the
distance between the radar and the targets.
II.3.2. Calculation of the radial velocity
Therefore, the Doppler Effect has been advantageously used by remote sensing techniques for
the study of natural processes dynamics as volcanoes are. The transmitted pulse from the
Doppler radar consists of a few thousands of oscillations with a frequency f0, with a peak
power reaching about 60W. The wave emitted by the antenna can be described as:
(II.15) tAtS t 0cos)( ω=
51

Chapter II – VOLDORAD (Volcano Doppler Radar)
Where At is the amplitude, and ω0 = 2πf0 is the angular frequency and t is the time. For a
point target at distance r, the instantaneous voltage of signal received by the radar can be
written as:
[ ])(cos)( 0 ttate ϕω += (II.16)
a is the amplitude and ϕ(t)=2π(2r/λ) is the phase. For a monostatic radar (i.e., the same
antenna is used for emission and reception of the signal) with a wavelength λ observing a
point target at range r, the signal from the scattered field received by the antenna is a pulse of
duration τ represented by equation (II.16). The phase of the received signal is then:
(II.17) λπϕ )(4)( trt −=
Volcanic ejecta are moving targets, and hence cross the antenna beam generating radar echoes
backscattered to the receiver with an angular frequency shift (dϕ/dt) due to the Doppler Effect
between the transmitted and received signal, that is related to the particle velocity along the
beam axis.
(II.18)
rVdr
dtdtd
λπ
λπϕ 44
−=−=
When the target moves away from the radar (Vr>0), the Doppler shift (dϕ/dt) is negative. It is
the opposite when the target draws closer. We can write:
(II.19) d
It leads to the well-known relation between the Doppler frequency (fd) and the radial velocity
(Vr) of the considered target:
(II.20)
d πfdtd ωϕ 2= =
λr
dVf 2−
=
52

Chapter II – VOLDORAD (Volcano Doppler Radar)
II.3.3. Calculation of the power spectral density
The In-phase component I(t) and the quadrature phase component Q(t) of the received signal
may be represented by the real and imaginary parts of the complex amplitude:
(II.21) ( ) ti deAty ω0=
with I(t) and Q(t) respectively:
( ) ( )tAtI dωcos0= (II.22) ( ) ( )tA
tQ dωsin0=
The power spectral density S(f) can then be obtained from the complex autocorrelation
function R(τ) of the complex amplitude of the signal arriving from a specific range and is
defined by:
(II.23)
( ) ( ) ( )∫−
∗
∞→+=
2/
2/
1limT
TTy dttyty
TR ττ
where τ is the autocorrelation interval and y* is the complex conjugate quantity. S(f) is the
Fourier transform of R(τ):
(II.24)
( ) ( )∫
∞
∞−
−= ττ ωτ deRfS i
Note that in the case of a finite-energy signal, the Fourier transform of the autocorrelation
function is equal to the squared Fourier transform of the complex amplitude.
(II.25)
( ) ( ) ( ) ( )∫ ∫ ∫
∞
∞−
∞
∞−
∞
∞−
−−∗ =+=2
dtetydtdetytyfS tij ωωτ ττ
Note that the radial velocity corresponds to the Doppler frequency via the Equation II.20 and
leads to the following equivalence:
( ) ( )dvvSdffS ⇔ (II.26)
53


FIRST PART
DOPPLER RADAR STUDY


Résumé – Première partie
RÉSUMÉ : PREMIÈRE PARTIE Les explosions volcaniques constituent une source importante d’informations utiles à la
compréhension de la dynamique éruptive. Compte tenu de la dangerosité des phénomènes
éruptifs explosifs, ainsi que de la difficulté d’accès pour réaliser des mesures in situ, les
méthodes de sondage à distance ce sont avérées êtres des outils indispensables à l’étude et à la
surveillance des volcans actifs. Ainsi, depuis quelques dizaines d’années l’émergence de
nouvelles technologies a permis de faire un vrai pas en avant quant à la compréhension des
mécanismes qui contrôlent les éruptions volcaniques.
Dans cette thèse, et plus particulièrement dans la première partie du manuscrit, nous nous
sommes intéressés à l’étude de l’activité volcanique de type Strombolien par le biais de la
télédétection. De nombreux travaux concernant la détection des cendres et du gaz volcaniques
ont été réalisés, à partir notamment de mesures satellites et provenant de radar
météorologiques. Cependant, à cause notamment de la faible résolution spatiale de ces
techniques, et compte-tenu de leur distance à la cible, ces méthodes ne permettent pas l’accès
aux informations proches de la source d’émission, et ne peuvent donc pas apporter de
contraintes solides sur les processus éruptifs précoces (vitesse de gaz et de particules avant le
régime thermique, distribution de taille des particules avant ségrégation par sédimentation au
sein du panache, etc.). Un des enjeux majeur actuel est de mesurer les paramètres physiques à
la source d’émission (i.e., au niveau de l’évent).
Ainsi, nous avons utilisé un radar Doppler pulsé et portable, appelé VOLDORAD (Volcano
Doppler Radar), pendant l’éruption du 4 juillet 2001 au cratère Sud-Est de l’Etna (SEC). Cet
instrument a été développé par l’Observatoire de Physique du Globe de Clermont-Ferrand
(France), exclusivement pour le sondage des jets et des panaches volcaniques. Ce système
transportable permet d’effectuer des sondages au sein même du panache éruptif, juste au-
dessus du cratère, permettant ainsi l’estimation quantitative de paramètres physiques sources.
La technologie radar Doppler permet : (1) la détection des paramètres de vitesse et de charge
de la cible (ex. panache volcanique constitué de gaz et de pyroclastes) et (2) la localisation de
la cible.
57

Résumé – Première partie
L’objectif de cette première partie est donc de caractériser de manière quantitative la vitesse
et la masse des différents composants (gaz et pyroclasts) d’un jet Strombolien, et d’obtenir
des informations sur la géométrie du jet (angle d’éjection, isotropie, etc.). L’estimation
quantitative de ces paramètres sources est cruciale pour améliorer notre connaissance des
phénomènes éruptifs.
Dans le chapitre 3, on s’attache plus particulièrement à l’estimation des vitesses de gaz et de
particules éjectés. Pour réaliser ce travail, nous avons choisi une approche multi-méthode.
Tout d’abord nous avons exploité des images provenant de vidéos enregistrées simultanément
au radar. Bien que des problèmes subsistent quant à l’exploitation de la vidéo, cette méthode
permet malgré tout de calculer des vitesses de gaz et de particules que l’on peut ensuite
comparer avec les vitesses radar. Cette approche nous a permis, notamment, de définir plus
précisément les biais géométriques reliés aux mesures radar, et nous a aidé à faire la
discrimination entre vitesses de gaz et vitesses de particules. Ensuite, nous avons utilisé une
approche couplée, avec les données de vitesses radar et des données synthétiques de vitesses
calculées à partir d’un modèle balistique. Cette approche nous a permis de remonter à des
estimations minimum de vitesses initiales de gaz (c.à.d. au niveau de l’évent), à partir du
paramètre radar V+max. On obtient, sur une moyenne de plus de 150 explosions analysées
pendant le paroxysme du 4 juillet, une vitesse initiale de gaz minimum de 144 m/s. De même,
nous donnons une estimation de la vitesse moyenne initiale des particules de 67 m/s, pour un
diamètre moyen de 0.26 m. A partir de la vitesse initiale de gaz, nous pouvons donner une
estimation des flux massiques et volumiques de gaz. On obtient un flux volumique de
= 6.03x10gQ 3 m3/s et un flux massique de Mg = 2.4x10³ Kg/s, moyennés sur une séquence de
17 minutes se déroulant pendant le paroxysme du l’éruption du cratère Sud-Est de l’Etna le
4 Juillet 2001, entre 21h29 UT et 21h46 UT.
Dans le chapitre 4, nous présentons une méthode dédiée à l’estimation des paramètres de
charge du jet volcanique (masse, nombre, volume et concentration des particules notamment)
par inversion des données de puissance du radar Doppler VOLDORAD. Dans l’algorithme
d’inversion, nous utilisons la formulation complète de la diffusion électromagnétique de Mie
(1908) par des cendres sphériques et homogènes pour calculer des puissances radar
rétrodiffusées synthétiques. Cette étude a été réalisée sur 2 explosions stromboliennes
typiques au cratère Sud-est de l’Etna le 4 juillet 2001. L’acquisition des paramètres de masse
58

Résumé – Première partie
et de vitesse nous a permis d’estimer d’autres paramètres directement reliés comme le flux de
masse, l’énergie cinétique et thermique des particules. Tout d’abord nous proposons un
modèle d’inversion basé sur une distribution de taille de particules dite « polydisperse »,
caractérisée par la fonction de Weibull. Le mode de cette distribution est calculé à partir de la
vitesse terminale de chute des particules que l’on peut obtenir directement sur les spectres
Doppler, pour chaque explosion. Ensuite, on a défini un facteur de forme de la distribution de
Weibull (k = 2.3) basé sur des données de la littérature pour des explosions Stromboliennes
typiques (Chouet et al., 1974). Le facteur de forme obtenu correspond à une distribution de
taille de particule de type log-normal, comme il est souvent observé à partir d’études de
dépôts Strombolien. Finalement, le modèle d’inversion polydisperse converge sur un facteur
d’ajustement de la fonction de Weibull, caractérisant le meilleur « fit » entre la puissance
synthétique et la puissance réelle, nous permettant ainsi de calculer les paramètres de charge.
D’autre part nous présentons un modèle alternatif basé sur une distribution de taille dite
« monodisperse », qui donne une estimation plus grossière des paramètres de charge mais
permet un calcul beaucoup plus rapide. Ce modèle pourrait donc être utilisé avantageusement
pour de la surveillance de l’activité volcanique en temps réel. Nous avons travaillé sur deux
explosions Stromboliennes, une diluée et l’autre beaucoup chargée. Nous obtenons, à partir du
model polydisperse, une estimation de masse totale de pyroclastes de 58 tonnes et 206 tonnes,
ce qui correspond à un volume équivalent de magma de 22 m3 et 76 m3 respectivement.
Enfin, dans le chapitre 5 on s’intéresse à la géométrie des explosions Stromboliennes. C’est
un domaine où les données sont plus rares, notamment parce que peu de méthodes sont
vraiment adaptées à ce type d’étude. Jusqu’à présent, la principale technique utilisée était
l’analyse photographique, cependant l’exploitation de cette méthode, bien que très précise, est
extrêmement longue et fastidieuse, ce qui empêche toute analyse statistique et altère donc la
représentativité des résultats. Dans cette étude, nous avons mis en évidence que la forme des
spectres Doppler était un fort indicateur de la géométrie des explosions. Ainsi, en réalisant un
modèle synthétique de spectre Doppler, nous avons pu contraindre la forme des spectres
enregistrés et donner une interprétation en terme géométrique. Les spectres Doppler sont
construits à partir du paramètre de puissance radar et de vitesse radiale. Ainsi, nous avons
utilisé les deux modèles présentés précédemment pour obtenir des puissances radar et des
vitesses radiales théoriques, afin de construire des spectres Doppler synthétiques.
59

Résumé – Première partie
Ainsi, nous avons testé notre méthode de caractérisation géométrique sur 2 cas particuliers et
montré l’existence de deux signatures spectrales distinctes : une signature spectrale dite « top-
hat », associée à l’éjection isotrope de particules, c'est-à-dire la même quantité de matière
dans un cône d’éjection considéré. Puis, nous avons mis en évidence une signature spectrale
dite « triangular », associée à une éjection anisotrope. A partir de là, nous avons réalisé une
étude statistique et quantitative sur plus de 200 explosions. Nous avons montré que la
distribution de matériel volcanique est isotrope dans un cône d’éjection de 30 – 40° de large
centré verticalement. Enfin, nous avons calculé sur plus de 200 explosions Stromboliennes
que 80 – 90% du matériel volcanique éjecté est concentré dans un cône d’émission de
30 – 40° de large centré verticalement.
60

CHAPTER III
Kinetic features of Strombolian jets: insight from
coupled Doppler radar and numerical modelling
approaches, and correlation with video data


Chapter III – Kinetic features of Strombolian jets
III.1. Introduction
Volcanic surface processes are, potentially, important sources of information for
understanding deep mechanisms at the origin of the dynamics of an eruption. The velocity of
gas and pyroclasts is a particularly important parameter as it betrays directly the physical
conditions under which Strombolian explosions occur. For evident safety reasons during field
work near a volcanic erupting vent, velocity measurements are generally restricted to passive
remote sensing methods such as photographic (Chouet et al., 1974; Blackburn et al., 1976;
Ripepe et al., 1993), video (Sparks and Wilson 1982; Neuberg et al., 1994; Ripepe et al.,
2001) or acoustic (Vergniolle et al., 1996; Ripepe et al., 1996) techniques. Recently, active
remote sensors based on the Doppler radar principle have been successfully operated at
Stromboli (Weill et al., 1992; Hort and Seyfried, 1998; Seyfried and Hort, 1999) and Mt. Etna
volcanoes (Dubosclard et al., 1999; Dubosclard et al., 2004). These techniques permit to
probe selectively inside a specific volume of the jet. Moreover they provide directly velocity
measurements with a high temporal resolution and a good spatial coverage. Nevertheless,
some difficulties remain about accurate measurements of velocities and particularly for the
discrimination of gas and clasts velocities. In this chapter, we aim at improving the
interpretation of Doppler radar (VOLDORAD) velocity measurements carried out at Etna
Southeast crater (SEC) on July 4, 2001. For this purpose, we use a multi-method approach:
first we exploit video measurements and then we use numerical modelling. Indeed, video
sequences have been recorded simultaneously to the Doppler radar sounding. In addition, the
video analysis portrays the surface activity and can hence be usefully compared to
VOLDORAD’s data to constrain velocity measurements from volcanic gas and clasts. Thus,
we first compare the maximum radial velocity ( ) as given by the Doppler radar, i.e.,
without any geometrical correction, with video-derived velocities. Then, we use and enhance
a ballistic numerical model originally developed by Dubosclard et al., (2004) in order to bring
more stringent constraints on the decoupling of the gas phase and pyroclasts velocities
considering the geometry of the sounding. Therefore, we are able to give a minimum estimate
of the initial gas velocity ( ), and we also provide the initial mean velocity (
+maxV
gV0pV0 ) of the
particles (i.e., the velocity of a particle with mean diameter ( D ).
63

Chapter III – Kinetic features of Strombolian jets
III.2. Insight from video analysis method
III.2.1. Lava-bubble vs. lava-jet explosions
We have worked on 18 explosions occurring on July 4, 2001 between 2130:00 UT and
2145:00 UT, which corresponds to the paroxysm of the eruption. We have distinguished two
types: (i) Lava-jets; which originate from a slug bursting beneath the crater rim (invisible on
video snapshot), and producing a discrete explosion with a quite narrow particle ejection
cone. (ii) Lava-bubbles; which originate from a slug bursting above the crater rim (visible on
video snapshot), and producing a discrete explosion with a rather hemispherical ejection cone.
Both types are related to the Strombolian activity as one discrete slug is at the origin of the
ejection of pyroclasts. However, some differences of shallow physical processes exist and
lead to these contrasted surface manifestations. We believe that the increase of the magma
level that may partly fill the crater cavity can lead to the growth of a large gas bubble raising
the overlying magmatic film that deforms and breaks subsequently into disconnected blocks
ejected in all directions by the overpressurized gas release.
~ 50 m
Etna SEC – July 4, 2001 Jet: 2141:56 UT
~ 50 m
Etna SEC – July 4, 2001 Bubble: 2142:32 UT
LAVA – BUBBLE TYPE LAVA – JET TYPE (a) (b)
Figure III.1. (a) Video snapshot of lava-jet type explosion occurring at 2141:56 UT during the July 4,
2001 eruption at Etna SEC. (b) Video snapshot of lava-bubble type explosion occurring at 2141:56 UT
during the July 4, 2001 eruption at Etna SEC.
Other parameters may also control the formation of lava-bubbles, such as the size and the gas
overpressurisation of the slug. The physical conditions under which such a lava-bubble may
form are difficult to meet and hence this type of explosions is scarce. Indeed, during the
considered period of time (~ 15 min) we have identified about 150 explosions and only 10 are
bubble-type. Therefore, jet-type explosions are statistically more representative of typical
64

Chapter III – Kinetic features of Strombolian jets
Strombolian activity in terms of geometry. We show on Figure III.1 a lava-jet explosion
occurring at 2141:56 UT, and a very large lava-bubble type explosion occurring at
2142:32 UT.
III.2.2. Video-derived gas measurements
Therefore we have measured, from video snapshots acquired simultaneously to the radar, the
cumulative distance covered by both (i) discrete solid blocks propelled upward and (ii) the
luminous front propagating in the surrounding air. We assume that the luminous front
represents the gas phase or at least fine particles such as ash, characterised by a very low
inertia and hence that move (accelerate/decelerate) as the gas phase does. Such video
measurements thus permit us to give a rough estimate of the gas velocity above the crater rim.
However, finest particles are quickly cooled down and may not be seen at night; hence the
real gas velocity might be slightly higher. The instantaneous velocity can finally be derived
from finite difference calculations (eq. III.1), with z being the distance between each front or
block displacement measured at each time step ∆t. Note that the video temporal resolution
permits a detailed analysis every 0.04 s.
tzz
dtdzV ii
∆−
== +1 (III.1)
Figure III.2a shows an example of luminous front (i.e., gas phase) velocities measured on one
Strombolian jet occurring at 2137:44 UT at Etna SEC. Practically, we have drawn the
contours of luminous front propagating through time that gives, via a scale factor, the distance
covered by the front at each time step. Some difficulties arise with this method, particularly
for the detection of the front boundary as it is often rendered hazy by the scattering of light in
the surrounding air. The pixel saturation of the video snapshot also makes difficult the
accurate determination of the propagating front position, but relative interspaces might give
satisfactory results. Moreover, the exploitation of a two-dimensional (2D) field of view may
also induce some biases on video measurements that can virtually reduce real particle
velocity, although we have tried to work on early trajectories, close to the vertical, so as to
reduce this effect. We provide (Figure III.2b) the cumulative distance covered by the
luminous front propagating upward and the corresponding time-derivative (dz/dt) that gives
the instantaneous velocity of the gas phase expansion at each time step. We observe a
65

Chapter III – Kinetic features of Strombolian jets
significant velocity decrease of the gas phase from 165 m/s right above the crater rim (z≈0) at
t0=0, until 75 m/s at about z≈110 m upright to the crater at tf=0.8 s. We obtain a time-average
gas velocity of 111 m/s for the Strombolian jet at 2137:44 UT.
(b)
Gas front contour
(a)
Figure III.2. (a) Video snapshot showing the expansion of the gas phase, with contours of each
luminous front drawn in dashed line. (b) Plot of video-derived measurements of the lava-jet explosion
occurring at 2137:44 UT on July 4, 2001 at Etna SEC, representing the cumulative distance covered
by each luminous front rising upright through time sampled every 0.04 s, and the corresponding time-
derivative that gives the instantaneous velocity of the gas at each time step.
III.2.3. Video-derived particles measurements
We show on Figure III.3a an example of displacement and velocity measurements on solid
blocks for the same Strombolian jet occurring at 2137:44 UT at Etna SEC. In this case, we
follow the trajectory of discrete particles travelling upward. Bearing in mind our objective to
compare video-derived velocities with maximum radar velocity ( ) we have selected the
fastest blocks trajectories. We provide (Figure III.3b) the cumulative distance covered by one
lava block ejected upward and the corresponding time-derivative (dz/dt) that gives the
instantaneous velocity of the particle at each time step. We observe a low velocity decrease of
the particle from 85 m/s at t
+maxV
0=0 (z≈30) until 58 m/s at about z≈120 m above the crater rim at
tf=1.12 s. Note that if we consider the potential bias related to the 2D field of view, then, the
velocity decrease could even be lower. Finally we obtain a time-averaged particle velocity of
66

Chapter III – Kinetic features of Strombolian jets
70 m/s for the Strombolian jet at 2137:44 UT. We were not able to achieve particle
displacement measurements right above the crater rim as the gas phase is too dense in the
very first tenths of meters, which impedes individual blocks to be visible below z=30 m. In
this example, the velocity of the gaseous front is much higher than that of particles, and we
observe that the velocity decrease of particles is much lower than that of the gas. Indeed, the
ratio between the first and the last gas velocity measurement is 165/75=2.2 over a distance of
90 m within 0.8 s against a ratio of 85/58=1.47 over the same distance of 90 m within 1.12 s
for the particle velocity measurements. This can be easily explained by the high inertia of
large particles, first propelled slower than fine ash by the gas phase, and then, not as much
slowed down by the gas velocity decrease.
(b)
Block trajectory
(a)
Figure III.3. (a) Video snapshot showing the trajectories of four large lava blocks ejected almost
vertically. (b) Plot of video-derived measurements of the lava-jet explosion occurring at 2137:44 UT on
July 4, 2001 at Etna SEC, representing the cumulative distance covered by a single lava block rising
through time, sampled every 0.04 s, and the corresponding time-derivative that gives the
instantaneous velocity of the particle at each time step.
Consequently, the maximum velocity recorded by the Doppler radar at a given elevation
above the emission source is related to the competition between both kinetic regimes. In order
to exemplify that issue, if we assume that measurements were carried out right above the
emission source (i.e., vent), the maximum velocity recorded would clearly be related to the
gas phase expansion. On the other hand, if measurements were carried out at a few hundreds
67

Chapter III – Kinetic features of Strombolian jets
of meters above the vent, the maximum velocity recorded would most likely be related to the
particle ejection. Actually, the competition between both regimes is a continuum and hence,
the maximum velocity recorded strongly depends on the size of particles and on the
measurement elevation. The same video measurements have been carried out on large lava-
bubble explosions. However, in this case the luminous front is related to the nose of the lava-
bubble before breaking, and hence, velocity measurements do not correspond to the gas
velocity, but rather to the expansion rate of the expanding slug at the magma-air interface
prior to bursting. Then, we will only provide instantaneous velocities of discrete lava blocks
propelled hemispherically after the bursting of the gas slug; these can be compared to radar
velocities. Note that during the considered period of time (~ 15 min) we have identified about
150 explosions and only 10 are bubble-type explosions. Therefore, jets-type explosions are
statistically more representative of typical Strombolian activity in terms of geometry. In the
next section, we attempt to give more constraints on the origin (particles or gas) and accuracy
of velocities measured by the Doppler radar VOLDORAD.
III.2.4. Radar/video correlations of particles velocities
Velocity measurements have been carried out on 8 lava-jet and 10 lava-bubble explosions
occurring on July 4, 2001 between 2130:00 UT and 2145:00 UT. Figure III.4 and Figure III.5
show the positive maximum radial velocities ( ) recorded by VOLDORAD that is
calculated as the right most abscissa of the Doppler spectrum for which the echo-power is
superior to the noise level. These maximum radar-derived velocities are then compared with:
(i) particles velocities ( ) inferred from video measurements for both lava-jet (Figure
III.4a) and lava-bubble (Figure III.4b) explosions, and then (ii) compared with gas velocities
( ) inferred from video measurements of lava-jets only (Figure III.5). In order to make
these comparisons as relevant as possible, all video-derived velocity values have been
selected at a same elevation of about z=100 m, which is moreover roughly consistent with the
radar measurements elevation. Note however that it is not a critical issue for particle
measurements in particular, because of their low velocity decrease in the first hundred meters
(Figure III.3).
+maxV
pmzU 100≈
gmzU 100≈
68

Chapter III – Kinetic features of Strombolian jets
III.2.4.1. Lava-jet explosions
We obtain, as shown in Figure III.4a, a positive maximum radial velocity =56 m/s and a
particle velocity, at an elevation of 100 m, of =60 m/s averaged on the 8 lava-jet
explosions. We observe that radar-derived and video-derived mean velocity values are very
similar, which may suggest that measurements are consistent with particles velocities.
However, by examining in detail each explosion individually, we point out some significant
discrepancies between radar-derived and video-derived velocities. We also stress the variation
of velocities of the radar and video measurement series themselves.
+maxV
pmzU 100≈
+maxV
Firstly, for lava-jet explosions (Figure III.4a), we show a large dispersion of values with
a standard deviation of 13.9 m/s (i.e., 25%). The dispersion of Doppler radar measurements
could simply be related to the natural variation of particles or gas velocities between each
explosion; however, other reasons can also be invoked.
+maxV
(1) Radar data have been acquired with a velocity range up to 60 m/s, although faster particle
velocities can nevertheless be recovered if the radar signal is not too much deformed by
aliasing. Indeed, in some cases Doppler spectra are too distorted for the automatic processing
to retrieve correct values, and velocity measurements can hence be biased. However, for the
velocities given in this section, all measurements have been cautiously checked directly on
each Doppler spectrum and can be considered as correct.
(2) VOLDORAD records radial velocities, i.e., the component along the radar beam axis,
inclined at 23° from the horizontal. So, real velocities are potentially underestimated if the
particle trajectory is not parallel to the radar beam axis. In addition, the variability of particles
trajectories from one explosion to another may also account for the dispersion of radar-
derived measurements. The geometrical framework of the radar sounding has then to be
defined cautiously.
The dispersion of particles velocities derived from video measurements is far lower, with a
standard deviation of 5.9 m/s (i.e., only 10% of the mean value). Remind that we have
selected on video snapshots the fastest particles so as to make a comparison with maximum
velocities recorded by VOLDORAD.
Secondly, although the correlation between mean velocity values derived from video and
radar measurements are very good, we show that the difference of velocity (∆V) between
69

Chapter III – Kinetic features of Strombolian jets
individual explosions can reach a maximum close to |∆V|=30 m/s for explosion at 2137:36
UT, whereas explosion at 2136:21 UT gives very similar values with |∆V|=1.6 m/s. Note that
∆V takes alternatively positive ( > ) and negative values ( < ). By using
the root mean square coefficient (RMS), we obtain a mean velocity difference between radar
and video measurements on 8 lava-jet explosions of ∆V
+maxV p
mzU 100≈+
maxV pmzU 100≈
RMS=12.7 m/s. This disparity is not so
large bearing in mind that methodological approach of velocity retrieval is very different.
III.2.4.2. Lava-bubble explosions
Lava-bubble explosions are geometrically very different from lava-jet explosions as the gas
slug bursts above the crater rim and hence propels particles hemispherically with ejection
angles ranging from vertical to almost horizontal trajectories. This singular feature, if not
representative of the common Strombolian explosions encountered at Etna during the July 4,
2001 eruption, may nevertheless be used advantageously to point out some crucial evidence.
Very comparable mean values are found for lava-bubble explosions (Figure III.4b) with
values of =55 m/s and =59 m/s averaged on 10 events. Once again, this similarity
may suggest that measurements are consistent with particles velocities.
+maxV p
mzU 100≈
+maxV
Note that mean velocity values are found to be equivalent for both lava-jet (Figure III.4a)
and lava-bubble (Figure III.4b) explosions, which stresses that an analogous physical
mechanism of particle ejection is at work. Indeed, we think that for both type of explosions,
the bursting of an overpressurized gas slug reaching the magma-air interface is at the origin of
the fragmentation and ejection of disconnected particles in the surrounding air. Obviously,
some differences still exist, such as the depth of bursting, the gas slug geometry and
overpressurisation, and probably the fragmentation. The latter seems (from visual
observations) to be less efficient in the case of lava-bubble explosions generating larger
particles.
For lava-bubble explosions (Figure III.4b), the dispersion of values is found to be far
smaller than for lava-jet ones, with a standard deviation of 6.9 m/s (i.e., 12.5%). One of the
main obvious reasons that may explain this low dispersion lies on the trajectories of ejected
particles. Indeed, we have clearly observed from video snapshot analysis (Chapter V) that for
+maxV
70

Chapter III – Kinetic features of Strombolian jets
the case of lava-bubble explosions, particles are ejected hemispherically with quite
homogeneous velocities. Therefore, a significant amount of pyroclastic matter is always
ejected with an angle close to that of the radar beam axis, and hence gives a better estimate of
particle velocities because it is less biased by the geometrical effect.
On the other hand, the dispersion of particles velocities derived from video measurements is
also low with a standard deviation of 7 m/s (i.e., 12%), and close to that of lava-jet
explosions. It confirms the consistency and accuracy of video-derived measurements. Most
interestingly, the correlation of velocities derived from both radar and video measurements
between each individual explosion turns out to be also pretty good, with particularly, a mean
velocity difference of ∆VRMS =7.6 m/s.
Figure III.4. Plot of the particle velocity ( ) derived from video measurements carried out at an
elevation of about 100 m above the crater rim, and compared to maximum radial velocity ( )
recorded by VOLDORAD in the radar range G
pmzU 100≈
+maxV
3, for (a) lava-jet explosions and (b) lava-bubble
explosions.
We have shown that video-derived velocities are reliable, and give similar values for lava-jet
and lava-bubble explosions, with for both, a low standard deviation. On the other hand, we
have shown that radar-derived velocities are more variable, although in fairly good agreement
with video-derived velocity in average, and probably quite sensitive to the geometry of the
particle ejection. As a consequence, bearing in mind the very large number of lava-jet
explosions constituting the July-4 Strombolian activity, we assume that a geometrical
71

Chapter III – Kinetic features of Strombolian jets
correction must be taken into account on measurements. The results obtained in this
section suggest that radar measurements of maximum velocity ( ) are consistent with
velocities of lava blocks.
+maxV
+maxV
III.2.5. Radar/video correlations of gas velocities
The gas velocity can be roughly estimated from video measurements of the luminous front
propagating upward as explained previously (Section III.2.2). In this section, video-derived
gas velocities ( ), taken at an elevation of about 100 m above the crater rim, are
compared with radar-derived velocities ( ). Although previous results have shown that
may be consistent with particles velocity, we investigate the possibility that fine ash,
roughly behaving like the gas phase, may be endowed of a higher velocity, and hence be
recorded as by VOLDORAD.
gmzU 100≈
+maxV
+maxV
+maxV
Figure III.5 gives a mean value of gas velocity derived from video measurements of
=72 m/s at an elevation of 100 m above the crater rim, and a maximum radial velocity
recorded by VOLDORAD of =56 m/s, averaged on 8 lava-jet explosions. These values
are relatively similar and point out that values may be consistent at first order with gas
velocities. Note however, bearing in mind the high decrease of gas velocity, that the elevation
chosen (z=100) for video-derived gas measurement can be critical for the comparison of both
methods. Accordingly, the dispersion of video-derived gas measurements is higher than for
particles, reaching a standard deviation of 16.5 m/s (i.e., 21%). This larger dispersion has also
to be attributed to the technical difficulties to make accurate measurements on the luminous
front of video snapshots. The dispersion of radar-derived measurements is also quite large
with a standard deviation of 13.9 m/s (i.e., 25%), due to the possible geometrical and
technical biases mentioned previously.
gmzU 100≈
+maxV
+maxV
Consequently, the difference of velocity (∆V) between each individual explosion is also not
very good, with a maximum velocity difference that can reach |∆V|=40 m/s for explosion at
2137:36 UT, and a mean velocity difference averaged on 8 lava-jet explosions of
∆VRMS =27.8 m/s.
72

Chapter III – Kinetic features of Strombolian jets
This disparity is not so large bearing in mind the difficulties to measure gas velocity on video
snapshots. Moreover, note that velocities recorded by VOLDORAD, on lava-jet explosions
particularly, underestimate real velocity values owing to the possible geometrical bias. A
geometrical correction on would clearly make radar measurements closer to the gas
velocity video measurements. Moreover, some tests on the minimum detectable signal
threshold carried out according to the sounding characteristics at Mt. Etna clearly show that a
small amount of very fine ash (about 11 particles of 1 mm per m
+maxV
3) can be detected by
VOLDORAD.
Figure III.5. Plot of the gas velocity ( ) derived from video measurements carried out at an
elevation of about 100 m above the crater rim, and compared to maximum radial velocity ( )
recorded by VOLDORAD in the radar range G
gmzU 100≈
+maxV
3, for lava-jet explosions.
Finally, we have shown from radar and video correlations that maximum velocity
recorded by the Doppler radar may be in agreement with both particle and gas velocities,
although large individual discrepancies remain. The contribution of large particles and fine
ash in the velocity estimate is difficult to evaluate. Indeed, the velocity recorded at a given
elevation above the emission source is related to the competition between both kinetic
regimes, i.e., high-inertia regime represented by large particles, and low-inertia regime
+maxV
73

Chapter III – Kinetic features of Strombolian jets
represented by the gas phase or at least very fine ash. Considering the geometrical
characteristic of the sounding, we suspect that the distance between the emission source and
the radar range gate G3 corresponds to the limit between both kinetic regimes. In the next
section, we thus aim at giving some constraints on kinetic regimes at work.
III.3. Insight from numerical ballistic model
III.3.1. Ballistic model definition
The theoretical evolution of the gas velocity with height and the corresponding velocity
decrease of particles can be assessed from numerical modelling. The objective is to bring
additional constraints on both kinetic regimes, and give a better insight on the origin (particles
or gas) of the maximum velocities recorded by VOLDORAD. These kinetic features are
calculated by the numerical ballistic model, presented in appendix A, on the basis of
equations of motion, assuming that the two forces acting on each particle are the drag force,
and the gravitational force. We first define, particularly, the initial velocity of a particle with
diameter D (Steinberg and Babenko, 1978):
( ) DkVDV gp −= 00 (III.2)
where k is a constant, taken as 150 as inferred from previous studies (Chouet et al., 1974,
Ripepe et al., 1993), and then, the gas velocity is defined as a function of height (Blackburn et
al., 1976) by using:
( ) ⎟⎟⎠
⎞⎜⎜⎝
⎛ −=
ref
gg z
zVzV γexp0 (III.3)
where γ is a constant taken as 4.6 (Dubosclard et al., 2004) and zref is the height above the
vent such as ( ) grefg VzV 001.0= . The constant zref was chosen by Dubosclard et al., (2004) at
1200 m, but we show from video measurements (Figure III.6) that this value is too high for
the July-4 eruption at Mt. Etna. In the next section we thus try to better constrain this
constant.
74

Chapter III – Kinetic features of Strombolian jets
III.3.2. Parametric constraints
In order to better constrain the decrease coefficient (zref) of the gas velocity, we used the gas
velocity measurements inferred from direct video observations, extrapolated at the emission
source (i.e., at the vent level) at t0 =0 s and averaged on 8 lava-jet explosions (Figure III.6).
Then, we have searched out the best height reference coefficient (zref) such as equation III.3
fits at best the observed trend. We have found a best match for a coefficient zref=850 m. Note
that the constant γ is taken as 4.6, and cannot be constrained from our video measurements.
Some uncertainties on this constant may probably induce a small error on the velocity
decrease law.
Figure III.6. Time series of the gas velocity derived from luminous front measurements on video
snapshots averaged on 8 lava-jet explosions. The velocity decrease curve has been extrapolated at
the emission source level (t0). We give the best height reference coefficient zref=850 m such that
equation III.3 (Blackburn et al., 1976) fits at best the averaged video-derived trend.
III.3.3. Gas vs. particles velocities
By using the numerical ballistic model, we are able to describe the evolution of the gas
velocity with height and the corresponding velocity decrease of particles. We give on figure
III.7 the theoretical velocity decrease of a gas parcel from equation III.3 with an initial gas
75

Chapter III – Kinetic features of Strombolian jets
velocity =100 m/s, a constant γ=4.6 and a reference elevation zgV0 ref=850 m. The
corresponding velocities of particles for different sizes are then calculated by a fourth order
Runge-Kutta algorithm, until an elevation of z=180 m. Finally, we show for example that a
particle with diameter D=0.01m launched at about 85 m/s by a gas phase with initial velocity
of 100 m/s, becomes faster than the gas phase after about 40 m travelling upright. At the
opposite, a particle with diameter D=0.06 m propelled initially at about 66 m/s by a gas phase
with initial velocity of 100 m/s never becomes faster than the gas within about two hundreds
of meters above the vent. The bottom of the radar range gate G3 is located at about 75 m
upright to the vent of the SE crater, but we show hereinafter that the maximum radial
velocities ( ) recorded by VOLDORAD correspond to particle trajectories inclined at 55°,
that represents the boundary of the sampling volume. Therefore, it gives a slanting distance
between the radar range gate and the emission source of about 120 m. Under these conditions,
we show that maximum velocities recorded by VOLDORAD inside the range gate G
+maxV
3 are
related to particle with diameters inferior to 0.06 m.
Figure III.7. Plot of the evolution of the theoretical gas velocity with height, for an initial gas velocity of
100 m/s, a height reference coefficient zref=850 m, and a constant γ=4.6. We provide the
corresponding particle velocity for different particle sizes, calculated from a Runge-Kutta algorithm
developed in the ballistic model.
76

Chapter III – Kinetic features of Strombolian jets
This result points out that maximum velocities recorded by VOLDORAD are consistent with
small particles of a few centimetres or less, and hence that measurements can give a first
order estimate of the gas velocity at the elevation of the range gate G
+maxV
3. From this statement,
we will aim in the next section at estimating, particularly, the initial gas velocity, i.e., at the
vent, considering some geometrical corrections related to the sounding characteristics.
III.4. Source parameters retrieval method
In this section we present a method to retrieve initial kinetic parameters, such as the initial gas
velocity and the average initial particle velocity from radar data. We have shown previously
from coupled video and numerical analysis that the gas velocity can be assessed from direct
radar measurements of the maximum radial velocity ( ). On the other hand, we will define
the positive mean radial velocity ( ) that can be used advantageously for the estimation
of mean particle velocity with median diameter
+maxV
+meanV
D . We first apply the retrieval method
developed hereinafter on a single typical Strombolian explosion and then we extend this
method to long sequences of Strombolian activity.
III.4.1. Initial gas velocity retrieval
Maximum radial velocities ( ) recorded by VOLDORAD are related to small particles
possibly ranging from fine ash to particles of a few centimetres. We thus assume reasonably
that may represent a minimum estimate of the gas velocity at the range gate elevation. In
order to recover the initial gas velocity ( ) from measurements, the geometrical setting
of the radar sounding and the geometry of the SE crater must be known accurately (Figure
III.8.).
+maxV
+maxV
gV0+
maxV
VOLDORAD was located at a slanting distance of 1047 m to the centre of the range gate G3,
with a central antenna beam elevation of θ=23°. The centre of the considered range gate was
positioned at a distance of about LSA=150 m upright (ϕ=90°) to the vent. However,
VOLDORAD measures radial velocities on the component of the antenna beam axis,
therefore maximum radial velocities recorded by VOLDORAD corresponds to particles with
trajectories the most inclined. Considering the limited extent (120m-wide and 160m-height)
77

Chapter III – Kinetic features of Strombolian jets
of the range gate G3, we define a maximum inclination of ϕ=55° that corresponds to a
slanting distance of about LSB=120 m from the emission source to the bottom right corner of
the range gate G3. In these calculations, the depth of the crater was taken at about 50 m as
inferred from direct visual information (personal communication with Charles Rivière). Note,
that the antenna beam is conic, and having an aperture angle α=9°, the elevation of its bottom
part can be defined as θ-α/2=18.5°.
Figure III.8. Sketch of the geometrical setting for the radar sounding carried out at Etna SEC, on July
4, 2001. VOLDORAD was located at a slanting distance of 1047 m to the centre of the range gate G3,
with a central antenna beam elevation of θ=23°, and an aperture angle of α=9°. The distance between
the vent (S) and the centre of the radar range gate G3 (A) is estimated at about L[SA]=150 m with an
angle ϕ=90°. The distance between the vent (S) and the bottom right corner of the range gate G3 (B)
is estimated at about L[SB]=120 m for a maximum inclination of ϕ=55°.
Two corrections have to be applied on the maximum radial velocity ( ) recorded by
VOLDORAD to recover the initial gas velocity ( ): (i) The geometrical correction ( ),
related to the maximum inclination of the particle trajectory, can be expressed by a simple
trigonometric relation; and (ii) the elevation correction ( ) due to the slanting distance
+maxV
gV0 ϕC
LC
78

Chapter III – Kinetic features of Strombolian jets
between the source of gas emission and the gate corner can be inferred from a decrease
exponential law of the gas velocity as a function of height (Blackburn et al., 1976):
[ ])2(cos1
αθϕϕ −−=C and ⎟
⎟⎠
⎞⎜⎜⎝
⎛=
refL z
LC γexp (III.4)
Finally the initial gas velocity ( ) is simply the product of the maximum radial velocity
( ) with the two correction coefficients, and can be expressed as:
gV0
+maxV
( )( )( )2cos
expmaxmax0 αθϕ
γϕ −−
== ++ refL
g zLVCCVV (III.5)
Under the geometrical characteristics of the sounding at Etna SEC during the July-4 eruption
we define a slanting distance between the source of gas emission and the range gate corner of
L=120 m, for a maximum inclination ϕ=55°. The velocity decrease constants are taken as
γ=4.6 and zref=850 m, and the antenna beam elevation is θ =23° with an aperture angle α=9°.
Therefore we obtain a geometrical correction coefficient of =1.2 and an elevation
correction coefficient of =1.9.
°=55ϕC
mLC 120=
III.4.2. Initial particle velocity and mean diameter retrieval
In the previous section we used the maximum radial velocity ( ) recorded by
VOLDORAD to retrieve the initial gas velocity. is defined as the right most abscissa
(i.e., radial velocity) of Doppler spectra for which the power stands above the noise level
(Figure III.9). We have shown particularly, that the maximum radial velocity may correspond
both to the finest particles and to the most inclined trajectories crossing the bottom right
corner of the radar range gate G
+maxV
+maxV
3.
79

Chapter III – Kinetic features of Strombolian jets
Figure III.9. Sketch of a radar Doppler spectrum showing the positive maximum radial velocity ( )
recorded by VOLDORAD that corresponds to the right most radial velocity for which the power stands
above the noise level (dashed line). The positive mean velocity ( ) corresponds to the velocity
weighted by the power spectral density over the whole positive velocity range. In the geometric
configuration of the sounding carried out at Etna SEC in July 4, 2001, the positive index (+) is mainly
related to ascending particles in the range gate G
+maxV
+meanV
3 located above the crater.
Now, we use the positive mean velocity ( ) measured by VOLDORAD, that corresponds
to the mean velocity weighted by the power spectral density over the whole positive velocity
range (Figure III.9). As shown in chapter V, a volcanic Doppler spectrum can be characterised
completely using a particle size distribution (PSD), and an ejection angle distribution (EAD).
Firstly, may represent the mean velocity of all particles sizes, ranging from finest ash to
largest blocks, and can hence be defined as the velocity of particles with mean diameter
+meanV
+meanV
D .
Secondly, should take into account all ejection trajectories, integrated in the considered
sampling volume. However, on the basis of statistical analyses carried out on a large number
of typical Strombolian explosions in Chapter V, we assume reasonably that most of particles
are distributed symmetrically along the vertical axis within a narrow ejection cone. Therefore,
may correspond at first order to the velocity of particles with mean diameter
+meanV
+meanV D (i.e.,
monodisperse distribution) ejected mainly vertically (i.e., mono-angle distribution) at the
centre of the radar range gate G3.
80

Chapter III – Kinetic features of Strombolian jets
Since we know the value of initial gas velocity ( ), that is the driving force for particle
motion, we can estimate the mean initial particle velocity (
gV0
pV0 ) with diameter ( D ). However,
in this case we cannot give accurate analytical solution of the equations of motion and then
we need to employ the numerical approach based on the fourth order Runge-Kutta algorithm
described in the ballistic model (Appendix A). Practically, at the input to the model we have
to define (i) the initial gas velocity ( ), which varies between each explosion, (ii) the
distance between the emission source and the centre of the radar range gate G
gV0
3 (L=150 m) and
(iii) the angle of particles trajectories (ϕ=90°). Finally, the mean diameter ( D ) is a variable
parameter that is incremented in the recursive loop of the inversion procedure until the
synthetic mean velocity match the recorded mean velocity ( ). Eventually, we
obtain both the mean diameter (
syntmeanV + +
meanV
D ) and the mean initial particle velocity ( pV0 ).
III.5. A case study: explosion at 2141:56 UT
We worked on a single explosion occurring at 2141:56 UT during the paroxysm of the
eruption on July 4, 2001 at Etna SE Crater. This explosion is typically Strombolian; the
particle ejection is centred rather vertically, and the duration of particle emission lasts about
2 s. We have selected one Doppler spectrum corresponding to the range gate G3 that gives the
maximum radial velocity ( ) and the mean radial velocity ( ) at the onset of the
explosion (Figure III.10a). Note that both parameters can be acquired either visually from the
Doppler spectrum picture, or automatically from the computation of spectral moments. This
last option will advantageously be used for the processing of long sequences of Strombolian
explosions. As a comparison, we provide (Figure III.10b) a video snapshot of the explosion at
2141:56 UT, displayed at the maximum brightness intensity so as to show the magnitude of
the explosion.
+maxV +
meanV
81

Chapter III – Kinetic features of Strombolian jets
ETNA SEC – July 4, 2001 2141:56 UT
Figure III.10. (a) Plot of VOLDORAD Doppler spectrum recorded in the range gate G3 on July 4, 2001
at Etna SEC, at the onset of the explosion at 2141:56 UT. We give the maximum radial velocity ( )
and the mean radial velocity ( ). (b) Video snapshot of the explosion occurring at 2141:56 UT
displayed at the maximum brightness intensity.
+maxV
+meanV
III.5.1. Initial gas and particles velocities
The initial gas velocity ( ) is obtained directly from the analytical approach using the
maximum radial velocity ( =53.4 m/s) recorded by VOLDORAD on the explosion at
2141:56 UT, with the geometrical correction coefficient =1.2 and the elevation
correction coefficient =1.9.
gV0
+maxV
°=55ϕC
mLC 120=
=××= =°=+
mLg CCVV 12055max0 ϕ 122 m/s (III.6)
We give for the explosion at 2141:56 UT a minimum estimate of the initial gas velocity of
=122 m/s. Note that the gas velocity inside the sampling volume, at the elevation of the
bottom right corner of the range G
gV0
3 is equal to 64 m/s.
82

Chapter III – Kinetic features of Strombolian jets
The mean diameter ( D ) is obtained by best fit matching of the synthetic mean radial velocity
( ) with the recorded mean radial velocity ( ) using the ballistic numerical model.
The mean radial velocity recorded by VOLDORAD is found to be =14 m/s for the
explosion at 2141:56 UT, and assumed to be the velocity of particles with mean diameter
syntmeanV + +
meanV
+meanV
D at the centre of the radar range gate G3, about 150 m upright to the vent. We thus obtain a
mean diameter D =0.13 m with an initial mean particle velocity of pV0 =66 m/s. Note that the
mean particle velocity at the centre of the range gate G3 is found to be 36 m/s. Theses values
are summarized in table III.1.
Table III.1. Values of initial gas velocity ( ), average particle diameter (gV0 D ), and initial particle
velocity ( ), obtained for the explosion at 2141:56 UT on July 4, 2001 at Etna SEC. pV0
Gas velocity Mean diameter Particle velocity
°=55ϕC 1.2 ϕ (deg) 90 ϕ (deg) 90
mLC 120= 1.9 L (m) 150 L (m) 150 INPUT +
maxV (m/s) 53.4 +meanV (m/s) 14 +
meanV (m/s) 14
OUTPUT gV0 (m/s) 122 D (m) 0.13 pV0 (m/s) 66
Our values fall in the wide range of values given in the literature for Strombolian activity.
Chouet at al. (1974) gave estimations of gas velocity of about 94–112 m/s and mean particle
velocities of 15–26 m/s at Stromboli from photoballistic measurements on two explosions.
Steinberg and Babenko (1978) derived from calculations the gas velocity by using the
particles size distribution at Etna and Stromboli, giving values of about 95 m/s and 70 m/s
respectively. Ground deposits studies carried out at Etna Northeast Crater by McGetchin et
al., (1974) have given an estimate of particle diameters ranging from 0.1–0.3 m. They also
derived from calculations based on observed particle diameters a mean particle velocity of
about 51 m/s. Acoustic measurements realized at Etna SEC during the same period (July,
2001) have provided average particle diameters around 0.1 m (Vergniolle and Ripepe, 2008).
Note however that most of the velocity data given in the literature are not values taken at the
emission source and are therefore hardly comparable.
83

Chapter III – Kinetic features of Strombolian jets
III.5.2. Comparison of radar/video initial gas velocities
In the previous section we have tested our source parameters retrieval method on one
Strombolian explosion.
Now, we will calculate and compare the initial gas velocities retrieved from both radar and
video measurements for 8 lava-jet explosions. The initial gas velocity ( ) derived from
Doppler radar measurements is calculated as previously, by using the two correction
coefficients ( , ) applied on the maximum radial velocity ( ) recorded by
VOLDORAD. Note that the elevation correction coefficient ( ) is derived from the equation
of gas velocity decrease (eq. III.3), where the constant z
gV0
°=55ϕC mLC 120=+
maxV
LC
ref has been defined by best fit
matching of video-derived velocity measurements averaged on the 8 lava-jet explosions.
Therefore, the initial gas velocity derived from video analysis can be calculated by using the
same elevation correction coefficient ( ) but with the suitable distance between the vent and
video measurements elevation. In section III.1, gas velocities were given at an elevation of
about 100 m above the crater rim, whereas the vent is estimated at about 50 m beneath the
crater rim. Therefore we define an elevation correction coefficient of =2.2 for video-
derived measurements. Note that the geometrical correction is not needed since video
measurements were carried out directly according to the trajectory of the particle or gas
parcel.
LC
mLC 150=
We thus provide on figure III.11 the initial gas velocity ( ) inferred from radar
measurements with a mean value of 127 m/s and a standard deviation of 30 m/s (i.e., about
24% of the mean value). On the other hand, we give the initial gas velocity ( ) inferred
from video measurements, with a mean value of 143 m/s and a standard deviation of 33 m/s
(i.e., about 23% of the mean value). These values are relatively similar in average but have a
quite large dispersion. Indeed, individual explosions can have a large discrepancy, reaching a
maximum of about |∆V|=| - |=85 m/s for explosion at 21h37:36 UT. The mean
difference between both sets of data is given by the root mean square coefficient as
∆V
gV0
gU 0
gV0gU 0
RMS =50 m/s.
84

Chapter III – Kinetic features of Strombolian jets
Figure III.11. Plot of the initial gas velocity ( ) derived from video measurements carried out on 8
lava-jet explosions during the eruption of July 4, 2001 at Etna SEC, and compared to initial gas
velocity ( ) inferred from VOLDORAD measurements in the radar range G
gU 0
gV0 3.
This difference is relatively large and can be due to some errors on radar or video
measurements as mentioned previously in section III.1. Nevertheless, we can observe that
most of initial gas velocity ( ) estimates inferred from radar measurements are lower than
initial gas velocity derived from video measurements ( ). Indeed, the sum of the differences
∆V on 8 lava-jet explosions is strongly negative, reaching a value of -135 m/s. We suppose, in
spite of some technical errors on both measurements, that maximum velocities recorded by
VOLDORAD are rather related to very fine particles that move slower than the gas phase.
Therefore has to be regarded as minimum initial gas velocity estimates. Velocity data
inferred from radar and video measurements are summarized in Table III.2.
gV0
gU 0
gV0
85

Chapter III – Kinetic features of Strombolian jets
Table III.2. Summary of values inferred from radar and video measurements on 8 lava-jet explosions
occurring during the paroxysm of July 4, 2001 eruption at Etna SEC.
RADAR VIDEO LAVA-JET +
maxV (m/s) gV0 (m/s) pmzU 100≈ (m/s) g
mzU 100≈ (m/s) gU 0 (m/s)
2133:52 UT 46 104,9 62,5 67,2 134,3 2133:56 UT 79,6 181,5 56,7 55,8 111,6 2135:15 UT 55,2 125,9 68,3 74,7 149,5 2136:21 UT 53,4 121,8 55 98,6 197,3 2137:36 UT 38,6 88 66,6 87,8 175,7 2137:44 UT 51,5 117,4 58,3 75 150 2141:53 UT 49,7 113,3 50,8 66,9 133,8 2141:56 UT 70 159,6 58,3 47,3 94,6
Mean values 56 127 59 72 144
III.5.3. Gas velocity decrease: insight from radar and video methods
Figure III.12. Sketch showing the difference of radar and video field of view (F.O.V) during
measurements of gas velocities. Video-derived measurements have been carried out by following the
displacement of a single gas parcel moving upward and slowing with height: this approach is related to
the Lagrangian description. Radar-derived measurements of several successive bodies (gas parcels)
crossing a fixed sample volume at a given elevation: this approach is related to the Eulerian
description.
Radar and video methods of velocity data acquisition are quite different and may also
account, to some extent, for the discrepancy between both sets of data. Indeed, video
86
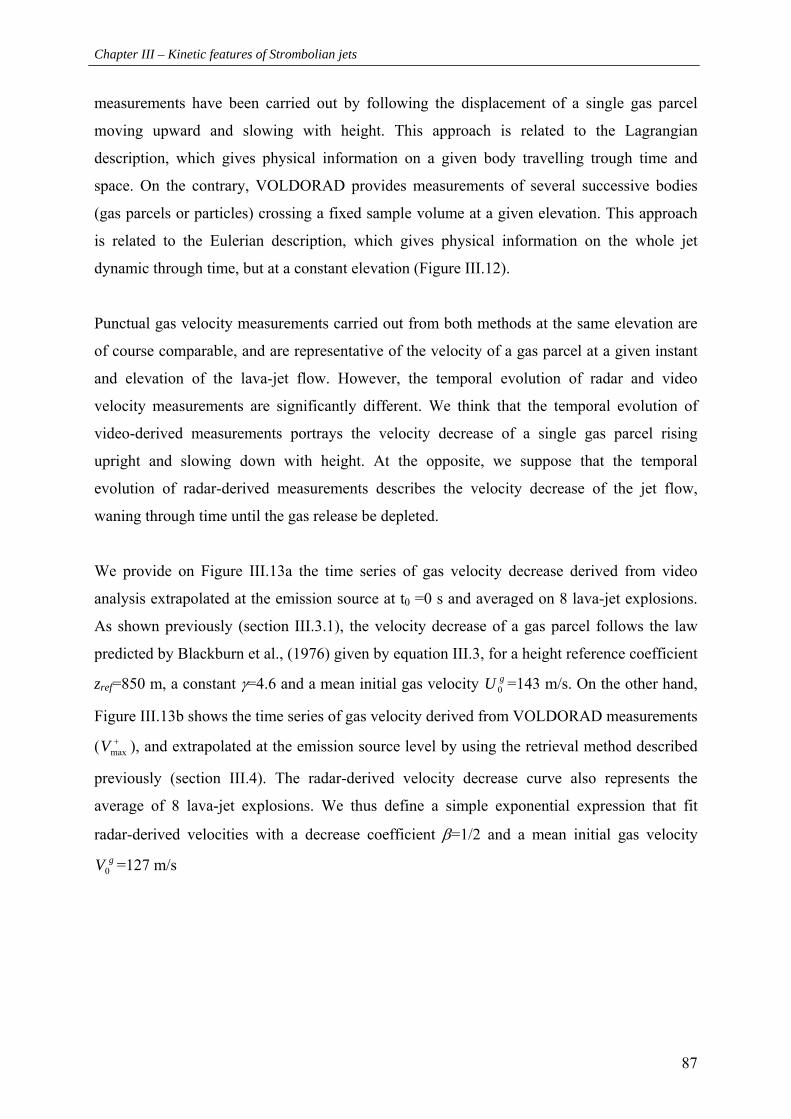
Chapter III – Kinetic features of Strombolian jets
measurements have been carried out by following the displacement of a single gas parcel
moving upward and slowing with height. This approach is related to the Lagrangian
description, which gives physical information on a given body travelling trough time and
space. On the contrary, VOLDORAD provides measurements of several successive bodies
(gas parcels or particles) crossing a fixed sample volume at a given elevation. This approach
is related to the Eulerian description, which gives physical information on the whole jet
dynamic through time, but at a constant elevation (Figure III.12).
Punctual gas velocity measurements carried out from both methods at the same elevation are
of course comparable, and are representative of the velocity of a gas parcel at a given instant
and elevation of the lava-jet flow. However, the temporal evolution of radar and video
velocity measurements are significantly different. We think that the temporal evolution of
video-derived measurements portrays the velocity decrease of a single gas parcel rising
upright and slowing down with height. At the opposite, we suppose that the temporal
evolution of radar-derived measurements describes the velocity decrease of the jet flow,
waning through time until the gas release be depleted.
We provide on Figure III.13a the time series of gas velocity decrease derived from video
analysis extrapolated at the emission source at t0 =0 s and averaged on 8 lava-jet explosions.
As shown previously (section III.3.1), the velocity decrease of a gas parcel follows the law
predicted by Blackburn et al., (1976) given by equation III.3, for a height reference coefficient
zref=850 m, a constant γ=4.6 and a mean initial gas velocity =143 m/s. On the other hand,
Figure III.13b shows the time series of gas velocity derived from VOLDORAD measurements
( ), and extrapolated at the emission source level by using the retrieval method described
previously (section III.4). The radar-derived velocity decrease curve also represents the
average of 8 lava-jet explosions. We thus define a simple exponential expression that fit
radar-derived velocities with a decrease coefficient β=1/2 and a mean initial gas velocity
=127 m/s
gU 0
+maxV
gV0
87

Chapter III – Kinetic features of Strombolian jets
(a) (b)
Figure III.13. (a) Time series of the gas velocity derived from luminous front measurements on video
snapshots averaged on 8 lava-jet explosions (see fig.III.6 for details). (b) Time series of the gas
velocity calculated from Doppler radar measurements averaged on 8 lava-jet explosions, and
extrapolated at the emission source level by using the retrieval method described previously
(section III.4)
In order to better compare both velocity decrease trends, we provide the slope of each curve
as they were straight-lines at first order. We obtain a slope of -70 m.s-2 for video-derived
values, and a slope of -50 m/s-2 for radar-derived values. Thus, we deduce that the velocity
decrease of a gas parcel slowing down with height (as portrayed by video-derived
measurements) is higher than the gas velocity decrease related to the lava-jet flux depletion at
the vent level, during about one second (as portrayed by radar-derived measurements).
However, bearing in mind possible technical errors inherent to radar and video measurements
and assumptions ventured in the source parameters retrieval model, this result has to be
regarded as preliminary work. We aim here at pointing out some important methodological
differences between radar and video, which may provide complementary information on the
lava-jet dynamics.
88
Chapter III – Kinetic features of Strombolian jets
III.6. Long sequence analysis of Strombolian activity
III.6.1. Doppler radar data
The thorough study of discrete isolated events is obviously fundamental to understand
shallow physical processes such as bubble bursting, magma drainage or gas release
mechanisms. However, the analysis of volcanic processes integrated on longer periods of time
is also essential to understand eruptive mechanisms occurring on larger time and space scales.
In this section we give a set of kinetic parameters, for a 17-min sequence of Strombolian
activity that occurs during the paroxysm of July-4 eruption from 2129:00 UT to 2146:00 UT
at Etna SEC. The activity at the SE crater was intense, consisting of a series of Strombolian
explosions occurring every 5 s in average. From the computation of the spectral moments
from Doppler radar measurements, we provide time series of the maximum radial velocity
( ) and the mean radial velocity ( ) in the range gate G+maxV +
meanV 3, at a sampling rate of about
2.5 Hz (Figure III.14).
(b) (a)
Figure III.14. Time series of (a) maximum radial velocities and (b) mean radial velocities, recorded by
VOLDORAD in the range gate G3, sampled at about 2.5Hz, during the paroxysm of July-4 eruption
from 2129:00 UT to 2146:00 UT.
89

Chapter III – Kinetic features of Strombolian jets
III.6.2. Kinetic parameters retrieval
Firstly, the initial gas velocity ( ) is calculated from the maximum radial velocity ( ) for
the whole sequence, applying the geometrical correction factor =1.2 and the elevation
correction factor =1.9. Importantly, in order to retrieve the initial gas velocity at the
onset of each discrete explosion, we only take into account the peak values. We obtain, for
157 explosions, a mean initial gas velocity of =144 m/s with a maximum value of 269 m/s
and a minimum of 79 m/s. The standard deviation of reaches 40 m /s, which represent a
dispersion of about 28% of the mean, value (Figure III.15a).
gV0+
maxV
°=55ϕC
mLC 120=
gV0
gV0
Secondly, we calculate the mean particle velocity from the mean radial velocity ( ) at
the elevation of the range gate centre by using the geometrical correction =2.56.
Similarly to the initial gas velocity calculation, we focus on peak values only. We find an
average value of the mean particle velocity at the centre of the range gate G
pGV
3
+meanV
°=90ϕC
3 of =41 m/s
with a maximum of 72 m/s and a minimum of 18 m/s. The standard deviation of reaches
11 m /s, which represents a dispersion of about 27% of the mean value (Figure III.15b).
pGV
3
pGV
3
The variability of both sets of data is relatively large; although geometrical or technical errors
may arise on radar-derived measurements, the statistical number of explosions analysed
should balance these effects. Therefore, we assume that most of the dispersion observed is
related to the natural variability of gas velocities.
Figure III.15 (a) Initial gas velocity calculated for 157 explosions at Etna SEC on July 4, 2001 between
2129:00 UT and 2146:00 UT. (b) Mean particle velocity at the centre of the radar range gate G3
calculated in the same conditions.
90

Chapter III – Kinetic features of Strombolian jets
In order to retrieve the mean diameter ( D ) and the initial mean particle velocity ( ) of each
discrete explosion, we would need to run an inversion on each explosion. Instead, we
calculate
pV0
D from time-average values of the initial gas velocity ( ) and mean particle
velocity at the range gate level ( ). Therefore, we obtain, for 157 explosions, average
values for a mean diameter of
gV0
pGV
3
D =0.26 m and initial mean particle velocity of =67 m/s. pV0
III.6.3. Loading parameters retrieval
Finally, the flux and the total volume of gas released during this sequence of Strombolian
activity can also be deduced from the time series of initial gas velocities. In our case, the time
series has been calculated on 1020 s, and the gas flux can be expressed as the product of the
vent section with the mean initial gas velocity of all values recorded at a sampling rate of
2.5 Hz.
∑=
=n
i
gg V
nrQ
10
2π
where r is the radius of the vent at Etna SEC, which is taken equal to r=5 m (Vergniolle and
Ripepe, 2008), and n=2478 is the number of initial gas velocity values in the time frame of
the sequence studied. We obtain an average gas flux of =6x10gQ 3 m3/s. The total volume
released during the 17-min sequence of Strombolian activity can hence be estimated easily
from the product of the gas flux ( ) and the duration of the activity (t): gQ
tQW gg =
We obtain a total gas volume of =6.1x10gW 6 m3. Considering that H2O commonly represents
more than 90% of the gas released during Strombolian eruptions (Allard et al., 2005), we
assume for the calculation of the total mass of gas that H20 is the only magmatic gas specie.
We obtain, with a water vapour density ≈0.18 kg/mvapOH2
ρ 3 at 3300 m elevation, a gas mass
flux of about Mg=1x10³ Kg/s and a total gas mass of about 1.1x10⁶ kg during the 17-min
91

Chapter III – Kinetic features of Strombolian jets
sequence studied. All values related to the study of the 17-min sequence occurring on July 4,
2001 are summarized in Table III.3.
Table III.3. Summary of kinetic and loading values inferred from radar measurements for a 17-min
sequence of Strombolian activity that occurs during the paroxysm of July-4 eruption from 2129:00 UT
to 2146:00 UT at Etna SEC.
Kinetic parameters Loading parameters gV0 (m/s) 144
pV0 (m/s) 67 gwQ (m3/s) 6x10³ g
MQ (Kg/s) 1x10³
pGV
3 (m/s) 41 D (m) 0.26 gW (m3) 6.1x10⁶ gM (Kg) 1.1x10⁶
III.7. Discussion
This study has permitted the detailed analysis of kinetic features, which provides crucial
initial kinetic parameters retrieved routinely from Doppler radar measurements. Particularly,
VOLDORAD enable initial gas velocity assessment (i.e., at the emission source), and gives
first order estimate of the mean initial particle velocity and mean diameter. In addition, the
acquisition of source kinetic parameters has permitted us to calculate velocity-derived
parameters such as gas masses and volumes released during the Strombolian eruption
occurring on July 4, 2001 at Etna SEC.
Obviously some difficulties remain on the estimation of such parameters, particularly
regarding assumptions included in the ballistic model. At the input of the model, two
fundamental relations are used the model (i) the gas-dependence of particle velocity and (ii)
the gas velocity decrease law. The first one is defined with the constant k, taken as 150 as
found in the literature from studies carried out at Stromboli volcano. But this value may vary
from one explosion to another as well as between different volcanoes. The particle velocity
also depends on the gas behaviour; however, the gas velocity decrease law is also poorly
constrained. Indeed, it is defined with two decrease coefficient γ = 4.6 and zref = 850 m. The
height reference coefficient (zref) has been constrained in this study from video measurements,
on which some uncertainties also remain, and taken as constant throughout the whole
sequence studied.
92

Chapter III – Kinetic features of Strombolian jets
Photoballistic measurements have been carried out from the analysis of video snapshots
recorded simultaneously to the radar. Some difficulties arise with this method, particularly for
the detection of the front boundary that prevents accurate determination of the propagating
gas front position. Note that in this study, the luminous front has been considered as being the
gas phase propagating upward. However, we suppose that only fine particles can be seen from
our video recording, which can slightly biased video-derived velocities interpretations. Ultra-
Violet or Infrared measurements, such as ground-based UV camera or FLIR method, would
probably be better adapted for the gas phase analysis. Moreover, the exploitation of a two-
dimensional field of view may also induce some biases on video measurements that can
virtually reduce real gas or particle velocity values.
Some assumptions formulated in the source parameters retrieval method can also be
discussed, particularly regarding the geometrical correction coefficients of the analytical
procedure. Indeed, for all explosions studied, we assume that the maximum radial velocity
( ) recorded by VOLDORAD stands for particles ejected with an inclination of about 55°
in average. This value is not arbitrary, as it corresponds to the physical boundary of the radar
range gate G
+maxV
3 located right above the vent. Theoretically, highest radial velocities are indeed
measured in the bottom right hand corner of the gate G3, however, we assume in that study
that all jets studied hold enough particles (to emerge from the radar noise level) ejected within
a dispersion cone sufficiently large to meet such radial trajectories (55°).
In this study, the mean radial velocity ( ) recorded by VOLDORAD and calculated as the
first spectral moment (i.e., the mean velocity weighted by the power spectral density over the
whole positive velocity range) is used to derive the average particle velocity corresponding to
the velocity of particles with mean diameter (
+meanV
D ). However, the interpretation of is
actually more complex. Indeed, the particle size distribution is not monodisperse, and hence
the total echo-power recorded is the result of multiple-size particles backscattering to the
radar. But we know that the scattering law that gives the relation between the reflectivity and
the size of particles is strongly not linear, particularly for large diameters. Therefore the use of
has for effects to underestimate the mean particle velocity and overestimate the mean
diameter.
+meanV
+meanV
93


CHAPTER IV
Loading features of Strombolian jets: insight from
inversion of Doppler radar measurements

See also Appendix C:
Gouhier, M., and F. Donnadieu (2008), Mass estimations of ejecta from Strombolian explosions by inversion of Doppler radar measurements, J. Geophys. Res., 113, B10202, doi:10.1029/2007JB005383.

Chapter IV – Loading features of Strombolian jets
IV.1. Introduction
Volcanic explosions are important sources of information for understanding eruption
mechanisms. The masses and velocities of gas and pyroclasts are particularly important
parameters controlling the dynamics of an eruption as they define crucial parameters such as
mass fluxes, kinetic and thermal energies released by an explosion. In order to better
understand the dynamics of explosive eruptions, satellite imagery, and ground-based weather
radars particularly have been used for the sounding of volcanic ash plumes from large
eruptions [Harris et al., 1981; Harris and Rose, 1983; Weill et al., 1992; Dean et al., 1994;
Dehn et al., 2000; Lacasse et al., 2004]. These techniques probe the upper convective parts of
high eruption columns and provide information primarily on the small particles that ultimately
constitute the distal volcanic products. A major challenge is now to measure physical
parameters, such as ejecta velocities and masses, close to the vent in order to retrieve directly
the true source parameters. A first approach to measure jet velocities was used at Stromboli
with an acoustic Doppler sounder (sodar) [Weill et al., 1992]. Other techniques that
potentially provide information on both velocity and mass parameters are ground-based
portable Doppler radar, either pulsed such as VOLDORAD (Volcano Doppler Radar)
[Dubosclard et al., 1999; Dubosclard et al., 2004] or frequency-modulated such as
VERDEMOS [Hort and Seyfried, 1998; Seyfried and Hort, 1999]. These techniques allow
direct measurement of particle velocities and reflectivities immediately above the vent. In
addition to their significant monitoring potential, these radar systems allow us to study, under
any weather conditions, explosions of lesser intensity barely imaged by satellites or weather
radars.
VOLDORAD was used to record several eruptive episodes at Etna in July 2001, ranging from
mild Strombolian activity to paroxysmal lava fountains [Donnadieu et al., 2005]. A new
method based on inversion of echo-power data measured using VOLDORAD is now
presented for estimating the masses of pyroclasts ejected during individual explosions. The
method also provides first-order estimates of mass-related parameters such as mass flux,
ejecta volume, particle concentration, thermal and kinetic energy at the vent. The method was
applied to two Strombolian explosions with contrasted particle loads that occurred during an
eruptive episode of Mt. Etna southeast (SE) crater on 4 July, 2001. Firstly, an algorithm is
developed to simulate radar echoes from pyroclasts of various sizes, using the complete
97
Chapter IV – Loading features of Strombolian jets
electromagnetic scattering formulation [Mie, 1908]. This approach provides synthetic data of
power backscattered by particles (Psynth) at the particular wavelength employed by
VOLDORAD. Secondly, as an input to the model, a scaled-Weibull function [Weibull, 1939]
is used to characterize the particle size distribution (PSD). The general shape of the Weibull
distribution is constrained from published data for typical Strombolian activity [Chouet et al.,
1974], and the mode of the PSD is estimated from our own radar velocity measurements for
each explosion. All Weibull parameters characterizing a polydisperse (multiple particle size)
distribution, such as shape, shift and scale factors, can then be deduced and used to compute
synthetic values of backscattered power. Lastly, a recursive inversion algorithm is applied in
order to obtain a PSD such that the synthetic power (Psynth) best fit the measured radar power
(Pmes). The mass of ejected material and related parameters are then deduced. An alternative
model is proposed, based on a monodisperse (single particle size) PSD, which turns out to be
an acceptable approximation of the polydisperse model. This approach reduces computing
time, making it useful for real-time quantitative assessment of ejected mass during volcano
monitoring.
IV.2. Acquisition of radar power parameters
Data from successive range gates are displayed in real time as Doppler spectra representing
the power spectral density versus radial velocity. From the processing of the series of Doppler
spectra, two sets of parameters are directly retrieved for ascending (positive parameters
indexed +) and descending (negative parameters indexed -) ejecta crossing the successive
range gates above, or on either side of, the eruptive jet axis: (1) velocity information, in
particular maximum radial velocity (V +max, V -
max) and; (2) power (P+, P-) backscattered by
particles contained in the sampling volume at a given instant [Dubosclard et al., 2004]. In the
aim of loading estimations we will mainly focus on the radar power parameters
98

Chapter IV – Loading features of Strombolian jets
Figure IV.1. Sketch of a typical Doppler spectrum obtained by VOLDORAD. The power spectral
density is displayed as a function of the radial velocity in a given range. The horizontal line (Br)
corresponds to the background noise level. Total echo power, maximum and mean velocities can be
deduced from Doppler spectra. They are indexed (+) and (-) for ejecta with the radial component of
their velocity vector moving away and towards the antenna respectively.
The received echo power from the particles can be defined by the integral of the spectral
power density S(v) in a velocity interval between v and v+dv, from 0 to V +max for ascending
particles and from V -max to 0 for descending particles. The power measured in the Doppler
spectra has been calibrated in the laboratory by means of an input signal, the power of which
was known, delivered by an external frequency generator.
(IV.1) ( )∫ dvvS−
=−
0
maxV
P
( )∫+
=+
max
0
V
dvvSP
Maximum radial velocities in the directions toward and opposite to the radar, V -max and V +
max
respectively, are defined where S(v) is equal to the background noise level Br (Figure IV.1).
IV.3. Electromagnetic scattering model
The aim of this study is to estimate masses of volcanic ejecta from two Strombolian
explosions with contrasted particle loads by inversion of the Doppler radar measurements. For
this purpose, a comparison between the backscattered power measured by the radar (Pmes) and
99

Chapter IV – Loading features of Strombolian jets
the synthetic (i.e., calculated) backscattered power (Psynth) is needed (see § 4. for more details
on the inversion method). In this section, we first describe how to retrieve Pmes, and then we
derive Psynth using the electromagnetic scattering theory of Mie [1908]. As shown by
Figure IV.1, processing of the Doppler spectra yields the total backscattered power (Ptot = P- +
P+). Raw power values (Pmes) can then be deduced directly from the radar conversion constant
(Cc) that depends on technical characteristics of the radar acquisition line.
(IV.2) ctotmes CPP =
On the other hand, Psynth can be derived from an electromagnetic scattering model. A good
approximation for small particles is the Rayleigh scattering theory, the validity limit of which
depends on the radar wavelength [Sauvageot, 1992]. This method is commonly used in
meteorology, because the typical diameter of water droplets is small compared to the
wavelengths of meteorological radars. In our case (λ = 23.5 cm), the Rayleigh theory can only
be applied for particles of diameter (DL) smaller than λ/4, which corresponds to ~5.9 cm
[Gouhier and Donnadieu, 2006]. However, considering the wide range of particle diameters
characterizing volcanic activity, the complete scattering theory is required to account for the
effects of larger particles. A general solution of electromagnetic wave scattering was given by
Mie [1908]. This approach applies Maxwell’s equations for plane waves scattered by
compositionally homogeneous particles (Appendix A). For application to volcanic eruptions,
we focus on waves scattered at a large distance by spherical particles, which we assume are
homogeneously distributed in space. Theoretically, the power backscattered to the radar by a
population of such particles in a given range gate is proportional to their radar reflectivity (η).
The synthetic power can then be defined as:
(IV.3)
4R
VCP srsynth
η=
where Cr is the radar constant, Vs, the sampling volume, and R, the slant distance between the
radar and the target. The radar constant is defined by a set of technical parameters related to
the radar configuration. The radar constant has been calibrated using a classical method
comparing the reflectivity of rainfalls probed by the radar and the reflectivity calculated from
the drop size distribution and velocity of the falling hydrometeors measured simultaneously
with a disdrometer [Pointin et al., 2005]. The radar reflectivity (η) is the sum of the
100

Chapter IV – Loading features of Strombolian jets
backscattering cross sections (σbks) of the individual particles per unit volume. The reflectivity
factor (Z) is defined by Sauvageot (1992) as:
( )∑
=
=n
i s
ibks
V1
ση (IV.4)
and
(IV.5)
1825
4
10.K
Zπ
λη=
Z (commonly confused with η in the literature) is often expressed in logarithmic units as dBZ
and is related to η through the radar wavelength λ, and the particle complex dielectric factor
K = (m2-1)/(m2+2). Scattering and attenuation by compositionally homogeneous spheres are
significantly influenced by the complex refractive index (m). VOLDORAD transmits power
through a square array of four Yagi antennas, such that the incident electromagnetic wave is
polarized parallel to the scattering plane. Being a monostatic radar (i.e., the same antenna is
used for transmission and reception), we define a backscattering cross section (σbks) for
horizontal linear polarization:
(IV.6)
( )( )2
1
22
12)1(4 ∑
∞
=
−+−=n
nnbks banπλσ
where an and bn are the complex scattering coefficients (so-called Mie coefficients). Examples
of Mie vs. Rayleigh scattering patterns of an electromagnetic wave scattered by homogeneous
spheres of four different sizes are shown in Figure IV.2 for a signal at the wavelength used by
VOLDORAD (λ = 23.5 cm) and with the complex dielectric factor of volcanic ash (|K|2 =
0.39) [Adams et al., 1996]. These patterns illustrate the large discrepancy between the
Rayleigh and Mie formulations for particle diameters larger than a few centimeters at 23.5 cm
wavelength. Note that, at smaller radar wavelengths, this discrepancy occurs at even smaller
particle diameters, making the complete Mie formulation absolutely necessary for studies of
volcanic ejecta from radar measurements.
101

Chapter IV – Loading features of Strombolian jets
Figure IV.2. Mie vs. Rayleigh scattering patterns of an electromagnetic wave, parallel polarized,
scattered by a single homogeneous sphere with the complex dielectric factor of volcanic ash, |K|² =
0.39 [Adams et al., 1996], and λ = 23.5 cm. The wave arrives from the left, and the particle is situated
at the centre of the pattern. Irradiance amplitude is normalized to that of Mie and expressed on a
logarithmic scale. (a) Example of a small particle of diameter 2 cm. The Rayleigh and Mie scattering
patterns are identical and symmetrical. Irradiance intensity is the same in front of and behind the
particle. (b) Particle of diameter 14 cm. The Rayleigh and Mie scattering patterns are now significantly
different. The Mie pattern still has two main lobes, but is strongly asymmetric, as the backscattered
intensity is lower than the forward-scattered intensity. (c) Particle of diameter 20 cm. The Rayleigh
pattern is still symmetrical whereas the Mie pattern is divided into several lobes and shows much
lower values of irradiance. (d) For a diameter of 2 m, the Mie (true) scattering pattern becomes very
complex, and shows always much lower values of irradiance than the Rayleigh approximation.
Figure IV.3 shows the reflectivity factor (Z) as a function of particle diameter, using both the
Mie and Rayleigh formulations for a wavelength of 23.5 cm. Note the overestimation of Z
when computed using the Rayleigh approximation for particle diameters greater than ~ 5.9
cm.
102

Chapter IV – Loading features of Strombolian jets
Figure IV.3. Synthetic reflectivity factor (Z, expressed in dBZ) as a function of particle diameter. Note
the large overestimation of Z for large diameters when computed using the Rayleigh approximation.
The validity domain depends on the radar wavelength. In the case of VOLDORAD (λ = 23.5 cm), the
validity limit (DL) lies close to 5.9 cm, i.e., ∼λ/4 [Gouhier and Donnadieu, 2006].
IV.4. Inversion method
Model inversions are frequently used in geophysics to recover initial parameters and
boundary conditions from observed data of natural phenomena. In this case, backscattered
power values (Pmes) are retrieved from radar measurements, and synthetic power data (Psynth)
are determined from the forward electromagnetic-scattering model. The inversion algorithm
thus seeks the best correlation between Pmes and Psynth, providing the optimum variable input
parameters defined by the vector (X) that characterizes the PSD. Physical parameters such as
particle mass and volume are then deduced from the PSD. The model takes into account two
main classes of parameters: (1) constant parameters describing the geometry of the system,
the technical characteristics of the radar or material physical properties; (2) the vector of
variable input parameters (X; see below) defining the Weibull function of the PSD. A least-
square estimation method is used, based on the minimization function S(X) characterized by
the squared residual between radar measured data and synthetic data:
103

Chapter IV – Loading features of Strombolian jets
[ ]2
)()( ∑ −= XPPXS synthmes( IV.7)
Finally, a comparison criterion between radar-measured (Pmes) and synthetic (Psynth) power
data is used to stop the recursive loop when the fitting criterion is reached. The successive
steps of the inversion algorithm are summarized below.
Step 0: Attribution of initial values for estimation of the input parameters :
[ ]nj XXXX ,...,, 21≡
Step 1: Resolution of the direct model (Mie scattering):
( )SynthXPX →
Step 2: Calculation of the minimization function:
[ ]2
)()( ∑ −= XPPXS synthmes
Step 3: Characterization of the iterative comparison criterion:
( ) ( ) ( )iii XSXSXP −=∆ −1
Step 4: Testing of the fitness criterion:
( ) 0<∆ XP
where ∆P(X) is the fitness criterion, and indices i and j refer respectively to the step of the
iterative procedure and the number of variable parameters. When a satisfactory solution is
reached, the iterative procedure stops. The computational procedure is summarized in
Figure IV.4.
Figure IV.4. Sketch of the inversion approach. Synthetic radar power data (Psynth) are provided from
the theoretical model (Mie formulation) and compared to the power data measured (Pmes) by
VOLDORAD. If the fit criterion is met, the procedure stops and gives the best result. Otherwise, the
input parameters (X) are optimized in the recursive loop, and the calculation is repeated.
104

Chapter IV – Loading features of Strombolian jets
IV.5. Polydisperse particle size model
IV.5.1. Particle size distribution
Solving the inverse problem consists of estimating the shape of the PSD by best-fit matching
of synthetic and observed data. Various PSDs have been used in, or inferred from, previous
studies of volcanic ejecta: exponential [Ripepe et al., 1993], log-normal [Sheridan, 1971;
Chouet et al., 1974; McGetchin et al., 1974; Self et al., 1974], Rosin Rammler [Kittleman,
1964; Spieler et al., 2003], Weibull [Nakamura, 1984; Marzano et al., 2006(a); Marzano et
al., 2006(b)], polymodal [Sheridan et al., 1987; Riley et al., 2003] and SFT (Sequential
Fragmentation/Transport) [Wohletz et al., 1989]. However, there is still a lack of consensus on
which PSD best characterizes Strombolian activity, particularly for the largest particle
diameters. For this reason, a scaled-Weibull function is used, because its overall shape may be
varied widely from exponential to Gaussian by means of only 3 factors: shape (k), shift (Λ),
and scale (Nmax). The PSD can then be adjusted easily during the optimization phase of the
data-inversion procedure. The scaled-Weibull distribution Sw is defined through a probability
density function fw of particles with diameter D:
( )[ ] maxmax ,;max),;(
),,;( NkDf
kDfNkDS
w
ww Λ
Λ=Λ (IV.8)
with
(IV.9)
( ) kk
w
DDkkDf ⎟⎟
⎠
⎞⎜⎜⎝
⎛
Λ
−⎟⎟⎠
⎞⎜⎜⎝
⎛
Λ⎟⎟⎠
⎞⎜⎜⎝
⎛
Λ=Λ
−
exp),;(1
The shape factor (k) allows us to choose from an exponential (k=1) to Gaussian (k=3)
distribution, along with all intermediate log-normal distributions (1<k<3).
The shift factor (Λ) directly depends on the mode (µn) of the PSD and on the shape factor (k).
It can be defined by using:
(IV.10)
k
n kk
1
1 −
⎟⎠⎞
⎜⎝⎛ −
=Λ µ
105

Chapter IV – Loading features of Strombolian jets
Nmax is the maximum number of particles of diameter µn in the scaled-Weibull distribution
(Figure IV.5a). It is the dominant term in the computation of the synthetic power because it
strongly influences the estimate of particle mass.
Figure IV.5. Evolution of the particle size distribution (PSD) for different values of shift (Λ) and scale
factors (Nmax). For both examples, the shape factor is constant at k=2. (a) The scale factor (Nmax)
represents the maximum number of particles with diameter µn, and therefore directly controls the total
number of particles. (b) The mode (µn) and range (γ) of the distribution evolve jointly with the shift
factor.
The three variable parameters (k, µn, Nmax) controlling the PSD make up the vector X of input
parameters to the model. However, in order to obtain a unique solution to the inverse
problem, the number of variable parameters is reduced. This also increases the efficiency and
speed of the algorithm. Parameters k and µn are constrained from the following assumptions
argued in subsequent sections: (1) the PSD of Strombolian explosions can be characterized on
average by a single shape factor k; (2) the mode of the PSD (µn) can be determined from mean
particle terminal velocity estimated from the radar measurements. These assumptions then
reduce the optimization procedure to a single free parameter (Nmax).
106

Chapter IV – Loading features of Strombolian jets
IV.5.2. Parameter constraints
IV.5.2.1. Shape factor, k
Data on Strombolian PSDs are scarce in the literature. However, Chouet et al. [1974] gave an
exhaustive description of two explosions at Stromboli Volcano by photoballistic analysis.
They made an estimate of the PSD for inflight ejecta (which is what a radar records), and
determined the modes, ranges, numbers and sizes of particles for two explosions. They also
deduced eruptive parameters such as number, mass and volume of ejected particles, and found
that one explosion contained a number and mass of particles about 17 times greater than the
other (Table IV.1). We use this study, where all output parameters are already known, to
determine the input parameter (k) that best describes the two Strombolian explosions observed
by Chouet et al. [1974]. With this aim, we first calculate the “equivalent” radar power
corresponding to the total ejected mass estimated by Chouet et al.’s [1974] observations for
two Strombolian explosions. Then synthetic radar powers are computed for different values of
shape factor k. Finally, the recursive procedure stops when synthetic radar powers match the
equivalent radar power and when synthetic particle loading parameters (number, mass,
volume) correspond to those described by Chouet et al. [1974]. Note that an alternative
method would have been simply to determine k from a best fit function of the Chouet et al.
[1974] PSD. However, our chosen approach had the advantage of additionally testing our
inversion algorithm.
Table IV.1. Comparison between values observed by Chouet et al. [1974] on two explosions
at Stromboli and synthetic values calculated by the inversion algorithm. Note that the best fit
for both sets of data is reached for the same shape factor k = 2.3 (log-normal particle size
distribution).
Explosion 1: Sept. 1971 Explosion 2: Sept. 1971 Observed data Synthetic data Observed data Synthetic data
Number of particles (N) 2588 2588 146 144
Mode (m) (µn) 0,022 0,022 0,025 0,025
Range (m) (γ) ?-0,06 0,004-0,06 ?-0,06 0,001-0,06
Volume (m3) (V) 0.033 0.035 0.002 0.0027
Mass (Kg) (M) 51 53 3 4.1
107

Chapter IV – Loading features of Strombolian jets
The best fit between the observed and synthetic PSDs is reached in both cases for the same
value of k = 2.3, which describes a log-normal distribution. The equivalent synthetic power
achieved is about 3.3×10⁻⁹ mW and 3.2×10⁻¹⁰ mW for explosions 1 and 2 respectively, and
corresponds to equivalent reflectivity factors (Z) of 61 dBZ and 51 dBZ. The inversion
procedure yields three parameters (number, mode and range) characterizing the synthetic
PSDs, from which two eruptive parameters (mass and volume) are directly deduced
(Table IV.1). The agreement between observed and synthetic parameters is very good and
validates our inversion algorithm. Shape factor estimation can then be used afterward with
reasonable confidence. Furthermore log-normal PSDs have also been inferred from deposits
of Strombolian activity on other volcanoes, like Etna [McGetchin et al., 1974] and Heimaey
[Self et al., 1974]. Although k may vary between individual explosions on Stromboli, as well
as between Strombolian eruptions at different volcanoes, we assume in what follows that the
value k = 2.3, found for both explosions at Stromboli, represents a suitable average value for
Strombolian PSDs and use it as input to the model. Moreover, sensitivity tests reveal a limited
dependence of the total ejected mass on k, varying only by a factor of two for values of k
ranging from 2.0 to 2.6.
IV.5.2.2. Shift factor, Λ
The shift factor (Λ) is linked to the mode (µn) and range (γ) via the shape factor (k)
(Figure IV.5b). The mode of the distribution is estimated directly from radar measurements
using the terminal settling velocities of ejected particles. Indeed, under the assumptions of
vertical trajectories, no wind influence, and terminal fall velocity, an average particle diameter
Dp can be deduced from the mean negative radial velocity weighted by the power spectral
density [Rogers and Yau, 1989; Hort et al., 2003].
(IV.11)
∑−
⎟⎠⎞
⎜⎝⎛=
−
0 2
maxsin
)(V
rsp
VvSPC
Dθ
where S(v) is the spectral power in a velocity interval. P- refers to the power backscattered
mainly by descending particles (left part of the Doppler spectrum), and θ stands for the
antenna beam elevation angle. Cs is the shape coefficient, which for a spherical particle is:
gCC
p
ads ρρ
43
= (IV.12)
108

Chapter IV – Loading features of Strombolian jets
with Cd being the drag coefficient, g the gravitational acceleration and ρa, ρp the densities of
air and particles respectively. Importantly, the interpretation of Dp retrieved from Doppler
radar spectra differs significantly from µn (the mode of the PSD). Indeed, µn corresponds to
the particle diameter that is most represented in the particle size distribution, i.e., the top of
the curve. In radar meteorology, Dp is approximately equal to µn because the size distributions
of atmospheric water droplets are typically Gaussian and very narrow. In a volcanic jet
however, the power spectrum is much wider [e.g., Dubosclard et al., 1999], and the physical
interpretation of Dp is therefore more complex. Dp and µn are offset by a factor based on the
dependence of the reflectivity (calculated at a given radar wavelength) on the number (N) and
diameter (D) of particles. Thus µn is obtained from Dp using a scattering formulation adequate
for the range of particle sizes characterizing explosive volcanic activity [Woods and Bursik,
1991; Gouhier and Donnadieu, 2006]. Once k and µn are obtained, the shift factor Λ can be
calculated from equation 10.
IV.5.2.3. Scale factor, Nmax
By assuming that k and µn are constant throughout the inversion procedure, the parameter
vector X then becomes dependent on just a single free parameter, the scale factor, Nmax. This
characterizes the maximum of the scaled-Weibull distribution curve (Sw) and evolves during
the optimization phase of the algorithm. It describes, along with k and µn, the total number of
particles ejected during the explosion, and hence controls the erupted mass estimation. The
accuracy of the results depends on the step chosen between two successive values of Nmax in
the recursive loop. However, although a small step leads to a more accurate estimation, it
increases considerably the computing time.
109

Chapter IV – Loading features of Strombolian jets
IV.6. Monodisperse particle size model
An alternative data-inversion model based on a monodisperse PSD approximation is now
presented. In this model, the single particle size equals µn, as well as Dp. Figure IV.6 shows
that the number of small particles required to generate a given reflectivity can be up to several
orders of magnitude larger than the number of corresponding large particles. Because of this
huge difference in particle number, the fraction of small ejecta contributes most to the total
estimated mass. For example, a reflectivity of 95 dBZ requires 8.8×10⁶ kg of 0.01-m particles
compared to 6.4×10⁴ kg of 1-m particles, a difference of two orders of magnitude. This result
illustrates that large blocks are not so important in first-order estimations of total ejected
mass. This monodisperse PSD model significantly reduces computing time and ensures fast
synthetic power calculations. Mass estimations are provided in Figure IV.7 for a wide range
of realistic values of Dp and Z. Since these parameters are derived directly from the Doppler
spectra, the corresponding mass can be retrieved instantaneously without any computing
phase. This alternative method is valuable because a first-order mass estimate of ejected
pyroclasts can be obtained in real time and used for volcano monitoring.
Figure IV.6. Plot of the total mass and number of particles as a function of their diameter in the
monodisperse model for a reflectivity factor Z = 95 dBZ. Small particles contribute the most to the total
ejected mass, for example 8.8×10⁶ kg for a diameter of 0.01 m, compared to 6.4×10⁴ kg for a diameter
of 1 m; i.e., a difference of two orders of magnitude.
110

Chapter IV – Loading features of Strombolian jets
Figure IV.7. Mass estimate as a function of average particle size (Dp) retrieved from the power
spectral density using the monodisperse model, for different reflectivity factors (Z) of ejected particles.
First-order mass assessments can be given simply from the reflectivity factor (Z) and the average
particle size (Dp) determined directly from the Doppler spectra, without any computation phase.
Masses of 4.5×10⁴ kg and 1.5×10⁵ kg are roughly estimated for explosions 1 and 2, respectively.
IV.7. Radar data
Strombolian explosions and lava fountains were monitored with VOLDORAD for several
hours during eruptive episodes of the SE crater on 4, 7 and 13 July, 2001. We focus on data
acquired during two explosions that occurred at 21:41’53’’ and 21:41’56’’ U.T. during the
eruption of 4 July. The two explosions were each short-lived, with durations of about 3 s.
Temporal series (Figure IV.8) of radar power are computed from the power spectral density
S(v), and sampled at a high frequency (10 Hz) suitable for such short-lived explosions.
111

Chapter IV – Loading features of Strombolian jets
Figure IV.8. Temporal evolution of radar echo power during the two explosions studied at Mt. Etna on
4 July, 2001, sampled at 10 Hz. Both echo powers of particles moving away from (P+) and towards (P-)
the antenna are plotted in order to infer the total power at a given instant, in the range gate (G3)
located above the vent. Both explosions are brief, lasting 2.2 s and 2.8 s respectively. The second
explosion is much more powerful (125 dB and 123 dB for P+ and P- respectively), than the first (117 dB
and 115 dB).
It is important that the power used as input to the inversion model be defined carefully. First,
it is essential to ensure that the total power at a given instant is the sum of Ptot across the
different range gates along the beam axis. Were the jet wider than the width of a single range
gate (120 m), it would be necessary to integrate across several range gates in order to obtain
the total reflected power. However, in the cases studied here, both jets were sufficiently
narrow as to fit within a single range gate (G3). This is deduced from (1) visual inspection of
video snapshots, (2) and from the lack of echo-power signal from neighbouring range gates
(G2 and G4). Integration along the beam axis is therefore unnecessary.
The second requirement is that the reflected power be integrated throughout the entire
duration of the explosion as the jet passes vertically across the range gate concerned (G3). In
this case, two situations can be envisaged, as shown schematically in Figure IV.9. To explain
these two cases, we consider two time durations: ∆tjet, the duration of jet production, and
∆tcross, the time necessary for the jet to traverse vertically the given range gate. In the first case
(Figure IV.9a), ∆tjet < ∆tcross and the jet is thus short enough for most of the particles to be
recorded at the same instant inside a single sampling volume. The peak of radar echo power
can therefore be considered as representative of the entire jet and the input parameters to the
112

Chapter IV – Loading features of Strombolian jets
model can be derived on the basis of a single Doppler spectrum. When ∆tjet ≥ ∆tcross
(Figure IV.9b), the jet is never entirely contained within a single range gate, and the peak of
echo power represents only a fraction of the constituent particles. Integration over the
duration of the jet (∆tjet) is therefore essential. Note that for lava fountaining sustained over
longer periods of time at a relatively steady rate, the mean residence time of ejecta inside the
range gate would need to be taken into account. This could be inferred from velocities
measured by the radar and from the sounding geometry, leading to estimation of the mass
flux. The total mass of lava ejected could then be calculated using the duration of the lava
fountain.
Figure IV.9. Sketch illustrating the two hypotheses made in the calculation of total power. tjet is the
duration of jet production, and tcross is the time necessary for the jet to traverse vertically the range
gate. (a) Example of a short-lived jet (∆tjet < ∆tcross): the jet is short enough to be wholly enclosed in the
sampling volume. A single Doppler spectrum can then be used for the calculation of total power. (b)
Example of a long-lived jet (∆tjet > ∆tcross): the jet is too long to be contained entirely in the sample
volume at a given instant. The maximum radar echo power represents only a fraction of the total
amount of ejected particles, and several Doppler spectra have to be taken into account for the
calculation of the total power. The two explosions jets of 4 July, 2001 at Mt. Etna studied in this paper
were both short-lived.
In the explosions considered here , the average time ∆tcross taken by the jet to cross the range
gate (G3) is 4.7 s at an average velocity of 38 m.s-1 for explosion 1, and 2.9 s at 62 m.s-1 for
explosion 2. By comparison, ∆tjet is estimated from videos and radar time series at 2.2 s and
2.8 s for explosions 1 and 2 respectively. In both cases, therefore, ∆tjet < ∆tcross; no time
integration is necessary, and data analysis can be based on a single Doppler spectrum.
Moreover, the explosion jets commonly become depleted in blocks, and proportionally richer
in gas toward the waning stage of their emission, so that the relevant values for ∆tjet might
actually even be lower.
113

Chapter IV – Loading features of Strombolian jets
IV.8. Results
Results of the polydisperse and monodisperse models are shown in Tables IV.2 and IV.3. The
fitness between observed and synthetic power data is very good, with 98.7% and 97.8% for
explosions 1 and 2 respectively.
Figure IV.10. Snapshots of the two explosions from the SE crater of Mt. Etna on 4 July, 2001. Images
are shown at maximum brightness, corresponding to the highest radar reflectivity from lava fragments.
(a) The first explosion, occurring at 21:41’53’’ U.T., displays a low quantity of lava fragments and lasts
2.2 s; (b) the second explosion, occurring at 21:41’56’’ U.T., displays a much higher number of lava
fragments and lasts 2.8 s.
IV.8.1. Particle loading parameters
Using the more accurate polydisperse model, the total mass of pyroclasts ejected by the first
explosion is estimated at 58400 kg, corresponding to a volume of 38 m3 assuming a pyroclast
density of 1530 kg.m-3 [McGetchin et al., 1974] and a reflectivity factor of 85 dBZ. The
equivalent magma volume (DRE), for a density of 2700 kg.m-3 [Williams and McBirney,
1979] is 22 m3. The second explosion (Table IV.3) yields higher values of the different
parameters, with an ejecta mass of 206000 kg, a pyroclast volume of 135 m3, a reflectivity
factor of 94 dBZ, and a magma volume of 76 m3. The difference between the reflectivity
factors of the two explosions is 9 dBZ, meaning that the second explosion jet is about 8 times
more reflective than the first, and the ejecta volume and mass are consequently about 3.5
times higher. This agrees with visual observations which show clearly that the first explosion
involved a smaller quantity of incandescent lava clots than the second explosion
(Figure IV.10).
114

Chapter IV – Loading features of Strombolian jets
Table IV.2. Results using both the polydisperse particle size distribution model and the monodisperse approximation, for explosion 1 (21:41’53’’ U.T.) at Mt. Etna SE crater, 4 July 2001
Synthetic results monodisperse PSD
Synthetic resultspolydisperse PSD
Model parameters Input / output
Explosion 1 Characteristics
Number of particles (N) 2.75×10⁶ 13.9×10⁶ µn 0.0129 Date 04/07/01 Mode (m) (µn) 0.027 0.013 Dp 0.027 Time (U.T.) 21:41’53’’ Volume (m3) (V) 28.4 38.2 Λ 0.0165 tjet (s) 2.2 Mass (Kg) (M) 43.4×10³ 58.4×10³ k 2.3 V+
max (m/s) 60 Concentration (Kg.m-3)* (C) 0.01-0.2 0.02-0.4 γ 0.01 – 0.056 V +max (m/s)** 37.9 Reflectivity factor (dBZ) (Z) 85.16 85.13 Nmax 8.00×105 Z (dBZ) 85.12 Power (mW) (Psynth) 8.14×10⁻⁷ 8.08×10⁻⁷ Fit (%) 98.68 Pmes (mW) 8.10×10⁻⁷
* Concentration parameters are poorly constrained and have to be regarded as rough approximations (see text for details). ** The parameter V +max is the time-averaged maximum velocity and differs from the mean velocity calculated by the radar. Particles numbers, masses and volumes estimated using the monodisperse model lie within
~25% of those of the polydisperse model for both explosions (Tables IV.2 and IV.3). This
underestimation is accounted for by small particles that are not considered in the
monodisperse model, but that in reality contribute most to the total mass, owing to the great
particle number required to match a given reflectivity.
It is instructive to compare the measured reflectivity factors of the two Etna explosions with
those theoretically calculated at Stromboli from the Chouet et al. [1974] observations. Recall
that reflectivity factor (Z) is a positive function of the number (N) and diameters (D) of
ejected particles. The two explosions at Stromboli give reflectivity factors of 61 dBZ and 51
dBZ (Table IV.1), whereas the two explosions at Etna give 85 and 94 dBZ
(Tables IV.2 and IV.3). Thus, even a small explosion at Etna is over 250 times more reflective
than a large one at Stromboli, and involves a mass of ejecta 3 orders of magnitude higher
(Table IV.1). For comparison, very heavy rainfall induces maximum reflectivity factors of
~60 dBZ [Sauvageot, 1992].
Table IV.3. Results using both the polydisperse particle size distribution model and the monodisperse approximation, for explosion 2 (21:41’56’’ U.T.) at Mt. Etna SE crater, 4 July 2001
* Concentration parameters are poorly constrained and have to be regarded as rough approximations (see text for details).
Synthetic results Monodisperse PSD
Synthetic results Polydisperse PSD
Model parameters Input / output
Explosion 2 Characteristics
Number of particles (N) 5.00×10⁶ 23.3×10⁶ µn 0.0164 Date 04/07/01 Mode (m) (µn) 0.034 0.016 Dp 0.034 Time (U.T.) 21:41’56’’ Volume (m3) (V) 102.9 134.7 Λ 0.021 tjet (s) 2.8 Mass (Kg) (M) 157×103 206×103 k 2.3 V+
max (m/s) 100 Concentration (Kg.m-3)* (C) 0.05-0.1 0.06-0.12 γ 0.01 - 0.072 V +max (m/s)** 61.6 Reflectivity factor (dBZ) (Z) 93.78 93.77 Nmax 1.05×106 Z (dBZ) 93.83 Power (mW) (Psynth) 5.92×10⁻⁶ 5.87×10⁻⁶ Fit (%) 97.82 Pmes (mW) 6.00×10⁻⁶
** The parameter V +max is the time-averaged maximum velocity and differs from the mean velocity calculated by the radar.
115

Chapter IV – Loading features of Strombolian jets
IV.8.2. Derived parameters
The mean mass fluxes of ejecta, estimated from the duration of each explosion
(Tables IV.2 and IV.3), reach 26400 kg.s-1 and 73600 kg.s-1 for explosions 1 and 2
respectively. These represent time-averaged values, and are not expected to be constant over
the duration of each explosion.
We have also attempted to estimate particle concentrations in the two explosion jets at Etna.
This is difficult since, although the radar data provide estimates of total particle mass, the jet
volumes are poorly constrained. One possibility is to make the assumption that each jet filled
completely and homogeneously the range-gate volume. In this case, concentration estimates
have to be regarded as minima. Using the volume of range gate (G3) above the crater yields
values of 0.02 kg.m-3 and 0.06 kg.m-3 for explosions 1 and 2 respectively. However,
inspection of video footage (Figure IV.10) shows that this assumption is probably not
realistic. The other option is to make an estimate of the jet volume from video snapshot
analysis, but two difficulties are inherent in this approach: first, the jets are spatially
heterogeneous, and, second, only large lava clots are visible and the volume occupied by ash
and small laplli cannot be estimated. However, taking limiting edges on video snapshots
yields that the jets of explosions 1 and 2 represent approximately 5% and 50% respectively of
the range-gate volume. Using these values gives maximum particle concentrations estimates
of about 0.4 kg.m-3 and 0.12 kg.m-3 for explosion jets 1 and 2 respectively
(Tables IV.2 and IV.3). Note that these concentrations represent spatially averaged values
over the estimated jet volume; however, much higher ejecta concentrations can be found
locally especially close to the vent.
The high data-sampling rate (∼10 Hz in the configuration used for this study) allows
VOLDORAD to measure rapid signal fluctuations on the timescale of an individual
explosion. It is therefore possible to calculate an average ejecta velocity, and hence a mean
kinetic energy for an explosion, using:
( IV.13)
2
1max )(1
21
⎟⎟⎠
⎞⎜⎜⎝
⎛= ∑
=
+n
itk iV
NME
where M is the total ejected mass given in Tables IV.2 and IV.3, and V +max is the maximum
radial velocity of each Doppler spectrum (i) recorded in the sampling volume. Nt is the total
number of Doppler spectra acquired during a given explosion. A mean kinetic energy of
4.2×10⁷ J is obtained for a time-averaged maximum radial velocity (V +max) of 38 m.s-1 for
116

Chapter IV – Loading features of Strombolian jets
explosion 1 and 3.9×10⁸ J for 62 m.s-1 for explosion 2. These values can be compared with the
thermal energies of explosions 1 and 2 from equation 14, which are estimated at 8.4×10¹⁰ J
and 3×10¹¹ J, respectively, assuming a magma temperature T of 1373 K [Francalanci et al.,
1989] and a magma specific heat capacity, Cp, of 1050 J.kg-1.K-1 [Vosteen and
Schellschmidtb, 2003]:
(IV.14) pT MTCE =
The thermal energies of the two explosions therefore exceed the kinetic energies by
approximately three orders of magnitude. Note that the kinetic and thermal energies of the gas
phase are not taken into account in these calculations.
IV.8.3. Possible effects of outsized particles
The numerical approach to the inverse problem requires us to define a continuous theoretical
function for the PSDs characterizing the explosions. In reality, however, explosion-generated
PSDs might contain a coarse tail of large, discrete blocks which, although relatively small in
number, could have a non-negligible effect on the mass estimation. For example, the PSDs
estimated photoballistically by Chouet et al. [1974] at Stromboli contained such coarse tails
of blocks. Large blocks ejected during Strombolian explosions at Mt. Etna have also been
documented by McGetchin et al. [1974]. In the present study these have been neglected
because they cannot be described by the type of continuous PSD function required by our
automatized inversion algorithm. Manual runs have therefore been carried out to assess the
sensitivity of mass calculations to an additional fraction of large particles. We define a
composite PSD with a continuous part and an additional discrete part that constitute
respectively the lower and upper ranges of the natural PSD (Figure IV.11). The coarse tail,
consisting of 85 discrete blocks, is represented by an exponential distribution from 0.1 to 1 m
in diameter with a median size of 0.23 m, i.e., close to that observed by McGetchin et al.
[1974] at the NE crater of Mt. Etna (∼0.2 m). Although numerically less abundant by more
than five orders of magnitude than the smaller particles constituting the continuous PSD
(Figure IV.11), the blocks of this coarse tail account for ~10% of the total reflectivity. This
composite PSD is probably a more realistic representation of the explosion ejecta, and gives a
total mass of 187000 kg for explosion 2, in comparison to 206000 kg for the continuous PSD
117

Chapter IV – Loading features of Strombolian jets
lacking a coarse tail. We conclude that neglecting large blocks results in overestimation of the
mass by only 9 % for this explosion. This is because the total mass of pyroclasts is mostly
controlled by the large number of small particles, as shown in Figure IV.6. As a result, all the
mass-related parameters listed in Tables IV.2 and IV.3 can be regarded as maxima.
Figure IV.11. Composite particle size distribution comprising a continuous function to describe the
smaller end of the PSD, with an additional coarse tail of large, discrete blocks. The continuous part
refers to the PSD of explosion 2 calculated from our algorithm. The coarse tail is constrained from the
data of McGetchin et al. [1974]; it consists of a total of only 85 blocks with a median size of 0.23 m, but
that represents about 10% of the total reflectivity.
IV.9. Discussion
A Doppler radar (VOLDORAD) has been used to estimate for the first time a wide range of
physical parameters characterizing Strombolian explosions at Mt. Etna. In addition to the
velocity data routinely provided by Doppler radar [Donnadieu et al., 2005], the results yield
estimates of particle loading (number, mass and volume), as well as derived parameters such
as mass flux, time-averaged particle kinetic and thermal energies and, more approximately,
particle concentration in the eruptive jet.
Our approach in estimating particle loading, and the parameters derived from it, involves
certain assumptions. For example, the electromagnetic scattering model assumes that all
particles are smooth, spherical and compositionally homogeneous, which is not the case for
118

Chapter IV – Loading features of Strombolian jets
pyroclasts. However, bearing in mind the statistical effects of a very large number of rough
and complexly shaped particles, as well as our objective of first-order estimation, these
simplifications seem reasonable. Another assumption concerns the particle size distribution
(PSD) used for data inversion. The inversion procedure involves three physical parameters:
two constants defining the PSD (mode and shape factor), and the third being the number of
particles corresponding to the mode that evolves during the optimization phase of the
inversion procedure. In the present study the mode was constrained from the radar
measurements at Mt. Etna. On the other hand, the shape factor was constrained independently
using published photoballistic data of Chouet et al. [1974] from explosions at Stromboli, and
was assumed to be representative of the explosion ejecta at Mt. Etna. Many problems are
inherent in this approach. For example, the photoballistically-derived PSD of Chouet et al.
[1974], while not skewed by atmospheric or depositional processes, is inadequate to describe
the fine tail of the distribution, particles of which are too small to be detectable on
photographs. On the other hand, McGetchin et al. [1974] constructed a PSD at Mt. Etna from
grain-size measurements of Strombolian deposits, but this method also failed to take into
account the smallest particles, which are dispersed far from source by the wind. Other
difficulties involved in determining PSDs from deposits may also arise from bomb
agglutination or from block breakage on impact. In addition, such studies probably fail to
sample volumes of ejecta large enough to be statistically representative of real amounts of
large blocks. Both photoballistic and ground-deposits methods therefore fail to take into
account small particles, whose contribution to the total mass is important. In contrast, UV
satellite methods such as TOMS or more recently OMI [Carn et al., 2008; Krotkov et al.,
2008], succeed in imaging gas (particularly SO2), ash and aerosols released by volcanic
eruptions. The IR satellite methods such as Meteosat or MODIS [Watson et al., 2004] are
further able to provide estimates of the distal ash content of large eruptive clouds far from the
emission source that are mainly composed of small particles. But these satellite-based
methods fail to image the larger size fractions segregated earlier during plume ascent. These
methods might also be biased by atmospheric effects on particles, such as water vapor content
and ice formation. Nevertheless, the comparison of near-source estimates of ejecta mass from
ground-based Doppler radar with the mass of distal fine ash estimated by satellite-based
methods could bring valuable constraints on the particle segregation from ash clouds through
space and time and hence on models of ash dispersal. In order to obtain more accurate values
of the mass of ejecta, a more thorough knowledge must be acquired of total source
granulometries of volcanic explosions, and of their variability for different eruptive regimes.
119

Chapter IV – Loading features of Strombolian jets
Insights into such source PSDs could be gained for instance by high-resolution imagery and
remote sensing methods working at different wavelengths. Such methods should target
regions of the eruptive jet close to the vent in order for all ejected particles to be included.
Their combination with ground ash collectors would bring even more stringent constraints.
Knowledge acquired on PSDs would additionally provide further valuable insights into
fragmentation and explosion processes during volcanic eruptions.
By fixing the explosion source PSD shape factor independently, and by determining the PSD
mode using the radar measurements, we obtain a way of estimating the particle loading
parameters to a first approximation. Neglecting the inevitable coarse tail of large blocks
appears justified on the basis of our calculations. The two PSD assumptions used in this paper
each have different advantages. The polydisperse model requires an inversion procedure that
takes a long time to compute, but which results in mass estimation to a reasonable first-order
accuracy. This approach is probably best adapted to studies of eruption dynamics, where the
most accurate possible parameter estimates are required. The monodisperse PSD model, on
the other hand, does not require any computing phase, so that mass estimation is fast and
straightforward. The disadvantage of this method is that it underestimates the particle loading.
This monodisperse model is most suitable for volcano monitoring, where the eruptive
parameters could be calculated automatically in real-time from the Doppler spectra, but where
a lower degree of accuracy could probably be tolerated.
This study has shown that Doppler radar is a powerful, as yet under-exploited, tool for
quantitative studies of eruptive dynamics. The wide range of physical parameters accessible is
potentially valuable for testing mathematical models of eruption jets and plumes.
VOLDORAD is also well suited to the routine monitoring of active volcanoes. It can be sited
at distances of up to 12 km from the vent, making it useful for the monitoring of large, highly
explosive edifices. It functions under harsh weather conditions and has a data-sampling rate
suitable for the study of explosive activity. The relatively low energy consumption allows us
either to set up the system quickly in the field with a small power generator for a limited
period of time, or to run the radar continuously at a site supplied with electric power. In
addition to classical continuous records of temporal series, VOLDORAD has a “trigger”
mode, in which sequences of raw data can be recorded at high sampling rate, without basic
processing and hence visualization. The system can be activated either on command of the
operator [Dubosclard et al., 2004], or by an eruptive seismic signal of some pre-defined
threshold potentially linked to an alarm system. This option is useful when monitoring
isolated explosions interspersed with long intervals of quiet activity, as characteristic of many
120

Chapter IV – Loading features of Strombolian jets
volcanoes. In addition to the immediate benefits for operational surveillance, the long-term
deployment of such radar on active volcanoes would enable to document the variability of
eruptive behaviors and to build databases potentially useful for future eruptions. Combination
with other ground-based methods, such as visual and infrared imagery, broadband seismic,
ultrasound detection and gas analysis would shed light on the complex interactions among
various eruptive processes. Thermal video such as Forward Looking Infrared Radiometer
(FLIR) would be particularly helpful for the study of Strombolian activity. Its capacity to
detect both fine ash plumes and large blocks can bring additional constraints on PSDs. This
method can also provide further insights on Strombolian source conditions [Patrick et al.,
2007]. Besides, our methodology of particle loading estimation could be extended to the study
and monitoring of volcanic ash plumes. With this aim, the coupling of multi-channel satellite
imagery with ground-based radar measurements would be particularly relevant for the
mitigation of risks related to ash clouds and for the investigations on ash plume dynamics.
121


CHAPTER V
Geometrical features of Strombolian jets: insight from
numerical modelling of Doppler-radar spectra


Chapter V – Geometrical features of Strombolian jets
V.1. Introduction
Geometrical features of a volcanic explosion visible at the surface of a volcano often betray
deeper mechanisms at the origin of the eruptive dynamics. Therefore, the acquisition of
quantitative data on geometrical characteristics of Strombolian jets turns out to be an
important source of information for the understanding of Strombolian eruption particularly.
Nevertheless, such quantitative estimates are scarce in the literature. Acquisition of
geometrical data is made difficult because of the complexity of multiple parameters involved
in the mechanism of particle ejection. We call particularly attention to the particles size
distribution (PSD) that may widely vary from one explosion to another, and which is in
addition very difficult to assess precisely. Moreover, volcanic ejecta are moving targets
requiring suitable analysis tools, such as remote sensing methods. Photoballistic
measurements have first been carried out at Etna (McGetchin at al., 1974) and Stromboli
(Chouet et al., 1974). They give some quite accurate geometrical data, but on a very small
number of explosions. Indeed, such photoballistic analyses request a heavy and tedious work
that prevent statistical analysis on long sequences of Strombolian explosions. Active remote
sensing tools such as Doppler radars turn out to be a good alternative for the systematic study
of Strombolian jets. Indeed, Doppler radar measurements permit the detailed analysis of the
eruptive activity at a high sampling rate during long sequences of time. However, some
difficulties remain on the understanding of Doppler radar signal.
The aim of this chapter is to bring more stringent constraints on Doppler spectra recorded by
VOLDORAD, in order to be better interpreted for particularly the understanding of
geometrical processes. The study of Doppler spectra is very complex, as it integrates a lot of
diverse information related for instance to the ejection angle distribution, the velocity of
ejecta, and the particle size distribution. Thus, the thorough inspection of recorded Doppler
spectra only is not sufficient to put constraints on the dynamics of Strombolian jets. For this
reason, we modelled synthetic Doppler spectra from both ballistic model and electromagnetic
scattering model presented in chapter III and IV respectively.
We then make the analysis of two contrasted Strombolian explosions as characteristic tests of
the method developed here for geometrical properties retrieval. Eventually, we give a
statistical set of geometrical features for a large number of characteristic Strombolian
explosion at Etna SEC during the eruption of July 4, 2001.
125

Chapter V – Geometrical features of Strombolian jets
V.2. Recorded volcano Doppler spectra (VOLDORAD)
V.2.1 Data acquisition with VOLDORAD
VOLDORAD is a pulsed Volcano Doppler Radar that permits recordings of backscattered
power and radial velocity of particles crossing the antenna beam axis, and sampled in
successive range gates. The width of each radar range gate is fixed at about 120 m and is
defined by the pulse duration taken here as τ=0.8µs. The height directly depends on the
aperture angle of the antenna beam (α=9°) and on the distance between the centre of the gate
and the antenna array. For the range gate G3, located at slanting distance of 1047, we obtain a
mean height of 165 m (see Chapter II for more details)
Both parameters (backscattered power and radial velocity) are then used to build Doppler
spectra in each sampling volume, and displayed in real-time on the screen of the computer
controlling data acquisition and storage (Figure V.1). The acquisition rate of one set of
Doppler spectra depends on the number of incoherent integrations, taken as inco=1 in the
configuration of this sounding, which leads to a sampling frequency of about 10 Hz. The
maximum radial velocity (Eq. V1) that can be recorded by the Doppler radar depends on the
number of coherent integrations taken here as Cohe=10, which leads to a velocity range up to
about 60 m/s, with a spectral resolution of the velocity axis of 0.9 m/s.
Cohetv
r ××=
4maxλ (V.1)
Where λ is the radar wavelength equal to 23.5 cm and tr is the pulsed repetition interval taken
as 100 µs. Each Doppler spectrum represents the power spectral density S(v) over the range of
radial velocities (v) measured at a given instant in a given range gate. The high resolutions in
the time-domain and frequency-domain, along with the relatively good spatial resolution
allow the detailed analysis of the pyroclasts trajectories and the study of their kinematics
inside the eruptive jet
126

Chapter V – Geometrical features of Strombolian jets
Gate : 567 m Gate : 687 m
Gate : 1167 m Gate : 1047 m
Gate : 927 m Gate : 807 m
Figure V.1. VOLDORAD Doppler spectra occurring at 2135:35 UT on July 4, 2001 at Etna SEC, as
displayed in real-time during the radar sounding. Each spectrum corresponds to the power
backscattered by particles crossing the antenna beam, divided into several successive sampling
volume (so-called range gates) 120-m wide, and ranging from 567 m to 1167 from the radar location.
Figure V.1 is a print-screen of Doppler spectra recorded by VOLDORAD on a Strombolian
explosion, occurring at 2135:35 UT in July 4, 2001 at Etna SEC, as displayed in real-time in
the field. Six successive range gates are reported here, ranging from 567 to 1167 m. Most of
the signal is centred on the range gate at 1047 m (called G3), taking a maximum power value
close to -80 dBW. The range gate G3 is located right above the Southeast crater and present
both positive and negative radial velocities. Range gates located closer to the radar give
mainly negative velocities, particularly for the gates at 687 m, 807 m, and 927 m. At the
opposite, range gates located farther to the radar give mainly positive values, particularly for
the gate at 1167 m. Because of the beam inclination, in typical Strombolian activity most
ascending particles have a radial component of motion away from the radar in the range gates
above the vent [Dubosclard et al., 2004]. They generate echoes with, by convention, positive
velocities and appear on the right side of the spectrum. Reciprocally, falling particles
generally have a radial component of motion toward the radar inducing signal with negative
127

Chapter V – Geometrical features of Strombolian jets
velocities on the left side of the spectrum. Figure V.2 shows the geometric characteristics of
the sounding at Etna SEC during the eruption of July 4, 2001, with particularly the position of
the radar range gates G1 to G4, and the nomenclature of ejection angles as used in the
following study.
Figure V.2. Sketch of the radar sounding geometry at Etna SEC during the eruption of July 4, 2001,
showing the location of 4 range gates (G1 to G4). In this study we focus on the gate G3, positioned right
above the crater. We present the ejection angle (φ) nomenclature as used in the following, with the
vertical axis taken as 0°. Particles ejected toward the radar are indexed minus, and particles ejected
away from the radar are indexed plus.
V.2.2. Spectral moment calculations
From the processing of the series of Doppler spectra in the range gates above the crater and on
either side of the jet axis, times series can be computed for three sets of positive (indexed +)
and negative (indexed -) parameters corresponding respectively to ascending and descending
ejecta.
Firstly, we define the spectral moment of order 0 that corresponds to the power backscattered
by particles moving toward (P-) or away (P+) from the radar within the sampling volume. The
128

Chapter V – Geometrical features of Strombolian jets
backscattered power is derived from the integral of the power spectral density S(v) over the
range of radial velocity intervals dv, i.e., from 0 to for ascending particles and from
to 0 for descending particles:
+maxV −
maxV
( )∫+
=+max
0
V
dvvSP and (V.2) ( )∫−
=−0
maxV
dvvSP
Secondly, we define the spectral moment of first order that corresponds to the mean velocity
weighted by the power spectral density over the positive or negative velocity range
(Eq. V.3). Note that because reflectivity is not a linear function of particle diameters and
because the shape of the spectrum is strongly controlled by the jet geometry, the physical
meaning of is complex and likely different from the average particle velocity.
±meanV
±meanV
( )+
+∫+
=P
dvvvSV
V
mean
max
0 and
( )
−−
∫−
=P
dvvvS
V Vmean
0
max (V.3)
Finally, we define the spectral moment of second order that represents the spectral width of
the Doppler spectrum from to , which can be described as the variance of the
spectral distribution:
−maxV +
maxV
( ) ( )∫+
−
±−=max
max
22V
Vmean dvvSVvσ (V.4)
Remind that maximum radial velocities are defined where the power spectral density S(v) is
equal to the background noise level. In the particular case where positive and negative
patterns of the Doppler spectrum are symmetrical, the spectral width can be obtained simply
by:
+×= max
2 2 Vσ (V.5)
129

Chapter V – Geometrical features of Strombolian jets
This method can be advantageously used, by assuming that most of Strombolian jets are
roughly symmetric, because the negative part of the Doppler spectrum represents both
ascending and descending particles, whereas the positive part of the Doppler spectrum is only
related to ascending particles. Therefore, the contribution of ascending pyroclasts only,
related to the ejection stage in the left part of the Doppler spectrum is difficult to determine.
This effect would bias any estimate of the spectral width based on both negative and positive
velocities.
Figure V.3. Sketch of a typical volcanic Doppler spectrum, showing the spectral moments (power,
maximum and mean radial velocity, and spectral width) as calculated from the power spectral density.
They are indexed (+) and (-) for ejecta with the radial component of their velocity vector moving away
and towards the antenna respectively, except for the spectral width that represents the standard
deviation of the whole spectrum.
Originally, the spectral moments were characterised from weather-radar Doppler spectra. In
meteorological applications, in particular, the backscattered power parameter provides an
estimate of the amount of water droplet, which is related to the precipitation rate. The mean
velocity parameter gives the average velocity of sinking water droplets, and the spectral width
parameter is commonly used to assess the turbulence of the air, related for example to shear
stresses caused by the wind. However, the study of Strombolian volcanic activity is far
different and more localized, so that the interpretation of the spectral moments has to be
considered cautiously, taking into account the radar sounding conditions, along with the
130

Chapter V – Geometrical features of Strombolian jets
complex kinematics and the wide range volcanic particles sizes. In the present study, we aim
at improving our interpretation of volcano Doppler spectra in order to retrieve quantitative
information on the geometrical properties of Strombolian jets.
V.3. Synthetic volcano Doppler spectra (numerical modelling)
The understanding of Doppler spectra from Strombolian volcanic jets turns out to be very
difficult, particularly because of the very large particle size distribution (PSD), ranging from
submillimetric ash to metric blocks. Indeed, the decoupling of ash-sized particles entrained by
expanding gases from larger blocks following ballistic trajectories leads to a wide range of
ejecta speeds, and to large dynamic of the power spectral density spanning several orders of
magnitude. Also, the jet geometry, characterized by ejection angle distribution (EAD) at each
instant, strongly controls the shape of Doppler spectra and varies largely from an explosion to
another.
The thorough inspection of recorded Doppler spectra only is therefore not sufficient to put
constraints on the dynamics of Strombolian jets. This is the reason why we have developed a
complete model that generates synthetic Doppler spectra under controlled geometric
conditions. Recorded Doppler spectra are constructed from radial velocities and the
backscattered power of particles crossing the antenna beam axis. Therefore, in order to build
synthetic Doppler spectra, we need to define (1) the radial velocities from the ballistic model
developed for the kinetic parameters estimate (Chapter III), and (2) the synthetic
backscattered power calculated from the electromagnetic scattering model developed for the
loading parameters assessment (Chapter IV). In the next two sections we present very briefly
both models that have already been introduced.
At the input of the models we have the possibility to define (1) the particle size distribution
(PSD), the one can be chosen as monodisperse (single size particle) or polydisperse (multiple
sizes particles), the latter following uniform, Gaussian, log-normal or exponential distribution.
(2) The ejection angle distribution (EAD) can also be widely varied, from mono-angle to
poly-angles, the latter following isotropic (i.e., uniformly distributed) or anisotropic
distribution. (3) We define for each explosion modelled the initial gas velocity that is the
driving force of the particle ejection and finally (4) the number of particles to launch.
131

Chapter V – Geometrical features of Strombolian jets
Figure V.4. shows the schematic representation of various PSD and EAD configuration that
can be used at the input of our models.
Figure V.4. Sketch of the of particle size distribution (PSD) being monodisperse or polydisperse,
which can follow uniform, Gaussian, log-normal or exponential law. We also present the schematic
representation of ejection angle particle (EAD) being mono-angle or poly-angles, the latter being
isotropic or anisotropic.
V.3.1. Ballistic model
To simulate the ejection of pyroclasts during a Strombolian explosion, we use the two-
dimensional ballistic model initiated by Dubosclard et al. (2004) and developed in this work
(Appendix XX). Kinetic features are then calculated on the basis of equations of motion,
assuming that the two forces acting on each particle are the drag force, and the gravitational
force. We define particularly, the initial velocity of a particle with diameter D (Steinberg and
Babenko, 1978):
( ) DkVDV gp −= 00 (V.6)
where k is a constant, taken as 150 as inferred from previous studies (Chouet et al., 1974,
Ripepe et al., 1993), and the gas velocity as a function of height (Blackburn et al., 1976):
132

Chapter V – Geometrical features of Strombolian jets
( ) ⎟⎟⎠
⎞⎜⎜⎝
⎛ −=
ref
gg z
zVzV γexp0 (V.7)
where γ is a constant taken as 4.6 (Dubosclard et al., 2004) and zref is the height above the
vent such as ( ) grefg VzV 001.0= , and taken as zref=850 m as inferred from video measurements
(Chapter III).
We have modelled here (Figure V.4) a test explosion with a uniform polydisperse PSD
ranging from 0.01 m to 0.1 m, and with an anisotropic poly-angles EAD ranging from -45° to
+45°, centred on the vertical axis. In this test explosion, 4520 particles were instantaneously
propelled upward from the vent, located approximately 50 m beneath the crater rim, by a gas
phase of initial velocity =100 m/s. gV0
Figure V.5. Visual representation of one test explosion modelled from the ballistic model. At the input
we imposed a uniform polydisperse PSD ranging from 0.01 to 0.1 m, nad a poly-angles EAD following
an anisotropic distribution ranging from -45 to +45°. The initial gas velocity is taken as 100 m/s, with
4520 particles launched.
133

Chapter V – Geometrical features of Strombolian jets
The velocity of each particle is calculated from the numerical integration of the equations of
motion at each time step and its radial component is readily obtained. We show in Figure V.6
the temporal evolution of the mean and maximum radial velocity in the radar range gate G3
and G4, located respectively at 1047 m and 1167 m to the radar, for the test explosion as
calculated by the ballistic model. Importantly, the mean radial velocity calculated here
represents the real average velocity of all particles, whereas the maximum radial velocity
corresponds to the velocity of the fastest particle, both calculated inside the considered range
gate, along the antenna beam axis at each time step.
(b)(a)
Figure V.6. Time series inferred from the ballistic model for the test explosion modelled previously. (a)
We provide the mean radial velocity in range gates G3 and G4, representing the average velocity of all
particles in a given range gate at each time step. (b) We give the maximum radial velocity in the same
two range gates, representing the velocity of the fastest particle in a given range gate, at each time
step.
We find that the patterns for mean and maximum velocities are rather similar in the range gate
G4, whereas they differ significantly in the range gate G3, located right above the vent These
differences come from the radar sounding geometry, in particular the lateral offset of the
range gate G4 to the vent and the inclination of the beam axis (θ=23°). The radial component
of velocity (i.e. along the beam axis, as measured by the radar) becomes lower as particle
trajectories depart from the beam axis, and ultimately reaching zero when the particle
trajectory is perpendicular to the beam axis (i.e., = 90°+θ).
Most particles in the range gate G3 (above the vent) have a trajectory with a strong vertical
component; therefore the average of all particle radial velocities (17m/s) largely
underestimates the real mean velocity of the whole jet at this instant. At the opposite, particles
134

Chapter V – Geometrical features of Strombolian jets
trajectories in the range gate G4 become much more tangent to the beam axis as particles
incline during the ballistic flight, giving better estimate of the real mean velocity (43 m/s).
Note however, that velocities of particles inside the gate G4 have already slowed down
because of the large distance covered from the emission source.
Also, in the configuration of our radar sounding, the maximum value of the radial velocity in
gate G3, peaking at 47 m/s in Figure V.6b, leads to a slight underestimation of about 20% of
the real maximum velocity (56 m/s). This difference is related to the ejection angle of the
particle that is never parallel to the antenna beam axis in the range gate G3. Indeed, if we take
the bottom right hand corner of this range gate as maximum inclination (55°), we obtain from
equation V.7 a geometrical correction coefficient of about 1.2, which is fully consistent with
the ratio of real maximum velocity with radial maximum velocity.
( )θ−=55cos
radreal
VV (V.7)
Finally, the peak value of the maximum radial velocity calculated in the range gate G4 is
slightly lower (44 m/s) than the one inferred from range gate G3. This difference can be easily
explained by the natural speed decrease of particles with height. Note that very rapidly, the
maximum radial velocity in range gate G4 becomes faster than in the range gate G3, actua
lly, it is a competition between both effects, i.e., the distance covered by the particle and the
angle of its trajectory).
V.3.2. Electromagnetic scattering model
The power backscattered by particles is derived from the electromagnetic wave scattering
theory of Mie (1908), using the complete set of equations applied to our specific case given in
Gouhier and Donnadieu (2008). A good approximation can be obtained with advantageous
computing time applying the Rayleigh analytical solution, but only for particles of diameter
smaller than λ/4, i.e. ~5.9 cm in our case (Gouhier and Donnadieu, 2006). However,
considering the wide range of particle diameters characterizing Strombolian activity, the Mie
scattering theory is required to account for the effects of larger particles.
135

Chapter V – Geometrical features of Strombolian jets
Theoretically, the power backscattered to the radar by a population of such particles in a given
range gate is proportional to their radar reflectivity (η). The echo-power can then be defined
as:
4RVC
P sr η= (V.8)
where Cr is the radar constant, Vs, the sampling volume, and R, the slant distance between the
radar and the target. The radar constant is defined by a set of technical parameters related to
the radar configuration. The radar reflectivity (η) is the sum of the backscattering cross
sections of the individual particles per unit volume (see Appendix B for more details)
Figure V.7. Time series inferred from the electromagnetic scattering model, for the test explosion
modelled previously. We provide the synthetic power calculated from the complete Mie formulation
that corresponds to the echo-power backscattered by particle in range gate G3 and G4 at each time
step.
The backscattered power of each particle is calculated from the electromagnetic scattering
model at each time step. We show in Figure V.7 the temporal evolution of synthetic power in
the radar range gate G3 and G4, located respectively at 1047 m and 1167 m to the radar, for
the same test explosion. The synthetic echo power signal in the gate G3 gives higher values,
peaking at -47 dBmW, and last shorter than in the gate G4. Both features can be explained by
the fact that a majority of emitted particles cross the closest gate (G3), the one located right
above the vent. Then, particles enter the next range gate (G4) with a delay related to the time
for particles to cross the gate G3. Moreover, their velocities have significantly decreased and
hence the resident time in the gate G4 is longer.
136

Chapter V – Geometrical features of Strombolian jets
V.3.3. Synthetic Doppler spectra
From the acquisition of both radial velocities and power values derived from the ballistic and
the electromagnetic scattering models respectively, we are able to construct synthetic Doppler
spectra. A time step of 0.1 s was chosen to correspond approximately to the acquisition rate of
Doppler spectrum by VOLDORAD (∼10 Hz). The velocity range in the synthetic Doppler
spectrum (abscissa) can be adapted according to the conditions of the modelled explosion, and
is commonly taken at ±60 m/s with a spectral resolution of 1m/s, i.e., 120 velocity classes
over the whole spectrum range, each associated with the power backscattered by particles
having a radial velocity falling in the class under consideration. The distribution of power
among the velocity classes defines the power spectral density, expressed in dBmW (mW in
Log10 scale).
In figure V.8 we show a synthetic Doppler spectrum in the range gate G3 (1047 m) calculated
from the test explosion described above. We observe that the synthetic Doppler spectrum is
quite triangular and roughly symmetric around its mode at about 15 m/s. Indeed, most of the
signal is centred on the positive part of the Doppler spectrum, which is due to the geometry of
the radar sounding. Note that in what follows, we will not take into account the quantitative
measurements of the power parameter. Indeed, bearing in mind the huge amount of particles
necessary to reproduce real Strombolian explosions and the long related time to compute, we
will only model smaller explosions of a few thousands of particles. However, quantitative
measurements of kinetic parameters are not affected by this simplification and can be deeply
exploited. Also, considering the logarithmic scale of power values, the global shape of
Doppler spectra is preserved, and can be compared with the ones derived from Doppler radar
measurements.
Then, we are able to calculate the synthetic spectral moments from equations given in
section V.2. We obtain a synthetic maximum positive radial velocity of = 47 m/s, note
that in the case of modelled Doppler spectrum there is no noise level, and hence even one
very fine particle can lead to the calculation of the maximum velocity. Moreover, we point out
that the peak of maximum radial velocity obtained from the Doppler spectrum analysis (i.e.,
in the same way as the radar), is equal to the maximum jet velocity observed in the time
series. This result emphasises that maximum velocities are not biased by the power
synthV +max
137

Chapter V – Geometrical features of Strombolian jets
distribution. We find a synthetic mean radial velocity of = 11 m/s. Remind that the
mean velocity parameter, inferred from Doppler spectrum calculation (moment of order 1), is
weighted by the power spectral density over the whole positive or negative range. Therefore,
this value differs from the mean radial particle velocity (17 m/s) as calculated from time series
from Figure V.6. As a consequence, in addition to the geometric bias on the estimation of real
velocities, this result stresses the influence of the power distribution among the different
velocity classes, and hence of the particle sizes on the assessment of the mean velocity, as
calculated from radar data.
synthmeanV +
Figure V.8. Synthetic Doppler spectrum of the test explosion modelled from the ballistic and
electromagnetic scattering model, showing the power spectral density as a function of radial velocity.
Spectral moments (spectral width, maximum and mean velocities) are calculated in the same way as
VOLDORAD.
138

Chapter V – Geometrical features of Strombolian jets
V.4. Parametric tests
Any volcanic Doppler spectrum is potentially a great source of information on the explosion
dynamics, particularly from the study of its shape and its spectral moments. Simple parameter
comparisons made in previous sections show the complexity in the analysis of volcanic
Doppler spectra. Henceforth, we identify two main factors influencing the spectral patterns
(1) the sounding geometry strongly controls measured radial velocities, and (2) the numerous
particle sizes additionally account for the variability of ejecta speeds. In the following (Figure
V.9), we carry out simple parametric tests to assess the contribution of both potential biases in
the Doppler-radar measurements.
V.4.1. Ejection angle vs. particle sizes distribution sensitivity
Figure V.9a shows a synthetic Doppler spectrum with a single peak at v=30 m/s resulting
from the simplistic case of a single particle of diameter D=0.03 m (monodisperse PSD)
launched vertically at φ=0° (mono-angle EAD).
In Figure V.9b, a narrow Doppler spectrum (spectral width <10 m/s) is modelled with
particles ejected also vertically (mono-angle EAD), but using a uniform polydisperse PSD
with diameter ranging from 0.003 m to 0.06 m. Therefore, we show that a wide PSD does not
account for a large dispersion of radial velocities recorded on Doppler spectra.
Contrastingly, we modelled in Figure V.9c an explosion with a monodisperse PSD with a
diameter D= 0.03 m, launched with an isotropic poly-angle EAD ranging from -45° to +45° of
the vertical. We observe a top-hat Doppler spectrum with a large spectral width, close to 80
m/s. This clearly emphasizes the overall influence of the aperture of the ejection cone on
measured radial velocities.
A more realistic simulation is shown in Figure V.9d, where particles were launched over a
wide range of ejection angles (-45° to +45°) following an isotropic EAD, for two distinct
particle size distributions: (1) the first one, ranging from 0.003m<D<0.03m, aims at
representing the fine particles, and (2) the second one stands for larger particles, ranging from
0.03m<D<0.06m. The Doppler spectrum corresponding to fine particles have a lower spectral
density, which is easily explained by the fact that small particles scatter dramatically less than
139

Chapter V – Geometrical features of Strombolian jets
large particle. For instance, the power backscattered by particles with D=0.06 m is
proportional to their diameter to the power of sixth (Rayleigh domain). Moreover, the spectral
width of the fine particle Doppler spectrum is larger due to the fact that small particles, having
a low inertia, are propelled with higher initial velocities, close to that of the gas, enlarging the
range of measured radial velocities. Despite large geometrical effects on the shape of spectra,
we can nevertheless identify qualitatively power and velocities variations due to changes in
particle size.
(d) (b)
(c) (a)
Figure V.9. Plot of some parametric tests showing the contribution of ejection angle distribution (EAD)
and particle size distribution (PSD) on the variability of volcanic Doppler spectrum. (a) Both PSD
(D=0.03m) and EAD (φ=0°) are monodisperse. (b) EAD is still monodisperse (φ=0°) but with a uniform
polydisperse PSD ranging from 0.003m<D<0.06m. (c) At the opposite, we provide a monodisperse
PSD (D=0.03m) with an isotropic poly-angles EAD ranging from -45<φ<+45 and centred vertically. (d)
We provide a Doppler spectrum with both polydisperse PSD (0.003m<D<0.06m) and poly-angles EAD
(-45<φ<+45).
140

Chapter V – Geometrical features of Strombolian jets
V.4.2. Ejection angle anisotropy
Lots of other parametric tests have been carried out in order to refine our interpretation on
radar Doppler spectra. We do not aim at presenting all of them exhaustively, but just to sum
up the main characteristics that may control the shape of Doppler spectra. We have shown
previously the dominant role played by the ejection geometry and, to a lower extent, by the
range of particle sizes. However, all explosions modelled so far were isotropic. We now
investigate how sensitive is the shape of a Doppler spectrum to the ejection angle distribution
(EAD) variability.
In figure V.10, two explosions are modelled with different poly-angles EAD and a fixed
monodisperse PSD with diameter D=0.01m. For each explosion tested, the maximum power
is the same (Pmax = -96 dBmW), as well as the maximum positive radial velocity
( = 50 m/s); only the curvature of the Doppler spectrum turns out to be variable. Two
main shapes can be identified: top-hat and triangular Doppler spectra.
+maxV
The first explosion (figure V.10a) follows an isotropic poly-angles EAD, ranging from -45° to
+45°. It means that the same amount of volcanic material is included in a wide range of
ejection angle. This feature can be directly interpreted from the Doppler spectrum plateau
ranging from about -15 m/s to 30 m/s, and leads to a top-hat Doppler spectrum. Henceforth,
we make the distinction between the plateau spectral width ( =45 m/s) and the total spectral
width ( = 70 m/s).
2pσ
2tσ
At the opposite, the second explosion (figure V.10b) follows an anisotropic (Gaussian) poly-
angles EAD, ranging from -45° to +45°. It means that the amount of volcanic material
dramatically decrease for high angle values (from the vertical). This characteristic is clearly
seen on the Doppler spectrum by a severe decrease of the power spectral density with
increasing radial velocities from the single peak power value. Indeed, there is no plateau
component, and we define this Doppler spectrum as triangular. Thus we only give an estimate
of the total spectral width, found to be the same as for explosion one ( = 70 m/s). Remind
that in the case of Doppler spectra recorded by VOLDORAD, we do not use the negative part
of the Doppler spectrum for the total spectral width measurement (see section V.2 for details).
As a comparison, by using the alternative equation V.5, the total spectral width is taken as
twice the maximum positive radial velocity (i.e., 100m/s), which fairly differs from the first
calculation.
2tσ
141

Chapter V – Geometrical features of Strombolian jets
(b) (a)
Figure V.10. Plot of parametric tests showing the effect of an anisotropic ejection angle on the shape
of Doppler spectra. We point out two distinct shape: (a) Top-hat-shaped Doppler spectrum related to
the isotropic EAD, and (b) triangular-shaped Doppler spectrum related to the anisotropic EAD.
V.4.3. Mean ejection angle inclination
We have finally carried out some parametric tests to assess the sensitivity of Doppler
spectrum shape to the jet inclination. Figure V.11 shows four Spectra modelled by following
an anisotropic (Gaussian) EAD inclined at 20°, 0°,-20°, and -40° to the vertical. Note that all
Doppler spectrum patterns are triangular as expected from such an ejection angle distribution.
All Doppler spectra are modelled with a monodisperse PSD using a diameter of 0.01 m, and
with an initial gas velocity of 100 m/s.
Interestingly, qualitative information on the jet inclination can be retrieved from the mode of
the Doppler spectra, i.e. the radial velocity corresponding to the maximum power. In these
examples, power mode values fall respectively at 45 m/s, 25 m/s, 0 m/s, and -30 m/s.
Remarkably, the vertically oriented jet induces a power mode at a singular radial velocity Vφ=0
= +25 m/s with the initial conditions chosen previously. Consequently, jets inclined away
from the radar (φ>0°) generate a power mode above this threshold radial velocity, whereas
jets inclined toward the radar (φ<0°) generate a power mode below Vφ=0. Note that the power
mode is found at 0 m/s when the main jet axis is perpendicular to the beam, that is to say
inclined toward the radar at about -θ relative to the vertical (i.e., φ= -23°).
142

Chapter V – Geometrical features of Strombolian jets
(c) (d)
(b) (a)
Figure V.11. Plot of parametric tests showing the sensitivity of Doppler spectrum shape to the jet
inclination. The PSD is monodisperse (D=0.01m) and all EAD are anisotropic and poly-angles, only
the mode of the distribution changes taking values of (a)+20° (b) 0°, (c) -20°, and (d) -40°.
Parametric tests achieved in this section point out the potential information held in Doppler-
radar spectra for understanding the dynamics of volcanic jets. We show in the following
sections that some of these singular characteristics can be used advantageously on Doppler
spectra recorded by VOLDORAD at Mt. Etna, to retrieve geometric parameters characterizing
eruptive jets.
143

Chapter V – Geometrical features of Strombolian jets
V.5. Geometrical properties of two contrasted Strombolian explosions In this section, we characterize the geometrical aspects of Strombolian jets produced by Mt.
Etna SEC. Typical Strombolian activity consists of a series of large bubbles rising from depth,
and bursting at the surface of the magma column (Vergniolle and Brandeis, 1996). The bubble
overpressure release is then responsible for the ejection of fine ash to large disconnected
blocks above the vent, finally crossing the radar beam. The dynamics of Strombolian
explosion is fairly complex, and the study of the geometrical characteristics of such volcanic
jets should bring constraints on the physical source mechanisms at work. We focus here on
two particular explosions occurring on July 4, 2001, showing contrasted geometrical features.
The analysis of Doppler spectra recorded by VOLDORAD brings out two main distinct
shapes: top-hat and triangular. In what follows, we aim at reproducing the shape of recorded
Doppler spectra for two distinct explosions occurring at 2143:04 UT and 2139:34 UT
showing top-hat and triangular shape respectively. In order to build synthetic Doppler spectra,
we need to define three types of variable input parameters: (i) the initial gas velocity, (ii) the
ejection angle distribution (EAD) and (iii) the particle size distribution (PSD).
The PSD is defined by the number N of particles with diameter D, the distribution being
monodisperse or polydisperse. An EAD is defined by the range of ejection angles, the
direction of the main jet axis (inclination) and the spacing between angles. The latter reflects
the particle concentration among the different angles and characterise the jet isotropy or
anisotropy within the dispersion cone. These parameters have been adjusted so as to best fit
the shape of the recorded Doppler spectrum, without trying to match the real power
amplitude.
V.5.1. Top-hat-shaped spectra
In Figure V.12, we have reproduced an explosion that occurred on July 4, 2001 at 2143:04 UT
during the paroxysm of the eruptive episode. In this example, the overall shape of the
recorded Doppler spectrum is typically top-hat, with two distinct parts: (1) a large plateau
characterised by a spectral width of =35 m/s, and bordered by (2) a sub-vertical slope
reaching the noise level at =38 m/s. The corresponding video snapshot shows the
uprising of a very large bubble expanding above the crater rim, whose bursting ejects lava
2pσ
+maxV
144

Chapter V – Geometrical features of Strombolian jets
clots in all directions within a hemispherical ejection cone, suggesting an isotropic
concentration of particles moving radially from the vent and ejected with quite homogeneous
velocities.
Figure V.12. (a) Video snapshot of the explosion occurring at 2143:04 UT at Etna SEC during the
eruption of July 4, 2001. (b) Visual representation of this explosion modelled from the ballistic model.
(c) VOLDORAD Doppler spectra recorded at 2143:04 UT; note that ground-echoes have been
removed. (d) Corresponding synthetic Doppler spectra modelled from both ballistic and
electromagnetic scattering models. This example is related to the top-hat-shaped Doppler spectrum
(see text for more details).
Previous photoballistic studies at Etna have shown for one explosion of the North-East Crater,
in June 1969, that 50% of ejecta have a size between 0.1 m and 0.4 m (McGetchin et al.,
1974). Ground deposits studies have also pointed out similar sizes of scoria blocks produced
by Strombolian activity at Etna on July 25-31, 2001 (Metrich et al., 2004). Modelling of
acoustic waves at Etna have provided a characteristic thickness of the magmatic film
145

Chapter V – Geometrical features of Strombolian jets
overlying the gas bubble right before its rupture, assumed to be on the order of the average
size of the blocks formed thereafter of about 0.1 m (Vergniolle and Ripepe, 2008).
These constraints on the particle sizes at Etna led us to run our model on this explosion
(Figure V.13a) with a load of single-sized particles of diameter D=0.1m (monodisperse PSD)
ejected (Figure V.13b) over a wide range of angles (-45°<φ<45°) covering the whole gate G3,
with an isotropic distribution (isotropic poly-angles EAD). Note that this kind of event is not
the most common, occurring mainly during the paroxysmal phase when the magma level in
the conduit is high and partly fills the crater cavity.
Figure V.13. Input characteristics for the modelling of explosion at 2143:04 UT. (a) PSD following a
monodisperse distribution (D=0.1m) and (b) EAD following an isotropic poly-angles distribution ranging
from -45° to+45° an centred vertically.
We have successfully reproduced in figure V.12d a top-hat shaped Doppler spectrum with a
large plateau, with a spectral width slightly superior ( = 40 m/s) and a slope somewhat
steeper, but, most importantly, with an equivalent maximum radial velocity ( =38 m/s).
Note that we did not aim at reproducing real power values, although this could easily be
achieved by increasing the number of particles, because the computing time would be too
long. This however by no way interferes with quantitative results related to geometrical or
velocimetric parameters. This result confirms that the top-hat Doppler spectrum is therefore
typically representative of an isotropic distribution of ejecta emitted mainly radially from the
source vent.
synthp2σ
synthV +max
Rigorously, the spectral width of the plateau directly corresponds to a range of ejection angles
bearing a similar amount of ejecta, i.e. the isotropic part of the jet. For a spectral width plateau
146

Chapter V – Geometrical features of Strombolian jets
of about = 35 m/s, we deduce an isotropic ejection cone about 90° wide (-45° to +45°),
spreading entirely over the radar range gate G
2pσ
3. The resulting initial gas velocity found with a
single-sized class of particles of diameter 0.1 m is about = 75 m/s. On the other hand, the
slope of the observed Doppler spectrum is not strictly vertical, unlike the synthetic spectrum.
The likely explanation is twofold: (1) the particle size distribution is more likely polydisperse
to some extent, including particularly additional smaller particles that contribute to a weak
amount of power over the full spectrum. This effect is overprinted by the large amount of
power backscattered by large blocks within their characteristic range of radial velocities
(plateau) and, as small particles are entrained faster, can only be seen on the outer part of this
range, leading to the non-vertical slope of the spectrum. (2) The concentration of ejecta
(distribution of ejection angles or of amount of particles) might depart from purely isotropic at
high angles, with less particles emitted laterally. This depletion of ejecta is commonly
observed on the sides of other jet types and this might also occur to some extent for large
bubble outbursts and contribute to non-vertical slopes of the spectra. Both effects are most
likely at work, even though they are not preponderant in the generation mechanism of top-hat
Doppler spectra.
gV0
V.5.2. Triangular-shaped spectra
We have also modelled a second type of explosion that occurred on July 4, 2001 at
2139:34 UT (Figure V.14). This brief Strombolian explosion (emission time interval ≈ 2 s) is
typical of a dense Strombolian jet, caused by the bursting of an overpressurized bubble at the
top of the magma column. In this case, the magma column is lower in the conduit, and
probably does not fill the crater. The bubble bursting then occurs under the crater rim level
within a more confined space, and partially constrained vertically by the crater walls or the
conduit.
147

Chapter V – Geometrical features of Strombolian jets
Figure V.14. (a) Video snapshot of the explosion occurring at 2139:34 UT at Etna SEC during the
eruption of July 4, 2001. (b) Visual representation of this explosion modelled from the ballistic model.
(c) VOLDORAD Doppler spectra recorded at 2139:34 UT; note that ground-echoes have been
removed. (d) Corresponding synthetic Doppler spectra modelled from both ballistic and
electromagnetic scattering models. This example is related to the triangular-shaped Doppler spectrum
(see text for more details).
The video analysis reveals that the jet is mainly vertical, with a higher concentration of
particles in the inner core, as indicated by the higher intensity of light scattered. The mean
size of ejecta seems also smaller than that of the explosion at 2143:04 UT. From these
observations we assume here again a monodisperse PSD, with diameter D=0.08 m and an
anisotropic EAD, having a maximum concentration along the vertical axis (φ=0) and
decreasing sideways.
148

Chapter V – Geometrical features of Strombolian jets
Figure V.15. Input characteristics for the modelling of explosion at 2139:34 UT. (a) PSD following a
monodisperse distribution (D=0.08m) and (b) EAD following an anisotropic poly-angles distribution
ranging from -40° to+40° an centred vertically.
The recorded triangular-shaped Doppler spectrum is representative of many Strombolian lava
jets, and differs from a top-hat spectrum in that it does not have any plateau component. It
only comprises two non-vertical slopes, generally straight but sometimes slightly concave in
its right part (v>0), with a single power maximum at VMOD. In this example, VMOD ≈ 20 m/s
and the right slope reaches the noise level at =58 m/s, and the total spectral width is
found to be =90 m/s (or 116 m/s if calculated as 2× ). Using the input parameters
summarized in Table V.1, and ignoring possible effects of a polydisperse particle size
distribution, the triangular-shaped Doppler spectrum can nevertheless be satisfactorily
reproduced. We obtain the same values of synthetic maximum radial velocities
( =58 m/s) and total spectral width ( =90 m/s).
+maxV
2tσ +
maxV
synthV +max
syntht2σ
We are thus able to give an interpretation of such triangular-shaped Doppler spectra, in terms
of parameters controlling the geometrical features of Strombolian lava jets. In the case of
explosion occurring at 2139:34 UT, we find that the particle concentration profile must be
strongly anisotropic (taken here as Gaussian) to account for the observed spectrum. We have
calculated that about 80% of the total amount of particle are ejected within a dispersion cone
20° wide centred on the vertical axis, the remaining 20% being distributed between this inner
cone and the limit of the range of ejection angles (from -40° to -10° and from +40° to +10°).
The important depletion of particles on the sides of the jet, i.e. at high ejection angles,
explains the slanted slope of the triangular Doppler spectrum.
149

Chapter V – Geometrical features of Strombolian jets
Note that the explosion gives most of the signal in the right positive part of the Doppler
spectrum as VMOD = +20 m/s. This result is characteristic of a lava-jet explosion ejected
mainly vertically, and confirms that information on the jet inclination can be retrieved directly
from Doppler spectra. Finally, we obtain an initial gas velocity for this explosion of =
112 m/s.
gV0
Table V.1. Input parameters of the forward model for explosion 1 (21h43:04 UT) and 2 (2139:34 UT).
PSD EAD
gV0 Particles monodisperse Range Inclination
Explosion 1 75 m/s N=608 0.1 m Isotropic: -45° to +45° 0° Explosion 2 112 m/s N = 510 0.08 m Anisotropic: -40° to +40° 0°
V.6. Statistical analysis of geometrical features for a large number of characteristic Strombolian explosions
The detailed analysis of two particular Strombolian explosions has pointed out the close
relationships between the Doppler spectrum shape and the geometry of the volcanic jet. We
have shown particularly that under the assumption of a monodisperse PSD, we are able to
retrieve the concentration of particles along the angular profile. Therefore, some quantitative
estimates of geometrical parameters are given in this section for more than 200 Strombolian
explosions.
V.6.1. Relationship between radial velocity and ejection angle
In order to provide statistical results on a large number of events relatively quickly, we have
constructed abacus (Figure V.16) so as to retrieve the aperture of the dispersion from the
measured radial velocity range.
Figure V.16a shows the relation between radial velocities and ejection angles for different
values of initial gas velocities ranging from 60 to 160 m/s, and for a constant particle diameter
taken as D = 0.1 m, as defined previously as the best average value. We observe that the
variability between each curve is relatively important, however, bearing in mind the initial gas
velocity values obtained from both explosions studied previously (75 and 112 m/s), we
choose an average value of =100 m/s as reference initial gas velocity. Note that for a
vertical ejection angle, as it is the case for most of particles ejected within lava-jet explosions,
gV0
150

Chapter V – Geometrical features of Strombolian jets
we obtain a low radial velocity of 12 m/s. Moreover we notice that a radial velocity of 0 m/s
is measured for an ejection angle of -18.5° from the vertical, i.e., perpendicular to the lower
boundary axis of the antenna beam.
Inversely, figure V.16b shows the relation between radial velocities and ejection angles for
different diameters ranging from 0.01 to 0.2 m, and for a constant initial radial velocity taken
as =100 m/s, as defined for the reference value. The variability is lower in this case, and
the choice of the reference diameter looks less critical. Therefore, we select an average value
of D = 0.1 m as reference diameter, for the reasons mentioned in section V.5. In the
following, we thus take into account for the statistical analysis, values relative to the curve
with D = 0.1 m and = 100 m/s.
gV0
gV0
Figure V.16. Abacus showing the relationship between the radial velocity and the particles ejection
angle (a) for different initial gas velocities and constant diameter (D=0.1m) and (b) for different
diameters and constant initial gas velocity (100 m/s).
V.6.2. Statistical analysis of isotropic distributions
In this study, we carried out measurements on about 200 explosions that took place between
21:00 U.T. and 21:45 U.T. during the paroxysmal phase of the eruption of July 4, 2001 at
Etna SE Crater. The detailed analysis of the explosion at 2143:04 UT has pointed particularly
the close relationships between the plateau spectral width ( ) and the geometry of the
volcanic jet. The statistical analysis of Doppler spectra, once the ground echoes have been
removed, gives only 8% of explosions with a typical top-hat-shaped spectrum, comprising a
large plateau bordered by sub-vertical slopes. Then 34% of Strombolian events have a purely
2pσ
151

Chapter V – Geometrical features of Strombolian jets
triangular-shaped spectrum (without plateau) and are thus characterised by a single power
maximum. The majority (58%) of the explosions studied have a spectrum shape intermediate
between both end-members described above. They are characterised by a plateau bordered by
non-vertical slopes.
We show in figure V.17 the proportion of Strombolian explosions as a function of the range
of ejection angles with similar amount of ejecta (isotropic dispersion cone), as measured from
the plateau spectral width from explosions having purely or intermediate top-hat-shaped
spectra. They represent 66% of the total of explosions studied. We show that 70% of these
top-hat-shaped spectra (i.e. 45% of the total jet) present an isotropic distribution of ejecta
within a cone φw ≤ 35° wide. Then, 90% (i.e. 60% of the total jet) present an isotropic
distribution of ejecta within a cone φw ≤ 50° wide. Finally, only 10% (i.e. 7% of the total jet)
of top-hat-shaped spectra have an isotropic distribution φw ≥ 50°.
These results show the variability of geometrical features of Strombolian jets within a one
hour time scale, and hence the variation of the physical source conditions at the origin of their
formation. We observed particularly an augmentation of top-hat-shaped Doppler spectrum
events between 21h30 U.T. and 21h45 U.T., which corresponds unsurprisingly to the moment
where the magma column was the highest and partly filled the crater. One can suppose that, in
this configuration, overpressurized bubbles reaching the top of the magma column could
expand more easily in the large magma-filled crater and then burst without physical
constraints from the crater or conduit boundaries, leading to the quite hemispherical ejection
of pyroclasts often seen over the crater rim.
At the opposite, when the level of the magma column is lower, gas slugs burst out deeper in
the conduit, promoting vertical rather than lateral gas expansion near the surface, thus limiting
the ejection of lava fragments sideways. The lava drainage is then mainly vertical, leading to
narrower oriented Strombolian jets. These results are consistent with deductions from
previous photoballistic studies at Etna North-East Crater. McGetchin et al. (1974) showed for
one explosion that the ejection angles are distributed uniformly (i.e., isotropic) within a
dispersion cone 30° wide.
We find for 50% of the total of explosions studies, representing more than 100 Strombolian
explosions, that ejection angles are distributed uniformly within a dispersion cone of about
φw = 40° wide in average. The fact that similar results were reached by totally independent
152

Chapter V – Geometrical features of Strombolian jets
methods and on different Strombolian eruptions suggests that 30-40° might be a statistically
representative value for the isotropic ejection cone of lava jets, at least at Etna. Note that
particles are also present outside this cone, although at concentrations decreasing sideways.
Figure V.17. (a) Plot showing the proportion of top-hat and total Strombolian explosions as a function
of the range of ejection angles with similar amount of ejecta (see text fore more details). (b) Sketch
showing the conceptual correspondence between the plateau spectral width and the isotropic
dispersion cone.
V.6.3. Ejecta concentration inside the dispersion cone
In this section, we examine the proportion of particles inside the jet for all explosions studied.
Remind that the power backscattered by particles is related to the number (N) of particles
crossing the radar beam and their diameter (D) to a certain power x (P ∝ NDx) that depends on
the scattering domain (Rayleigh or Mie). Keeping our assumption that the ejecta sizes can be
represented by a unique diameter (monodisperse PSD), the backscattered power recorded by
VOLDORAD can be used advantageously to retrieve a relative concentration estimate of
single-sized particles within the ejection angle profile. We focused in what follows, on the
concentration of particles comprised within a dispersion cone of φw=35° wide, because it is a
reference aperture angle of typical Strombolian explosions as shown previously.
153

Chapter V – Geometrical features of Strombolian jets
Figure V.18 shows that 50% of all Strombolian explosions studied (i.e., representative of the
typical Strombolian explosion) are found to have ≥83% of the particle load within a
dispersion cone 35° wide, whereas only 20% of all Strombolian explosions have over 90% of
the total particle load within an ejection cone 35° wide. Comparatively, a photoballistic study
carried out on one explosion at Stromboli in September 1971 [Chouet at al., 1974] has shown
that 90% of the total of particle load was ejected within a dispersion core 37° wide. These
values are also in agreement with the ones inferred from our Doppler spectra analysis, which
illustrate that typical Strombolian explosions have most of their pyroclastic material (80–
90 %) within a relatively narrow dispersion cone (30–40°).
Also, these results illustrate the variability of the Strombolian activity at Etna, which is related
to the variation of physical source conditions. We speculate that the level of the magma
column, and hence of the bubble bursting, is the predominant source of variability, although
other mechanisms may play a role. For instance, the PSD is polydisperse in real jets and
fragmentation conditions may also vary from one explosion to another, likely accounting for
differences in particle size distribution and hence, on the dynamics of Strombolian jets.
Figure V.18. Plot showing the proportion of particles inside the jet for a dispersion cone 35° wide,
taking into account all explosions studied.
154

Chapter V – Geometrical features of Strombolian jets
V.7. Discussion
This study has provided some interesting geometrical features on typical Strombolian jets.
Particularly, we point out two distinct signatures: Top-hat-shaped Doppler spectrum related to
isotropic ejection angle distribution (EAD), and Triangular-shaped Doppler spectrum related
to anisotropic ejection angle distribution. In addition we were able to give statistical
quantitative information on geometrical features carried out on a large number of typical
Strombolian explosions. Particularly we find that 30-40° might be a statistically representative
value for the isotropic ejection cone of Strombolian lava jets, at least at Etna, and we search
out that typical Strombolian explosions contain most of their ejecta (80–90%) within a
relatively narrow dispersion cone (30–40°) centred vertically.
However some uncertainties remain, and assumptions included into the models can be
discussed. For instance, the gas velocity decrease law included in ballistic model is poorly
constrained. The decrease coefficient zref has been defined from video measurements
(Chapter III) and taken as constant. The gas velocity decrease law could probably be better
constrained from infrared measurements. In addition, bearing in mind the complexity of the
scattering processes, the electromagnetic scattering model carries some simplifying
assumptions: particularly, we assume particles to be compositionally homogeneous, spherical,
and homogeneously distributed inside the sampling volume. Nevertheless, these effects are
most likely balanced by the large statistical number of particles comprised in a range gate.
Some problems may also arise from technical difficulties related to the radar, such as aliasing
of the signal, or ground echo-power. However these questions can be easily avoided, or even
treated from automatic procedures.
One of the most disputable points is related to the assumption formulated in the statistical
analysis. Indeed, we have given geometrical results based on the theoretical relation between
radial velocities and jet aperture angles; the one strongly depends on the initial gas velocity
and the particle size. Because of the large (>200) number of explosions to analyse,
calculations have been carried out using a mean initial gas velocity (100 m/s) and a mean
diameter (0.1 m). We know that the initial gas velocity, especially, varies widely from one
explosion to another, and hence could account for a small bias in the analysis of geometrical
data.
In the same way, we point out that synthetic Doppler spectra do not reproduce the echo-power
values given by VOLDORAD because the computing time would be too long. Note however
that it could easily be achieved by increasing the number of particles to model.
155


SECOND PART
MULTI-METHOD APPROACH


Résumé – Deuxième partie
RÉSUMÉ : DEUXIÈME PARTIE
Dans cette deuxième partie nous nous sommes intéressés à l’étude des mécanismes qui sont à
l’origine de l’émission du matériel volcanique en surface. Comme on l’a vu précédemment,
l’activité éruptive des volcans basaltiques est essentiellement de type Strombolien, au moins à
l’Etna. Le mécanisme de ces éruptions est associé à la remontée de grandes poches de gaz qui
se forment en profondeur par coalescence d’une mousse riche en bulles de gaz qui s’effondre
sur elle-même de manière cyclique. Pendant sa remontée dans le conduit, la bulle de gaz
surpressurisée (slug) se décomprime et grandit corrélativement jusqu’à son arrivée à la
surface où la bulle se dilate en soulevant une fine épaisseur de magma qui se fragmente en
blocs de lave pendant l’éclatement de la bulle, eux-mêmes éjectés par le relâchement du gaz
surpressurisé.
Dans le chapitre 6, nous avons focalisé notre attention sur les tous derniers stades de
l’ascension de la bulle : depuis sa rapide expansion au sommet de la colonne magmatique
jusqu’à son éclatement. Nous avons réalisé ce travail à partir de données acoustiques et vidéo
sur des explosions Stromboliennes se produisant pendant le paroxysme de l’éruption du 4
Juillet 2001 au cratère Sud-est de l’Etna. Depuis longtemps, des mesures acoustiques sont
réalisées pour « écouter » les sons volcaniques. En fait, cette méthode permet d’obtenir de
précieuses informations sur les mécanismes superficiels pouvant générer une surpression dans
l’air (ex. vibration, éclatement, circulation de fluides, etc.) et donc souvent invisible par
d’autres méthodes. Les mesures de pression acoustique enregistrées au cours d’une phase
d’activité éruptive Strombolienne montrent l’émergence de pulses de pression pouvant
atteindre 100 Pa à près de 1 km de la source volcanique. L’origine précise de ces pulses de
pression et les mécanismes associés restent difficiles à comprendre et rarement documentés
par des observations directes.
Pendant le paroxysme de l’éruption du 4 Juillet, le niveau de magma était monté
suffisamment haut pour remplir en partie la cavité du cratère Sud-est et permettre aux larges
bulles de gaz de se développer à la surface de la colonne magmatique, puis de gonfler au delà
des bordures du cratère, et ainsi d’être visibles sur les enregistrements vidéo. Ainsi, les
données vidéo ont permis l’analyse de l’évolution de 4 grandes bulles avant, pendant, et après
éclatement. En particulier, nous avons travaillé sur l’évolution du rayon de la bulle, ce qui
nous a permis de calculer des formes d’ondes théoriques de pression acoustique (c.à.d. les
pulses de pression) à partir des données d’observations, afin de les comparer avec les formes
159

Résumé – Deuxième partie
d’ondes acoustiques enregistrées par le capteur de pression. Puis, cette analyse nous a permis
d’observer les mécanismes associés à la rupture de la membrane de magma qui enveloppe la
bulle. Finalement, cette étude vidéo a été utilisée pour contraindre, grâce à des mesures
dérivées d’observations directes, les mécanismes de génération du son volcanique.
Nous avons montré à partir de ces corrélations que l’oscillation d’une bulle surpressurisée à la
surface de la colonne magmatique est bien le mécanisme principal à l’origine du son
enregistré par le capteur acoustique pendant une éruption Strombolienne. Enfin, nous avons
montré que le mécanisme de rupture de la membrane magmatique est initié par le
développement d’instabilités à l’interface bulle-magma. Suite à ces résultats, nous avons pu
utiliser un modèle de vibration de bulle théorique qui nous permet, par ajustement de la forme
d’onde synthétique avec la forme d’onde enregistrée, d’obtenir des paramètres physiques
quantitatifs sur la source sonore : la bulle. Ainsi, nous avons obtenu une estimation
quantitative moyenne de la surpression initiale de la bulle, c’est à dire lors de son arrivée à la
surface, de ∆P = 0.36 MPa. Puis nous donnons une estimation moyenne de la pression et du
volume de la bulle juste avant éclatement : Pg = 0.23 MPa and Vg = 1.6×10³ m3
respectivement.
Dans le chapitre 7, on s’est intéressé aux corrélations entre les méthodes acoustique et radar.
Cette comparaison est intéressante car l’acoustique nous délivre des informations sur les
mécanismes (vibration et éclatement de bulles) à l’origine des phénomènes de surface
enregistrés par le radar (éjection du gaz et des pyroclasts).
Tout d’abord nous avons pu montrer une bonne corrélation temporelle entre les signaux de
pression acoustique et de vitesse radiale, aussi bien de pic à pic que sur de longues périodes
d’activité éruptive. Cette corrélation n’est pas étonnante compte-tenu de la relation qu’il
existe entre les deux mécanismes étudiés. Cette corrélation est confirmée par des mesures de
pression acoustique et de vitesses radiales de particules effectuées sur plus de 80 explosions
Stromboliennes. En effet, on montre qu’il existe une relation de puissance du second degré
entre ces deux paramètres. Enfin, des estimations de vitesses initiales de gaz on pu être
réalisées à partir du calcul de la puissance acoustique, que l’on a comparé avec les vitesses de
gaz initiales calculées avec le radar. On a obtenu des valeurs d’environ 40 à 50 m/s à partir
des mesures acoustiques, contre des valeurs plus de deux fois plus élevées, allant de 95 à
118 m/s, à partir des mesures radar.
160

CHAPTER VI
Acoustic-video correlations: the last steps of a
Strombolian bubble approaching the top of the magma
column


Chapter VI – Acoustic and video correlations
VI.1. Introduction
Basaltic volcanoes activity is typically characterized by periodic fire fountains (Hawaiian
activity) or discrete explosions (Strombolian activity). Both eruptive mechanisms are driven
by large gas pockets formed at depth by the coalescence of a foam layer collapsing cyclically
at the roof of the magma chamber (Jaupart and Vergniolle, 1988, 1989). For very fluid
magma, the foam layer totally collapses leading to a phase that develops into annular flow and
produces fire fountains at the surface. For more viscous magma, only a portion of the foam
layer collapses leading to a phase that develops into slug flow and produces Strombolian
explosions at the surface. The similarity between these large bubbles and fire fountaining
episodes, added to the continuous transition between both regimes, suggests that both have
the same origin (Vergniolle and Ripepe, 2008). FTIR measurements have shown, particularly,
that fire fountains at Etna (Italy) form at depth of about 1.5 km (Allard et al., 2005). Mount
Etna, a volcano laboratory, turns out to be a first-rate candidate for our investigations. We
worked on the July 4, 2001 episode that clearly shows a Strombolian activity at the summit of
the Southeast crater (SEC) where large bubbles expand as they rise through the conduit until
breaking at the surface of the magma column.
Acoustic measurements have long been carried out on volcanoes, and three main models have
been developed for volcanic acoustic signals. The first class of acoustic models associates the
frequency and amplitude of acoustic signals with resonant modes of the shallow volcanic
conduit (Buckingham and Garcès, 1996; Garcès et al., 2000; Hagerty et al., 2000). The second
class of acoustic models suggests that the sound is produced when the volcano is suddenly
uncorked after reaching a critical pressure threshold (Uhira and Takeo, 1994; Johnson et al.,
1998; Johnson and Lees, 2000). In contrast, the third class of acoustic models interprets the
radiated sound mainly to the strong vibration of a large bubble expanding at the surface of the
magma column prior to bursting (Vergniolle and Brandeis, 1994, 1996; Vergniolle et al.,
2004; Vergniolle and Ripepe, 2008).
Acoustic measurements are commonly used to constrain the radius and length of the bubble
reaching the top of the magma column. Then, fundamental parameters such as overpressure
and volume of the bubble before breaking can hence be estimated. Previous studies at
Stromboli volcano (Italy) have been carried out with similar acoustic measurements, where
characteristic values of bubble overpressure (≈ 0.1 MPa) and radius (≈ 1 m) were found. In
163

Chapter VI – Acoustic and video correlations
the present study, we provide quantitative estimates of similar parameters for a set of large
bubbles bursting at the surface of the lava column at Etna SEC on July 4, 2001.
However, the main interest of this work is centred on the study of the processes developing
prior and during the bubble breaking associated to the radiated sound waves, by using coupled
acoustic and video measurements. Although the video can provide very strong constraints,
visual observations of bubble rising above the crater rims are scarce. During the paroxysm of
the July-4 eruption, we observe only 9 large bubbles and only four of them are really
exploitable. Moreover, video snapshots analysis cannot give information prior the very last
stage of bubble rise. In this study we provide quantitative estimates of physical parameters
(radius, velocity, and acceleration of the bubble membrane) derived from the video analysis
on four large bubbles. These measurements permit us to build video-derived acoustic
waveforms, subsequently compared with recorded acoustic waveforms in order to better
interpret the processes prior to the bubble breaking at the vent.
VI.2. Setting and material
After more than 8 months of minor activity (slow lava flows, degassing, light ash emission,
and low-level Strombolian activity) at Etna volcano (Sicilia), a new episode of vigorous
activity began on May 9, 2001. About fifteen eruptive episodes have been reported, occurring
in average every 3-5 days, until the eruption turned to a major flank eruption on 17 July,
2001. We focus in this study on the activity at the Southeast crater and not to that of the flank
eruption. Each eruptive episode before the flank eruption lasted a few hours, involving
multiple Strombolian explosions and sometimes lava fountaining. The whole eruptive episode
of July 4, 2001 lasts about 5 hours from 1800:00 UT to 2300:00 UT. At the beginning,
explosions are infrequent, occurring only every few minutes, but after one hour, the activity
becomes noisy and frequent, every several seconds. The paroxysm takes place during the
third hour, between 2100:00 UT and 2200:00 UT, and provides close series of violent
Strombolian explosions that punctually develop into quasi fire fountains activity. At the end
of the paroxysm, the magma level increased, and then partly filled the crater cavity. Large
bubble developing at the top of the magma column can thus be observed, and analyzed from
video recording. Acoustic pressure was recorded for the whole duration of the July 4, 2001
eruptive episode (Vergniolle and Ripepe, 2008). The acoustic sensor, set at a distance of
about 950 m from the vent, is an infrasonic microphone (Bruel Kjaer 4193) amplified by
164

Chapter VI – Acoustic and video correlations
Nexus (Bruel Kjaer), and has a wide frequency range, from 0.1 Hz to several kHz. Recording
was performed on a digital acquisition station (Vibra4, Tad) at a sampling frequency of 1200
Hz and a dynamical range of 8 bits.
VI.3. Acoustic and video observations data
VI.3.1. Description of video data
Video data was acquired during the whole eruption of 4 July 2001 at Etna SEC and permits us
a detailed analysis of the eruptive activity at the summit crater during 4 hours. The paroxysm
of this eruption takes place between 2100:00 UT and 2200:00 UT, and the magma layer
increased significantly in the crater, leading large bubbles to grow and expand over the crater
rims. We thus were able to pick up a series of four large bubbles that can be easily observed
from the video field of view (Figure VI.1). Most of these kinds of explosions appear between
2135:00 UT and 2145:00 UT, but we count no more than about 10 bubbles during the
paroxysm period. It means that conditions that permit large bubble to form and expand over
the crater rims are not commonly encountered. Bubbles shapes are mainly spherical but we
are only able to observe the upper part of the rising bubble on video snapshots, as shown in
Figure VI.1. Large bubbles can hence be divided into two half a sphere; the upper one (visible
on video snapshots) moving freely in the surrounding air, and the lower one, immersed into
the magmatic liquid, thus having a restricted displacement.
(c) 20m (d) 20m
(a) 20m (b) 20m
Figure VI.1. Video snapshots of four large bubbles occurring at Etna SEC during the eruption of July
4, 2001, at (a) 2135:35 UT,(b) 2138:10 UT, (c) 2142:32 UT, and (d) 2143:04 UT.
165

Chapter VI – Acoustic and video correlations
VI.3.1.1 Bubble radius measurement procedure
The video of each large bubble was broken up into a series of images at a sampling rate of 25
frames per second, which corresponds to one image every 0.04 s. This temporal resolution is
satisfactory bearing in mind the characteristic time of the physical process at issue.
Afterwards, bubble contours have been traced out by an automatic procedure every 0.04 s
realised with Matlab software, by selecting a reference pixel value intensity that corresponds
to the edge of the luminous bubble (Figure VI.2). Note that it was also cautiously checked
from visual observation directly on video snapshots.
Nevertheless, some uncertainties can remain on such video analysis: (1) the scattering of light
in the surrounding gas can interfere with the bubble edge limitation and hence induce a bias
on the bubble radius measurements. (2) The scale factor of images is based on the crater
diameter which is not accurately known, and a potential error on the absolute measurement of
the bubble radius can also be assumed. (3) Finally, measurements realised from 2D field of
view snapshots can also lead to an underestimation of radius values.
Figure VI.2 shows an example of the automatic procedure used for the calculation of bubble
radius measurements. In this case we provide bubble contours at a time step of 0.2 s for the
explosion occurring at 2142:32 UT. The radius can hence be calculated at each time step
(0.04 s in reality) from the displacement of each successive contour. The real spatial scale is
recovered from the width of the crater from rim to rim. Note that this scale factor is not
accurately known and may also induce an additional bias in the radius calculations.
Figure VI.2. Plot of bubble contours from the automatic procedure, for the explosion occurring at
2143:32 UT at Etna SEC on July 4, 2001. Contours are traced out at a time step of 0.2 s in this
example. Radius values of expanding bubbles are estimated from the cumulative distance
measurement between each contour at each time step (i.e., 0.04 s in reality).
166

Chapter VI – Acoustic and video correlations
In reality bubbles are not purely hemispherical, therefore, the radius estimate depends on the
profile considered, i.e., the direction in which radius measurements are carried out. We give in
Figure VI.3 radius measurements realised from three different profiles: vertical, horizontal-
right and horizontal-left, for the bubble occurring at 2142:32 UT, with a sampling rate of
25 Hz (i.e., with a time step of 0.04 s). The main trend is conserved for the three profiles but
some significant discrepancies also occur more locally. This result stresses first the
heterogeneity of bubbles growths, and point out that further results based on radius
measurements may also depend on the profile chosen. In what follows, each profile has been
systematically measured for the four large bubbles studied in order to check potential
unexpected discrepancies. We finally choose the vertical profiles as reference for radius
measurements.
Figure VI.3. Time series of radius measurements given for 3 profiles (vertical, right, and left) from
video snapshot analysis of bubble at 2142:32 UT acquired at a sampling rate of 25 Hz.
VI.3.1.2 Instabilities on the magma-air interface
The detailed analysis of this large bubble on video snapshots has pointed out the very
existence of instabilities occurring at the surface bubble.
Importantly, the area between bubble and air can be described as the sequence of interfaces:
(1) the first one to be considered is the interface between the bubble and the overlying magma
layer, (2) the second one is the interface between the magma layer and the air. In the case of a
plane surface, an interface is stable only when the acceleration ( R&& ) is directed from the liquid
(L) to the gas phase (Gi), therefore the sign of the acceleration is determining (Figure VI.4).
When the acceleration is positive ( R&& >0) the bubble-magma interface (G1 to L) is unstable
167

Chapter VI – Acoustic and video correlations
whereas the magma-air interface (L to G2) is stable. This is the opposite when the acceleration
of the magma layer is negative ( R&& <0).
Figure VI.4. Sketches showing the development of instabilities on bubble-magma and magma-air
interfaces as a function of the sign of the bubble membrane acceleration
Note that from visual observation, we only access to information on the magma-air interface.
At the beginning of the bubble expansion (Figure VI.5a), we clearly observe an unstable
magma-air interface that looks rippled showing successive crests and dents. A few tenths of
second later (Figure VI.5b), the bubble has largely expanded over the crater rims, and shows a
very stable and smooth magma-air interface. This first order qualitative observation is
fundamental because it illustrates almost certainly that the bubble oscillates.
(a) (b)
Figure VI.5. Video snapshot of the bubble at 2142:32 UT showing the development of (a) instabilities
on the visible magma-air interface occurring at beginning of the bubble expansion, and (b) vanishing
of these instabilities that leads to a stable magma-air interface.
168

Chapter VI – Acoustic and video correlations
VI.3.1.3. Bubble vibration mode
The deformation of interfaces does not occur arbitrarily of course, then the thorough analysis
of instabilities may bring important constraints on the bubble behaviour, and hence on the
origin of sound radiated. We show particularly (Figure VI.6) on bubble at 2143:04 UT, the
long-range deformation of the magma-air interface, which corresponds to vibration mode
equal to 3 on half a sphere, it means an even vibration mode of 6 on the whole sphere.
Figure VI.6. Video snapshot of the bubble at 2143:04 UT prior to bursting, and showing a long-range
deformation that reveals a bubble vibration mode of order 3 on half sphere.
VI.3.1.4. Magmatic film rupture
Figure VI.7 shows the breaking mechanism of the magmatic film occurring on bubble at
2142:32 UT, after about one second of expansion above the crater rim. The initiation of
rupture looks relatively localized on the top left side of the bubble. Sideways, the magma-air
interface appears not very deformed, which suggests that it is not involved into the membrane
rupture. At this stage, we suppose that the bubble-magma interface should be highly distorted
and hence may be responsible for the membrane rupture. Immediately after the localized
rupture, the bubble punctures all over the membrane, leading to the fragmentation of the
overlying magmatic film into relatively large disconnected blocks subsequently propelled
radially.
169

Chapter VI – Acoustic and video correlations
Figure VI.7. Video snapshot of the bubble at 2142:32 UT showing the magma-layer rupture locally
punctured by instabilities developing most likely at the bubble-magma interface.
This preliminary analysis of video snapshots has permitted to shed light on crucial processes
related to bubble expansion and bursting. Particularly, the existence of instabilities developing
and vanishing at the magma-air interface strongly suggests that oscillations of such bubbles
can be at the origin of sound radiated in the surrounding air.
VI.3.2. Description of acoustic data
Acoustic pressure was successfully recorded during the four hours of intense activity at
Mount Etna SEC on July 4, 2001. The acoustic pressure signal shows a series of pulses,
whose intensity is variable and can reach a maximum of 100 Pa. The occurrence of these
pulses fairly changes in time, but the average interpulse duration is typically around a few
seconds. The occurrence and intensity of explosions increase during the third hour of
recording (2100:00 UT and 2200:00 UT). Note that Strombolian explosions at Etna have a
waveform very similar to explosions at Stromboli and Shishaldin volcanoes. In this section
we just aim at describing some basic features (amplitudes and frequencies) of acoustic signals
generated by Strombolian explosions.
170

Chapter VI – Acoustic and video correlations
VI.3.2.1 Acoustic waveforms of typical Strombolian explosions
Acoustic measurements were realised at Etna Southeast Crater (SEC) during the eruption of
July 2001, where the recorded acoustic pressure variations clearly show the existence of an
oscillating source. The Strombolian activity at Mount Etna consists of a series of explosions
caused by the breaking of large and overpressurized bubbles at the surface of the magma
column. The spectral content analysis has pointed out that the whole explosion process,
typically about 20 seconds from the bubble generation at depth to its bursting at the surface, is
characterized by 3 different parts with particular frequencies which are related to specific
mechanisms.
We show in Figure VI.8 the acoustic pressure signal recorded during the explosion occurring
at 2135:35 UT lasting about 20 s. We point out three distinct parts showing very different
acoustic features. (1) In the first part, lasting about 8 s, we observe three similar waveforms
peaking at an acoustic pressure < 20 Pa. The duration of each event is short and fairly
constant around 0.7 s, (equivalent frequency is ~1.4 Hz), but the time interval between each
acoustic peak of the precursory part can be much more longer and may widely vary from
about 2 to 4 s in this case (equivalent frequency is ~0.5 – 0.25 Hz) . The second part shows a
single waveform with a high compressive component (positive peak) and a rarefaction
component (negative peak) reaching in both cases an acoustic pressure of about ±100 Pa. A
slight second positive peak can be observed but with very low acoustic pressure (~ 20 Pa).
The total duration of this acoustic waveform is about 0.9 s, which corresponds to an
equivalent frequency of 1.1 Hz. Finally, we can observe in part three, an acoustic waveform
occurring about 8 s after the acoustic main pulse peaking at 30 Pa for the positive component
and -40 Pa for the negative one. This event is typically low frequency (0.6 Hz), lasting about
1.7 s. Acoustic waveforms of the first part are assumed to be related to gravity waves
generated at the surface of the magma column by a deeply rooted oscillating source. The main
acoustic pulse meet in the second part is thought to be due to the vibration of large bubble
reaching the magma-air interface. The third part, rather uncommon on acoustic signals, may
be due to the gravity waves that develop at the bottom of the bubble. These interpretations are
deeply discusses in section VI.4.1.
171

Chapter VI – Acoustic and video correlations
Figure VI.8. Acoustic pressure signal recorded at Etna SEC on July 4, 2001 on bubble at 2135:35 UT.
We show three different parts corresponding to (part 1) precursors, (part 2) bubble vibration/bursting
and (part 3) bubble tail.
VI.3.2.2. Detailed analysis on 9 large bubbles
We picked up a series of 9 large overpressurized bubbles during the paroxysm. We focused
the spectral analysis on the main acoustic pulse (part 2, Figure VI.9) and its related precursors
(part 1, Figure VI.10). Each bubble has in average two to four precursory waveforms that lead
to about 30 values for the spectral content analysis of precursor events.
Figure VI.9. Characteristic duration and equivalent frequency of the acoustic main pulse for 9 large
bubbles during the eruption of July 4, 2001 at Etna SEC, giving in average 1.3 Hz.
172

Chapter VI – Acoustic and video correlations
The characteristic duration of the acoustic main pulse (Figure VI.9) is found to be about
0.78 s that corresponds to an equivalent frequency of 1.3 Hz. The dispersion of duration data
is relatively low, as we find a standard deviation of 0.12 s, i.e., a variability of about 15 % of
the mean duration value.
We first characterize (Figure VI.10a) the duration between each acoustic peak of waveforms
arising in part 2, which could correspond to a cyclic mechanism. We thus found a
characteristic duration of about 1.83 s that corresponds to an equivalent frequency
of ≈ 0.55 Hz. The dispersion of these duration data is higher for case of gravity waves with a
standard deviation of 0.39 s, i.e., a variability of about 21% of the mean duration value.
Finally, the characteristic duration of precursor events (Figure VI.10b) is about 0.65 s that
corresponds to an equivalent frequency of 1.54 Hz. The dispersion is larger, with a standard
deviation of 0.16 s, i.e., a variability of about 24% of the mean duration.
The dispersion of the durations (or equivalent frequencies) of acoustic waveforms measured
on recorded signal is most likely the result of natural variability of physical mechanisms at
work. However, we note a significant difference between the variability of data of
part 1 and 2. We suppose that the deeply rooted source of oscillations related to surface
gravity waves in part 1, may also account for a larger dispersion. Indeed, first the recorded
signal is lower (<20Pa), and the oscillation occurring at depth and transmitted to the surface is
probably affected by additional processes leading to a larger variability in the signature of the
source mechanism.
Figure VI.10. (a) Characteristic duration and equivalent frequency of intermittency between precursory
events. (b) Characteristic duration and equivalent frequency of precursory events.
173

Chapter VI – Acoustic and video correlations
VI.3.2.3. Bubble depth estimate corresponding to the first acoustic precursor
The first acoustic precursor event (part 1) occurs in average 7 seconds before the acoustic
main pulse (part 2). The latter corresponding to the bubble expansion at the surface of the
magma column (z=0) we can deduce, if we know the bubble rise velocity, the maximum
depth at which the bubble can generate surface waves. The rise velocity (Us) of a slug in an
infinite liquid can be theoretically estimated from (Wallis, 1969):
( ) 21
2345.0 RgU s = (VI.1)
where R is the conduit radius taken as 5 m at Etna SEC (Vergniolle and Ripepe, 2008), and g
is the acceleration of gravity. Finally, we can estimate the equilibrium pressure inside the
bubble from the lithostatic pressure corresponding to the thickness of the magma column
above the bubble plus the atmospheric pressure, and calculated as (Vergniolle and Jaupart,
1990; Vergniolle et al., 1996):
( ) ( ) airsliqliqg PtUHgtP +−= 0ρ (VI.2)
0liqH is the thickness of the magma layer at time t = 0, Pair is the atmospheric pressure ≈ 105
Pa, and ρliq is the density of magma ( 2700 kg/m3).
Figure VI.11. Estimation of bubble depth at the moment where the first sloshing event is recorded at
the surface from theoretical bubble rise velocity Us in an infinite liquid. We thus deduce the lithostatic
pressure corresponding to the equilibrium pressure inside the bubble at a given depth for the first
sloshing events of 9 large bubbles bursting at the surface of the magma column.
174

Chapter VI – Acoustic and video correlations
For a mean conduit radius of 5 m, we obtain a characteristic bubble rise velocity of
3.45 m/s. We are thus able to provide in Figure VI.11 the depth and equilibrium pressure of
the 9 large bubbles studied. We obtain a mean bubble depth of 24 m under the surface of the
magma column, with a maximum value of 35.2 m and a minimum value of 11.5 m. We give a
mean corresponding bubble equilibrium pressure of 7.4×10⁵ Pa, with a maximum value of
1.05×10⁷ and a minimum value of 4.1×10⁵. This result stresses that each bubble does not
generate first surface waves from the same depth. This effect may be due to the natural
difference of overpressure between each bubble, acquired more deeply, when the foam
collapses.
VI.3.2.4. Spectral content analysis on a 300-s sequence
Fast Fourier Transforms of the acoustic pressure signal have been carried out over a period of
300 seconds at the end of the paroxysm between 2155:00 UT and 2200:00 UT. During this
period, the activity consists in small frequent explosions with typical acoustic pressure around
20 Pa, interspersed by larger events typical of large bubbles studied in this work, and reaching
acoustic pressure >40 Pa (Figure VI.12a).
Two main frequencies emerge from the spectral analysis (Figure VI.12b). We find out a peak
between 1-2 Hz (1.35 Hz at maximum amplitude) that is compatible with frequencies of the
acoustic main pulse (part 2, 1.54 Hz in average). It is the most energetic one, with a maximum
acoustic pressure of 0.9 Pa. The peak at about 0.6 Hz is rather compatible with the frequency
of precursory events (part 1, 0.55 Hz in average). Note that the amplitude of these two
characteristic frequencies evolves jointly through time, suggesting that both mechanisms may
be induced by the behaviour of the same rising bubble from depth to the surface.
175

Chapter VI – Acoustic and video correlations
(a) (b)
Figure VI.12. (a) Time series of acoustic pressure during 300 s of Strombolian activity occurring at
2155:00 UT at Etna SEC during the eruption of July 4, 2001. (b) Spectral content analysis from Fast
Fourier Transform on the same period of 300 s. We show two main frequency peaks at about 0.6 Hz
and 1.35 Hz, the latter having the maximum acoustic pressure at 0.9 Pa.
VI.4. Theoretical features
VI.4.1 Possible sources of sound generation
VI.4.1.1 Acoustic precursors: bubble vibration at depth
The first part (P1), occurring in average a few seconds before the acoustic main pulse is
assumed to be gravity waves (Vergniolle et al., 1996) generated at the surface of the magma
column. The origin of these surface waves is related to the existence of a deeply rooted
oscillating source. Indeed, gas pockets are formed at depth by the coalescence of a foam layer
and overpressurized by the release of surface tension from numerous small bubbles. When the
foam collapses at the roof of the magma chamber, a large bubble is generated, where its
overpressure will force it to grow and oscillate in an infinite liquid. Because of the small
finite-diameter of the conduit, the rising bubble cannot expand in width and thus develops as a
gas slug, leading to longitudinal oscillations. The magma layer above the bubble follows
passively its motion, and may be considered as a mass attached to a vertically oscillating
spring. The resulting acoustic pressure recorded at the magma-air interface (i.e. at the surface)
both arises from (1) the volume-mode and (2) the gravity-mode.
176

Chapter VI – Acoustic and video correlations
Firstly, the volume-mode is related to the oscillation of the bubble at depth, inferred from its
variation of internal pressure. Assuming small oscillations and no damping as Vergniolle and
Brandeis (1994), the radian frequency is the ratio between generalized stiffness and inertia,
both derived from potential and kinetic energies respectively (Lighthill, 1978). We assume for
simplicity that the bubble is a cylinder (i.e., a slug) of length L with a radius R pushing a layer
of magma thickness Hliq at a density ρliq. The volume mode frequency fv of the oscillator
assuming isothermal heat transfer inside the gas at pressure Pg is therefore:
liqeqliq
gv HL
Pf
ργ
π21
= (VI.3)
Where γ is the ratio of specific heats, equal to 1.1 for hot gas (Lighthill, 1978). Importantly,
this calculation is a rough approximation because, in particular, the magma layer gets thinner
as the bubble rises and hence increases in length by decompression. Setting Pg at the mean
bubble equilibrium pressure (lithostatic + air) of 7.4×10⁵ Pa corresponding to a mean bubble
depth of 24 m, we obtain a mean characteristic frequency of 0.56 Hz. Note that it correspond
to a bubble length of about 5 m (i.e. on the order of the conduit radius) close to the magma-air
interface according to the adiabatic decompression relation (Equation VI.12.).
Secondly, the gravity-mode is related to the weight of the magma layer above the bubble.
Considering the large thickness of this column of magma at the beginning of bubble ascent,
we assume that gravity waves can develop at the magma-air interface and then generate both
fragmentation and sound. In a tube, gravity waves may develop with a wavelength λ, for
which the frequency fg is:
λπgf g 2
1= (VI.4)
The wavelength λ is on the order of the conduit radius. The theoretical frequency of the
gravity waves is about 0.23 Hz for a radius of 5 m. Bearing in mind the approximation of
these theoretical features, both volume-mode and gravity-mode give an estimate of
characteristic low-frequency, lower than one hertz, and characteristic to the physical
mechanism involved. As a comparison, frequencies inferred from acoustic analysis on the
177

Chapter VI – Acoustic and video correlations
precursors of the 9 large bubbles give values of 0.55 and 1.54 Hz for intermittency and
duration of acoustic precursors respectively. Theoretical values of frequencies given in this
section are rather consistent with the ones inferred from the intermittency between precursors.
VI.4.1.2. Main acoustic pulse: bubble nose vibration at the magma-air interface
The second part (P2) represents the bubble nose vibration and its bursting at the magma-air
interface; it is the most energetic event of the acoustic signal, and it can reach 100 Pa on the
sensor, at about 1000 m from the source. At this stage the bubble can be commonly
considered as a slug, with a cylindrical tail of length L and a bubble nose of initial radius R0.
However, in some cases, the magma level can increase and partially fill the crater. Then, the
bubble form may change into a spherical cap of radius R without tail. The duration of the
bubble vibration and the transition to its bursting are mechanisms hardly modelled and also
difficult to observe. Indeed the spectral content of the oscillation of a large overpressurized
bubble is expected to be lower than the one of a bubble bursting, and characteristic times of
both physical processes are also expected to be different as well as their amplitudes. These
problems are deeply discussed in the subsequent section. Because of the large difference in
viscosity between air and magma, the motion of the immersed part of the gas slug is
restricted; then, the bubble vibration is mostly concentrated into its hemispherical cap. The
oscillating source, (i.e. overpressurized bubble) is the same than the one of part 1; however, in
this case the slug is not moving in an infinite liquid, and its motion is not restricted by the
conduit wall.
The vibration of the bubble-magma interface is transmitted radially through the thin layer of
magma and reaches the magma-air interface. The sound velocity in magma is above 2500 m.s-
1 (Rivers and Carmichael, 1987; Kress and Carmichael, 1991) and the magma is largely
incompressible for the radial motions considered here. Therefore, no energy is lost by the
transmission through the thin layer of magma (Pierce, 1981): the magma-air interface vibrates
as the bubble does. A bubble vibrating at such a boundary layer presents three modes of
vibration. The first one is related to the surface tension, the second one is associated to the
gravity waves and the third one is only due to volumes changes. Vergniolle and Brandeis
(1996) showed that, for a large bubble with a thin overlying magma-layer, the energy released
will go preferentially into the volume mode, directly driven by overpressure. We can obtain
the frequency of the volume mode for a slug, from the kinetic and potential energy for a liquid
178

Chapter VI – Acoustic and video correlations
film of thickness h small before the initial bubble radius R0 (Lighthill, 1978; Vergniolle and
Brandeis, 1994) by using:
( ) 00
332
221
hRP
RLf
liq
gv ρ
γπ +
= (VI.5)
When the bubble is at the surface, the equilibrium pressure can be taken equal to the
atmospheric pressure only. We thus obtain a characteristic frequency of about 1.4 Hz for a
bubble radius of 5 m (i.e., on the order of the radius conduit) and a bubble length of 7 m. This
frequency value is in agreement with the ones inferred from measurements of the main
acoustic pulse carried out on 9 large bubbles (1.3 Hz).
After about a cycle of oscillation, the bubble usually bursts caused by the fragmentation of the
thin magma-layer inferred from the development of instabilities on interfaces. Indeed, the
stability of a spherical surface depends both on its acceleration and velocity; therefore
instabilities can develop on both interfaces (i.e. bubble-magma and magma-air), particularly
in the case of large bubbles, and lead to the fragmentation of the surrounding magma layer
into disconnected ballistic pyroclasts. Bursting of a bubble is related to the rupture of its
overlying membrane. We can consider two main cases: a short-time rupture and a long-time
rupture. Firstly, we can make the analogy with a balloon bursting due to overpressure. In this
case the characteristic time of the rupture is short, and the membrane punctures from a single
hole inferred from located instabilities. The frequency of the sound generated by such a
mechanism can be estimated by the following relation:
02Rcfb = (VI.6)
For a sound velocity in air of 340 m/s and an initial bubble radius of 5 m as is assumed at
Etna Southeast Crater (SEC), we obtain a frequency of about 34 Hz. The sound generated by
such a mechanism is low amplitude and hence may not emerge from the raw acoustic signal.
Secondly, in the case of a long-time rupture, the problem is much more complex, the energy
repartition among the acoustic mode is different and the amplitude of the acoustic signal
179

Chapter VI – Acoustic and video correlations
would decrease. Note that the thickness and viscosity of the membrane can particularly
account for the duration of the rupture time.
VI.4.1.3. Last acoustic event: bubble bottom vibration
The last part (P3) corresponds to gravity waves that develop at the bottom of the bubble.
Indeed, the lateral film of magma travelling downward along the conduit wall after bubble
bursting can be transmitted at the bottom of the bubble, and generate oscillations at the
surface of the new air-magma interface. The sound produced by this mechanism has been
recorded on the acoustic signal as a single peak of relatively high amplitude and low
frequencies. The frequency of these kinematic waves depends particularly on the viscosity of
the magma and can be deduced from:
31
2
3
36
89.0
⎥⎦
⎤⎢⎣
⎡=
µρ
πgnf l
k (VI.7)
Any change in the geometry of a hemisphere can be described by the superposition of various
modes n. The fundamental mode corresponds to a volume change, and is expected to be odd.
Then, for n = 1 and with a viscosity of 10 Pa.s, we obtain a characteristic frequency of about
2-3 Hz. Simultaneously, high frequencies with low amplitude are overlaid on the bubble tail
signal most likely corresponding to the ejection of ballistic pyroclasts. These frequency values
significantly differ from the one given from the analysis of explosion at 2135:35 UT (0.6 Hz).
Note however that the comparison on a single example is not representative, but this kind of
event is rarely recorded. The delay of a few seconds between acoustic signals generated by
the bubble nose and the bubble bottom may give an estimate of the bubble length if we
assume that the bubble bottom is still rising at its equilibrium velocity Us.
180

Chapter VI – Acoustic and video correlations
VI.4.1.4. Summary of possible mechanisms at work
Figure VI.13. Sketches showing the different mechanisms at work during the whole bubble
development since its growth at depth to its bursting at the surface, and generating characteristic
frequencies measured during part 1, 2 and 3.
We provide in Figure VI.13 a summary of possible mechanisms assumed to be at work and
constrained from both observation data (video and acoustic) and the theoretical analysis. The
first part of the acoustic signal generated most likely by gravity waves is related to the
oscillation at depth of an overpressurized bubble producing typical frequencies <1Hz. We
suggest that the second part of the acoustic signal is related the oscillation of the bubble nose
reaching the top of the magma column prior to bursting. We obtain typical frequencies
ranging from 1-2 Hz. The third part is presumed to be related to the oscillation of the bubble
bottom after bursting. However, frequencies inferred from observations significantly differ
from the ones calculated theoretically, that suggest strong uncertainties on the validity of this
interpretation.
181

Chapter VI – Acoustic and video correlations
VI.4.2. Synthetic modelling of acoustic waveform
We now focus on the waveform of the main acoustic pulse recorded during Strombolian
explosions (part 2). High-amplitude oscillations results in the radiation of sound waves, and
we assume in this case that the oscillations are set up by a sudden overpressure inside the
bubble reaching the magma-air interface. We approximate the bubble shape by a
hemispherical nose and a cylindrical tail, as expected in slug-flow. We propose that the sound
generated at Etna is produced by the vibration of a shallow plurimetric bubble prior to
bursting rather than the popping noise, by analogy to the balloon bursting problem. Any
bubble in an infinite liquid oscillates easily: inertia causes the bubble to overshoot its
equilibrium radius and the compressibility of gas, through the internal gas pressure, acts such
as a restoring force (Batchelor, 1967; Leighton, 1994). If the lava is close to the surface, as it
is the case during the paroxysm of 4 July 2001 at Etna, no external limitation exists on bubble
growth when the bubble reaches the surface and breaks; and then, the resulting distortion of
sound propagation inside the crater is likely to be low.
The source of sound is a thin layer of magma pushed by a variation of internal pressure inside
the bubble (Vergniolle and Brandeis, 1996; Vergniolle et al., 2004). The thickness h of the
magma layer is of the order of magnitude of the average diameter D of the ejecta, which are
usually of the order of (heq ≈ R/100) a few centimetres, i.e. much smaller than the radius, and
hence can be considered as a membrane. It has been shown for Stromboli volcano that the
source is a monopole as its amplitude decrease inversely proportional to the distance between
the microphone and the vent (Vergniolle and Brandeis, 1994). Analogous analysis is possible
at Etna, considering the type of activity studied here, and the extreme similarity between both
acoustic waveforms. Therefore, the propagation of pressure waves is radial, and in that case
the source is a simple one. The excess pressure can be described from the linear theory of
sound, and in that case depends on the rate of mass outflow from the source, (Lighthill,
1978). Acoustic pressure P
q&
ac emitted at the source at time t will reach the microphone at time t
+ r/c, where r is the distance from the vent and c is the sound velocity in air. For such a
monopole source, the excess pressure Pac-Pair at time t is:
( ) ( )r
crtRdtd
rcrtqPP air
airac πρπ
π 26/4
4/ 3
2
2
⎥⎦
⎤⎢⎣
⎡ −=
−=−&
(VI.8)
182

Chapter VI – Acoustic and video correlations
where Pair and ρair are respectively atmospheric pressure and air density. Finally we obtain the
excess pressure in air:
( ) ( ) ( )[ ] ( )r
crtRcrtRcrtRcrtRPP air
airac/
///2 2 −×−−+−=−ρ&&& (VI.9)
where R& is the radial velocity and R&& is the radial acceleration of the hemispherical bubble nose.
This equation relates the variations in acoustic pressure to the bubble vibration. Thus, in order
to express these variations in acoustic pressure, we model the bubble motions in response to a
sudden overpressure. The bubble vibrates as a thin membrane of thickness h; its head grows
but remains spherical with a radius R and the cylindrical tail has a length L. The total volume
Vg of the bubble is simply the sum of both parts:
LRRV og2
3
32 ππ
+= (VI.10)
All the equations given in this section are related to the slug geometry (bubble nose and
cylindrical tail). For the hemispherical cap geometry, the length L of the cylindrical tail has
simply to be taken equal to zero in equations 10 and 14. Note that in the following, indexes o,
g and eq refer to initial conditions, gas and equilibrium values, respectively. The high
viscosity of the magma impedes any significant drainage by gravity of the magma above the
bubble during the short time allowed for the bubble to vibrate. The volume of magma above
the bubble is then conserved and the liquid stretches, following the variations in the bubble
radius.
eqeqhRhR 22 = (VI.11)
Because heat transfer inside large bubbles is adiabatic (Plesset and Prosperetti, 1977), the
pressure Pg inside the bubble follows the variations of its volume Vg:
γγ
eqgeqggg VPVP ..= (VI.12)
183

Chapter VI – Acoustic and video correlations
where γ is the ratio of specific heats, equal to 1.1 for hot gases (Lighthill, 1978). For a thin
layer of magma, the contribution of its weight to the equilibrium pressure inside the bubble is
small, and the equilibrium pressure Pg eq can be considered as equal to the atmospheric
pressure Pair. The temperature is homogeneous inside the gas during the vibration
(Prosperetti, 1986) and obeys the law of perfect gases. It will passively follow variations in
volume and pressure. Suppose that the bubble, initially at rest at the magma-air interface, is
overpressurized by an amount ∆P. The bubble starts to grow and vibrate in response to that
pressure change. Pressure and volume follow the adiabatic law; hence we can calculate their
variations. The bubble radius R can be expressed by its variation around the equilibrium
radius Req calculated from initial conditions and the adiabatic law (Vergniolle and Brandeis,
1996):
( )ε+= 1eqRR (VI.13)
with
31
12
13
22
3
⎪⎭
⎪⎬⎫
⎪⎩
⎪⎨⎧
⎥⎥
⎦
⎤
⎢⎢
⎣
⎡−⎟⎟
⎠
⎞⎜⎜⎝
⎛ ∆+⎟
⎠⎞
⎜⎝⎛ += L
PPL
RRR
air
ooeq
γ
(VI.14)
where ε is a dimensionless bubble radius. The motion of the bubble is possible through an
exchange between the kinetic energy of its hemispherical nose and the potential energy inside
the gas. The general equation for the bubble vibration is:
( ) 01112 22 =+
⎥⎥
⎦
⎤
⎢⎢
⎣
⎡
⎟⎟⎠
⎞⎜⎜⎝
⎛−+⎟
⎟⎠
⎞⎜⎜⎝
⎛+ ε
ρε
ρµε
γ
g
eq
eqeqliq
air
eqliq VV
hRP
R&&& (VI.15)
where the gas volume Vg is a function of ε (Vergniolle and Brandeis, 1996). The first initial
condition to be specified is the initial value of the dimensionless radius εo. The second initial
condition is the initial radial acceleration oε&& , which depends on the initial force applied to the
layer of magma. Assuming that the bubble, at rest at the magma-air interface, is suddenly
184

Chapter VI – Acoustic and video correlations
overpressurized by an amount ∆P, this force is directly related to the bubble overpressure.
Therefore, the initial conditions are:
1−=
eq
oo R
Rε (VI.16)
eqeqliq
oo hR
PR3
2
ρε
∆=&& (VI.17)
Radial acceleration is maximum when the strong vibration starts and the initial radial velocity
is equal to zero. These initial conditions correspond to a bubble close to its minimum radius
VI.4.3 Video-derived modelling of acoustic waveform
From the bubble nose radius R measured on the four large bubbles from video snapshots, we
can calculate the resulting excess pressure Pac in air by using the Rayleigh-Plesset relation
that depends particularly, on the velocity R& and the acceleration R&& of the thin magma layer
above the bubble. These two parameters are simply the first and second derivative of the
bubble radius, respectively. They can be determined from finite difference calculations:
tRR
tRR ii
∆−
=∂∂
= +1& (VI.18)
211
2
2 2t
RRRtRR iii
∆+−
=∂∂
= −+&& (VI.19)
Then we calculate the stability factor of the bubble magma interface which depends mostly on
the acceleration of the magmatic film. Although the bubble nose is only half a sphere, we
apply the stability analysis for a sphere by using the stability factor CRT that is related to the
bubble-magma interface.
( )( )( ) ( )oliq
RT RRn
RR
RnnnC
212
43211
20
2
30
&&& +−−
++−=
ρσ (VI.20)
185

Chapter VI – Acoustic and video correlations
where σ is the surface tension and n is the wavenumber. If the stability factor is greater than
zero, it means that the bubble-magma interface is stable and hence we deduce that the
magma-air interface is unstable. It is the opposite when the stability factor CRT is negative.
The surface tension term, with σ ≈ 0.1 kg.s-2 for a basaltic magma at 1200°C and 0.1 MPa
(Proussevitch and Kutolin, 1986; Proussevitch and Sahagian, 1996), can be ignored for
bubbles as large as a few meters. The perturbation of a spherical surface would remain small
for 1≥ R/Rmax ≥ 0.2 and will become violent for R/Rmax ≤ 0.1.
VI.5. Results: Comparison between measured, synthetic and video-derived acoustic waveforms
VI.5.1. Bubble vibration as a source of sound
In this section we first compare the synthetic acoustic waveform with the measured acoustic
waveform of the main acoustic pulse (part 2) on four large bubbles. The synthetic waveforms
are calculated from the bubble vibration model at the magma-air interface using equations
given in section VI.4.2. The objective is to fit both waveforms so as to validate the bubble
vibration model, and to give some quantitative estimates on physical parameters such as
magma thickness, radius, length, and overpressure of the bubble.
Afterwards, from the synthetic waveforms defined from the best fit of acoustic data, we can
derive the temporal evolution of the radius, velocity, acceleration and stability factor on each
large bubbles studied until bursting. We thus compare these parameters with the ones inferred
from video-derived calculation, based on the equation presented in section VI.4.3.
Finally, we are able to calculate the temporal evolution of acoustic pressure, and generate the
acoustic waveform corresponding to the bubble motion before bursting. This waveform is
then compared with the one inferred from acoustic measurements.
VI.5.1.1. Synthetic vs. measured acoustic waveform comparison
Each explosion at Etna can be modelled by the vibration of a large bubble, induced by the
residual overpressure left in the bubble approaching the top of the magma column. Similarly
to Stromboli volcano, the low-frequency content of the high amplitude acoustic event would
discard a mechanism of bubble bursting if solely based on a balloon bursting model.
186

Chapter VI – Acoustic and video correlations
At the input of the model we use particularly the mass of the oscillator that is related to the
thickness h of the magma layer above the bubble. This parameter, poorly constrained, is
assumed to be equal to the mean size of ejecta. Photoballistic studies at Etna show, for one
explosion of the North-East Crater in June 1969, that 50% of ejecta have a size between 0.1
and 0.4 m (McGetchin et al., 1974). Ground deposit studies have pointed out similar results at
Etna, from scoria blocks produced by Strombolian activity on July 25-31, 2001 (Metrich et
al., 2004), making this diameter range characteristic of ejecta at Etna. Previous studies on
acoustic modelling at Etna have shown that the best magma-layer equilibrium thickness heq
lies around 0.1 m.
At the output of the model, the best fit between measured and synthetic waveforms provides
three fundamental parameters: (1) the bubble nose radius, (2) the length of the bubble tail and
(3) the bubble overpressure. A previous study on the time evolution of the source parameters
at Etna SEC during the July 4, 2001 eruption gives a characteristic initial bubble radius Ro
equal to 5 m. Bubble length L and overpressure ∆P are estimated on average at about 15 m
and 0.22 MPa. In the present study, we worked specifically on the four large overpressurized
bubbles both recorded by the acoustic sensor and the video camera. The output parameters
carried out by the acoustic model are in agreement with the ones given by Vergniolle and
Ripepe (2008). Indeed the best fits between measured and synthetic acoustic data give an
initial radius of 5 m with a bubble length ranging from 6.5 m to 17 m and a bubble
overpressure lying from 0.29 MPa to 0.45 MPa. These values are summarized in Table VI.1.
Table VI.1. Characteristic parameters for 4 large bubbles at Etna SEC on July 4, 2001, inferred from best fit of the synthetic vibration model. Bubble 2135:35 Bubble 2138:10 Bubble 2142:32 Bubble 2143:04 Magma thickness (m) heq 0,1 0,08 0,1 0,15 Initial radius (m) Ro 5 5 5 5 Length (m) L 11 7 6,5 17 Overpressure (MPa) ∆P 0,45 0,29 0,34 0,35
The fit between measured and synthetic acoustic waveforms is always very good for about
half a cycle (Figure VI.14). Afterwards, we assume that the development of instabilities at the
interfaces leads the oscillations of the magma layer to move apart from a purely steady
oscillating regime represented by the acoustic model. As shown by the bubble at 2143:04 UT
in Figure VI.14, the amplitude of the first positive peak of the measured acoustic pressure is
perfectly matched by the synthetic model and reaches ≈ 60 Pa. By contrast, the negative peak
187

Chapter VI – Acoustic and video correlations
and the second positive peak are not well fitted. Indeed, acoustic pressures inferred from the
synthetic model reach about -135 Pa and 60 Pa, against -90 Pa and 30 Pa for the measured
acoustic pressures. On this example, the discrepancy between both acoustic signals occurs just
before the maximum negative pressure.
We also observe on the measured signal a slight augmentation of the acoustic pressure a few
tenths of a second before the strong increase of the first positive peak. This small increase,
lower than 10 Pa, is not taken into account by the acoustic model, but we presume that it
corresponds to the onset of the bubble expansion at the surface of the magma column. The
oscillating frequency inferred from the synthetic waveform is in agreement with the one of the
measured waveform over the whole cycle duration, i.e. about 1.1 Hz, and will permit the
quantitative and temporal comparison with acoustic waveform calculated from video analysis.
Figure VI.14. Best fit between the synthetic acoustic waveform (model) generated from the oscillation
bubble equations and measured acoustic waveform (data) for the bubble at 2143:04 UT.
VI.5.1.2. Synthetic vs. video-derived acoustic waveform comparison
In this section, we compare video-derived parameters with synthetic parameters inferred from
best-fit synthetic waveforms calculated theoretically from the bubble vibration model
(Figure VI.14). We focused, particularly, on the bubble radius (R), the magma layer velocity
( R& ) and acceleration ( R&& ), and on the stability factor CRT of the interfaces.
188

Chapter VI – Acoustic and video correlations
Figure VI.15. Evolution of the physical properties, (a) radius, (b) velocity, (c) acceleration and (d)
stability factor, at Etna SEC on July 4, 2001 for the bubble at 2138:10 UT derived from both video
measurements and synthetic bubble vibration model (see text for details).
We show on bubble at 2138:10 UT that the evolution of the radius (Figure VI.15a) has not a
linear trend, particularly at the beginning of the time series (t=0 s to t=0.6 s), where we can
observe a mild oscillation of the bubble radius. This tendency discards ballistic regime
mechanisms of discrete fragmented pyroclasts, and is thus compatible with the fact that the
bubble has not burst yet. Moreover, about 0.5 second after the onset of the video recording,
visual observations from video snapshots show that the magma-air interface is still not
fragmented.
In the following, we will thus mainly focus on this first half-second of video analysis. At the
onset of the video recording (t=0 s), we assume that the bubble is not at its minimum radius
(Rmin) because it has probably begun to grow into the crater at the surface of the lava column.
The first snapshot thus arises most likely a few tenths of a second later when the bubble
membrane rises above the crater rims. Our measurements give a bubble radius ranging from
189

Chapter VI – Acoustic and video correlations
about 9 m at the equilibrium radius (Req) to about 20 m at the maximum radius (Rmax). These
values differ slightly from the synthetic data that give an equilibrium radius of about 11 m and
a maximum radius of about 15 m. After Rmin, i.e. about 0.5 second after the beginning of the
video recording, the radius inferred from video measurements departs dramatically from the
theoretical purely no-damped vibration model.
This discrepancy can be explained from two distinct effects. (1) At this moment, instabilities
of the bubble-magma interfaces are at the maximum (Figure VI.15d) and can disorder the
steady oscillations. (2) The global expansion of the rising bubble is most likely a predominant
mechanism that adds up to the basic oscillation of the vibrating bubble. This effect makes the
bubble radius grow faster, and may account for at least 20% of the bubble radius value.
Remind, we have previously shown (Figure VI.14) that the synthetic waveform also does not
fit very well the measured acoustic waveform a few tenths of a second after the onset of the
bubble expansion. (3) The membrane may have punctured at this stage, leading to a sub-linear
trend of the bubble radius corresponding to the ballistic trajectories of disconnected blocks
propelled radially in the surrounding air.
The velocity (Figure VI.15b) and acceleration (Figure VI.15c) of the magma layer above the
bubble are determined from finite difference calculation of the radius, and both bring out a
high-amplitude oscillation pattern. The bubble membrane reaches its maximum velocity, of
about 140 m/s, at the very beginning of the video time series, close to the equilibrium radius
as expected theoretically. The synthetic model gives a lower estimate of the maximum
velocity. This difference can be easily explained, in addition to error margins related to video
measurements, by the global expansion effect that may increase the total resulting velocity of
the bubble membrane. The velocity then decreases rapidly to its minimum value, i.e. close to
0 m/s, near the second equilibrium radius as expected theoretically, but never becomes
negative. Indeed, the global bubble expansion effect impedes the bubble membrane to retract
enough in its contraction stage, in spite of the restoring force owing to the compressibility of
gas inside the bubble acting at the opposite of the steady bubble expansion. As a consequence,
the magma layer above the bubble never moves back and leads only the bubble to slow down.
We thus cannot observe negative velocity. However, we show that the characteristic
frequency of the velocity oscillations is in agreement with the one of the synthetic pattern, in
the time frame of about half a cycle. After this point, the development of instabilities may
affect the fundamental bubble oscillation cycle.
190

Chapter VI – Acoustic and video correlations
The acceleration parameter, even more sensitive to the radius variations than the velocity
parameter, clearly shows the different stages of expansion and contraction taking alternately
positive and negative values. The difference in amplitude of the first negative peak between
synthetic and video data can be explained by the same bubble expansion effect detailed above
for the velocity. The maximum negative and positive acceleration occur at Rmax and Rmin
respectively, as expected theoretically. The frequency of the bubble oscillation inferred from
video measurements is also in agreement with the one calculated theoretically from the
synthetic model.
The factor CRT is related to the stability of the bubble-magma interface. It is stable during the
cycle Req-Rmax-Req when CRT > 0 and becomes unstable at Req-Rmin-Req for a stability factor CRT
< 0. The stability factor calculated from video measurements is in agreement with the one
derived from the synthetic model. We show that the bubble-magma interface is stable at the
beginning of the video recording and becomes unstable at the equilibrium radius Req, at about
0.35 second. This result corroborate the fact that radius, velocity and acceleration patterns
significantly move apart from the theoretical model patterns after about half a cycle of bubble
vibration. Visual observations suggest that bubbles bursting arise a few tenths of a second
later, at about 0.6 s after the beginning of the video recording. However, we cannot be more
accurate because of technical hitches related to the video method, such as light scattering and
pixel saturation. We show nevertheless that the fragmentation of the magma layer above the
bubble most likely occurs into the cycle Req-Rmin-Req corresponding to the instability phase of
the bubble-magma interface. At this instant, the magma-air interface is observed stable from
video snapshots (Figure VI.5b) and show that membrane rupture is most likely controlled by
the bubble-magma interface instabilities. Note that when the bubble-magma interface is
stable, at the beginning of the video recording that corresponds to the cycle Req-Rmax-Req, we
observe on video snapshot (Figure VI.5a) that the magma-air interface is unstable, as
expected by the theory.
We also point out that the bubble breaks during the expansion stage, after the minimum
radius, and close to the maximum instability level of the bubble-magma interface. We assume
that the expansion/contraction cycle during which the magma layer breaks, partly controls the
ejection velocity of fragmented pyroclasts. However, the state of pressurisation of the bubble,
at the moment where the magma-layer breaks, is also very important, and should mostly
control the ejection velocity of pyroclasts through the gas release velocity. The combination
191

Chapter VI – Acoustic and video correlations
of both effects may thus be responsible for the large range of ejecta velocity encountered. In
the case of an overpressurized bubble, bursting during the expansion stage, we assume that
ejecta are expelled with high velocity. At the opposite, in the case of an underpressurized
bubble, bursting during the contraction stage, the velocity of pyroclasts is assumed to be low.
(a) (b)
Figure VI.16. Evolution of the internal bubble (a) pressure and (b) volume inferred from the synthetic
waveform best-fit on the bubble at 2138:10 UT during successive expansion/contraction stages of the
vibrating bubble prior bursting.
The internal bubble pressure (Figure VI.16a) and volume (Figure VI.16b) at the moment
where the bubble is assumed to burst can be estimated from the theoretical model by using
Equation VI.12. For the bubble at 2138:10 UT detailed above, the magmatic film breaks
around 0.6 s after the beginning of video measurements, during the expansion stage, and with
an internal bubble pressure of 2.1×10⁵ Pa and a volume of 1416 m3. This bubble is thus
overpressurized when it bursts, i.e., with an internal pressure higher than the atmospheric
pressure (Pair =1×10⁵). Results on the phase (expansion/contraction), pressure and volume are
given for the four large bubbles at the bursting time and summarized in Table VI.2.
Table VI.2. Quantitative estimates of internal pressure and volume on four large bubbles derived from the synthetic bubble vibration model.
Bubble 21h35'35'' Bubble 21h38'10'' Bubble 21h42'32'' Bubble 21h43'04'' Phase (E/C) Expansion Expansion Expansion Contraction Bubble pressure (Pa) 3.1×10⁴ 2.1×10⁵ 4.1×10⁵ 2.8×10⁵
Bubble volume (m3) 1537 1416 773 2508
192

Chapter VI – Acoustic and video correlations
VI.5.1.3. Video-derived vs. measured acoustic waveform comparison
Finally, we calculate the excess of acoustic pressure from video-derived parameters detailed
above (radius, velocity and acceleration), by using the Rayleigh-Plesset equation. We
compare the resulting acoustic waveform with the one inferred from acoustic measurements
recorded by the sensor on the bubble occurring at 2142:32 UT (Figure VI.17).
Figure VI.17. Comparison between video-derived acoustic waveform (video) and measured acoustic
waveform (data) on bubble at 2142:32 UT.
We show that amplitudes are fairly in agreement (Table VI.3) which confirms that such
bubble oscillations are able to generate high-amplitude acoustic pressure. Frequencies are
observed between 1 – 2 Hz in average for both measured and video-derived waveforms. This
result is compatible with bubble vibration mechanism as a source of sound. These values are
also in agreement with the results of Vergniolle and Ripepe (2008) at Etna SEC on July 4,
2001, and consistent with a source radius-conduit of about 5 m. As a comparison, bubble
oscillation frequency at Stromboli lies between 7 Hz and 9 Hz and hence corresponds to a
smaller source radius-conduit of about 1 m. The video-derived acoustic signal starts between
Rmin(1) and Req, at the middle of the expansion phase. That is well-explained by the fact that
bubble begins to grow beneath the crater rim, at the surface of the magma column, and
reaches the video field of view only a few tenths of a second later. The first positive acoustic
peak occurs right after Req, during the expansion phase. The negative acoustic peak occurs at
Rmax, as expected theoretically, and point out the beginning of the contraction stage. Finally,
the oscillation stops shortly after Rmin(2) in the expansion phase, with a high bubble internal
193

Chapter VI – Acoustic and video correlations
pressure (4.1×10⁵). The rupture of the thin magma-layer most likely arises at this moment,
after about a cycle of the bubble oscillation.
Table VI.3. Summary of the spectral content (frequency, duration and amplitudes) of the acoustic main pulse on the four bubbles inferred from both the visual analysis of recorded acoustic time series and video-derived measurements at Etna SEC on July 4, 2001. Bubble 21h35'35'' Bubble 21h38'10'' Bubble 21h42'32'' Bubble 21h43'04'' Video Acoustic Video Acoustic Video Acoustic Video AcousticFrequency (Hz) 2,5 1,1 1,61 1,79 1,37 1,32 1,18 1,06 Duration (s) 0,4 0,9 0,62 0,56 0,73 0,76 0,85 0,94 Amplitude max (Pa) 130 94 490 54 150 82 129 57 Amplitude min (Pa) -60 -100 -500 -85 -82 -100 -121 -92 Amplitude ratio 2,1 0,94 0,98 0,64 1,83 0,82 1,07 0,62
VI.5.2 Alternative mechanism: balloon bursting model
We have shown previously that the amplitude of the volume mode of the bubble is sufficient
to generate the recorded level of sound intensity. The video-derived analysis of acoustic
waveform has also provided some evidence of the bubble oscillation as being a possible
source of sound. However, the potential impulse nature of the bubble bursting mechanism
makes it an intuitive candidate to explain the main pulse in acoustic pressure. We now
consider the likelihood of the bubble bursting as the source of the main pulse of acoustic
pressure, keeping in mind the major role played by the dimensions of the source.
The balloon bursting model remains a possible mechanism of bubble bursting. The
characteristic frequency of the popping noise generated by this mechanism can be easily
calculated from Equation VI.6. This relation only depends on the sound velocity in air,
supposed constant in the time scale considered here, and on the radius of the bubble at
bursting time.
The instant of bubble breaking is not accurately known, but rough estimates of the bubble
radius at bursting time (Rburst) can nevertheless be given from video-derived calculation
carried out in previous section. We obtain a mean radius on the four large bubbles just before
bursting of Rburst ≈ 28 m, which gives a mean theoretical frequency derived from the balloon
bursting model of fb = 6.1 Hz. As a comparison, the theoretical frequency calculated on the
basis of the volume mode (vibration bubble model), gives a mean value on the four large
bubbles of fv = 1.2 Hz. Detailed values for each bubble are given in Table VI.4.
194

Chapter VI – Acoustic and video correlations
Table VI.4. Summary of the spectral content inferred from the detailed analysis of Fast Fourier Transform carried out on 10 s for 4 larges bubbles at Etna SEC on July 4, 2001.
Bubble 2135:35 UT Bubble 2138:10 UT Bubble 2142:32 UT Bubble 2143:04 UTRburst (m) 28 25 29 31
vf (Hz) 0.46 1.5 1.8 1
bf (Hz) 6 7 6 5.5 FFT- (Hz) αf 1.85 (6 Pa) 1.95 (5 Pa) 1.9 (5.4 Pa) 1.8 (5.2 Pa) FFT- (Hz) 1
βf 6.2 (0.44 Pa) 8.35 (0.36 Pa) 5.8 (0.56 Pa) 6.25 (0.31 Pa)
Volume mode frequencies are still in agreement with visual analysis carried out on the main
acoustic pulse of 9 large bubbles in section VI.3.2 (1.3 Hz). However, the energy released by
the popping noise (balloon bursting model) is likely to be low, require a more detailed
analysis of the spectral content.
A Fast Fourier Transform (FFT) is performed during the main pulse in acoustic pressure for
duration of 10 s; also, the use of logarithmic scales has permitted to point out low-amplitude
peaks. Figure VI.18 shows for the bubble at 2135:35 UT a first high-amplitude peak
(termed ) lying at about 1.85 Hz and reaching 6 Pa. Then we observe 3 successive
frequencies of lower amplitudes and peaking at about 6, 12, and 18 Hz. This arithmetic
sequence suggests a fundamental frequency of 6 Hz (termed ) with two harmonics = 12
Hz and = 18 Hz following the relation:
αf
1βf
2βf
3βf
burst
n
Rncf
2=β (VI.21)
Where c is the sound velocity in air taken as 340 m/s and n is the order of the harmonic. The
fundamental frequency ( ) is typically low amplitude with an acoustic pressure reaching
0.44 Pa, it means about one order of magnitude lower than the frequency peak . Values of
frequency and amplitude derived from the FFT analysis are given in Table VI.4 for each
bubble. We obtain mean values of 1.9 Hz and 5.4 Pa for , and mean values of 6.7 Hz and
0.4 Pa for .
1βf
αf
αf
1βf
195

Chapter VI – Acoustic and video correlations
Frequencies are in agreement with values inferred from the balloon bursting model and
show that this mechanism generating a very low-amplitude popping noise is probably at work
on such explosions. However, frequencies are clearly compatible with values derived
from volume mode frequencies (f
1βf
αf
v) and confirm that the oscillation of the bubble at the
magma-air interface is also at work. Most of all, high amplitude values of confirm the idea
that this mechanism is dominant.
αf
Figure VI.18. Fast Fourier Transform (FFT) of acoustic pressure on a time-window of 10 s in log-log
scale on the bubble at 2135:35 UT.
VI.6. Conclusion
Acoustic measurements have long been used for volcanic applications and turn out to be a
very powerful tool for remote sensing of hazardous volcanic targets. The great potential of
acoustic methods is valuable particularly for the retrieval of volcanic source parameters that
can be advantageously used into physical models of eruptions dynamics.
In this study we focus mainly on the mechanisms at the origin of the sound radiated by
Strombolian explosions, and recorded as a strong acoustic pulse. Several previous studies
(e.g., Vergniolle et al., 1996) have shown from synthetic models that the vibration of a bubble
expanding at the surface of the magma column could be theoretically at the origin of the
196

Chapter VI – Acoustic and video correlations
recorded acoustic waveforms. We show in the present study from direct observations the very
existence of a bubble oscillation at the magma-air interface as the source of sound.
Indeed, video snapshots analysis has permitted to give quantitative estimates of bubble radius,
velocity and acceleration, and showed the evolution of these parameters with time, pointing
out the cyclic expansion/contraction stages of the rising bubble. Then, these parameters have
been used to derive the acoustic pressure and permit to build acoustic waveforms on four
large bubbles occurring at Etna SEC during the eruption of July 4, 2001. The video analysis
has brought some quantitative constraints on the bubble bursting mechanism, also in
agreement with the theory. Indeed, we show that the rupture of the overlying magmatic film is
most likely related the development of instabilities on the bubble-magma interface. The ones
are directly produced by the oscillation (expansion/contraction) of the bubble. Figure VI.19
shows the schematic successive step of a bubble (only the upper hemisphere), from the onset
of visual observations, i.e., when the bubble rises above the crater rims, until it bursts. We
suggest that the membrane punctured close to Rmin, at the maximum instability of the bubble-
magma interface. At this stage, the velocity of the membrane is assumed to be zero, and the
acceleration positive.
We suppose that the expansion/contraction cycle, during which the magma layer breaks,
partly controls the ejection velocity of fragmented pyroclasts, as well as the state of
pressurization of the bubble. Considering the last stage on Figure VI.19, the bubble is in its
contraction stage between Req – Rmin, and in expansion between Rmin – Req, reaching a
maximum internal pressure at Rmin.
Figure VI.19. Sketch of the successive steps of a typical life-ending bubble rising above the crater
rims, showing the stability/instability phases on both interfaces (bubble-magma/magma-air) until the
bubble breaks.
197

Chapter VI – Acoustic and video correlations
However, the state of pressurisation of the bubble, at the moment where the magma-layer
breaks, is also very important, and should mostly control the ejection velocity of pyroclasts
through the gas release velocity. The combination of both effects may thus be responsible for
the large range of ejecta velocity encountered. In the case of an overpressurized bubble,
bursting during the expansion stage, we assume that ejecta are expelled with high velocity. At
the opposite, in the case of an underpressurized bubble, bursting during the contraction stage,
the velocity of pyroclasts is assumed to be low.
We have shown that the video-derived waveform is in fairly good agreement with both
synthetic and recorded acoustic waveforms, which first confirms that the vibration of a large
overpressurized bubble can generate sound with amplitude equal to the sound level recorded;
and then validates the synthetic model of bubble vibration. Therefore, the bubble vibration
model is used with some confidence to calculate fundamental source parameters. We give
particularly a quantitative estimate of the mean overpressure inside the bubble when reaching
the top of the magma column of ∆P = 0.36 MPa. We provide the mean internal bubble
pressure and volume at bursting time reaching Pg = 0.23 MPa and Vg = 1.6×10³ m3
respectively.
The spectral content analysis of recorded acoustic main pulses has given characteristic
frequency values ranging in average between 1 – 2 Hz. These values are in agreement with
frequencies calculated theoretically on the basis of the bubble vibration model (volume
mode). Nevertheless, we also point out an alternative mechanism as a possible source of
sound. Indeed the spectral content analysis has revealed higher frequencies with very low
amplitude, corresponding to theoretical frequency values calculated on the basis of the
balloon bursting model lying around 6 Hz. We thus consider that the bubble bursting
mechanism is a possible additional source of sound, although it shows amplitude about one
order of magnitude lower. This result supports the idea that the bubble membrane oscillation
prior to bursting is much more energetic, and confirms the bubble vibration model as
dominant mechanism.
The complexity of bubble vibration and bursting mechanisms, associated with the difficulties
to study large scale phenomena in the natural environment, suggest that further experimental
investigations would probably enhance the understanding of life-ending bubble mechanisms.
198

CHAPTER VII
Acoustic-radar correlations: constraints on the shallow
dynamics of Strombolian explosions


Chapter VII – Acoustic and radar correlations
VII.1. Introduction
Studies carried out in this thesis focused on the better understanding of radar signals through
numerical modelling and detailed analysis of Doppler radar measurements and to some extent,
on acoustic measurements. The objective of this section is to combine both methods in order
to bring further constraints on the Strombolian dynamics. This study is a preliminary work
and necessitates further investigations. Acoustic measurements depict sub-surface
mechanisms directly at the origin of the surface activity monitored by VOLDORAD.
The study of acoustic signals has provided particularly quantitative information on the
internal bubble pressure. This parameter is potentially very important for the understanding of
source mechanisms at the origin of gas and hence particles ejection. On the other hand, the
study of Doppler radar signals has brought accurate constraints on particle and gas velocities.
We first focus in this preliminary work on temporal correlations between Acoustic pressure
and Doppler radar signals. Then we study the quantitative correlations between, mainly,
acoustic pressure and radial velocities recorded by VOLDORAD. Finally, we present a
method to derive the initial gas velocity from acoustic power calculation, subsequently
compared with radar-derived initial gas velocities. This work has been carried out on various
time scales, during the eruption of July 4, 2001 at Etna SEC.
VII.2. Temporal correlations of acoustic and radar measurements
VII.2.1. The case of four large bubbles
We show here the temporal correlation (Figure VII.1) between acoustic and Doppler radar
measurements on one of the four large bubbles studied previously, performed on short
sequence of time, and occurring at 2143:04 UT. We provide in the first subplot the recorded
acoustic pressure, sampled at 1200 Hz. In the second and third subplot we present
respectively the radar power and velocity sampled at about 10 Hz. The radar power (P+) given
here corresponds to the reflectivity of ascending particles in the range gate G3, and the
velocity (V+max) corresponds to the maximum radial velocity of presumably fine particles in
the range gate G3. For the first time, radar and acoustic temporal series can be compared
simultaneously. Many qualitative information are revealed from these preliminary
correlations.
201
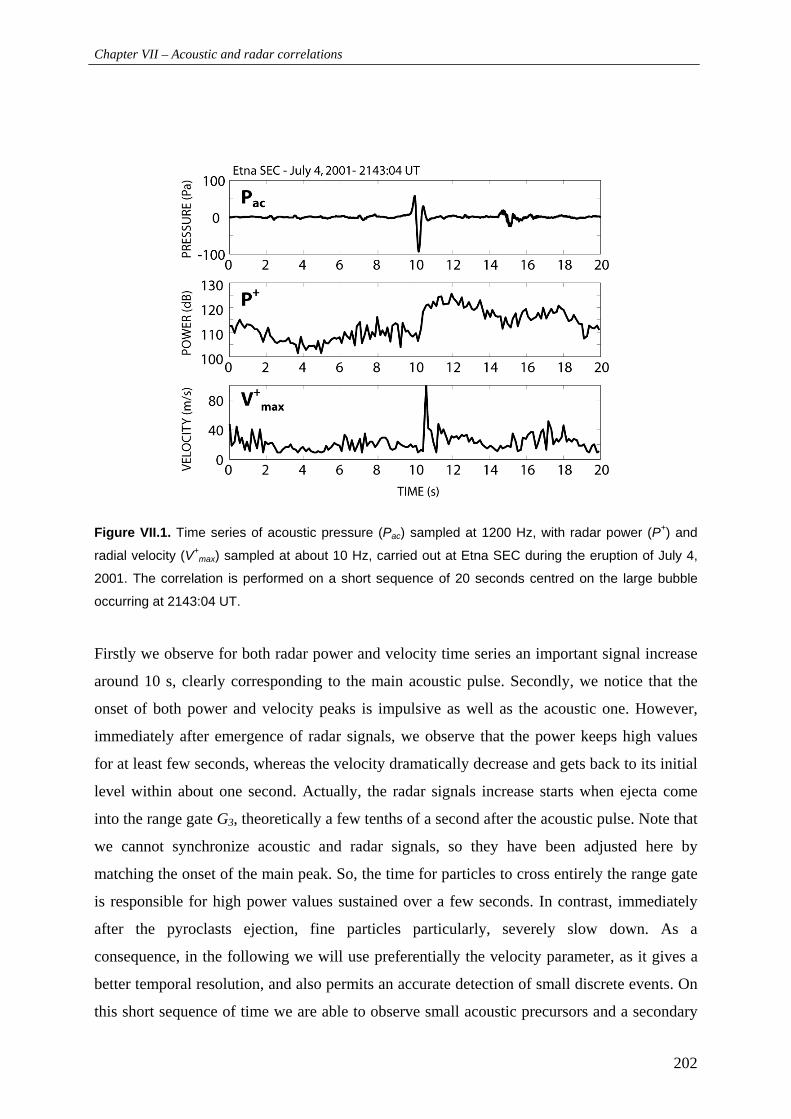
Chapter VII – Acoustic and radar correlations
Figure VII.1. Time series of acoustic pressure (Pac) sampled at 1200 Hz, with radar power (P+) and
radial velocity (V+max) sampled at about 10 Hz, carried out at Etna SEC during the eruption of July 4,
2001. The correlation is performed on a short sequence of 20 seconds centred on the large bubble
occurring at 2143:04 UT.
Firstly we observe for both radar power and velocity time series an important signal increase
around 10 s, clearly corresponding to the main acoustic pulse. Secondly, we notice that the
onset of both power and velocity peaks is impulsive as well as the acoustic one. However,
immediately after emergence of radar signals, we observe that the power keeps high values
for at least few seconds, whereas the velocity dramatically decrease and gets back to its initial
level within about one second. Actually, the radar signals increase starts when ejecta come
into the range gate G3, theoretically a few tenths of a second after the acoustic pulse. Note that
we cannot synchronize acoustic and radar signals, so they have been adjusted here by
matching the onset of the main peak. So, the time for particles to cross entirely the range gate
is responsible for high power values sustained over a few seconds. In contrast, immediately
after the pyroclasts ejection, fine particles particularly, severely slow down. As a
consequence, in the following we will use preferentially the velocity parameter, as it gives a
better temporal resolution, and also permits an accurate detection of small discrete events. On
this short sequence of time we are able to observe small acoustic precursors and a secondary
202

Chapter VII – Acoustic and radar correlations
event occurring at about 15 s. These low-amplitude signals are also observed on radar signals
with lower power and velocity values but not temporally well-defined. This result would
suggest that the amount and velocity of volcanic material ejected could depend, to some
extent at least, on the bubble overpressure.
VII.2.2. Analysis of a 100-s sequence of Strombolian activity
Now we compare the acoustic pressure (1200 Hz) and the maximum radial velocity (10 Hz)
time series on a longer period of time (100 s) starting during the paroxysm of the July-4
eruption at 2136:00 UT (Figure VII.2). The analysis of this sequence confirms the good
temporal correlation peak-to-peak. We show particularly that for most of acoustic pressure
peaks, we can observe a high velocity value recorded by the radar, which corroborates first
observations on the correlation of both parameters. However in some cases, we also observe
relatively high radar velocity values corresponding to very low acoustic pressure. Some
examples to illustrate this singular discrepancy are shown in Figure VII.2 by dotted
rectangles.
The acoustic pressure is assumed to be generated by the oscillation of bubbles reaching the
top of the magma column prior to bursting (Chapter VI), and depends particularly on the
radius and overpressure of the bubble. Therefore, we suggest that small bubbles highly
pressurized cannot generate high acoustic values, whereas ejecta velocity, depending mostly
on the gas phase expansion (i.e., the internal bubble pressure at bursting time), can reach
relatively high values.
Other mechanisms can also be considered to explain these occasional discrepancies. Mainly,
the passive degassing can induce significant rising velocities of very small particles and gas
above the vent, but the sound radiated by such a depressurized mechanism is almost certainly
not detected by the acoustic sensor. We also suppose that small instabilities mechanisms
developing at the surface of the magma column when the rising bubble is still at depth. Indeed
if the magma-air interface distorts sufficiently, some lava fragments can disconnect from the
magma layer and cross the above radar range gate with a significant velocity.
203

Chapter VII – Acoustic and radar correlations
Figure VII.2. Time series of acoustic pressure and radar radial velocity realized on a 100-s sequence
starting at 2136:00 UT, during the July-4 eruption.
Generally, in spite of some differences occurring punctually, we show the very existence of a
temporal correlation between acoustic pressure and particles velocity ejected upward. Also,
we point out a relation, qualitative at least, between both parameters (acoustic pressure and
particles velocity) suggesting that the internal gas bubble pressure is responsible at first order
of the velocity of ejecta.
VII.2.3. Acoustic pressure as a function of the radial velocity
In order to better interpret this result we have carried out further acoustic and radar velocity
measurements related to peak values only, for about 80 explosions occurring during the
paroxysm (Figure VII.3). Acoustic pressure values range from about 5 to 50 Pa and
correspond to explosions of low to mild amplitude. Comparatively, we obtain radial velocities
ranging from 25 to 90 m/s. We show a positive correlation between acoustic pressure and
radial velocity for explosions of small intensity. Over about 30 Pa and 50 m/s, the dispersion
204

Chapter VII – Acoustic and radar correlations
increases significantly. We finally calculate the best fit for all explosions measured, which
gives a quadratic relation as Pac = 0.01(V+max)2.
Figure VII.3. Plot of the acoustic pressure as a function of the radial velocity recorded by the Doppler
radar on about 80 explosions carried out at Etna SEC between 2100:00 UT and 2200:00 UT on July 4,
2001.
VII.3. Gas velocity correlations from acoustic and radar measurements
VII.3.1. Calculation of the gas velocity from acoustic measurements
The average gas velocity can be estimated from acoustic measurements, by using the acoustic
power Pm (Woulff and McGetchin, 1976; Vergniolle et al., 2004):
41
2 ⎥⎦
⎤⎢⎣
⎡=
cairm
airmgas RK
CPV
πρ (VII.1)
Where Rc is the conduit radius, estimated at about 5 m at Etna SEC, ρair is the air density
(≈ 1 kg/m3), Cair the sound velocity in air (≈ 340 m/s), and Km a constant equal to 1 for a
sphere.
205

Chapter VII – Acoustic and radar correlations
VII.3.2. Example on 9 large bubbles
We have carried out gas velocity estimations from maximum radial velocity (V+max) and
acoustic power (Pm) measurements on 9 large bubbles occurring during the paroxysm of the
July-4 eruption, between about 2130:00 UT and 2145:00 UT (Figure VII.4). Importantly, gas
velocities derived from acoustic measurement are source velocities, i.e., at the top of the
magma column, therefore radar velocity measurements have to be extrapolated at the source
(initial velocity). For this purpose, we use the source parameter retrieval method developed in
Chapter III, applying the geometrical and elevation correction coefficients to obtain the initial
gas velocity. We obtain (Figure VII.4) mean initial gas velocities of 118 and 50 m/s from
radar and acoustic measurements respectively. The difference is quite large and we show that
the dispersion of acoustic-derived gas velocities is important, with a standard deviation of 12
m/s (i.e., 24% of the mean value). In contrast, radar-derived gas velocities show a lower
dispersion with a standard deviation of 8 m/s (i.e., 7% of the mean value). The low variability
of radar data and the good correlation with video-derived gas velocities given in chapter III
lead us to suggest that the acoustic estimation method underestimates initial gas velocity
values by at least a factor of 2.
(b)(a)
Figure VII.4. Plot of the initial gas velocity for 9 large bubbles (the same as in chapter III) occurring at
Etna SEC during the eruption of July 4, 2001 between 2130:00 UT and 2145:00 UT derived from (a)
Doppler radar measurements and (b) acoustic measurements.
206

Chapter VII – Acoustic and radar correlations
VII.3.3. Analysis of a 100-s sequence of Strombolian activity
We have shown previously from Figure VII.2 punctual discrepancies between the acoustic
pressure and the radial velocity recorded by VOLDORAD. We show here, in addition to the
global underestimation of acoustic-derived gas velocities, the same occasional discrepancies.
We provide in Figure VII.5, a 100-s time series of acoustic and radar initial gas velocities
starting at 2136:00 UT. First we show, as well as for acoustic pressure, that the peak-to-peak
temporal correlation between both sets of initial gas velocities is good. However, we also
point out local discrepancies of velocity values. The best peak correlations are indicated with
the number (1), and those which raise some uncertainties with the number (0). We observe for
the peaks in the dotted rectangle that both acoustic-derived gas velocities are rather similar
(~55m/s), whereas radar-derived velocities give significantly different values (80 – 120 m/s).
As acoustic-derived gas velocities are calculated from the acoustic pressure, we suggest the
same possible source of discrepancies (e.g., small bubbles highly pressurized, passive
degassing, and instabilities). However, the variability of radar velocities from one explosion
to another (see Chapter III) related to possible biases on radar measurements has also to be
considered. Note that the mean gas velocity values for all referenced peaks reach 40 and
95 m/s from acoustic and radar methods respectively.
Figure VII.5. Time series of initial gas velocities derived from acoustic and Doppler radar
measurements on a 100-s sequence starting at 2136:00 UT during the eruption of July 4, 2001 at Etna
SEC.
207

Chapter VII – Acoustic and radar correlations
VII.3.4. Long period correlation between acoustic and radar measurements
The analysis of relatively short sequences of Strombolian activity has shown some local
quantitative discrepancies between acoustic-derived velocities or pressures and radar-derived
velocities. Keeping in mind these differences, we point out now the very good agreement of
both trends over long periods. We show in Figure VII.6 time series of initial gas velocity
derived from acoustic and radar measurements, lasting 25 min at the end of the paroxysm
(2200:00 UT – 2225:00 UT). We have chosen this period because at that time the activity is
very irregular, showing alternately periods of quiescence and of intense activity, which allow
us to compare more easily the long-term evolution of both signals. We observe in
Figure VII.6, that both signals follow closely the same evolution. This similarity strongly
confirms the relation between the acoustic-derived velocities, i.e., the acoustic pressure, and
the radar-derived velocities.
Figure VII.6. Time series of initial gas velocities derived from radar and acoustic measurements on a
long sequence carried out from 2200:00 UT and 2225:00 UT at the end of the paroxysm of the July-4
eruption.
208

Chapter VII – Acoustic and radar correlations
VII.4. Conclusion
This study on radar-acoustic correlations is a very preliminary work; however it has pointed
out some important features on both signals. First we have shown that the temporal
correlation from peak-to-peak events and the long term measurements are very good. Indeed,
the acoustic method portrays sub-surface mechanisms (from a few meters to the magma-air
interface) directly at the origin of surface manifestations recorded by the Doppler radar. Then,
we show that the amplitude of acoustic pressure and radar velocity are in fairly good
agreement following roughly a quadratic power law. We have also pointed out that some
discrepancies remain punctually between the acoustic pressure and radar velocities. We
suggest principally as possible sources of differences, the presence of smaller bubbles highly
pressurized, passive degassing or instabilities developing at the surface of the magma column.
Finally, estimations of initial gas velocities have been achieved from the calculation of the
acoustic power. It reveals initial gas velocity values (40 – 50m/s) underestimated at least by a
factor 2 compared to the Doppler radar estimations of initial gas velocity (95 – 118 m/s). The
radar-acoustic correlation turns out to be potentially valuable for the understanding of shallow
processes at work during Strombolian explosions. This multidisciplinary approach could be
further strengthened by using loading parameters (e.g., gas/particles mass flux) inferred
particularly from the backscattered power measured by VOLDORAD.
209


CONCLUSIONS AND FURTHER WORKS


Conclusions and further works
First part: Doppler radar study
The objective of this thesis was to bring more stringent constraints, particularly from the
development of methodological procedures, on the interpretation of Doppler radar data with
the final aim of better understanding eruption processes.
The thorough analysis of Strombolian explosions carried out by ground-based Doppler radar
at Etna Southeast Crater (SEC) in July 4, 2001, has permitted to obtain a wide range of source
parameters, mainly related to kinetic, loading and geometrical features. The kinetic study has
allowed the determination of a minimum estimate of the initial gas velocity, i.e., close to the
vent, from V+max parameter. We provide on more than 150 explosions selected during the
paroxysm, a mean initial gas velocity of about 144 m/s. We gain from V+mean a first order
estimate of the mean initial particle velocity (67 m/s) and mean particle diameter (0.26 m).
These estimations have been corroborated in average by video-derived velocities, although we
have shown that some individual discrepancies remain. Indeed, in addition to possible errors
inherent of both methods, we mention as potential further biases the high sensitivity of gas
velocity calculation, particularly, to the geometry of the explosion. Finally, the acquisition of
initial gas velocity has permitted us to calculate velocity-derived parameters such as gas
masses and volumes released during the Strombolian eruption occurring on July 4, 2001 at
Etna SEC. We obtain an average gas volume flux of = 6.03x10gQ 3 m3/s, and a gas mass flux
of about Mg = 2.4x10³ Kg/s.
In addition to the kinetic data, we have achieved a new step to recover the mass of ejected
pyroclasts from remote measurements of particles reflectivity with a volcano Doppler radar
(Gouhier and Donnadieu, 2008). Results obtained for two Strombolian explosions occurring
in July 4, 2001, at Etna SEC give a total mass of ejected pyroclasts of about 58 tons for a low
concentration lava jet and 206 tons for a dense lava jet. The ejected volumes of pyroclasts are
evaluated at 28 and 103 m3 (DRE volumes: 21.6 m3 and 76.3 m3) with a mass concentration
over the sampling volume of about 18 g.m-3 and 63.6 g.m-3 for explosions 1 and 2
respectively. We deduce a mean kinetic energy of 4.2.107 J and 3.9.108 J, from the time-
averaged maximum radial velocities, 37.9 m/s and 61.6 m/s for explosion 1 and 2
respectively. Finally we provide the ejecta mass flux of each explosions, 26.4 t/s and 73.6 t/s
from the explosion duration of 2.2 s and 2.8 s respectively. These results are inferred from a
213

Conclusions and further works
polydisperse particle size distribution model, but we also developed a monodisperse
approximation, with an accuracy of about 25% with respect to the pluridisperse model, that
enables first order assessment of the pyroclasts mass in real-time, useful for volcano
monitoring.
Finally, we have provided some interesting geometrical features on typical Strombolian jets.
Particularly, we point out two distinct signatures: Top-hat-shaped Doppler spectrum related to
isotropic ejection angle distribution, and Triangular-shaped Doppler spectrum related to
anisotropic ejection angle distribution. In addition we were able to give statistical quantitative
information on geometrical features carried out on a large number of typical Strombolian
explosions. Particularly we find that 30-40° might be a statistically representative value for
the isotropic ejection cone of Strombolian lava jets, at least at Etna, and we search out that
typical Strombolian explosions contain most of their ejecta (80–90%) within a relatively
narrow dispersion cone (30–40°) centred vertically.
This work has been achieved from Doppler radar (VOLDORAD) measurements carried out at
Etna SEC during the eruption of July 4, 2001, and solely focus on the Strombolian dynamics.
Nevertheless, results emphasized in this study have to be regarded with the scope of a more
general application. Processing methods, theoretical forward models and inversion procedures
developed here can hence be utilized as starting point for further works on other eruption
styles at different volcanoes. Generally we have shown that VOLDORAD has a great
potential for the detection of even very dilute explosions, and hence turns out to be a powerful
tool for real-time monitoring and early warnings of volcanic eruptions. In addition to its
monitoring potential, we demonstrated its capability for the detailed analysis of lava jets and
quantitative assessment of physical source parameters, valuable to the volcanological
community as well as for ash dispersal prediction models, used for instance by VAACs
(Volcanic Ash Advisory Centres), devoted to the risk mitigation.
Additional correlations with other remote sensing instruments that probe the surface activity
would permit first the validation and improvement of Doppler radar estimates, and then it
should bring further information on surface processes. For instance, infrared imagery method
such as FLIR could replace conventional (visible) video and be utilized particularly for the
detection as well as quantification of hot gases velocity. Besides, spectrometric techniques
such as DOAS or FTIR, devoted to the study of gas concentration, could be advantageously
214

Conclusions and further works
coupled with Doppler radar velocimetric measurements to derive accurate gas flux estimates.
Also, a coupled approach with satellite-based and ground-based method would probably
constitute a valuable step forward for the monitoring of active volcanoes from early warnings
(ground-based) to the long range track evolution of ash dispersal (satellite-based).
Second part: multi-method approach
In the second part of this thesis we focused on the study of acoustic measurements carried out
at Etna during the same eruption. This method is particularly interesting to describe shallow
processes at the interface between the surface and the chamber, and comparison with methods
that portray the surface activity (Video and Doppler radar) has brought interesting constraints
on the decoupling of physical processes from depth to the surface.
First we gave some evidence, from direct coupled observations, of the very existence of a
bubble oscillation at the magma-air interface as the source of sound. Indeed, video snapshots
analysis has permitted to give quantitative estimates of bubble radius, velocity and
acceleration that showed the cyclic evolution of expansion/contraction stages of the rising
bubble. The thorough inspection of video snapshots, associated with theoretical evidences,
has shown a magmatic film rupture mechanism by development of instabilities at the bubble-
magma interface.
Then, the bubble vibration model is used with some confidence to calculate fundamental
source parameters. We give particularly a quantitative estimate of the mean overpressure
inside the bubble when reaching the top of the magma column of ∆P = 0.36 MPa, and we
provide the mean internal bubble pressure and volume at bursting time reaching
Pg = 0.23 MPa and Vg = 1.6×10³ m3 respectively.
However in spite of these strong constraints on the origin of sound, our results on the spectral
content analysis do not exclude a possible source of sound from a bursting mechanism based
on the balloon bursting model, although much less energetic showing an amplitude about one
order of magnitude lower. The complexity of bubble vibration and bursting mechanisms,
associated with the difficulties to study large scale phenomena in the natural environment,
suggests that further experimental investigations would probably enhance the understanding
of life-ending bubble mechanisms.
Finally the study of correlations between acoustic and Doppler radar measurements carried
out in this thesis has to be regarded has preliminary work. However, it has pointed out some
important features on the relationship of both signals.
215

Conclusions and further works
First we have shown that the temporal correlation from peak-to-peak as well as long range
measurements is very good. Indeed, the acoustic method portrays shallow physical
mechanisms directly at the origin of surface manifestations recorded by the Doppler radar as
overpressurized bubble bursting is at the origin of the fragmentation and ejection of lava clots
subsequently recorded by VOLDORAD. This relationship is confirmed from measurements,
carried out on about 80 Strombolian explosions, of acoustic pressure amplitude and radar
radial velocities of fine particles ejected subsequently. We show particularly that both sets of
data are in fairly good agreement following roughly a quadratic power law.
We have also pointed out punctual discrepancies between the acoustic pressure and radar
velocities. We suggest that small bubbles highly pressurized, passive degassing, and
instabilities developing at the surface of the magma column can be the possible source of
difference Estimations of initial gas velocities has been realised from the calculation of
acoustic power. It reveals initial gas velocity values (40 – 50 m/s) underestimated at least by a
factor of 2 compared to the Doppler radar estimations of initial gas velocity (95 – 118 m/s).
Although radar derived gas velocity can meet some biases, this difference between both
methods has to be considered carefully, particularly for gas flux estimates from acoustic
measurements.
This multidisciplinary approach would be further investigated by comparing pyroclasts mass
that can be estimated from both acoustic and radar techniques. Furthermore, a better time
synchronization of both signals would permits the in-depth analysis (<1 sec) of bubble
membrane rupture processes.
216

REFERENCES


References
– A – Adams, R. J., W. F. Perger, W. I. Rose, and A. Kostinski (1996), Measurements of the
complex dielectric constant of volcanic ash from 4 to 19 GHz, J.Geophys.Res., 101, 8175-8185.
Allard, P. (1995), Mount Etna: a major source of volcanic volatiles to the troposphere (abstract), VIII Assembly Europ. Union of Geosciences, Strasbourg, IV-U, 101.
Allard, P. (1997), Endogeneous magma degassing and storage at Mount Etna, Geophys. Res. Lett., 24, 2219–2222.
Allard, P., N. Bruno, T. Catabiano, M.F. Grasso, N. Lefol, H. Loyer, R. Pinte, M. Porto, and R.Romano (1994a), Etna’s crater plume emissions during June 93-March 94 post-eruptive activity: volatile fluxes and magma degassing rate, Proc. Int. Workshop Europ. Laboratory Volcanoes, Aci Castello, Italy, 68-75.
Allard, P., M. Burton and F. Murè (2005), Spectroscopic evidence for a lava fountain driven by previously accumulated magmatic gas, Nature, 433, 407-410, doi:10.1038/nature03246.
Allard, P., J. Carbonelle, M. Métrich, H. Loyer and P. Zettwoog (1994b), Sulfur output and magma degassing budget of Stromboli volcano, Nature, 368, 326-330.
Allard, P., J. Carbonnelle, D. Dajlevic, J.C. Le Bronec, P. Morel, J.M. Maurenas, M.C. Robe, R. Faivre-Pierret, J.C. Sabroux and P. Zettwoog (1991), Eruptive and diffuse emissions of carbon dioxide from Etna volcano, Nature, 351, 387-391.
Allard, P., B. Behncke, S.D'Amico, M. Neri, S. Gambino (2006), Mount Etna 1993–2005: Anatomy of an evolving eruptive cycle, Earth-Science Reviews 78, 85–114.
– B –
Batchelor, G. K. (1967), An Introduction to Fluid Dynamics, Cambridge Univ. Press, New
York, 615 pp. Behncke, B. and M. Neri (2003a), The July-August 2001 eruption of Mt. Etna (Sicily), Bull.
Volcanol., 65, 461–476, doi:10.1007/s00445-003-0274-1. Behncke, B. and M. Neri (2003b), Cycles and trends in the recent eruptive behaviout of Mt.
Etna (Italy), Can. J. Earth Sci., 40, 1405-1411, doi:10.1139/E03-052. Behncke, B., M. Neri, and G. Sturiale (2004), Rapid morphological changes at the summit of
an active volcano: reappraisal of the poorly documented 1964 eruption of Mount Etna (Italy), Geomorphology, 63, 203–218, doi:10.1016/j.geomorph.2004.04.004.
Blackburn, E.A., L. Wilson and R.S.J. Sparks (1976), Mechanisms and dynamics of Strombolian activity, J. Geol. Soc. (Lond.), 132, 429-440.
Bluth, G.J.S., C.C. Schnetzler, A.J. Krueger and L.S. Walter (1993), The contribution of explosive volcanism to global atmospheric sulphur dioxide concentrations, Nature, 366, 327-329.
Bluth, G.J.S., J.M. Shannon, I.M. Watson, A.J. Prata and V.J. Realmuto (2007), Development of an ultra-violet digital camera for volcanic SO2 imaging, J. Volcanol. Geotherm. Res., 161, 47-56, doi:10.1016/j.jvolgeores.2006.11.004.
Bohren, C. F., and D. R. Huffman (1983), Absorption and Scattering of Light by small Particles, Wiley-Interscience, New York, 489 pp.
Branca, S., M. Coltelli, G. Groppelli (2004), Geological Evolution of Etna Volcano, in Mt Etna: Volcano Laboratory, Geophys. Monogr. Ser., vol. 143, edited by A. Bonaccorso et al., pp. 49– 63, AGU, Washington, D.C.
219

References
Bruno, N., T. Caltabianoa, S. Giammanco, and R. Romanoa (2001), Degassing of SO2 and CO2 at Mount Etna (Sicily) as an indicator of pre-eruptive ascent and shallow emplacement of magma, J. Volcanol. Geotherm. Res., 110, 137-153, doi:10.1016/S0377-0273(01)00201-3.
Buckingham, M.J., and M.A. Garcès (1996), A canonical model of volcano acoustics, J. Geophys. Res., 101, 8129-8151.
Burton, M., P. Allard, F. Muré, A. La Spina (2007), Magmatic Gas Composition Reveals the Source Depth of Slug-Driven Strombolian Explosive Activity, Science, Vol. 317. no. 5835, pp. 227 – 230, DOI: 10.1126/science.1141900.
– C –
Caltabiano, T., R. Romano, and G. Budetta (1994), SO2 flux measurements at Mount Etna
(Sicily), J. Geophys. Res., 99, 12809–12819. Carn, S. A., A. J. Prata, and S. Karlsdóttir (2008), Circumpolar transport of a volcanic cloud
from Hekla (Iceland), J. Geophys. Res., 113, D14311, doi:10.1029/2008JD009878. Chiarabba, C., A. Amato, E. Boschi, Barberi, F. (2000), Recent seismicity and tomographic
modeling of the Mount Etna plumbing system, J. Geophys. Res., 105, 10923-10938, doi : 10.1029/1999JB900427.
Chouet, B., N. Hamisevicz, and T. R. McGetchin (1974), Photoballistics of Volcanic Jet Activity at Stromboli, Italy, J. Geophys. Res., 79, 4961-4976.
Chouet, B., G. Saccorotti, P. Dawson, M. Martini, R. Scarpa, G. De Luca, G. Milana and M. Cattaneo (1999), Broadband measurements of the sources of explosions at Stromboli volcano, Italy, Geophys. Res. Lett., 26, 1937-1940.
Clocchiatti, R., P. Schiano, L. Ottolini and P. Bottazzi (1998), Earlier alkaline and transitional magmatic pulsation of Mt Etna volcano, Earth Planet. Sci. Lett.,163, 399-407, doi:10.1016/S0012-821X(98)00170-8.
Coltelli, M., P. Del Carlo, M. Pompilio, and L. Vezzoli (2005), Explosive eruption of a picrite: The 3930 BP subplinian eruption of Etna volcano (Italy), Geophys. Res. Lett., 32, L23307, doi:10.1029/2005GL024271.
Condomines, M., J-C. Tanguy and V. Michaud (1995), Magma dynamics at Mt Etna: Constraints from U-Th-Ra-Pb radioactive disequilibria and Sr isotopes in historical lavas, Earth Planet. Sci. Lett., 132, 25–41.
Corsaro R.A., M. Neri and M. Pompilio (2002), Paleo-environmental and volcano-tectonic evolution of the southeastern flank of Mt. Etna during the last 225 ka inferred from the volcanic succession of the ‘Timpe’, Acireale, Sicily, J. Volcanol. Geotherm. Res., 113, 289-306, doi:10.1016/S0377-0273(01)00262-1.
Corsaro, R.A., and M. Pompilio (2004a), Dynamics of magmas at Mount Etna, In: Calvari, S., A. Bonaccorso, M. Coltelli, C. Del Negro and S. Falsaperla (Eds.), Mt. Etna: Volcano Laboratory, Am. Geophys. Union Geophys. Monogr., 143, 91–110.
Corsaro, R.A., and M. Pompilio (2004b), Buoyancy-controlled eruption of magmas at Mt Etna, Terra Nova, 16, 16–22, doi:10.1046/j.1365-3121.2003.00520.x.
– D –
Dean, K., S. A. Bowling, G. Shaw, and H. Tanaka (1994), Satellite analyses of movement and
characteristics of the Redoubt Volcano plume, J. Volcanol. Geotherm. Res., 62, 339-352.
220

References
De Gori, P., C. Chiarabba, and D. Patanè (2005), Qp structure of Mt. Etna: constraints for the physics of the plumbing system, J. Geophys. Res., 110, B05303, doi:10.1029/2003JB002875.
Dehn, J., K. Dean, and K. Engle (2000), Thermal monitoring of North Pacific volcanoes from space Geology, 28, 755-758.
Del Carlo, P., L. Vezzoli, and M. Coltelli (2004), Last 100 ka Tephrostratigraphic record of Mount Etna, in Mt Etna: Volcano Laboratory, Geophys. Monogr. Ser., vol. 143, edited by A. Bonaccorso et al., pp. 77– 89, AGU, Washington, D.C.
Donnadieu F., G. Dubosclard, P. Allard, R. Cordesses, C. Hervier, J. Kornprobst and J. F. Lénat (2003), Sondages des jets volcaniques par radar Doppler : applications à l’Etna. Rapport quadriennal /C.N.F.G.G/. 1999-2002, p.119-124/.
Donnadieu, F., G. Dubosclard, R. Cordesses, T. Druitt, C. Hervier, J. Kornprobst, J. F. Lénat, P. Allard, and M. Coltelli (2005), Remotely Monitoring Volcanic Activity with Ground-Based Doppler Radar, EOS Trans. AGU, 86, 204.
Donnadieu F., G. Dubosclard, R. Cordesses, C. Hervier, P. Allard, M. Gouhier. Monitoring of volcanic jets by Doppler radar: 1. Application to the July 2001 South East Crater activity on Etna. in prep.
Doviak, R. J., and D. S. Zrnic (1984), Doppler radar and weather observations, Academic
Press, Inc., 562pp. Dubosclard, G., R. Cordesses, P. Allard, C. Hervier, M. Coltelli, and J. Kornprobst (1999),
First testing of a Volcano Doppler Radar (Voldorad) at Mt.Etna, Geophys. Res. Lett., 26, 3389-3392.
Dubosclard, G., F. Donnadieu, P. Allard, R. Cordesses, C. Hervier, M. Coltelli, E. Privitera, and J. Kornprobst (2004), Doppler radar sounding of volcanic eruption dynamics at Mount Etna, Bull. Volcanol., 66, 443-456, doi:10.1007/s00445-003-0324-8.
– F –
Fagents, S.A., and L. Wilson (1993), Explosive volcanic eruptions: VII. The range of
pyroclasts ejected in transient explosions, Geophys. J. Int., 113, 359-370. Francalanci, L., P. Manetti, and A. Pecerillo (1989), Volcanological and magmatological
evolution of Stromboli volcano (Aeolian islands): The roles of fractional crystallization, magma mixing, crustal contamination and source heterogeneity, Bull. Volcanol., 51, 335-378.
Francis P., C. Chaffin, A. Maciejewski, and C. Oppenheimer (1996), Remote determination of SiF4 in volcanic plumes : a new tool for volcano monitoring, Geophys. Res. Lett., 23, 249-252.
– G –
Garcès, M.A., S.R. McNutt, R.A. Hansen, and J.C. Eichelberger (2000), Application of wave-
theoretical seismoacoustic models to the interpretation of explosion and eruption tremor signals radiated by Pavlov volcano, Alaska, J. Geophys. Res., 105, 3039-3058.
Gemellaro, C. (1858), La Vulcanologia dell’Etna, Accademia Gioenia di scienze Naturali, Rist. Maimone, 100–111.
Gillot, P.Y., G. Kieffer and R. Romano (1994), Evolution of Mt. Etna volcano in the light of potasium–argon dating, Acta Vulcanologica, 5, 81–87.
Gouhier, M., and F. Donnadieu (2006), Numerical modeling of Doppler radar signals of Strombolian eruptions, AGU Fall meeting, V04, 4177.
221

References
Gouhier, M., and F. Donnadieu (2008), Mass estimations of ejecta from Strombolian explosions by inversion of Doppler radar measurements, J. Geophys. Res., 113, B10202, doi:10.1029/2007JB005383.
Gu, Y., W. I. Rose, and G. J. S. Bluth (2003), Retrieval of mass and sizes of particles in sandstorms using two MODIS IR bands: A case study of April 7, 2001 sandstorm in China, Geophys. Res. Lett., 30, 1805, doi:10.1029/2003GL017405.
– H –
Hagerty, M.T., S.Y. Schwartz, M.A. Garcès and M. Protti (2000), Analysis of seismic and
acoustic observations at Arenal Volcano, Costa Rica, 1995-1997, J. Volcanol. Geotherm. Res., 101, 27-65.
Harris, D. M., and W. I. Rose (1983), Estimating particles size, concentrations, and total mass of ash in volcanic clouds using weather radar, J. Geophys. Res., 88, 10969-10983.
Harris, D. M., W. I. Rose, R. Roe, and M. R. Thompson (1981), Radar observations of ash eruptions, U.S Geol. Surv. Prof. Pap., 1250, 323-333.
Haulet, R., P. Zettwoog, and J. C. Sabroux (1977), Sulphur dioxide discharge from Mount Etna, Nature, 268, 715-717, doi:10.1038/268715a0.
Head, J.W., and L. Wilson (1987), Lava fountain heights at Pu’ u ‘O’o, Kilauea, Hawaii: indicators of amount and variations of exsolved magma volatiles, J. Geophys. Res., 92, 13715-13719.
Hort, M., and R. Seyfried (1998), Volcanic eruption velocities measured with a micro radar, Geophys. Res. Lett., 25, 113-116.
Hort, M., R. Seyfried, and M. Vöge (2003), Radar Doppler velocimetry of volcanic eruptions: theoritical considerations and quantitative documentation of changes in eruptive behaviour at Stromboli, Italy, Geophys. J. Int., 154, 515-532.
– J –
Jaupart, C., and S. Vergniolle (1988), Laboratory models of Hawaiian and Strombolian
eruptions, Nature, 331, 58– 60. Jaupart, C., and S. Vergniolle (1989), The generation and collapse of foam layer at the roof
of a basaltic magma chamber, J. Fluid Mech., 203, 347-80. Johnson, J.B., J.M. Lees and E.I. Gordeev (1998), Degassing explosions at Karymsky
volcano, Kamchatka, Geophys. Res. Lett., 25, 3999-4002. Johnson, J.B., and J.M. Lees (2000), Plugs and chugs-seismic and acoustic observations of
degassing explosions at Karymsky, Russia and Sangay, Ecuador, J. Volcanol. Geotherm. Res., 101, 67-82, doi:10.1016/S0377-0273(00)00164-5.
– K –
Kittleman, L. R. J. (1964), Application of Rosin's distribution in size frequency analysis of
clastic rocks, J.Sediment. Petrol., 34, 483-502. Kress, V.C., and I.S.E. Carmichael (1991), The compressibility of silicate liquids containing
Fe203 and the effect of composition, temperature, oxygen fugacity and pressure on their redox states, Contrib. Mineral. Petrol., 108, 82-92.
222

References
Krotkov, N. A., B. McClure, R. R. Dickerson, S. A. Carn, C. Li, P. K. Bhartia, K. Yang, A. J. Krueger, Z. Li, P. Levelt, H. Chen, P. Wang, and D. R. Lu (2008), Validation of SO2 retrievals from the Ozone Monitoring Instrument (OMI) over NE China, J.Geophys.Res., 113, D16S40, doi:10.1029/2007JD008818.
Krueger, A.J. (1983), Sighting of El Chichón Sulfur Dioxide Clouds with the Nimbus 7 Total Ozone Mapping Spectrometer, Science, 220, 1377-1379.
– L –
Lacasse, C., S. Karlsdottir, G. Larsen, H. Soosalu, W. I. Rose.W, and G. G. J. Ernst (2004),
Weather radar observations of the Hekla 2000 eruption cloud, Iceland, Bull. Volcanol., 66, 457-473.
Lanzafame, G., A. Leonardi, M. Neri, D. Rust (1997b), Late overthrust of the Apennine-Maghrebian Chain at the NE periphery of Mount Etna, Italy, Comptes rendus de l'Académie des sciences, Série 2, Sciences de la terre et des planètes, 324, 325-332.
Lentini, F. (1982), The geology of the Mt. Etna basement, Mem. Soc. Geol. Ital., 23, 7-25. Leighton, T. G. (1994), The Acoustic Bubble, Academic, San Diego, Calif., 613 pp. Lighthill, J. (1978), Waves in Fluids, Cambridge Univ. Press, New York, 504 pp.
– M – Marzano, F. S., S. Barbieri, G. Vulpiani, and W. I. Rose (2006b), Volcanic Ash Cloud
Retreival by Ground-Based Microwave Weather Radar, IEEE Trans. Geosci. Remote Sens., 44, 3235-3246.
Marzano, F. S., G. Vulpiani, and W. I. Rose (2006a), Microphysical Characterization of Microwave Radar Reflectivity Due to Volcanic Ash Clouds, IEEE Trans. Geosci. Remote Sens., 44, 313-327.
McGetchin, T. R., M. Settle, and B. Chouet (1974), Cinder cone growth modeled after Northeast Crater, Mount Etna, Sicily, J.Geophys.Res., 79, 3257-3272.
McGonigle A. J. S., C. Oppenheimer, B. Galle, T. A. Mather and D.M. Pyle (2002), Walking traverse and scanning DOAS measurements of volcanic gas emission rates, Geophys. Res. Lett., 29, 46.1-46.4.
Métrich N., P. Allard, N. Spilliaert, D. Andronico and M. Burton (2004), 2001 flank eruption of the alkali-and volatile-rich primitive basalt responsible for Mount Etna’s evolution in the last three decades, Earth Planet. Sci. lett., 228, 1-17.
Mie, G. (1908), Beiträge zur Optik trüber Medien, speziell kolloidaler Metallösungen, Ann. Phys., 25.
Murru, M., C. Montuori, R. Console and A. Lisi (2005), Mapping of the b value anomalies beneath Mt. Etna, Italy, during July–August 2001 lateral eruption, Geophys. Res. Lett., 32, L05309, doi:10.1029/2004GL021545.
– N –
Nakamura, Y. (1984), The 1988 eruption of Bandai volcano, Japan: Grain size distribution,
Int. Assoc. of Volcanol. and Chem. of the Earth's Interior, August,13-17. Neuberg, J., R. Luckett, M. Ripepe, and T. Braun (1994), Highlights from a seismic
broadband array on Stromboli volcano, Geophys. Res. Lett., 21, 749-752.
223

References
– P – Parfitt, E.A. (1998), A study of clast size distribution, ash deposition and fragmentation in a
Hawaiian-style volcanic eruption, J. Volcanol. Geotherm. Res., 84, 197-208. Parfitt, E.A., and L. Wilson (1994), The 1983-86 Pu’u ‘O’o eruption of Kilauea volcano,
Hawaii: a study of dike geometry and eruption mechanisms for a long-lived eruption, J. Volcanol. Geotherm. Res., 59, 179-205.
Parfitt, E.A., and L. Wilson (1995), Explosive volcanic eruptions: IX. The transition between Hawaiian-style lava fountaining and Strombolian explosive activity, Geophys. J. Int., 121, 226-232.
Parfitt, E.A., and L. Wilson (1999), A Plinian treatment of fallout from Hawaiian lava fountains, J. Volcanol. Geotherm. Res., 88, 67-75.
Parfitt, E.A., (2004), A discussion of the mechanisms of explosive basaltic eruptions, J. Volcanol Geotherm Res., 134, 77– 107.
Patanè, D., C. Chiarabba, O. Cocina, P. De Gori, M. Moretti and E. Boschi (2002), Tomographic images and 3D earthquake locations of the seismic swarm preceding the 2001 eruption Mt Etna eruption: Evidence for dyke intrusion, Geophys. Res. Lett., 29/10, 135-1–135-4, doi:10.1029/2001GL014391.
Patanè, D., P. De Gori, C. Chiarabba and A. Bonaccorso (2003a), Magma ascent and the pressurization of Mount Etna's volcanic system, Science, 299, 2061–2063, doi:10.1126/science.1080653.
Patrick, M. R., A. J. L. Harris, M. Ripepe, J. Dehn, D. A. Rothery, and S. Calvari (2007), Strombolian explosive styles and source conditions: insights from thermal (FLIR) video, Bull. Volcanol., 69, 769-784.
Pierce, A.D. (1981), Acoustics: An Introduction to its Physical Principles and Applications, McGraw-Hill, New York, 678 pp.
Pointin, Y., J. Fournet-Fayard, and F. Donnadieu (2005), Calibration du radar UHF VOLDORAD 2, par comparaison de ses données avec celles du disdromètre du LaMP/OPGC., Internal report, Observatoire de Physique du Globe de Clermont-Ferrand, Note OPGC 144, 61pp.
Plesset, M. S., and A. Prosperetti (1977), Bubble dynamics and cavitation, Annu. Rev. Fluid Mech., 9, 145-185.
Prata, A. J., S. A. Carn, A. Stohl, and J. Kerkmann (2007), Long range transport and fate of a stratospheric volcanic cloud from Soufrière Hills volcano, Montserrat, Atmos. Chem. Phys., 7, 5093–5103.
Proussevitch, A.A., and V.A. Kutolin, Surface tension of magmatic melts (in russian), Geol. Geophys., 9, 58-67, 1986.
Proussevitch, A.A., and D.L. Sahagian (1996), Dynamics of coupled diffusive and decompressive bubble growth in magmatic systems, J. Geophys. Res., 101, 17447-17455.
Prosperetti, A. (1986), Bubble dynamics, Proc. Int. School Phys. E. Fermi, 93, 145-188.
– R – Riley, C. M., I. R. Rose, and J. S. Bluth (2003), Quantitative shape measurements of distal
volcanic ash, J.Geophys.Res., 108, 2504. Ripepe, M. (1996), Evidence for gas influence on volcanic seismic signals recorded at
Stromboli, J. Volcanol. Geotherm. Res., 70, 221-233. Ripepe, M., M. Rossi, and G. Saccorotti (1993), Image processing of explosive activity at
Stromboli, J. Volcanol. Geotherm. Res., 54, 335-351.
224

References
Ripepe, M., M. Coltelli, E. Privitera, S. Gresta, M. Moretti and D. Piccinini (2001), Seismic and Infrasonic Evidences for an Impulsive Source of the Shallow Volcanic Tremor at Mt. Etna, Italy, Geophys. Res. Lett., 28, 1071-1074.
Rittmann, A., 1973. Structure and evolution of Mount Etna, Philos. Trans. R. Soc. Lond., 274, 5–16.
Rivers, M. L., and I. S. E. Carmichael (1987), Ultrasonic studies of silicate melts, J. Geophys. Res., 92, 9247-9270.
Rogers, R., and M. Yau (1989), A Short Course on Cloud Physics, Pergamon, Oxford, UK. Rymer, H., J. Cassidy, C.A. Locke and J.B. Murray (1995), Magma movement in Etna
volcano associated with the major 1991-1993 lava eruption: evidence from gravity and deformation, Bull. Volcanol., 57, 451-461.
– S –
Sauvageot, H. (1992), Radar meteorology, Artech House Inc., 366pp. Scandone, R. (1981), Models of volcanic processes: a review and some new ideas, Bull.
Volcanol., 44, 256-267, Doi : 10.1007/BF02600563. Schiano P., R. Clocchiatti, L. Ottolini and T. Busa (2001), Transition of Mount Etna lavas
from a mantle-plume to an island-arc magmatic source, Nature, 412, 900-904. Self, S. (1976), The recent volcanology of Terceira, Azores, J. Geol. Soc. (Lond.), 132, 645-
666. Self, S., R. S. J. Sparks, B. Booth, and G. P. L. Walker (1974), The 1973 Heimaey
Strombolian Scoria deposit, Iceland, Geol.Mag., 111, 539-548. Seyfried, R., and M. Hort (1999), Continuous monitoring of volcanic eruption dynamics: a
review of various techniques and new results from a frequency-modulated radar Doppler system, Bull. Volcanol., 60, 627-239, doi:10.1007/s004450050256
Seyfried, R., and A. Freundt (2000), Experiments on conduit flow and eruption behaviour of basaltic volcanic eruptions, J. Geophys. Res., 105, 23727-23740.
Sheridan, M. F. (1971), Particle-size characteristics of pyroclastic tuffs, J.Geophys.Res., 76, 5627-5634.
Sheridan, M. F., K. H. Wohletz, and J. Dehn (1987), Discrimination of grain-size subpopulations in pyroclastic deposits, Geology, 15, 367-370.
Sparks, R.S.J. (1978), The dynamics of bubble formation and growth in magmas: a review and analysis, J. Volcanol. Geotherm. Res., 3, 1-37.
Sparks, R. S. J., and L. Wilson (1982), Explosive volcanic eruptions - V. Observations of plume dynamics during the 1979 Soufrière eruption, St Vincent, Geophys. J. Int., 69, 551 – 570, doi: 10.1111/j.1365-246X.1982.tb04965.x.
Spieler, O., M. Alidibirov, and D. B. Dingwell (2003), Grain-size characteristics of experimental pyroclasts of 1980 Mount St. Helens cryptodome dacite: effects of pressure drop and temperature, Bull. Volcanol., 65, 90-104.
Spilliaert, N., N. Métrich and P. Allard (2006), S-Cl-F degassing pattern of water-rich alkali basalt: Modelling and relationship with eruption styles on Mount Etna volcano, Earth Planet. Sci. Lett., 248, 772-786.
Steinberg, G.S., and J.I. Babenko (1978), Experimental velocity and density determination of volcanic gases during eruption, J. Volcanol. Geotherm. Res., 3, 89-98.
225

References
– T – Tanguy, J-C., and G. Kieffer (1993), Les éruptions de l’Etna et leurs mécanismes, Mem. Soc.
Geol. France, 163, 239-252. Tanguy, J-C., M. Condomines and G. Kieffer (1997), Evolution of Mount Etna magma:
Constraints on the present feeding system and eruptive mechanism, J. Volcanol. Geotherm. Res., 75, 221-250.
– U –
Uhira, K., and M. Takeo (1994), The source of explosive eruptions of Sakurajima volcano,
Japan, J. Geophys. Res., 99, 17775-17789.
– V – Vergniolle, S. (1996), Bubble size distribution in magma chambers and dynamics of basaltic
eruptions, Earth Planet. Sci. Lett., 140, 269-279. Vergniolle, S., Boichu M. and J. Caplan-Auerbach (2004), Acoustic measurements of the
1999 basaltic eruption of Shishaldin volcano, Alaska: 1) Origin of Strombolian activity, J. Volcanol. Geotherm. Res., 137, 109-134.
Vergniolle, S. and Brandeis, G. (1994), Origin of sound generated by Strombolian explosions, Geophys. Res. Lett., 21, 1959-1962.
Vergniolle, S. and Brandeis, G. (1996a), Strombolian explosions: 1. A large bubble breaking at the surface of a lava column as a source of sound, J. Geophys. Res., 101, 20433-20447.
Vergniolle, S., Brandeis, G., Mareschal, J.-C. (1996b), Strombolian explosions: 2. Eruption dynamics determined from acoustic measurements, J. Geophys. Res., 101, 20449-20466.
Vergniolle, S. and C. Jaupart (1986), Separated two-phase flow and basaltic eruptions, J. Geophys. Res., 91, 12842–12860.
Vergniolle, S. and C. Jaupart, (1990), Dynamics of degassing at Kilauea volcano, Hawaii, J. Geophys. Res., 95, 2793-2809.
Vergniolle, S. and M. Ripepe (2008), From Strombolian explosions to fire fountains at Etna Volcano (Italy): what do we learn from acoustic measurements?, Geol. Soc. (Lond.), Special Publications, 307, 103-124.
Vosteen, H. D., and R. Schellschmidtb (2003), Influence of temperature on thermal conductivity, thermal capacity and thermal diffusivity for different types of rock, Physics and Chemistry of the Earth, 28, 499-509.
– W –
Wadge G., D.G. Macfarlane, D.A. Robertson, A.J. Hale, H. Pinkerton, R.V. Burrell, G.E.
Norton, eand M.R. James (2005), AVTIS: A novel millimetre-wave ground based instrument for volcano remote sensing, J. Volcanol. Geotherm. Res., 146, 307-318, doi:10.1016/j.jvolgeores.2005.03.003.
Walker, G.P.L. (1973), Explosive volcanic eruptions - new classification scheme, Geol. Rundsch., 62, 431– 446.
Wallis, G. B. (1969), One Dimensional Two-Phase Flows, McGraw-Hill, New-York, 408 pp.
226

References
Watson, I. M., V. J. Realmuto, W. I. Rose, A. J. Prata, G. J. S. Bluth, Y. Gu, C. E. Bader and
T. Yu (2004), Thermal infrared remote sensing of volcanic emissions using the moderate resolution imaging spectroradiometer, J. Volcanol. Geotherm. Res., 135, 75-89.
Weibull, W. (1939), A statistical theory of the strength of materials, Roy. Swed. Inst. Eng. Res., 151.
Weill, A., G. Brandeis, S. Vergniolle, F. Baudin, J. Bilbille, J. F. Fèvre, B. Piron, and X. Hill (1992), Acoustic sounder measurements of the vertical velocity of volcanic jets at Stromboli volcano, Geophys. Res. Lett., 19, 2357-2360.
Williams, H., and A. R. McBirney (1979), Volcanology, Freeman Cooper, San Francisco, 397pp.
Wilson, L. (1980). Relationships between pressure, volatile content and ejecta velocity in three types of volcanic explosion, J. Volcanol. Geotherm. Res., 8, 297– 313.
Wohletz, K. H., M. F. Sheridan, and W. K. Brown (1989), Particle Size Distributions and the Sequential Fragmentation/Transport Theory Applied to Volcanic ash, J.Geophys.Res., 94, 703-715,721.
Wolf, S., and N. V. Voshchinnikov (2004), Mie scattering by ensembles of particles with very large size parameters, Comput. Phys. Commun., 162, 113-123.
Woods A. W. (1993), Moist convection and the injection of volcanic ash into the atmosphere, J. Geophys. Res., 98, 17627-17636.
Woods, A. W., and M. I. Bursik (1991), Particle fallout, thermal disequilibrium and volcanic plumes, Bull. Volcanol., 53, 559-570
Woulff, G., T. R. McGetchin (1976), Acoustic Noise from Volcanoes: Theory and Experiment, Geophys. J. Int., 45, 601–616.
227


APPENDIX


Appendix A
Ballistic model equations and code


Appendix A – Ballistic model equations and code
Ballistic model equations To simulate the ejection of pyroclasts during a Strombolian explosion, we use and enhanced a
two-dimensional ballistic model initially developed by Dubosclard et al. (2004). The ballistic
model assumes that two forces are acting on the particle of mass mp: the drag force FD (with a
direction opposite to the velocity vector) and the gravitational force. So, the equations of
motion can be written as:
p
Dx
mF
dtxd=2
2
(A1)
gmF
dtzd
p
Dz −=2
2
where FDx and FDz are the components of the drag force and g is the acceleration due to
gravity. FD is given by (e.g. Chow 1979):
( 2
21
pgDgD vvACF −= ρ ) (A2)
where ρg is the gas density, A is the cross-sectional area of the particle, CD is the particle drag
coefficient deduced from the Reynolds number calculation according to the method suggested
by Chow (1979), vg (components: ug, vg) and vp (components: up, vp) are the gas and particle
velocities. After some rearrangement, equation. 2 can be rewritten as:
( )wuuD
Cdt
xdpg
D
p
g −⎟⎟⎠
⎞⎜⎜⎝
⎛=
ρρ
43
2
2
(A3)
( ) gwvvD
Cdt
zdpg
D
p
g −−⎟⎟⎠
⎞⎜⎜⎝
⎛=
ρρ
43
2
2
where ρp is the particle density, taken equal to 1530 Kg.m-3 (e.g. McGetchin et al., 1974), D
its diameter and:
233

Appendix A – Ballistic model equations and code
( ) ( )22
pgpg vvuuw −+−= (A4)
For simplifications, the particles are taken spherical and compositionally homogeneous. They
are launched at the volcano vent (origin of the coordinate system) at time t=0 with an initial
velocity and an initial ejection angle αpV0 0. The initial velocity of a particle with a diameter D
is taken as (Steinberg and Babenko, 1978):
( ) DkVDV gp −= 00 (A5)
where k is a constant taken equal to 150, as inferred from previous studies [Chouet et al.,
1974; Ripepe et al., 1993]. The velocity of particles directly depends on the initial gas
velocity that decreases exponentially with height [Blackburn et al., 1976] according to: gV0
( ) ⎟⎟⎠
⎞⎜⎜⎝
⎛ −=
ref
gg z
zVzV γexp0 (A6)
where γ is a constant taken equal to 4.6 and zref is the height above the vent such as
( ) grefg VzV 001.0= [Blackburn et al., 1976].In order to simulate the radar signal received from
an explosion, the system (Eqs. 3) is numerically integrated by using a fourth-order Runge-
Kutta method, with a time step of 0.01 s. At t=0, a set of N particles with different diameters
(D) defining a specific particle size distribution N(D) (e.g., exponential, log-normal or
Gaussian) are launched over a range of ejection angles from the origin of coordinates. At each
time step, the coordinates of all particles are determined. Then, for all the particles located
inside the selected range gates, our model calculates their velocity.
234

Appendix A – Ballistic model equations and code
Ballistic model code %--------------------------------------------------------% %-------------------- Initialisation -------------------% %--------------------------------------------------------% nbdiamdeb = 1; nbdiamfin = nbdiam; l = lambda(1)*1000; rhob = rhog/rhop; A = 1+(rhob/2); B = (1-rhob)*g; for aa = 1:nbdiam D = diam(aa); D3(aa) = exp(3*log(D*1000)); D6(aa) = exp(6*log(D*1000)); for ii = 1:nbangles tbx(aa,ii) = 0; tby(aa,ii) = 0; w0 = vg0-150*sqrt(diam(aa)); tbu(aa,ii) = w0*cos(pi*angles(ii)/180); tbv(aa,ii) = w0*sin(pi*angles(ii)/180); tbx2(aa,ii) = 0; tby2(aa,ii) = 0; tbu2(aa,ii) = w0*cos(pi*angles2(ii)/180); tbv2(aa,ii) = w0*sin(pi*angles2(ii)/180); tbx3(aa,ii) = 0; tby3(aa,ii) = 0; tbu3(aa,ii) = w0*cos(pi*angles3(ii)/180); tbv3(aa,ii) = w0*sin(pi*angles3(ii)/180); tbx4(aa,ii) = 0; tby4(aa,ii) = 0; tbu4(aa,ii) = w0*cos(pi*angles4(ii)/180); tbv4(aa,ii) = w0*sin(pi*angles4(ii)/180); end end %------------------------------------------------------------% %----------------------- Cal_param ---------------------% %------------------------------------------------------------% vmaxi=9.2; vmoy=0; refl=0; masse=0; Masse_tot=0; t=0; val_t = 0; ctv = 0; flag = 0; P = 0; T = 0; fid1 = fopen('param.txt','w'); while val_t<tfin; if ctv == 0 vmoy = 0; else vmoy = vmoy/ctv; end if t>=tdeb fprintf(fid,'%5.4f %5.4f %5.4f %5.4f %5.4f %5.4f\n',t,vmaxi,vmoy,masse,refl,P); refl = 0; masse = 0; vmaxi = 9.2; vmoy = 0; ctv = 0; P = 0; end if val_t>=inter_pulse val_t2 = val_t-inter_pulse; for ii = 1:nbangles theta0 = angles2(ii); for aa = nbdiamdeb : nbdiamfin
C = 0.75*rhob/diam(aa); x2 = tbx2(aa,ii); y2 = tby2(aa,ii); u2 = tbu2(aa,ii); v2 = tbv2(aa,ii); t2 = val_t2; r2 = sqrt(x2^2+y2^2); if y == 0 beta = 0; else beta = atan(x/y); end w = vg0*exp(-gamma*r2/r_ref); ug = w*sin(beta); vg = w*cos(beta); %----------------------------------------------------% %-------------------- Cal_ Cd -------------------% %----------------------------------------------------% Re = abs(v2)*D/nu; if Re == 0 Cd = 0; elseif Re>0 & Re <=1 Cd = 24/Re; elseif Re>1 & Re<=400 Cd = 24/Re^0.646; elseif Re>400 & Re<=300000 Cd = 0.5; elseif Re>300000 & Re<=2000000 Cd = 0.000366*Re^0.4275; elseif Re>2000000 Cd = 0.18; end %-------------------------------------------------------% %------------------ Runge Kutta 4 ----------------% %-------------------------------------------------------% h=delta_t; d1x=h*u2; d1y=h*v2; d1u=h*(C*Cd*(ug-u2)*(sqrt((ug-u2)^2+(vg-v2)^2)))/A; d1v=h*(-B+(C*Cd*(vg-v2)*(sqrt((ug-u2)^2+(vg-v2)^2))))/A; d2x=h*(u2+d1u/2); d2y=h*(v2+d1v/2); d2u=h*(C*Cd*(ug-(u2+d1u/2))*(sqrt((ug-(u2+d1u/2))^2+(vg-(v2+d1v/2))^2)))/A; d2v=h*(-B+(C*Cd*(vg-(v2+d1v/2))*(sqrt((ug-(u2+d1u/2))^2+(vg-(v2+d1v/2))^2))))/A; d3x=h*(u2+d2u/2); d3y=h*(v2+d2v/2); d3u=h*(C*Cd*(ug-(u2+d2u/2))*(sqrt((ug-(u2+d2u/2))^2+(vg-(v2+d2v/2))^2)))/A; d3v=h*(-B+(C*Cd*(vg-(v2+d2v/2))*(sqrt((ug-(u2+d2u/2))^2+(vg-(v2+d2v/2))^2))))/A; d4x=h*(u2+d3u); d4y=h*(v2+d3v); d4u=h*(C*Cd*(ug-(u2+d3u/2))*(sqrt((ug-(u2+d3u/2))^2+(vg-(v2+d3v/2))^2)))/A; d4v=h*(-B+(C*Cd*(vg-(v2+d3v/2))*(sqrt((ug-(u2+d3u/2))^2+(vg-(v2+d3v/2))^2))))/A; dx2=(d1x+2*d2x+2*d3x+d4x)/6; dy2=(d1y+2*d2y+2*d3y+d4y)/6; du2=(d1u+2*d2u+2*d3u+d4u)/6; dv2=(d1v+2*d2v+2*d3v+d4v)/6; %------------------------------------------------------------------------% x2 = x2+dx2; y2 = y2+dy2; u2 = u2+du2; v2 = v2+dv2; t2 = t2+delta_t;
235

Appendix A – Ballistic model equations and code
if sens==0 flag=0; elseif y2>tby2(aa,ii) flag=1; flag=flag-sens; elseif y2<tby2(aa,ii) flag=2; flag=flag-sens; end tbx2(aa,ii) = x2; tby2(aa,ii) = y2; tbu2(aa,ii) = u2; tbv2(aa,ii) = v2; xr = x2+935 ; yr = y2+270; alpha = atan(yr/xr); rr = sqrt(xr^2+yr^2); fprintf(fid1,'%5.5f %5.5f\n',xr,yr); if pos==1 rvr1 = 985; rvr2 = 1227; elseif pos==2 rvr2 = 985; rvr1 = 0; elseif pos==0 rvr1 = 0; rvr2 = 1227; end if r0<rr & rr<r1 & a0<alpha & alpha<a1 & rr>rvr1 & rr<rvr2 if flag == 0 refl = refl+exp(-((site-alpha)^2)/0.10482)*exp(l*diam(aa))*D6(aa); masse = masse+exp(l*diam(aa))*D3(aa); P = 10*log10(refl); if P <60 P = 60; end anglvise = atan(yr/xr); if v2 == 0 vr = u2*cos(anglvise); else
vr= sqrt(u2^2+v2^2); psi = abs(atan(u2/v2)); end %---------------------------------------------------% %------------------- Cal_Vrad ------------------% %------------------------------------------------- -% if u2 >= 0 & v2>0 vr = vr*sin(anglvise+psi); elseif u2 <= 0 & v2>0 vr = vr*sin(anglvise-psi); elseif u2 <= 0 & v2<0 vr = -vr*sin(anglvise+psi); elseif u2 >= 0 & v2<0 vr = -vr*sin(anglvise-psi); end fprintf(fid2,'%5.5f %5.5f %5.5f\n',t,vr,refl); if flag == 0 & vr>0 vmoy = vmoy+vr; ctv = ctv+1; if sens==0 & pos==0 & vmoy >0 vmoy=0; end if abs(vr)>vmaxi vmaxi = vr; if vmaxi<9.2 & vmaxi>=0 vmaxi = 9.2; end if vmaxi<0 & vmaxi>-9.2 vmaxi = -9.2; end if sens==0 & pos ==0 & vmaxi>9.2 vmaxi = 9.2; end end end end end end end end
236

Appendix B
Electromagnetic scattering model equations, code and graphical interface


Appendix B – Electromagnetic scattering model (Mie)
Electromagnetic scattering model equations (Mie)
Considering the wide range of particle diameters characterizing volcanic activity, the
complete scattering theory is required to account for the effects of large particles. A general
solution of electromagnetic wave scattering was given by Mie [1908]. The derivation of the
electromagnetic scattering model specifically applied to the case of volcanic studies is
developed in this section. In this first approach of scattering by volcanic ejecta, we apply
Maxwell’s equations for plane-wave scattered by spherical particles in a homogeneous
medium at a large distance [e.g., Bohren and Huffman, 1983].
Starting with Maxwell’s equation for plane waves:
(B1) 0=∇ • E
(B2) • H∇ 0=
(B3) HiE ωµ=×∇
(B4) EiH ωε−=×∇
where E and H are the electric and magnetic fields. ε is the dielectric permittivity, µ is the
magnetic permeability, and ω is angular frequency. Taking the curl of (A3) and (A4), gives:
( ) EHiE εµωωµ 2=×∇=×∇×∇ (B5) ( ) εµω 2=××∇ HEiH ωε∇−=×∇
If we use the vector identity,
(B6) ( ) ( ) ( )AAA ∇∇−∇∇=×∇×∇ ••
we obtain
(B7) 022 =+∇ EE εµω 022 =+∇ HH εµω
where ∇ 2A = ∇•(∇A). Thus, E and H satisfy the wave equation. The field inside the particle
is denoted by (E1, H1); the field in the medium surrounding the particle (E2, H2) is the
superposition of the incident field (Ei, Hi) and the scattered field (Es, Hs):
239

Appendix B – Electromagnetic scattering model (Mie)
(B8) si EEE +=2 si HHH +=2
The electromagnetic field is required to satisfy the Maxwell equations at points where ε and µ
are continuous. However, there is a discontinuity at the boundary of the particle, where the
following conditions on the fields are imposed:
( ) ( )[ ] 012 =×− snxHxH(B9)
( ) ( )[ ] 012 =×− snxExE
where ns is the outward-directed normal to the surface of the particle. Under the conditions of
our study (far-field region and spherical particle), the scattered field Es is mainly transverse
and can be resolved into components parallel (E//) and perpendicular (E⊥) to the scattering
plane. The relationship between incident and scattered field amplitudes can be written in
matrix form:
⎟⎟⎠
⎞⎜⎜⎝
⎛⎟⎟⎠
⎞⎜⎜⎝
⎛
−=⎟⎟
⎠
⎞⎜⎜⎝
⎛
⊥
−
⊥ i
i
n
rRik
s
s
EE
S
S
Rike
EE zn
//
1
2)(
//
0
0 (B10)
where kn = 2π/λ is the wave number, R, the distance to the particle, and rz, the component of R
on the direction of propagation of the incident wave. The radiation of an electromagnetic
wave can be described in terms of intensity from the four Stokes parameters (I, Q, U, V)
describing the various states of polarization: not polarized (I), polarized horizontally (+Q) ,
polarized vertically (-Q), polarized at +45° (+U) , polarized at -45° (-U), right-circularly
polarized (+V) or left-circularly polarized (-V). The relationship between incident and
scattered Stokes parameters (indexed i and s respectively) follows from the amplitude
scattering matrix, also called the Mueller matrix [Bohren and Huffman, 1983; Wolf and
Voshchinnikov, 2004]:
⎟⎟⎟⎟⎟
⎠
⎞
⎜⎜⎜⎜⎜
⎝
⎛
⎟⎟⎟⎟⎟
⎠
⎞
⎜⎜⎜⎜⎜
⎝
⎛
ΘΘ−ΘΘ
ΘΘΘΘ
=
⎟⎟⎟⎟⎟
⎠
⎞
⎜⎜⎜⎜⎜
⎝
⎛
i
i
i
s
s
s
s
VUQI
SSSS
SSSS
RVUQI 1
3334
3433
1112
1211
22
2
)()(00)()(00
00)()(00)()(
4πλ (B11)
240

Appendix B – Electromagnetic scattering model (Mie)
The scattering matrix elements (Si,j) depend on Θ, which is the angle between the direction of
the incident and the scattered radiation of wavelength λ. VOLDORAD transmits power
through a square array of four Yagi antennas, such that the incident wave has a horizontal
linear polarization (Ii=1, Qi=1, Ui=0, Vi=0). Thus, in our case, we denote by i// the
corresponding scattered irradiance that only depends on the two first scattering matrix
elements (S11, S12):
2
21211// SSSi =+=(B12)
with
( ) ( ) ( )( )2
12
211 21
Θ+Θ=Θ SSS
( ) ( ) ( )( )21
2212 2
1Θ−Θ=Θ SSS
(B13)
The sum of the two first scattering matrix elements can then be derived from the single
complex amplitude function S2 in the form of a convergent series:
( ) ( ) ( ) ( )( )∑
∞
=
Θ+Θ++
=Θ1
2 112
nnnnn ba
nnnS πτ (B14)
where n is a positive integer, an and bn are the complex scattering coefficients (Mie
coefficients), and τn and πn are the angular functions. The series can be terminated after nc
sufficiently large terms. The complex scattering coefficients depend particularly on the size
parameter x and the refractive index m of the material [Sauvageot, 1992] and are defined as:
( ) ( ) ( ) ( )( ) ( ) ( ) ( )mxxxmxm
mxxxmxmannnn
nnnnn ''
''
ψξξψψψψψ
−
−=
(B15) ( ) ( ) ( ) ( )( ) ( ) ( ) ( )mxxmxmx
mxxmxmxbnnnn
nnnnn ''
''
ψξξψψψψψ
−
−=
The size parameter x = kr is a dimensionless variable, r, being the radius of the spherical
particle.Ψ and ξ are the Riccati-Bessel functions of first and second kind and can be defined
by:
241

Appendix B – Electromagnetic scattering model (Mie)
( ) ( )xjxx nn .=ψ
(B16) ( ) ( ) ( )xyixjx nnn .+=ξ
where jn and yn are the spherical Bessel functions of first and second kind defined as:
( ) ( )xJ
xxj nn 2/12 +=
π
(B17) ( ) ( )xYx
xy nn 2/12 +=π
The spherical Bessel functions satisfy the recurrence relations:
( ) ( ) ( )xzx
nxzxz nnn12
11+
=+ +−
(B18) ( ) ( ) ( ) ( ) ( )xznxnzxz
dpdn nnn 11 112 +− +−=+
The angular functions τn and πn depend only on Θ, and are defined by the Legendre
polynomials,
( ) ( )
ΘΘ
=Θsin
1n
nP
π
(B19)
( ) ( )ΘΘ
=Θd
dPnn
1
τ
and can be found from the recurrence relations:
( ) ( ) ( ) ( )Θ+−ΘΘ=Θ −11cos nnn nn ππτ(B20)
( ) ( ) ( )Θ−
−ΘΘ−−
=Θ −− 21 1cos
112
nnn nn
nn πππ
242

Appendix B – Electromagnetic scattering model (Mie)
The scattered irradiance can now be calculated for any particle size, under the special
conditions of our sounding using VOLDORAD at Mt. Etna (Figure 1). Determining the
scattering matrix elements enables us to define the scattering cross section of each particle;
this then relates irradiance to reflectivity through the Mie coefficients. VOLDORAD is a
monostatic radar (i.e., the same antenna is used for transmission and reception), thus we
define a backscattering cross section (σbks) for horizontal linear polarization:
( )( )
2
1
22
12)1(4 ∑
∞
=
−+−=n
nnbks banπλσ
(B21)
Note that we often use the backscattering efficiency defined as the cross section coefficient
normalized by the particle section such as:
2r
Q bksbks π
σ=
(B22)
The theoretical radar power for a distributed target in a sampling volume (Vs) at a given
distance (R) can then be deduced from the radar reflectivity (η), which is simply the sum of
the backscattering cross section (σbks) of each particle over a unit volume [Doviak and Zrnic,
1984; Sauvageot, 1992],
4R
VCP srsynth
η=
(B23)
∑=
=n
i s
bks
V1
ση
(B24)
where Cr is the radar constant defined by a set of technical parameters related to the radar
configuration.
243

Appendix B – Electromagnetic scattering model (Mie)
Mie/Rayleigh code %------------------------------------------------------------% %------ Mie scattering coefficients (An, Bn) ------% %------------------------------------------------------------% xmax = size(x,2); for j = 1:xmax compteur_j = j; m = real(m); N = (1:nmax)'; %-- Décomposition en Série infinie de Ricatti-Bessel (Ordre 1) --% nst = ceil(nmax + sqrt(101+x(j))); phi(nst,1) = 0; phi(nst-1,1) = 1e-10; for n=nst-2:-1:1 phi(n,1) = (2*n+3)*phi(n+1)/x(j) - phi(n+2); end phi0 = 3*phi(1)/x(j) - phi(2); phi0 = sin(x(j))/phi0; phi = phi(1:nmax,:) * phi0; %-- Décomposition en Série infinie de Ricatti-Bessel (Ordre 1) --% nst = ceil(nmax + sqrt(101+(m*x(j)))); phim(nst,1) = 0; phim(nst-1,1) = 1e-10; for n=nst-2:-1:1 phim(n,1) = (2*n+3)*phim(n+1)/(m*x(j)) - phim(n+2); end phi0 = 3*phim(1)/(m*x(j)) - phim(2); phi0 = sin(m*x(j))/phi0; phim = phim(1:nmax,:) * phi0; %-- Décomposition en Série infinie de Ricatti-Bessel (Ordre 2) --% zeta(1,1) = -cos(x(j))/(x(j)) - sin(x(j)); zeta(2,1) = 3*zeta(1)/(x(j)) + cos(x(j)); for n=3:nmax zeta(n,1) = (2*n-1)*zeta(n-1)/(x(j)) - zeta(n-2); end %-- Décomposition en série infinie de Hankel(1) --% xi = phi + i * zeta; phin_1 = [sin(x(j));phi(1:nmax-1)]; phimn_1 = [sin(m*x(j));phim(1:nmax-1)]; zetan_1 = [-cos(x(j));zeta(1:nmax-1)]; %--- Calcul de dérivées des séries de RB (1&2) et H(1) ---% dphi = phin_1-N.*phi/x(j); dphim = phimn_1-N.*phim/(m*x(j)); dzeta = zetan_1-N.*zeta/x(j); dxi = dphi + i * dzeta; %---------------- Coefficient de Mie a(n) et b(n) f(nmax) ---------------% a = (m*phim.*dphi - phi.*dphim) ./ (m*phim.*dxi -xi.*dphim); b = (phim.*dphi - m*phi.*dphim) ./ (phim.*dxi -m*xi.*dphim); %------------------------------------------------------------% %--- Cross sections calculation (Q, Sigma) ----% %------------------------------------------------------------% Qs = 0; Qe = 0; Qb = 0; for n = 1:nmax % Qs : Scattering efficiency Qs = (2*n+1)*(abs(a(n)^2)+abs(b(n)^2))+Qs;
% Qe : Extinction efficiency Qe = (2*n+1)*real(a(n)+b(n))+Qe; % Qb : Backscattering efficiency Qb = abs((2*n+1)*(-1)^2*(a(n)-b(n)))^2+Qb end qext = (2*Qe)/x(j).^2; qsca = (2*Qs)/x(j).^2; qabs = qext-qsca; qbsk = Qb/x(j).^2; Qext = [Qext,qext]; Qsca = [Qsca,qsca]; Qabs = [Qabs,qabs]; Qbsk = [Qbsk,qbsk]; A = [A,pi*r(j).^2]; rj = [rj,r(j)]; xj = [xj,x(j)]; end end Sigma_sca = Qsca.*A; % Scattering cross section Sigma_ext = Qext.*A; % Extinction cross section Sigma_abs = Qabs.*A; % Absorption cross section Sigma_bsk = Qbsk.*A; % Backscattering cross section %-------------------------------------------------------------------------% %---------------------- Rayleigh approximation ------------------% %-------------------------------------------------------------------------% %Scattering efficiency QRsca = ((128*pi^4*rj.^4)/(3*lambda^4))*abs(K)^2; %Absorbtion efficiency QRabs = ((8*pi*rj)/(lambda))*imag(K); %Extinction efficiency QRext = QRabs + QRsca; %Backscattering efficiency QRbsk = ((64*pi^4*rj.^4)/(lambda^4))*abs(K)^2; SigmaR_sca = QRsca.*A; % Scattering cross section SigmaR_abs = QRabs.*A; % Absorption cross section SigmaR_ext = QRext.*A; % Extinction cross section SigmaR_bsk = QRbsk.*A; % Backscattering cross section %-------------------------------------------------------------------------%
244

Graphical interface (ZVMM): Z: reflectivity (dBZ) VMM: max and mean velocities (m/s)
Snapshot of the ZVMM graphical interface developed and used during this thesis for the calculation of (1) synthetic time series of maximum and mean velocities derived from the ballistic model, and (2) synthetic power from the electromagnetic scattering model of Mie and Rayleigh. The particles size distribution (PSD) and the ejection angle distribution (EAD) can be widely varied, and several successive explosions can also be modelled.
245


Appendix C
Gouhier, M., and F. Donnadieu (2008), Mass estimations of ejecta from Strombolian explosions by inversion of Doppler radar measurements, J. Geophys. Res., 113, B10202, doi:10.1029/2007JB005383.


Mass estimations of ejecta from Strombolian explosions by inversion
of Doppler radar measurements
Mathieu Gouhier1 and Franck Donnadieu1
Received 13 September 2007; revised 25 June 2008; accepted 23 July 2008; published 4 October 2008.
[1] We present a new method for estimating particle loading parameters (mass, number,volume) of eruptive jets by inversion of echo power data measured using a volcanoDoppler radar (VOLDORAD) during typical Strombolian activity from the southeast (SE)crater of Mount Etna on 4 July 2001. Derived parameters such as mass flux, particlekinetic and thermal energy, and particle concentration are also estimated. The inversionalgorithm uses the complete Mie (1908) formulation of electromagnetic scattering byspherical particles to generate synthetic backscattered power values. In a first datainversion model (termed the polydisperse model), the particle size distribution (PSD) ischaracterized by a scaled Weibull function. The mode of the distribution is inferredfrom particle terminal velocities measured by Doppler radar for each explosion. Thedistribution shape factor is found to be 2.3 from Chouet et al.’s (1974) data fortypical Strombolian activity, corresponding to the lognormal PSDs commonlycharacteristic of other Strombolian deposits. The polydisperse model inversion convergestoward the Weibull scale factor producing the best fit between synthetic and measuredbackscattered power. A cruder, alternative monodisperse model is evaluated on the basisof a single size distribution assumption, the accuracy of which lies within 25% of thatof the polydisperse model. Although less accurate, the monodisperse model, beingmuch faster, may be useful for rapid estimation of physical parameters during real-timevolcano monitoring. Results are illustrated for two explosions at Mount Etna withcontrasted particle loads. Estimates from the polydisperse model give 58,000 and206,000 kg as maxima for the total mass of pyroclasts, 26,400 and 73,600 kg s1 for massflux rates, 38 and 135 m3 (22 and 76 m3 equivalent magma volume) for the pyroclastvolumes, and 0.02–0.4 and 0.06–0.12 kg m3 for particle concentrations, respectively.The time-averaged kinetic energy released is found to be equal to 4.2 107 and3.9 108 J, and thermal energy is estimated at 8.4 1010 and 3 1011 J.
Citation: Gouhier, M., and F. Donnadieu (2008), Mass estimations of ejecta from Strombolian explosions by inversion of Doppler
radar measurements, J. Geophys. Res., 113, B10202, doi:10.1029/2007JB005383.
1. Introduction
[2] Volcanic explosions are important sources of infor-mation for understanding eruption mechanisms. The massesand velocities of gas and pyroclasts are particularly impor-tant parameters controlling the dynamics of an eruption asthey define crucial parameters such as mass fluxes, kineticand thermal energies released by an explosion. In order tobetter understand the dynamics of explosive eruptions,satellite imagery, and ground-based weather radars particu-larly have been used for the sounding of volcanic ashplumes from large eruptions [Harris et al., 1981; Harrisand Rose, 1983; Weill et al., 1992; Dean et al., 1994; Dehnet al., 2000; Lacasse et al., 2004]. These techniques probe
the upper convective parts of high eruption columns andprovide information primarily on the small particles thatultimately constitute the distal volcanic products. A majorchallenge is now to measure physical parameters, such asejecta velocities and masses, close to the vent in order toretrieve directly the true source parameters. A first approachto measure jet velocities was used at Stromboli with anacoustic Doppler sounder (sodar) [Weill et al., 1992]. Othertechniques that potentially provide information on bothvelocity and mass parameters are ground-based portableDoppler radar, either pulsed such as volcano Doppler radar(VOLDORAD) [Dubosclard et al., 1999; Dubosclard et al.,2004] or frequency-modulated such as VERDEMOS [Hortand Seyfried, 1998; Seyfried and Hort, 1999]. These tech-niques allow direct measurement of particle velocities andreflectivities immediately above the vent. In addition totheir significant monitoring potential, these radar systemsallow us to study, under any weather conditions, explosions
JOURNAL OF GEOPHYSICAL RESEARCH, VOL. 113, B10202, doi:10.1029/2007JB005383, 2008ClickHere
for
FullArticle
1Laboratoire Magmas et Volcans, Clermont-Universite, Observatoire dePhysique du Globe de Clermont-Ferrand, Clermont-Ferrand, France.
Copyright 2008 by the American Geophysical Union.0148-0227/08/2007JB005383$09.00
B10202 1 of 17

of lesser intensity barely imaged by satellites or weatherradars.[3] VOLDORAD was used to record several eruptive
episodes at Etna in July 2001, ranging from mild Strombo-lian activity to paroxysmal lava fountains [Donnadieu et al.,2005]. A new method based on inversion of echo powerdata measured using VOLDORAD is now presented forestimating the masses of pyroclasts ejected during individ-ual explosions. The method also provides first-order esti-mates of mass-related parameters such as mass flux, ejectavolume, particle concentration, thermal and kinetic energyat the vent. The method was applied to two Strombolianexplosions with contrasted particle loads that occurredduring an eruptive episode of Mount Etna southeast (SE)crater on 4 July 2001. First, an algorithm is developed tosimulate radar echoes from pyroclasts of various sizes,using the complete electromagnetic scattering formulation[Mie, 1908]. This approach provides synthetic data of powerbackscattered by particles (Psynth) at the particular wave-length employed by VOLDORAD. Second, as an input tothe model, a scaled Weibull function [Weibull, 1939] is usedto characterize the particle size distribution (PSD). Thegeneral shape of the Weibull distribution is constrainedfrom published data for typical Strombolian activity[Chouet et al., 1974], and the mode of the PSD is estimatedfrom our own radar velocity measurements for each explo-sion. All Weibull parameters characterizing a polydisperse(multiple particle size) distribution, such as shape, shift, andscale factors, can then be deduced and used to computesynthetic values of backscattered power. Last, a recursiveinversion algorithm is applied in order to obtain a PSD suchthat the synthetic power (Psynth) best fit the measured radarpower (Pmes). The mass of ejected material and relatedparameters are then deduced. An alternative model isproposed on the basis of a monodisperse (single particlesize) PSD, which turns out to be an acceptable approxima-tion of the polydisperse model. This approach reducescomputing time, making it useful for real-time quantitativeassessment of ejected mass during volcano monitoring.
2. VOLDORAD: Volcano Doppler Radar
2.1. Radar Description
[4] VOLDORAD is a pulsed volcano Doppler radardeveloped by the Observatoire de Physique du Globe inClermont-Ferrand (France) specifically for the active remotesensing of volcanic eruption jets and plumes. The secondversion of the system is a medium-power (60 W) Dopplerradar of limited weight (70 kg, including PC and antenna),with a 9 beam width (a) and a working wavelength (l) of
23.5 cm [Donnadieu et al., 2005]. VOLDORAD isdesigned to monitor all types of explosive volcanic activityof variable magnitude. It operates at a medium distancerange (0.4–12 km) under all weather conditions with a highsampling rate (10 Hz) that permits detailed analysis ofearly eruptive processes. The portability and lower electricconsumption of this version compared to a first version ofVOLDORAD is a valuable technical improvement. Thepulse repetition period (tr) is taken as 100 ms and directlydefines the maximum velocity that can be measured by theradar:
Vmax ¼l
4Nctrð1Þ
where Nc is the number of coherent integrations of radarpulses. Note that the maximum velocity that can be measuredin theory by VOLDORAD is very high (1175 m/s). This isvaluable in particular for measuring the velocities of smallparticles traveling with speeds close to that of the gas. Thepulse duration (t) can be varied from 0.4 to 1.5 ms, and avalue of 0.8 ms was used during the eruption of Mount EtnaSE crater on 4 July 2001. This corresponds to a suitablerange resolution of the sampling volume, the so-called rangegate, of 120 m (Table 1).[5] Volcanic ejecta crossing the antenna beam generate
radar echoes backscattered to the receiver with an angularfrequency Doppler shift (d8/dt) between the transmitted andreceived signal that is related to the particle velocity alongthe beam axis:
d8
dt¼ w ¼ 2pfd ð2Þ
where w is the angular frequency and fd is the Dopplerfrequency. Indeed, the Doppler velocity spectrum is relatedto the frequency spectrum via the relationship
fd ¼2Vr
lð3Þ
where Vr is the radial velocity and l is the radar wavelength.When the target moves away from the radar (Vr > 0), theDoppler shift (d8/dt) is negative, and vice versa when thetarget approaches.
2.2. Experimental Conditions
[6] After more than 8 months of minor activity (slow lavaflows, degassing, light ash emission, and low-level Strom-bolian activity), a new episode of vigorous activity began atthe SE crater on 9 May. From then until July–August 2001,there were eruptions from the SE crater every 3–5 days,each lasting on average a few hours and involving multipleStrombolian explosions and lava fountaining. Radar sound-ings reported here were carried out over about 5 h during aneruption on 4 July. The activity began at about 1800 UT andat first involved small explosions repeated every 10 s. Theintensity then increased progressively, culminating in verypowerful Strombolian explosions every 2–3 s, with thebursting of very large bubbles between 2100 UT and2200 UT but without real lava fountains. The eruptionintensity then decreased rapidly from 2200 UT and endedat 2300 UT after about 5 h of Strombolian activity.
Table 1. Characteristics of VOLDORAD Version 2
Characteristic Symbol VOLDORAD 2
Transmitted frequency (MHz) ft 1274Wavelength (cm) l 23.5Peak power (W) Pt 60Pulse repetition perioda (ms) tr 100Pulse durationa (ms) t 0.8Range resolutiona (m) L 120Antenna beam width (deg) a 9Antenna beam elevationa (deg) q 23
aParameters set for the sounding at Etna SE crater on 4 July 2001.
B10202 GOUHIER AND DONNADIEU: MASS ESTIMATE OF EJECTA
2 of 17
B10202

VOLDORAD was set up at an altitude of 3000 m, at aslanting distance of 930 m to the crater rim, 280 m belowthe summit of the SE crater, and with an antenna elevationangle q of 23 (Figure 1).[7] Moving particles were detected in successive range
gates (G1 to G4) corresponding to a slant distance of 807–1167 m (Table 2). In this configuration, particles ascendingabove the crater in range gate G3 were recorded mainly withpositive radial velocities (away from the antenna) in theDoppler spectra, whereas descending particles were mainlyrecorded with negative velocities.
2.3. Radar Parameters
[8] Data from successive range gates are displayed in realtime as Doppler spectra representing the power spectraldensity versus radial velocity. From the processing of theseries of Doppler spectra, two sets of parameters are directlyretrieved for ascending (positive parameters indexed by aplus) and descending (negative parameters indexed by aminus) ejecta crossing the successive range gates above, oron either side of, the eruptive jet axis: (1) velocity infor-mation, in particular maximum and mean radial velocity(V+
max, Vmax, V
+mean, V
mean) and (2) power (P+, P)
backscattered by particles contained in the sampling volumeat a given instant [Dubosclard et al., 2004].
[9] The received echo power from the particles (spectralmoment of order 0) can be defined by the integral of thespectral power density S(v) in a velocity interval between
Table 2. Gate Center Coordinatesa
G1 G2 G3 G4
Gate angle to the vertical (deg) 78 34 23 43Slanting distance to the radar (m) 807 927 1047 1167Horizontal distance to the crater (m) 166 56 54 165Elevation above crater rim (m) 33 80 127 174Gate height (m) 127 146 165 184
aG1 to G4, for an elevation angle of 23 and pulse duration of 0.8 ms.
Figure 1. Sketch of the radar sounding geometry used for the acquisition campaign on Mount Etna, on4 July 2001. VOLDORAD was set up at an altitude of 3000 m, at a slanting distance of 930 m to thecrater rim, 280 m below the summit of the SE crater, and with an antenna elevation angle q of 23. Notethat range gate G3 is centered above the vent and provides most of the echo power.
Figure 2. Sketch of a typical Doppler spectrum obtainedby VOLDORAD. The power spectral density is displayedas a function of the radial velocity in a given range. Thehorizontal line (Br) corresponds to the background noiselevel. Total echo power and maximum and mean velocitiescan be deduced from Doppler spectra. They are indexed(plus) and (minus) for ejecta with the radial component oftheir velocity vector moving away and toward the antenna,respectively.
B10202 GOUHIER AND DONNADIEU: MASS ESTIMATE OF EJECTA
3 of 17
B10202

v and v + dv, from 0 to V+max for ascending particles and
from Vmax to 0 for descending particles. The power
measured in the Doppler spectra has been calibrated inthe laboratory by means of an input signal, the power ofwhich was known, delivered by an external frequencygenerator:
Pþ ¼ZVþ
max
0
S vð Þdv; P ¼Z0
Vmax
S vð Þdv ð4Þ
Maximum radial velocities in the directions toward andopposite to the radar, V
max and V+max, respectively, are
defined where S(v) is equal to the background noise level Br
(Figure 2). Likewise, for a given Doppler spectrum, V+mean
and Vmean (spectral moment of order 1) of the ejecta are
given by
Vþmean ¼
RVþmax
0
vS vð Þdv
RVþmax
0
S vð Þdv; V
mean ¼
R0Vmax
vS vð Þdv
R0Vmax
S vð Þdvð5Þ
3. Electromagnetic Scattering Model
[10] The aim of this study is to estimate masses ofvolcanic ejecta from two Strombolian explosions withcontrasted particle loads by inversion of the Doppler radarmeasurements. For this purpose, a comparison between thebackscattered power measured by the radar (Pmes) and thesynthetic (i.e., calculated) backscattered power (Psynth) isneeded (see section 4. for more details on the inversionmethod). In this section, we first describe how to retrievePmes, and then we derive Psynth using the electromagneticscattering theory of Mie [1908]. As shown by Figure 2,processing of the Doppler spectra yields the total back-scattered power (Ptot = P + P+). Raw power values (Pmes)can then be deduced directly from the radar conversionconstant (Cc) that depends on technical characteristics of theradar acquisition line:
Pmes ¼ PtotCc ð6Þ
On the other hand, Psynth can be derived from anelectromagnetic scattering model. A good approximationfor small particles is the Rayleigh scattering theory, thevalidity limit of which depends on the radar wavelength[Sauvageot, 1992]. This method is commonly used inmeteorology, because the typical diameter of water dropletsis small compared to the wavelengths of meteorologicalradars. In our case (l = 23.5 cm), the Rayleigh theory canonly be applied for particles of diameter (DL) smaller thanl/4, which corresponds to 5.9 cm [Gouhier andDonnadieu, 2006]. However, considering the wide rangeof particle diameters characterizing volcanic activity, thecomplete scattering theory is required to account for the
effects of larger particles. A general solution of electro-magnetic wave scattering was given by Mie [1908]. Thisapproach applies Maxwell’s equations for plane wavesscattered by compositionally homogeneous particles(Appendix A). For application to volcanic eruptions, wefocus on waves scattered at a large distance by sphericalparticles, which we assume are homogeneously distributedin space. Theoretically, the power backscattered to the radarby a population of such particles in a given range gate isproportional to their radar reflectivity (h). The syntheticpower can then be defined as
Psynth ¼CrVshR4
ð7Þ
where Cr is the radar constant, Vs, the sampling volume, andR, the slant distance between the radar and the target. Theradar constant is defined by a set of technical parametersrelated to the radar configuration. The radar constant hasbeen calibrated using a classical method comparing thereflectivity of rainfalls probed by the radar and thereflectivity calculated from the drop size distribution andvelocity of the falling hydrometeors measured simulta-neously with a disdrometer [Pointin et al., 2005]. The radarreflectivity (h) is the sum of the backscattering crosssections (sbks) of the individual particles per unit volume.The reflectivity factor (Z) is defined by Sauvageot [1992] as
h ¼Xni¼1
sbks ið Þ
Vs
ð8Þ
and
Z ¼ hl4
p5 Kj j21018 ð9Þ
Z (commonly confused with h in the literature) is oftenexpressed in logarithmic units as dBZ and is related to hthrough the radar wavelength l, and the particle complexdielectric factor K = (m2 1)/(m2 + 2). Scattering andattenuation by compositionally homogeneous spheres aresignificantly influenced by the complex refractive index(m). VOLDORAD transmits power through a square arrayof four Yagi antennas, such that the incident electromagneticwave is polarized parallel to the scattering plane. Being amonostatic radar (i.e., the same antenna is used fortransmission and reception), we define a backscatteringcross section (sbks) for horizontal linear polarization:
sbks ¼l2
4p
X1n¼1
1ð Þ2 2nþ 1ð Þ an bnð Þ
2
ð10Þ
where an and bn are the complex scattering coefficients (so-called Mie coefficients). Examples of Mie versus Rayleighscattering patterns of an electromagnetic wave scattered byhomogeneous spheres of four different sizes are shown inFigure 3 for a signal at the wavelength used by
B10202 GOUHIER AND DONNADIEU: MASS ESTIMATE OF EJECTA
4 of 17
B10202

VOLDORAD (l = 23.5 cm) and with the complex dielectricfactor of volcanic ash (jKj2 = 0.39) [Adams et al., 1996].These patterns illustrate the large discrepancy between theRayleigh and Mie formulations for particle diameters largerthan a few centimeters at 23.5 cm wavelength. Note that, atsmaller radar wavelengths, this discrepancy occurs at evensmaller particle diameters, making the complete Mieformulation absolutely necessary for studies of volcanicejecta from radar measurements.[11] Figure 4 shows the reflectivity factor (Z) as a
function of particle diameter, using both the Mie andRayleigh formulations for a wavelength of 23.5 cm. Note
the overestimation of Z when computed using the Rayleighapproximation for particle diameters greater than 5.9 cm.
4. Inversion Method
[12] Model inversions are frequently used in geophysicsto recover initial parameters and boundary conditions fromobserved data of natural phenomena. In this case, back-scattered power values (Pmes) are retrieved from radarmeasurements, and synthetic power data (Psynth) are deter-mined from the forward electromagnetic-scattering model.The inversion algorithm thus seeks the best correlationbetween Pmes and Psynth, providing the optimum variable
Figure 3. Mie versus Rayleigh scattering patterns of an electromagnetic wave, parallel polarized,scattered by a single homogeneous sphere with the complex dielectric factor of volcanic ash, jKj2 = 0.39[Adams et al., 1996], and l = 23.5 cm. The wave arrives from the left, and the particle is situated at thecenter of the pattern. Irradiance amplitude is normalized to that of Mie and expressed on a logarithmicscale. (a) Example of a small particle of diameter 2 cm. The Rayleigh and Mie scattering patterns areidentical and symmetrical. Irradiance intensity is the same in front of and behind the particle. (b) Particleof diameter 14 cm. The Rayleigh and Mie scattering patterns are now significantly different. The Miepattern still has two main lobes but is strongly asymmetric, as the backscattered intensity is lower than theforward scattered intensity. (c) Particle of diameter 20 cm. The Rayleigh pattern is still symmetrical,whereas the Mie pattern is divided into several lobes and shows much lower values of irradiance. (d) Fora diameter of 2 m, the Mie (true) scattering pattern becomes very complex and shows always much lowervalues of irradiance than the Rayleigh approximation.
B10202 GOUHIER AND DONNADIEU: MASS ESTIMATE OF EJECTA
5 of 17
B10202

input parameters defined by the vector (X) that characterizesthe PSD. Physical parameters such as particle mass andvolume are then deduced from the PSD. The model takesinto account two main classes of parameters: (1) constantparameters describing the geometry of the system, thetechnical characteristics of the radar or material physicalproperties; (2) the vector of variable input parameters (X;see below) defining the Weibull function of the PSD. Aleast squares estimation method is used on the basis of theminimization function S(X) characterized by the squaredresidual between radar measured data and synthetic data:
S Xð Þ ¼X
Pmes Psynth Xð Þ 2 ð11Þ
Finally, a comparison criterion between radar-measured(Pmes) and synthetic (Psynth) power data is used to stop the
recursive loop when the fitting criterion is reached. Thesuccessive steps of the inversion algorithm are summarizedbelow.[13] Step 0 is attribution of initial values for estimation of
the input parameters:
Xj X1;X2; . . . ;Xn½
[14] Step 1 is resolution of the directmodel (Mie scattering):
X ! P Xð Þsynth
[15] Step 2 is calculation of the minimization function:
S Xð Þ ¼X
Pmes Psynth Xð Þ 2
[16] Step 3 is characterization of the iterative comparisoncriterion:
DP X i
¼ S X i1
S X i
[17] Step 4 is testing of the fitness criterion:
DP Xð Þ < 0
where DP(X) is the fitness criterion, and indices i and j referto the step of the iterative procedure and the number ofvariable parameters, respectively. When a satisfactorysolution is reached, the iterative procedure stops. Thecomputational procedure is summarized in Figure 5.
5. Polydisperse Particle Size Model
5.1. Particle Size Distribution
[18] Solving the inverse problem consists of estimatingthe shape of the PSD by best fit matching of synthetic andobserved data. Various PSDs have been used in, or inferredfrom, previous studies of volcanic ejecta: exponential[Ripepe et al., 1993], lognormal [Sheridan, 1971; Chouetet al., 1974;McGetchin et al., 1974; Self et al., 1974], Rosin
Figure 5. Sketch of the inversion approach. Synthetic radar power data (Psynth) are provided from thetheoretical model (Mie formulation) and compared to the power data measured (Pmes) by VOLDORAD.If the fit criterion is met, the procedure stops and gives the best result. Otherwise, the input parameters (X)are optimized in the recursive loop, and the calculation is repeated.
Figure 4. Synthetic reflectivity factor (Z, expressed indBZ) as a function of particle diameter. Note the largeoverestimation of Z for large diameters when computedusing the Rayleigh approximation. The validity domaindepends on the radar wavelength. In the case of VOLDORAD(l = 23.5 cm), the validity limit (DL) lies close to 5.9 cm,i.e., l/4 [Gouhier and Donnadieu, 2006].
B10202 GOUHIER AND DONNADIEU: MASS ESTIMATE OF EJECTA
6 of 17
B10202

Rammler [Kittleman, 1964; Spieler et al., 2003], Weibull[Nakamura, 1984; Marzano et al., 2006a, 2006b], poly-modal [Sheridan et al., 1987; Riley et al., 2003] andsequential fragmentation/transport (SFT) [Wohletz et al.,1989]. However, there is still a lack of consensus on whichPSD best characterizes Strombolian activity, particularly forthe largest particle diameters. For this reason, a scaledWeibull function is used, because its overall shape may bevaried widely from exponential to Gaussian by means ofonly three factors: shape (k), shift (L), and scale (Nmax). ThePSD can then be adjusted easily during the optimizationphase of the data inversion procedure. The scaled Weibulldistribution Sw is defined through a probability densityfunction fw of particles with diameter D:
Sw D; k;L;Nmaxð Þ ¼ fw D; k;Lð Þmax fw D; k;Lð Þ½ Nmax ð12Þ
with
fw D; k;Lð Þ ¼ k
L
D
L
k1ð Þexp
D
L
k
ð13Þ
The shape factor (k) allows us to choose from anexponential (k = 1) to Gaussian (k = 3) distribution, alongwith all intermediate lognormal distributions (1 < k < 3).The shift factor (L) directly depends on the mode (mn) of thePSD and on the shape factor (k). It can be defined by using
L ¼ mn
k 1
k
1=k
ð14Þ
Nmax is the maximum number of particles of diameter mn inthe scaled Weibull distribution (Figure 6a). It is the
dominant term in the computation of the synthetic powerbecause it strongly influences the estimate of particle mass.[19] The three variable parameters (k, mn, Nmax) control-
ling the PSD make up the vector X of input parameters tothe model. However, in order to obtain a unique solution tothe inverse problem, the number of variable parameters isreduced. This also increases the efficiency and speed of thealgorithm. Parameters k and mn are constrained from thefollowing assumptions argued in subsequent sections: (1)the PSD of Strombolian explosions can be characterized onaverage by a single shape factor k; (2) the mode of the PSD(mn) can be determined from mean particle terminal velocityestimated from the radar measurements. These assumptionsthen reduce the optimization procedure to a single freeparameter (Nmax).
5.2. Parameter Constraints
5.2.1. Shape Factor, k[20] Data on Strombolian PSDs are scarce in the litera-
ture. However, Chouet et al. [1974] gave an exhaustivedescription of two explosions at Stromboli Volcano byphotoballistic analysis. They made an estimate of the PSDfor inflight ejecta (which is what a radar records), anddetermined the modes, ranges, numbers and sizes of par-ticles for two explosions. They also deduced eruptiveparameters such as number, mass and volume of ejectedparticles, and found that one explosion contained a numberand mass of particles about 17 times greater than the other(Table 3). We use this study, where all output parameters arealready known, to determine the input parameter (k) thatbest describes the two Strombolian explosions observed byChouet et al. [1974]. With this aim, we first calculate the‘‘equivalent’’ radar power corresponding to the total ejectedmass estimated by Chouet et al.’s [1974] observations fortwo Strombolian explosions. Then synthetic radar powersare computed for different values of shape factor k. Finally,the recursive procedure stops when synthetic radar powersmatch the equivalent radar power and when syntheticparticle loading parameters (number, mass, volume) corre-
Figure 6. Evolution of the particle size distribution (PSD) for different values of shift (L) and scalefactors (Nmax). For both examples, the shape factor is constant at k = 2. (a) The scale factor (Nmax)represents the maximum number of particles with diameter mn and, therefore, directly controls the totalnumber of particles. (b) The mode (mn) and range (g) of the distribution evolve jointly with the shiftfactor.
B10202 GOUHIER AND DONNADIEU: MASS ESTIMATE OF EJECTA
7 of 17
B10202

spond to those described by Chouet et al. [1974]. Note thatan alternative method would have been simply to determinek from a best fit function of the Chouet et al. [1974] PSD.However, our chosen approach had the advantage of addi-tionally testing our inversion algorithm.[21] The best fit between the observed and synthetic
PSDs is reached in both cases for the same value of k = 2.3,which describes a lognormal distribution. The equivalentsynthetic power achieved is about 3.3 109 and 3.2 1010 mW for explosions 1 and 2 respectively, and corre-sponds to equivalent reflectivity factors (Z) of 61 and 51 dBZ.The inversion procedure yields three parameters (number,mode and range) characterizing the synthetic PSDs, fromwhich two eruptive parameters (mass and volume) aredirectly deduced (Table 3). The agreement between observedand synthetic parameters is very good and validates ourinversion algorithm. Shape factor estimation can then beused afterward with reasonable confidence. Furthermorelognormal PSDs have also been inferred from deposits ofStrombolian activity on other volcanoes, like Etna[McGetchin et al., 1974] and Heimaey [Self et al., 1974].Although k may vary between individual explosions onStromboli, as well as between Strombolian eruptions atdifferent volcanoes, we assume in what follows that thevalue k = 2.3, found for both explosions at Stromboli,represents a suitable average value for Strombolian PSDsand use it as input to the model. Moreover, sensitivity testsreveal a limited dependence of the total ejected mass on k,varying only by a factor of two for values of k ranging from2.0 to 2.6.5.2.2. Shift Factor, L[22] The shift factor (L) is linked to the mode (mn) and
range (g) via the shape factor (k) (Figure 6b). The mode ofthe distribution is estimated directly from radar measure-ments using the terminal settling velocities of ejectedparticles. Indeed, under the assumptions of vertical trajec-tories, no wind influence, and terminal fall velocity, anaverage particle diameter Dp can be deduced from the meannegative radial velocity weighted by the power spectraldensity [Rogers and Yau, 1989; Hort et al., 2003]
Dp ¼Cs
P
X0Vmax
S vð Þ Vr
sin q
2
ð15Þ
where S(v) is the spectral power in a velocity interval. Prefers to the power backscattered mainly by descendingparticles (left part of the Doppler spectrum), and q stands for
the antenna beam elevation angle. Cs is the shapecoefficient, which for a spherical particle is:
Cs ¼3
4Cd
rarpg
ð16Þ
with Cd being the drag coefficient, g the gravitationalacceleration and ra, rp the densities of air and particlesrespectively. Importantly, the interpretation of Dp retrievedfrom Doppler radar spectra differs significantly from mn (themode of the PSD). Indeed, mn corresponds to the particlediameter that is most represented in the particle sizedistribution, i.e., the top of the curve. In radar meteorology,Dp is approximately equal to mn because the sizedistributions of atmospheric water droplets are typicallyGaussian and very narrow. In a volcanic jet however, thepower spectrum is much wider [e.g., Dubosclard et al.,1999], and the physical interpretation of Dp is thereforemore complex. Dp and mn are offset by a factor based on thedependence of the reflectivity (calculated at a given radarwavelength) on the number (N) and diameter (D) ofparticles. Thus mn is obtained from Dp using a scatteringformulation adequate for the range of particle sizescharacterizing explosive volcanic activity [Woods andBursik, 1991; Gouhier and Donnadieu, 2006]. Once k andmn are obtained, the shift factor L can be calculated fromequation (14).5.2.3. Scale Factor, Nmax
[23] By assuming that k and mn are constant throughoutthe inversion procedure, the parameter vector X thenbecomes dependent on just a single free parameter, thescale factor, Nmax. This characterizes the maximum of thescaled Weibull distribution curve (Sw) and evolves duringthe optimization phase of the algorithm. It describes, alongwith k and mn, the total number of particles ejected duringthe explosion, and hence controls the erupted mass estima-tion. The accuracy of the results depends on the step chosenbetween two successive values of Nmax in the recursiveloop. However, although a small step leads to a moreaccurate estimation, it increases considerably the computingtime.
6. Monodisperse Particle Size Model
[24] An alternative data inversion model based on amonodisperse PSD approximation is now presented. In thismodel, the single particle size equals mn, as well as Dp.
Table 3. Comparison Between Values Observed by Chouet et al. [1974] on Two Explosions at Stromboli and Synthetic Values
Calculated by the Inversion Algorithma
Symbol
Explosion 1: Sep 1971 Explosion 2: Sep 1971
Observed Data Synthetic Data Observed Data Synthetic Data
Number of particles N 2588 2588 146 144Mode (m) mn 0.022 0.022 0.025 0.025Range (m) g ?–0.06 0.004–0.06 ?–0.06 0.001–0.06Volume (m3) V 0.033 0.035 0.002 0.0027Mass (kg) M 51 53 3 4.1
aNote that the best fit for both sets of data is reached for the same shape factor k = 2.3 (lognormal particle size distribution).
B10202 GOUHIER AND DONNADIEU: MASS ESTIMATE OF EJECTA
8 of 17
B10202

Figure 7 shows that the number of small particles requiredto generate a given reflectivity can be up to several orders ofmagnitude larger than the number of corresponding largeparticles. Because of this huge difference in particle number,the fraction of small ejecta contributes most to the totalestimated mass. For example, a reflectivity of 95 dBZrequires 8.8 106 kg of 0.01 m particles compared to6.4 104 kg of 1 m particles, a difference of 2 orders ofmagnitude. This result illustrates that large blocks are not soimportant in first-order estimations of total ejected mass.
This monodisperse PSD model significantly reduces com-puting time and ensures fast synthetic power calculations.Mass estimations are provided in Figure 8 for a wide rangeof realistic values of Dp and Z. Since these parameters arederived directly from the Doppler spectra, the correspondingmass can be retrieved instantaneously without any computingphase. This alternative method is valuable because a first-order mass estimate of ejected pyroclasts can be obtained inreal time and used for volcano monitoring.
7. Radar Data
[25] Strombolian explosions and lava fountains weremonitored with VOLDORAD for several hours duringeruptive episodes of the SE crater on 4, 7, and 13 July2001. We focus on data acquired during two explosions thatoccurred at 2141:53 and 2141:56 UT during the eruption of4 July. The two explosions were each short-lived, withdurations of about 3 s. Temporal series (Figure 9) of radarpower are computed from the power spectral density S(v),and sampled at a high frequency (10 Hz) suitable for suchshort-lived explosions.[26] It is important that the power used as input to the
inversion model be defined carefully. First, it is essential toensure that the total power at a given instant is the sum ofPtot across the different range gates along the beam axis.Were the jet wider than the width of a single range gate(120 m), it would be necessary to integrate across severalrange gates in order to obtain the total reflected power.However, in the cases studied here, both jets were suffi-ciently narrow as to fit within a single range gate (G3). Thisis deduced from (1) visual inspection of video snapshots and(2) the lack of echo power signal from neighboring range
Figure 7. Plot of the total mass and number of particles asa function of their diameter in the monodisperse model for areflectivity factor Z = 95 dBZ. Small particles contribute themost to the total ejected mass, for example, 8.8 106 kg fora diameter of 0.01 m, compared to 6.4 104 kg for adiameter of 1 m, i.e., a difference of 2 orders of magnitude.
Figure 8. Mass estimate as a function of average particlesize (Dp) retrieved from the power spectral density using themonodisperse model for different reflectivity factors (Z) ofejected particles. First-order mass assessments can be givensimply from the reflectivity factor (Z) and the averageparticle size (Dp) determined directly from the Dopplerspectra, without any computation phase. Masses of 4.5 104 kg and 1.5 105 kg are roughly estimated forexplosions 1 and 2, respectively.
Figure 9. Temporal evolution of radar echo power duringthe two explosions studied at Mount Etna on 4 July 2001,sampled at 10 Hz. Both echo powers of particles movingaway from (P+) and toward (P) the antenna are plotted inorder to infer the total power at a given instant in the rangegate (G3) located above the vent. Both explosions are brief,lasting 2.2 and 2.8 s, respectively. The second explosion ismuch more powerful (125 and 123 dB for P+ and P,respectively) than the first (117 and 115 dB).
B10202 GOUHIER AND DONNADIEU: MASS ESTIMATE OF EJECTA
9 of 17
B10202

gates (G2 and G4). Integration along the beam axis istherefore unnecessary.[27] The second requirement is that the reflected power
be integrated throughout the entire duration of the explosionas the jet passes vertically across the range gate concerned(G3). In this case, two situations can be envisaged, as shownschematically in Figure 10. To explain these two cases, weconsider two time durations: Dtjet, the duration of jetproduction, and Dtcross, the time necessary for the jet totraverse vertically the given range gate. In the first case(Figure 10a), Dtjet < Dtcross and the jet is thus short enoughfor most of the particles to be recorded at the same instantinside a single sampling volume. The peak of radar echopower can therefore be considered as representative of theentire jet and the input parameters to the model can bederived on the basis of a single Doppler spectrum. WhenDtjet Dtcross (Figure 10b), the jet is never entirelycontained within a single range gate, and the peak of echopower represents only a fraction of the constituent particles.Integration over the duration of the jet (Dtjet) is thereforeessential. Note that for lava fountaining sustained overlonger periods of time at a relatively steady rate, the meanresidence time of ejecta inside the range gate would need tobe taken into account. This could be inferred from velocitiesmeasured by the radar and from the sounding geometry,leading to estimation of the mass flux. The total mass oflava ejected could then be calculated using the duration ofthe lava fountain.[28] In the explosions considered here, the average time
Dtcross taken by the jet to cross the range gate (G3) is 4.7 s atan average velocity of 38 m s1 for explosion 1, and 2.9 s at62 m s1 for explosion 2. By comparison, Dtjet is estimatedfrom videos and radar time series at 2.2 and 2.8 s for
explosions 1 and 2, respectively. In both cases, therefore,Dtjet < Dtcross; no time integration is necessary, and dataanalysis can be based on a single Doppler spectrum.Moreover, the explosion jets commonly become depletedin blocks, and proportionally richer in gas toward thewaning stage of their emission, so that the relevant valuesfor Dtjet might actually even be lower.
8. Results
[29] Results of the polydisperse and monodisperse mod-els are shown in Tables 4a–4c and 5a–5c. The fitnessbetween observed and synthetic power data is very good,with 98.7% and 97.8% for explosions 1 and 2, respectively.
8.1. Particle Loading Parameters
[30] Using the more accurate polydisperse model, thetotal mass of pyroclasts ejected by the first explosion(Tables 4a–4c) is estimated at 58,400 kg, corresponding
Figure 10. Sketch illustrating the two hypotheses made in the calculation of total power. Dtjet is theduration of jet production, and Dtcross is the time necessary for the jet to traverse vertically the range gate.(a) Example of a short-lived jet (Dtjet < Dtcross): the jet is short enough to be wholly enclosed in thesampling volume. A single Doppler spectrum can then be used for the calculation of total power.(b) Example of a long-lived jet (Dtjet > Dtcross): the jet is too long to be contained entirely in the samplevolume at a given instant. The maximum radar echo power represents only a fraction of the totalamount of ejected particles, and several Doppler spectra have to be taken into account for thecalculation of the total power. The two explosions jets of 4 July 2001 at Mount Etna studied in this paperwere both short-lived.
Table 4a. Synthetic Results for Explosion 1 (2141:53 UT) at
Mount Etna SE Cratera
Symbol
Synthetic Results
Monodisperse PSD Polydisperse PSD
Number of particles N 2.75 106 13.9 106
Mode (m) mn 0.027 0.013Volume (m3) V 28.4 38.2Mass (kg) M 43.4 103 58.4 103
Concentrationb (kg m3) C 0.01–0.2 0.02–0.4Reflectivity factor (dBZ) Z 85.16 85.13Power (mW) Psynth 8.14 107 8.08 107
aResults are from using both the polydisperse particle size distributionmodel and the monodisperse approximation.
bConcentration parameters are poorly constrained and have to beregarded as rough approximations (see text for details).
B10202 GOUHIER AND DONNADIEU: MASS ESTIMATE OF EJECTA
10 of 17
B10202

to a volume of 38 m3 assuming a pyroclast density of1530 kg m3 [McGetchin et al., 1974] and a reflectivityfactor of 85 dBZ. The equivalent magma volume (DRE), fora density of 2700 kg m3 [Williams and McBirney, 1979] is22 m3. The second explosion (Tables 5a–5c) yields highervalues of the different parameters, with an ejecta mass of206,000 kg, a pyroclast volume of 135 m3, a reflectivityfactor of 94 dBZ, and a magma volume of 76 m3. Thedifference between the reflectivity factors of the two explo-sions is 9 dBZ, meaning that the second explosion jet isabout 8 times more reflective than the first, and the ejectavolume and mass are consequently about 3.5 times higher.This agrees with visual observations which show clearly thatthe first explosion involved a smaller quantity of incandes-cent lava clots than the second explosion (Figure 11).[31] Particles numbers, masses and volumes estimated
using the monodisperse model lie within 25% of thoseof the polydisperse model for both explosions (Tables 4a–4cand 5a–5c). This underestimation is accounted for by smallparticles that are not considered in the monodisperse model,but that in reality contribute most to the total mass, owingto the great particle number required to match a givenreflectivity.[32] It is instructive to compare the measured reflectivity
factors of the two Etna explosions with those theoreticallycalculated at Stromboli from the Chouet et al. [1974]observations. Recall that reflectivity factor (Z) is a positivefunction of the number (N) and diameters (D) of ejectedparticles. The two explosions at Stromboli give reflectivityfactors of 61 dBZ and 51 dBZ (Table 3), whereas the twoexplosions at Etna give 85 and 94 dBZ (Tables 4a–4c and5a–5c). Thus, even a small explosion at Etna is over 250times more reflective than a large one at Stromboli, andinvolves a mass of ejecta 3 orders of magnitude higher(Table 3). For comparison, very heavy rainfall inducesmaximum reflectivity factors of 60 dBZ [Sauvageot,1992].
8.2. Derived Parameters
[33] The mean mass fluxes of ejecta, estimated from theduration of each explosion (Tables 4a–4c and 5a–5c), reach26,400 and 73,600 kg s1 for explosions 1 and 2, respec-tively. These represent time-averaged values, and are notexpected to be constant over the duration of each explosion.[34] We have also attempted to estimate particle concen-
trations in the two explosion jets at Etna. This is difficultsince, although the radar data provide estimates of totalparticle mass, the jet volumes are poorly constrained. Onepossibility is to make the assumption that each jet filledcompletely and homogeneously the range gate volume. Inthis case, concentration estimates have to be regarded asminima. Using the volume of range gate (G3) above thecrater yields values of 0.02 and 0.06 kg m3 for explosions1 and 2, respectively. However, inspection of video footage(Figure 11) shows that this assumption is probably notrealistic. The other option is to make an estimate of thejet volume from video snapshot analysis, but two difficultiesare inherent in this approach: first, the jets are spatiallyheterogeneous, and, second, only large lava clots are visibleand the volume occupied by ash and small laplli cannot beestimated. However, taking limiting edges on video snap-shots yields that the jets of explosions 1 and 2 representapproximately 5% and 50%, respectively, of the range gatevolume. Using these values gives maximum particle con-centrations estimates of about 0.4 and 0.12 kg m3 forexplosion jets 1 and 2, respectively (Tables 4a–4c and 5a–5c). Note that these concentrations represent spatially aver-aged values over the estimated jet volume; however, muchhigher ejecta concentrations can be found locally especiallyclose to the vent.[35] The high data sampling rate (10 Hz in the config-
uration used for this study) allows VOLDORAD to measurerapid signal fluctuations on the timescale of an individual
Table 4b. Model Parameters for Explosion 1 (2141:53 UT) at
Mount Etna SE Crater
Parameters Input/Output
mn 0.0129Dp 0.027L 0.0165k 2.3g 0.01–0.056Nmax 8.00 105
Fit (%) 98.68
Table 4c. Characteristics for Explosion 1 (2141:53 UT) at Mount
Etna SE Crater
Characteristic Value
Date 4 July 2001Time (UT) 2141:53tjet (s) 2.2V +
max (m/s) 60Vmax
+ a (m/s) 37.9
Z (dBZ) 85.12Pmes (mW) 8.10 107
aThe parameter Vmax+ is the time-averaged maximum velocity and differs
from the mean velocity calculated by the radar.
Table 5a. Synthetic Results for Explosion 2 (2141:56 UT) at
Mount Etna SE Cratera
Symbol
Synthetic Results
Monodisperse PSD Polydisperse PSD
Number of particles N 5.00 106 23.3 106
Mode (m) mn 0.034 0.016Volume (m3) V 102.9 134.7Mass (kg) M 157 103 206 103
Concentrationb (kg m3) C 0.05–0.1 0.06–0.12Reflectivity factor (dBZ) Z 93.78 93.77Power (mW) Psynth 5.92 106 5.87 106
aResults are from using both the polydisperse particle size distributionmodel and the monodisperse approximation.
bConcentration parameters are poorly constrained and have to beregarded as rough approximations (see text for details).
Table 5b. Model Parameters for Explosion 1 (2141:56 UT) at
Mount Etna SE Crater
Parameters Input/Output
mn 0.0164Dp 0.034L 0.021k 2.3g 0.01–0.072Nmax 1.05 106
Fit (%) 97.82
B10202 GOUHIER AND DONNADIEU: MASS ESTIMATE OF EJECTA
11 of 17
B10202

explosion. It is therefore possible to calculate an averageejecta velocity, and hence a mean kinetic energy for anexplosion, using
Ek ¼1
2M
1
Nt
Xni¼1
Vþmax ið Þ
!2
ð17Þ
where M is the total ejected mass given in Tables 4a and 5aand Vmax
+ is the maximum radial velocity, given in Tables 4cand 5c Doppler spectrum (i) recorded in the samplingvolume. Nt is the total number of Doppler spectra acquiredduring a given explosion. A mean kinetic energy of 4.2 107 J is obtained for a time-averaged maximum radialvelocity (Vmax
+ ) of 38 m s1 for explosion 1 and 3.9 108 Jfor 62 m s1 for explosion 2. These values can be comparedwith the thermal energies of explosions 1 and 2 fromequation (18), which are estimated at 8.4 1010 J and 3 1011 J, respectively, assuming a magma temperature T of
1373 K [Francalanci et al., 1989] and a magma specificheat capacity, Cp, of 1050 J kg1 K1 [Vosteen andSchellschmidtb, 2003]:
ET ¼ MTCp ð18Þ
The thermal energies of the two explosions therefore exceedthe kinetic energies by approximately 3 orders of magni-tude. Note that the kinetic and thermal energies of the gasphase are not taken into account in these calculations.
8.3. Possible Effects of Outsized Particles
[36] The numerical approach to the inverse problemrequires us to define a continuous theoretical function forthe PSDs characterizing the explosions. In reality, however,explosion-generated PSDs might contain a coarse tail oflarge, discrete blocks which, although relatively small innumber, could have a nonnegligible effect on the massestimation. For example, the PSDs estimated photoballisti-cally by Chouet et al. [1974] at Stromboli contained suchcoarse tails of blocks. Large blocks ejected during Strom-bolian explosions at Mount Etna have also been docu-mented by McGetchin et al. [1974]. In the present studythese have been neglected because they cannot be describedby the type of continuous PSD function required by ourautomatized inversion algorithm. Manual runs have there-fore been carried out to assess the sensitivity of masscalculations to an additional fraction of large particles. Wedefine a composite PSD with a continuous part and anadditional discrete part that constitute the lower and upperranges, respectively, of the natural PSD (Figure 12). Thecoarse tail, consisting of 85 discrete blocks, is representedby an exponential distribution from 0.1 to 1 m in diameterwith a median size of 0.23 m, i.e., close to that observed by
Table 5c. Characteristics for Explosion 2 (2141:56 UT) at Mount
Etna SE Crater
Characteristic Value
Date 4 July 2001Time (UT) 2141:56tjet (s) 2.8Vmax+ (m/s) 100
Vmax+ a(m/s) 61.6
Z (dBZ) 93.83Pmes (mW) 6.00 106
aThe parameter Vmax+ is the time-averaged maximum velocity and differs
from the mean velocity calculated by the radar.
Figure 11. Snapshots of the two explosions from the SE crater of Mount Etna on 4 July 2001. Imagesare shown at maximum brightness, corresponding to the highest radar reflectivity from lava fragments.(a) The first explosion, occurring at 2141:53 UT, displays a low quantity of lava fragments and lasts 2.2 s,and (b) the second explosion, occurring at 2141:56 UT, displays a much higher number of lava fragmentsand lasts 2.8 s.
B10202 GOUHIER AND DONNADIEU: MASS ESTIMATE OF EJECTA
12 of 17
B10202

McGetchin et al. [1974] at the NE crater of Mount Etna(0.2 m). Although numerically less abundant by morethan 5 orders of magnitude than the smaller particlesconstituting the continuous PSD (Figure 12), the blocks ofthis coarse tail account for 10% of the total reflectivity.This composite PSD is probably a more realistic represen-tation of the explosion ejecta, and gives a total mass of187,000 kg for explosion 2, in comparison to 206,000 kgfor the continuous PSD lacking a coarse tail. We concludethat neglecting large blocks results in overestimation of themass by only 9% for this explosion. This is because the totalmass of pyroclasts is mostly controlled by the large numberof small particles, as shown in Figure 7. As a result, all themass-related parameters listed in Tables 4a–4c and 5a–5ccan be regarded as maxima.
9. Discussion
[37] A Doppler radar (VOLDORAD) has been used toestimate for the first time a wide range of physical param-eters characterizing Strombolian explosions at Mount Etna.In addition to the velocity data routinely provided byDoppler radar [Donnadieu et al., 2005], the results yieldestimates of particle loading (number, mass and volume), aswell as derived parameters such as mass flux, time-averagedparticle kinetic and thermal energies and, more approxi-mately, particle concentration in the eruptive jet.[38] Our approach in estimating particle loading, and the
parameters derived from it, involves certain assumptions.For example, the electromagnetic scattering model assumesthat all particles are smooth, spherical and compositionallyhomogeneous, which is not the case for pyroclasts. How-ever, bearing in mind the statistical effects of a very large
number of rough and complexly shaped particles, as well asour objective of first-order estimation, these simplificationsseem reasonable. Another assumption concerns the particlesize distribution (PSD) used for data inversion. The inver-sion procedure involves three physical parameters: twoconstants defining the PSD (mode and shape factor), andthe third being the number of particles corresponding to themode that evolves during the optimization phase of theinversion procedure. In the present study the mode wasconstrained from the radar measurements at Mount Etna. Onthe other hand, the shape factor was constrained indepen-dently using published photoballistic data of Chouet et al.[1974] from explosions at Stromboli, and was assumed tobe representative of the explosion ejecta at Mount Etna.Many problems are inherent in this approach. For example,the photoballistically derived PSD of Chouet et al. [1974],while not skewed by atmospheric or depositional processes,is inadequate to describe the fine tail of the distribution,particles of which are too small to be detectable on photo-graphs. On the other hand, McGetchin et al. [1974] con-structed a PSD at Mount Etna from grain size measurementsof Strombolian deposits, but this method also failed to takeinto account the smallest particles, which are dispersed farfrom source by the wind. Other difficulties involved indetermining PSDs from deposits may also arise from bombagglutination or from block breakage on impact. In addition,such studies probably fail to sample volumes of ejecta largeenough to be statistically representative of real amounts oflarge blocks. Both photoballistic and ground deposits meth-ods therefore fail to take into account small particles, whosecontribution to the total mass is important. In contrast, UVsatellite methods such as TOMS or more recently OMI[Carn et al., 2008; Krotkov et al., 2008], succeed in imaginggas (particularly SO2), ash and aerosols released by volca-nic eruptions. The IR satellite methods such as Meteosat orMODIS [Watson et al., 2004] are further able to provideestimates of the distal ash content of large eruptive cloudsfar from the emission source that are mainly composed ofsmall particles. But these satellite-based methods fail toimage the larger size fractions segregated earlier duringplume ascent. These methods might also be biased byatmospheric effects on particles, such as water vapor con-tent and ice formation. Nevertheless, the comparison ofnear-source estimates of ejecta mass from ground-basedDoppler radar with the mass of distal fine ash estimatedby satellite-based methods could bring valuable constraintson the particle segregation from ash clouds through spaceand time and hence on models of ash dispersal. In order toobtain more accurate values of the mass of ejecta, a morethorough knowledge must be acquired of total sourcegranulometries of volcanic explosions, and of their variabil-ity for different eruptive regimes. Insights into such sourcePSDs could be gained for instance by high-resolutionimagery and remote sensing methods working at differentwavelengths. Such methods should target regions of theeruptive jet close to the vent in order for all ejected particlesto be included. Their combination with ground ash collec-tors would bring even more stringent constraints. Knowl-edge acquired on PSDs would additionally provide furthervaluable insights into fragmentation and explosion processesduring volcanic eruptions.
Figure 12. Composite particle size distribution compris-ing a continuous function to describe the smaller end of thePSD, with an additional coarse tail of large, discrete blocks.The continuous part refers to the PSD of explosion 2calculated from our algorithm. The coarse tail is constrainedfrom the data of McGetchin et al. [1974]; it consists of atotal of only 85 blocks with a median size of 0.23 m, butthat represents about 10% of the total reflectivity.
B10202 GOUHIER AND DONNADIEU: MASS ESTIMATE OF EJECTA
13 of 17
B10202

[39] By fixing the explosion source PSD shape factorindependently, and by determining the PSD mode using theradar measurements, we obtain a way of estimating theparticle loading parameters to a first approximation.Neglecting the inevitable coarse tail of large blocks appearsjustified on the basis of our calculations. The two PSDassumptions used in this paper each have different advan-tages. The polydisperse model requires an inversion proce-dure that takes a long time to compute, but which results inmass estimation to a reasonable first-order accuracy. Thisapproach is probably best adapted to studies of eruptiondynamics, where the most accurate possible parameterestimates are required. The monodisperse PSD model, onthe other hand, does not require any computing phase, sothat mass estimation is fast and straightforward. The disad-vantage of this method is that it underestimates the particleloading. This monodisperse model is most suitable forvolcano monitoring, where the eruptive parameters couldbe calculated automatically in real time from the Dopplerspectra, but where a lower degree of accuracy couldprobably be tolerated.[40] This study has shown that Doppler radar is a pow-
erful, as yet underexploited, tool for quantitative studies oferuptive dynamics. The wide range of physical parametersaccessible is potentially valuable for testing mathematicalmodels of eruption jets and plumes. VOLDORAD is alsowell suited to the routine monitoring of active volcanoes. Itcan be sited at distances of up to 12 km from the vent,making it useful for the monitoring of large, highly explo-sive edifices. It functions under harsh weather conditionsand has a data sampling rate suitable for the study ofexplosive activity. The relatively low energy consumptionallows us either to set up the system quickly in the field witha small power generator for a limited period of time, or torun the radar continuously at a site supplied with electricpower. In addition to classical continuous records of tem-poral series, VOLDORAD has a ‘‘trigger’’ mode, in whichsequences of raw data can be recorded at high samplingrate, without basic processing and hence visualization. Thesystem can be activated either on command of the operator[Dubosclard et al., 2004], or by an eruptive seismic signalof some predefined threshold potentially linked to an alarmsystem. This option is useful when monitoring isolatedexplosions interspersed with long intervals of quiet activity,as characteristic of many volcanoes. In addition to theimmediate benefits for operational surveillance, the long-term deployment of such radar on active volcanoes wouldenable to document the variability of eruptive behaviors andto build databases potentially useful for future eruptions.Combination with other ground-based methods, such asvisual and infrared imagery, broadband seismic, ultrasounddetection and gas analysis would shed light on the complexinteractions among various eruptive processes. Thermalvideo such as Forward Looking Infrared Radiometer (FLIR)would be particularly helpful for the study of Strombolianactivity. Its capacity to detect both fine ash plumes and largeblocks can bring additional constraints on PSDs. Thismethod can also provide further insights on Stromboliansource conditions [Patrick et al., 2007]. Besides, ourmethodology of particle loading estimation could beextended to the study and monitoring of volcanic ashplumes. With this aim, the coupling of multichannel satellite
imagery with ground-based radar measurements would beparticularly relevant for the mitigation of risks related to ashclouds and for the investigations on ash plume dynamics.
Appendix A: Electromagnetic ScatteringEquations
[41] Considering the wide range of particle diameterscharacterizing volcanic activity, the complete scatteringtheory is required to account for the effects of largeparticles. A general solution of electromagnetic wave scat-tering was given by Mie [1908]. The derivation of theelectromagnetic scattering model specifically applied tothe case of volcanic studies is developed in this section.In this first approach of scattering by volcanic ejecta, weapply Maxwell’s equations for plane wave scattered byspherical particles in a homogeneous medium at a largedistance [e.g., Bohren and Huffman, 1983].[42] Starting with Maxwell’s equation for plane waves:
r E ¼ 0 ðA1Þ
r H ¼ 0 ðA2Þ
r E ¼ iwmH ðA3Þ
r H ¼ iweE ðA4Þ
where E and H are the electric and magnetic fields. e is thedielectric permittivity, m is the magnetic permeability, and wis angular frequency. Taking the curl of (A3) and (A4), gives:
r r Eð Þ ¼ iwmr H ¼ w2emE
r r Hð Þ ¼ iwer E ¼ w2emHðA5Þ
If we use the vector identity,
r r Að Þ ¼ r r Að Þ r rAð Þ ðA6Þ
we obtain
r2E þ w2emE ¼ 0 r2H þ w2emH ¼ 0 ðA7Þ
where r2A = r (rA). Thus, E and H satisfy the waveequation. The field inside the particle is denoted by (E1, H1);the field in the medium surrounding the particle (E2, H2) isthe superposition of the incident field (Ei, Hi) and thescattered field (Es, Hs):
E2 ¼ Ei þ Es H2 ¼ Hi þ Hs ðA8Þ
The electromagnetic field is required to satisfy the Maxwellequations at points where e and m are continuous. However,there is a discontinuity at the boundary of the particle, wherethe following conditions on the fields are imposed:
H2 xð Þ H1 xð Þ½ ns ¼ 0
E2 xð Þ E1 xð Þ½ ns ¼ 0
ðA9Þ
B10202 GOUHIER AND DONNADIEU: MASS ESTIMATE OF EJECTA
14 of 17
B10202

where ns is the outward directed normal to the surface of theparticle. Under the conditions of our study (far-field regionand spherical particle), the scattered field Es is mainlytransverse and can be resolved into components parallel (E//)and perpendicular (E?) to the scattering plane. The relation-ship between incident and scattered field amplitudes can bewritten in matrix form:
E==s
E?s
¼ eikn Rrzð Þ
iknR
S2 0
0 S1
E==i
E?i
ðA10Þ
where kn = 2p/l is the wave number, R, the distance to theparticle, and rz, the component of R on the direction ofpropagation of the incident wave. The radiation of anelectromagnetic wave can be described in terms of intensityfrom the four Stokes parameters (I, Q, U, V) describing thevarious states of polarization: not polarized (I), polarizedhorizontally (+Q), polarized vertically (Q), polarized at+45 (+U), polarized at45 (U), right circularly polarized(+V) or left circularly polarized (V). The relationshipbetween incident and scattered Stokes parameters (indexed iand s, respectively) follows from the amplitude scatteringmatrix, also called the Mueller matrix [Bohren and Huffman,1983; Wolf and Voshchinnikov, 2004]:
Is
Qs
Us
Vs
0BBB@
1CCCA ¼ l2
4p2R2
S11 Qð Þ S12 Qð Þ 0 0
S12 Qð Þ S11 Qð Þ 0 0
0 0 S33 Qð Þ S34 Qð Þ0 0 S34 Qð Þ S33 Qð Þ
0BBB@
1CCCA
I1
Qi
Ui
Vi
0BBB@
1CCCA
ðA11Þ
The scattering matrix elements (Si,j) depend on Q, which isthe angle between the direction of the incident and thescattered radiation of wavelength l. VOLDORAD transmitspower through a square array of four Yagi antennas, such thatthe incident wave has a horizontal linear polarization (Ii =1, Qi = 1, Ui = 0, Vi = 0). Thus, in our case, we denote by i//the corresponding scattered irradiance that only depends onthe two first scattering matrix elements (S11, S12):
i== ¼ S11 þ S12 ¼ S2j j2 ðA12Þ
with
S11 Qð Þ ¼ 12
S2 Qð Þj j2þ S1 Qð Þj j2
S12 Qð Þ ¼ 12
S2 Qð Þj j2 S1 Qð Þj j2 ðA13Þ
The sum of the two first scattering matrix elements can thenbe derived from the single complex amplitude function S2 inthe form of a convergent series:
S2 Qð Þ ¼X1n¼1
2nþ 1
n nþ 1ð Þ antn Qð Þ þ bnpn Qð Þð Þ ðA14Þ
where n is a positive integer, an and bn are the complexscattering coefficients (Mie coefficients), and tn and pn arethe angular functions. The series can be terminated after ncsufficiently large terms. The complex scattering coefficients
depend particularly on the size parameter x and therefractive index m of the material [Sauvageot, 1992] andare defined as
an ¼myn mxð Þy 0
n xð Þ yn xð Þy 0n mxð Þ
myn mxð Þx0n xð Þ xn xð Þy 0n mxð Þ
bn ¼yn mxð Þy 0
n xð Þ myn xð Þy 0n mxð Þ
yn mxð Þx0n xð Þ mxn xð Þy 0n mxð Þ
ðA15Þ
The size parameter x = knr is a dimensionless variable, r,being the radius of the spherical particle. Y and x are theRiccati-Bessel functions of first and second kind and canbe defined by
yn xð Þ ¼ xjn xð Þ
xn xð Þ ¼ jn xð Þ þ iyn xð ÞðA16Þ
where jn and yn are the spherical Bessel functions of firstand second kind defined as
jn xð Þ ¼ffiffiffiffip2x
pJnþ1=2 xð Þ
yn xð Þ ¼ffiffiffiffip2x
pYnþ1=2 xð Þ
ðA17Þ
The spherical Bessel functions satisfy the recurrencerelations:
zn1 xð Þ þ znþ1 xð Þ ¼ 2nþ1x
zn xð Þ
2nþ 1ð Þ ddpzn xð Þ ¼ nzn1 xð Þ nþ 1ð Þznþ1 xð Þ
ðA18Þ
The angular functions tn and pn depend only on Q and aredefined by the Legendre polynomials,
pn Qð Þ ¼ P1n Qð ÞsinQ
tn Qð Þ ¼ dP1n Qð ÞdQ
ðA19Þ
and can be found from the recurrence relations:
tn Qð Þ ¼ n cosQpn Qð Þ nþ 1ð Þpn1 Qð Þ
pn Qð Þ ¼ 2n1n1
cosQpn1 Qð Þ nn1
pn2 Qð Þ
ðA20Þ
The scattered irradiance can now be calculated for anyparticle size, under the special conditions of our soundingusing VOLDORAD at Mount Etna (Figure 1). Determiningthe scattering matrix elements enables us to define thescattering cross section of each particle; this then relatesirradiance to reflectivity through the Mie coefficients.VOLDORAD is a monostatic radar (i.e., the same antennais used for transmission and reception), thus we define a
B10202 GOUHIER AND DONNADIEU: MASS ESTIMATE OF EJECTA
15 of 17
B10202

backscattering cross section (sbks) for horizontal linearpolarization:
sbks ¼l2
4p
X1n¼1
1ð Þ2 2nþ 1ð Þ an bnð Þ
2
ðA21Þ
Note that we often use the backscattering efficiencydefined as the cross section coefficient normalized by theparticle section such as
Qbks ¼sbks
pr2ðA22Þ
The theoretical radar power for a distributed target in asampling volume (Vs) at a given distance (R) can then bededuced from the radar reflectivity (h), which is simply thesum of the backscattering cross section (sbks) of eachparticle over a unit volume [Doviak and Zrnic, 1984;Sauvageot, 1992],
Psynth ¼CrVshR4
ðA23Þ
h ¼Xni¼1
sbks
Vs
ðA24Þ
where Cr is the radar constant defined by a set of technicalparameters related to the radar configuration.
Notation
a radar beam width (deg).A0 amplitude of electromagnetic wave.
an, bn complex scattering coefficients (magnetic andelectric mode).
Br noise of Doppler spectrum (mW).C mass particle concentration (kg m3).Cc constant of conversion.Cd drag coefficient.Cp magma specific heat capacity (J kg1 K1).Cr radar constant (mW m2).Cs shape coefficient of a spherical particle.D diameter of particle (m).DL validity limit diameter (m).Dp average particle diameter (m).
Dtcross duration for the jet to cross a range gate (s).Dtjet duration of jet production (s).E,H electric and magnetic fields (N C1; A m1).
e dielectric permittivity (F m1).Ek kinetic energy (J).ET thermal energy (J).fd Doppler frequency (Hz).ft transmitted frequency (Hz).fw scaled Weibull probability density function.g range of the particle size distribution (m).
Gn range gates (sampling volume).h radar reflectivity (cm1).i// parallel scattered irradiance (W m2).
jn, yn spherical Bessel functions of first and secondkind.
K complex dielectric factor.k shape factor.kn wave number (rad m1).L shift factor.L length of the range gate (m).m complex refractive index.M mass of particles (kg).m magnetic permeability (H m1).mn mode of the particle size distribution (m).r vector differential operator (nabla symbol).
r.A divergence of a vector field A.r A curl of a vector field A.
r2A Laplacian of a vector field A.N number of particles.Nc number of coherent integrations of radar
pulses.Nmax scale factor.
Nt characteristic Number of Doppler spectra.w angular frequency (rad s1).P± radar power received (mW).
Pmes radar raw power received (mW).Psynth radar synthetic power received (mW).
Pt peak power (W).Ptot total radar power received (mW).Q angle between incident and scattered radiation
(deg).q antenna beam elevation angle (deg).
Qbks backscattering efficiency.r radius of the particle (m).R slant distance between radar and target (m).rz component of R on the incident wave
direction.ra, rp densities of air and particles (kg m3).sbks backscattering cross section (m2).S(v) power spectral density.S2 complex amplitude function (parallel
component).S11, S12 scattering Mueller matrix elements.
Sw scaled Weibull distribution.t pulse duration (ms).
pn, tn angular functions.T magma temperature (K).tr pulse repetition period (ms).V volume of pyroclasts (m3).
Vmax+ average maximum velocity of ejected
pyroclasts (m s1).Vmax
± maximum velocities of ejected pyroclasts(m s1).
Vmean± mean velocities of ejected pyroclasts (m s1).Vr radial velocity of ejected pyroclasts (m s1).Vs radar sampling volume (m3).x size parameter.X vector of variable input parameters.
y , x RiccatiBessel functions of first and secondkind.
Z radar reflectivity factor (mm6 m3).l radar wavelength (cm).
(I,Q,U,V)i,s incident and scattered Stokes parameters(polarization state).
[43] Acknowledgments. We acknowledge Geoff Wadge and an anon-ymous reviewer for their thoughtful reviews that significantly enhanced this
B10202 GOUHIER AND DONNADIEU: MASS ESTIMATE OF EJECTA
16 of 17
B10202

paper, and we thank Richard Arculus and Michael P. Ryan for handling thepaper. We also thank T. H. Druitt for his insightful comments thatconsiderably improved the manuscript and S. Vergniolle for discussionson this topic. Georges Dubosclard, Roland Cordesses, and Claude Hervierare especially acknowledged for the precious radar measurements carriedout in the field, without which this work could not have been achieved.M. Gouhier’s Ph.D. work was supported by a French MESR fellowship.Field work on Etna was possible thanks to the logistical help of the INGVCatania and was funded by the CNRS-INSU PNRN programs 1999–2001.
ReferencesAdams, R. J., W. F. Perger, W. I. Rose, and A. Kostinski (1996), Measure-ments of the complex dielectric constant of volcanic ash from 4 to 19GHz, J. Geophys. Res., 101, 8175–8185, doi:10.1029/96JB00193.
Bohren, C. F., and D. R. Huffman (1983), Absorption and Scattering ofLight by Small Particles, 489 pp., Wiley-Interscience, New York.
Carn, S. A., A. J. Prata, and S. Karlsdottir (2008), Circumpolar transport ofa volcanic cloud from Hekla (Iceland), J. Geophys. Res., 113, D14311,doi:10.1029/2008JD009878.
Chouet, B., N. Hamisevicz, and T. R. McGetchin (1974), Photoballistics ofVolcanic Jet Activity at Stromboli, Italy, J. Geophys. Res., 79, 4961–4976, doi:10.1029/JB079i032p04961.
Dean, K., S. A. Bowling, G. Shaw, and H. Tanaka (1994), Satellite analysesof movement and characteristics of the Redoubt Volcano plume, J. Volca-nol. Geotherm. Res., 62, 339–352, doi:10.1016/0377-0273(94)90040-X.
Dehn, J., K. Dean, and K. Engle (2000), Thermal monitoring of NorthPacific volcanoes from space, Geology, 28, 755–758, doi:10.1130/0091-7613(2000)28<755:TMONPV>2.0.CO;2.
Donnadieu, F.,G.Dubosclard,R.Cordesses, T.Druitt, C.Hervier, J. Kornprobst,J. F. Lenat, P. Allard, and M. Coltelli (2005), Remotely monitoring vol-canic activity with ground-based Doppler radar, Eos Trans. AGU, 86,204, doi:10.1029/2005EO210001.
Doviak, R. J., and D. S. Zrnic (1984), Doppler Radar and Weather Ob-servations, 562 pp., Academic, Orlando, Fla.
Dubosclard, G., R. Cordesses, P. Allard, C. Hervier, M. Coltelli, andJ. Kornprobst (1999), First testing of a volcano Doppler radar (Voldorad)at Mt. Etna, Geophys. Res. Lett., 26, 3389 – 3392, doi:10.1029/1999GL008371.
Dubosclard, G., F. Donnadieu, P. Allard, R. Cordesses, C. Hervier,M. Coltelli, M. Privitera, and J. Kornprobst (2004), Doppler radar sound-ing of volcanic eruption dynamics at Mount Etna, Bull. Volcanol., 66,443–456, doi:10.1007/s00445-003-0324-8.
Francalanci, L., P. Manetti, and A. Pecerillo (1989), Volcanological andmagmatological evolution of Stromboli volcano (Aeolian islands): Theroles of fractional crystallization, magma mixing, crustal contaminationand source heterogeneity, Bull. Volcanol., 51, 355–378, doi:10.1007/BF01056897.
Gouhier, M., and F. Donnadieu (2006), Numerical modeling of Dopplerradar signals of Strombolian eruptions, Eos Trans. AGU, 87(52), FallMeet. Suppl., Abstract V43B-1794.
Harris, D. M., and W. I. Rose (1983), Estimating particles size, concentra-tions, and total mass of ash in volcanic clouds using weather radar, J.Geophys. Res., 88, 10,969–10,983, doi:10.1029/JC088iC15p10969.
Harris, D. M., W. I. Rose, R. Roe, and M. R. Thompson (1981), Radarobservations of ash eruptions, U.S. Geol. Surv. Prof. Pap., 1250, 323–333.
Hort, M., and R. Seyfried (1998), Volcanic eruption velocities measuredwith a micro radar, Geophys. Res. Lett., 25, 113–116.
Hort, M., R. Seyfried, and M. Voge (2003), Radar Doppler velocimetry ofvolcanic eruptions: Theoritical considerations and quantitative documen-tation of changes in eruptive behaviour at Stromboli, Italy, Geophys.J. Int., 154, 515–532, doi:10.1046/j.1365-246X.2003.01982.x.
Kittleman, L. R. J. (1964), Application of Rosin’s distribution in size fre-quency analysis of clastic rocks, J. Sediment. Petrol., 34, 483–502.
Krotkov, N. A., et al. (2008), Validation of SO2 retrievals from the OzoneMonitoring Instrument over NE China, J. Geophys. Res., 113, D16S40,doi:10.1029/2007JD008818.
Lacasse, C., S. Karlsdottir, G. Larsen, H. Soosalu, W. I. Rose, and G. G. J.Ernst (2004), Weather radar observations of the Hekla 2000 eruptioncloud, Iceland, Bull. Volcanol., 66, 457–473, doi:10.1007/s00445-003-0329-3.
Marzano, F. S., G. Vulpiani, and W. I. Rose (2006a), Microphysical char-acterization of microwave radar reflectivity due to volcanic ash clouds,IEEE Trans. Geosci. Remote Sens., 44, 313 – 327, doi:10.1109/TGRS.2005.861010.
Marzano, F. S., S. Barbieri, G. Vulpiani, and W. I. Rose (2006b), Volcanicash cloud retreival by ground-based microwave weather radar, IEEETrans. Geosci. Remote Sens., 44, 3235 –3246, doi:10.1109/TGRS.2006.879116.
McGetchin, T. R., M. Settle, and B. Chouet (1974), Cinder cone growthmodeled after northeast crater, Mount Etna, Sicily, J. Geophys. Res., 79,3257–3272, doi:10.1029/JB079i023p03257.
Mie, G. (1908), Beitrage zur Optik truber Medien, speziell kolloidalerMetallosungen, Ann. Phys., 330(3), 377–445.
Nakamura, Y. (1984), The 1888 eruption of Bandai volcano, Japan: Grainsize distribution, paper presented at IAVCEI Meeting, Int. Assoc. ofVolcanol. and Chem. of the Earth’s Interior, Rome, 13–17 Aug.
Patrick, M. R., A. J. L. Harris, M. Ripepe, J. Dehn, D. A. Rothery, andS. Calvari (2007), Strombolian explosive styles and source conditions:Insights from thermal (FLIR) video, Bull. Volcanol., 69, 769–784,doi:10.1007/s00445-006-0107-0.
Pointin, Y., J. Fournet-Fayard, and F. Donnadieu (2005), Calibration duradar UHF VOLDORAD 2, par comparaison de ses donnees avec cellesdu disdrometre du LaMP/OPGC., Note OPGC 144, 61 pp., Obs. de Phys.du Globe, Clermont-Ferrand, France.
Riley, C. M., W. I. Rose, and G. J. S. Bluth (2003), Quantitative shapemeasurements of distal volcanic ash, J. Geophys. Res., 108(B10), 2504,doi:10.1029/2001JB000818.
Ripepe, M., M. Rossi, and G. Saccorotti (1993), Image processing ofexplosive activity at Stromboli, J. Volcanol. Geotherm. Res., 54, 335–351, doi:10.1016/0377-0273(93)90071-X.
Rogers, R., andM. Yau (1989),A Short Course on Cloud Physics, Pergamon,Oxford,U.K.
Sauvageot, H. (1992), Radar Meteorology, 366 pp., Artech House, Boston,Mass.
Self, S., R. S. J. Sparks, B. Booth, and G. P. L. Walker (1974), The 1973Heimaey Strombolian Scoria deposit, Iceland, Geol. Mag., 111, 539–548.
Seyfried, R., and M. Hort (1999), Continuous monitoring of volcanic erup-tion: A review of various techniques and new results from a frequency-modulated radar Doppler system, Bull Volcanol., 60, 627–639.
Sheridan, M. F. (1971), Particle-size characteristics of pyroclastic tuffs,J. Geophys. Res., 76, 5627–5634, doi:10.1029/JB076i023p05627.
Sheridan, M. F., K. H. Wohletz, and J. Dehn (1987), Discrimination ofgrain-size subpopulations in pyroclastic deposits, Geology, 15, 367–370, doi:10.1130/0091-7613(1987)15<367:DOGSIP>2.0.CO;2.
Spieler, O., M. Alidibirov, and D. B. Dingwell (2003), Grain-size charac-teristics of experimental pyroclasts of 1980 Mount St. Helens cryptodomedacite: Effects of pressure drop and temperature, Bull. Volcanol., 65, 90–104.
Vosteen, H. D., and R. Schellschmidtb (2003), Influence of temperature onthermal conductivity, thermal capacity and thermal diffusivity for differ-ent types of rock, Phys. Chem. Earth, 28, 499–509.
Watson, I. M., V. J. Realmuto, W. I. Rose, A. J. Prata, G. J. S. Bluth, Y. Gu,C. E. Bader, and T. Yu (2004), Thermal infrared remote sensing ofvolcanic emissions using the moderate resolution imaging spectroradi-ometer, J. Volcanol. Geotherm. Res., 135, 75–89, doi:10.1016/j.jvol-geores.2003.12.017.
Weibull, W. (1939), A statistical theory of the strength of materials, R.Swed. Inst. Eng. Res., 151.
Weill, A., G. Brandeis, S. Vergniolle, F. Baudin, J. Bilbille, J. F. Fevre,B. Piron, and X. Hill (1992), Acoustic sounder measurements of thevertical velocity of volcanic jets at Stromboli volcano, Geophys. Res.Lett., 19, 2357–2360, doi:10.1029/92GL02502.
Williams, H., and A. R. McBirney (1979), Volcanology, 397 pp., FreemanCooper, San Francisco, Calif.
Wohletz, K. H., M. F. Sheridan, and W. K. Brown (1989), Particle sizedistributions and the sequential fragmentation/transport theory applied tovolcanic ash, J. Geophys. Res., 94, 15,703–15,715, 721, doi:10.1029/JB094iB11p15703.
Wolf, S., and N. V. Voshchinnikov (2004), Mie scattering by ensembles ofparticles with very large size parameters, Comput. Phys. Commun., 162,113–123, doi:10.1016/j.cpc.2004.06.070.
Woods, A. W., and M. I. Bursik (1991), Particle fallout, thermal disequili-brium and volcanic plumes, Bull. Volcanol., 53, 559–570, doi:10.1007/BF00298156.
F. Donnadieu and M. Gouhier, Laboratoire Magmas et Volcans
(UMR 6524 CNRS-IRD), 5, rue Kessler, F-63038 Clermont-Ferrand, France. ([email protected]; [email protected])
B10202 GOUHIER AND DONNADIEU: MASS ESTIMATE OF EJECTA
17 of 17
B10202


Abstract VOLDORAD, a low power UHF Doppler radar, is a portable ground-based system, developed by the Observatoire de Physique du Globe de Clermont-Ferrand (France), especially for the study of explosive volcanic activity. The capabilities of such remote sensing methods to probe safely hazardous eruption jets and plumes constitute a real step forward regarding the in-depth analysis of physical processes controlling the dynamics of volcanic eruptions. The main objective of this work is to bring more stringent constraints, particularly from the development of methodological procedures, on the interpretation of Doppler radar data, with the final aim of better understanding the explosive dynamics. This study has been achieved from Doppler radar measurements carried out at Etna Southeast crater during the eruption of July 4, 2001, and focused on the Strombolian activity. However, processing methods, theoretical forward models and inversion procedures developed here have been achieved with the scope of a more general application, i.e., for various types of eruptions. The thorough analysis of Strombolian explosions by ground-based Doppler radar has permitted to obtain a wide range of source parameters, mainly related to kinetic, loading and geometrical features. Accurate quantitative assessment of these parameters and their evolution with time is crucial for (1) monitoring and early warning of active volcanoes, and (2) to provide better constraints on assumptions included in models of eruptive dynamics, useful for the volcanological community, as well as for ash dispersal prediction models used for risk mitigation. Résumé VOLDORAD, un radar Doppler UHF moyenne puissance, est un système portable basé au sol, développé par l’Observatoire de Physique du Globe de Clermont-Ferrand (France), spécifiquement pour l’étude de l’activité volcanique explosive. La capacité de ces méthodes de télédétection à sonder l’intérieur des jets et des panaches volcaniques dangereux constitue un vrai pas en avant concernant l’analyse des paramètres physiques qui contrôlent la dynamique des éruptions volcaniques. L’objectif principal de cette thèse est d’apporter des contraintes plus précises, notamment à partir du développement de procédures méthodologiques, sur l’interprétation des données radar Doppler, dans le but final d’améliorer notre compréhension de la dynamique explosive. Ce travail a été réalisé à partir de mesures radar Doppler acquises pendant l’éruption du cratère Sud-est de l’Etna en Juillet 2001, et s’intéresse plus particulièrement à l’activité Strombolienne. Cependant, les méthodes de traitement, les modèles directs et les procédures d’inversion développés dans cette étude ont été réalisés dans une optique plus générale, et applicable sur différents types de dynamismes. L’étude détaillée de l’activité Strombolienne par la méthode radar Doppler a permis d’obtenir une large gamme de paramètres sources, notamment : les vitesses et masses de gaz et de particules, ainsi que les caractéristiques géométriques des jets. L’estimation quantitative précise de ces paramètres, et de leur évolution au cours du temps est cruciale pour (1) la surveillance et la détection précoce de l’activité volcanique, ainsi que (2) pour l’apport de contraintes sur les hypothèses formulées dans les modèles de dynamique éruptive et dans les modèles de prédiction de dispersion des cendres, indispensables à la minimisation des risques. Mots-clés : radar Doppler, dynamique éruptive, activité Strombolienne, vitesses de gaz et d’éjecta, flux de masse, Mt. Etna, surveillance, corrélations acoustique et vidéo, modélisation numérique Discipline: Volcanologie UMR 6524 – Laboratoire Magmas et Volcans 5, rue Kessler 63038 Clermont-Ferrand, France