Flow characterization using a laser Doppler vibrometer
17
11/3/2005 1 Managing Uncertainties in Noise Measurements and Prediction, Le Mans, France, 27-29 June 2005 Faculty of Engineering Department of Mechanical Engineering ACOUSTICS & VIBRATION RESEARCH GROUP Pleinlaan 2 • B1050 Brussel • Belgium [email protected] • http://avrg.vub.ac.be Flow Characterization using a Laser Doppler Vibrometer J. Vanherzeele, S. Vanlanduit & P. Guillaume D. Ragni & M. Martarelli Università Politecnica delle Marche c/o Dipartimento di Meccanica Via Brecce Bianche - 60131 Ancona -Italia Flow in a cylinder wake
-
Upload
independent -
Category
Documents
-
view
0 -
download
0
Transcript of Flow characterization using a laser Doppler vibrometer

11/3/2005 1Managing Uncertainties in Noise Measurements and Prediction, Le Mans,
France, 27-29 June 2005
Faculty of EngineeringDepartment of Mechanical Engineering
ACOUSTICS & VIBRATION RESEARCH GROUPPleinlaan 2 • B1050 Brussel • Belgium
[email protected] • http://avrg.vub.ac.be
Flow Characterization using a Laser Doppler Vibrometer
J. Vanherzeele, S. Vanlanduit & P. GuillaumeD. Ragni & M. Martarelli
Università Politecnica delle Marchec/o Dipartimento di Meccanica
Via Brecce Bianche - 60131 Ancona -Italia
Flow in a cylinder wake

Optimess 2005
Acoustics & Vibration Research Group
Vrije Universiteit Brussel
2
Outline
• Introduction• Theoretical principal LDV measurements• Experiment and Simulation Outline
• LDV• PIV• CFD (short)
• Measurement results• Frequency content• Visual content
• Conclusions

Optimess 2005
Acoustics & Vibration Research Group
Vrije Universiteit Brussel
3
Introduction
Visualizing acoustic waves• High intensity: Schlieren, holography, laser-speckle….• Low intensity, high spatial resolution or small measuring volumes ?
Visualizing flow• Intrusive: tracers (PIV, LDA…), pitot, hot wire …
Visualizing stress• Schlieren, shadow moiré, photoelasticity…• Image correlation
All applications measurable with one simple technique: LDV
Visualizing flow

Optimess 2005
Acoustics & Vibration Research Group
Vrije Universiteit Brussel
4
Theoretical principal LDV measurements
• Classical use LDV:Laser light (freq ν) is scattered by moving object (vel v), undergoes frequency shift ∆ν only dependant on optical path laser z
• Full view equationMeasured displacement s depends also on refraction index medium n
λθν cos2v=∆
dtdztyxn
dttyxdnz
dtztyxnd
dttyxdstyxv ),,(),,(]),,([),,(),,( +===

Optimess 2005
Acoustics & Vibration Research Group
Vrije Universiteit Brussel
5
Theoretical principal LDV measurements
• Measuring density fluctuationsKeep target steady; measure only turbulent effects (1st term full view eq)
Measurement volume containing flow
Retroreflective steady object
Laser Doppler Vibrometer

Optimess 2005
Acoustics & Vibration Research Group
Vrije Universiteit Brussel
6
Theoretical principal LDV measurements
• Validation?
• LDV measurement = interferometric technique
⇒signal is line integral across optical path
⇒tomography necessary in case of 3D flows
• Provides only visual information and frequency content
• Visual comparison with average flow calculated from PIV & CFD
• Frequency content comparison with PIV, CFD & St-number

Optimess 2005
Acoustics & Vibration Research Group
Vrije Universiteit Brussel
7
Experiment and Simulation Outline
Experimental set-up LDV•2 cylinders: ∅ 0.014 m & ∅ 0.062 m
•Glass wind tunnel (cross section 30 x 30 cm)
•3 velocities (11.2 m/s, 21.2 m/s and 31 m/s)
•Bandwidth 2kHz; freq resolution 5 Hz)

Optimess 2005
Acoustics & Vibration Research Group
Vrije Universiteit Brussel
8
Experiment and Simulation Outline
Particle Image Velocimetry (Basics)
Light sheet opticsmirror
Light sheet
Illuminatedparticles
Flow direction
Flow with Tracer particles1st light pulse
2nd light pulse
Image plane
camera

Optimess 2005
Acoustics & Vibration Research Group
Vrije Universiteit Brussel
9
Experiment and Simulation Outline
Particle Image Velocimetry (Basics)
X1
X2
X3 X1’
X2’
X3’
(a) (b)
X1
X2
X3X1’
X2’
X1’=X1
X2’=X2(c) (d)
framen-1
Camera
Light source
framen
framen+1
framen+2
∆t∆tShutterclosed
Cross Correlation
Timing diagram
∆t
δ

Optimess 2005
Acoustics & Vibration Research Group
Vrije Universiteit Brussel
10
Experiment and Simulation Outline
Experimental set-up Particle Image Velocimetry (PIV)•Nd: YLF pulse laser; pulse energy 2 x 10 mJ at 1kHz
•1024 x 1024 pixel camera; 1500 Hz frame rate
•∆t laser: 20 µs
•Particle size: 4 µm - 5 µm (smoke)
•Velocity: 11.2 m/s
•Cylinder ∅ 0.014 m

Optimess 2005
Acoustics & Vibration Research Group
Vrije Universiteit Brussel
11
Experiment and Simulation Outline
Processing Images Particle Image Velocimetry (PIV)
• Initial interrogation window (2000 image pairs): 32 x 32 pixels; 50% overlap (resolving vorticity); triple pass
• Frequency content extraction:
• Store velocity data vt in 3D- matrix vtime
• Fourier transform this matrix along the t-axis: vFour
• Rescale the frequency vector
),(),,( YXvtYXv ttime =
),(),,( tvFFTfYXv timeFour =
20001500
vecvec ff =
Optimess 2005
Acoustics & Vibration Research Group
Vrije Universiteit Brussel
12
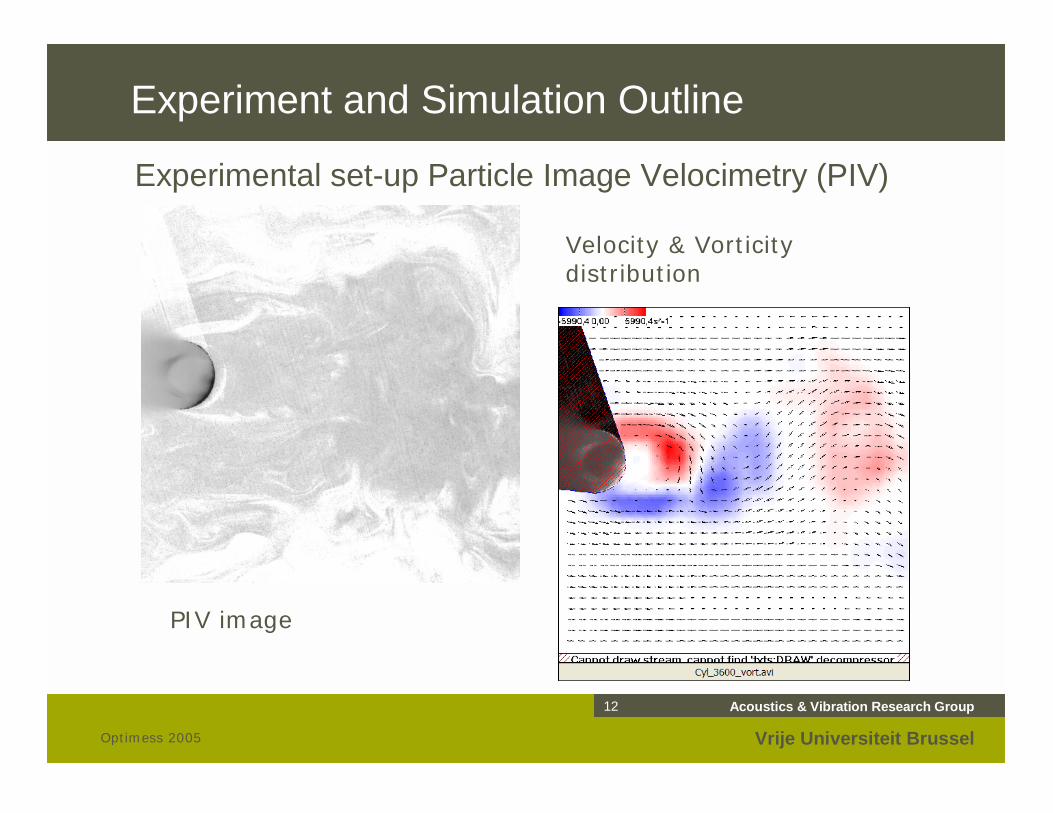
Experiment and Simulation Outline
Experimental set-up Particle Image Velocimetry (PIV)
PIV image
Velocity & Vorticitydistribution

Optimess 2005
Acoustics & Vibration Research Group
Vrije Universiteit Brussel
13
Experiment and Simulation Outline
Computational Fluid Dynamics (CFD) settings• Numeca software; Euranus flow solver• Grid: O-type consisting of 1 block; 128 cells in circumferential & radial
direction; stretched mesh towards wall (viscous sub-layer + wake)

Optimess 2005
Acoustics & Vibration Research Group
Vrije Universiteit Brussel
14
Experiment and Simulation Outline
Computational Fluid Dynamics (CFD) settings– Model: unsteady turbulent RANS calculation; turbulence modeled by
Baldwin-Lomax (∅ 0.062 m ∀ v & ∅ 0.014 m at 31 m/s); turbulence modeled by Spalart-Allmaras (∅ 0.014 m at 11.2 m/s & 21.2 m/s)
– 2nd order dual time stepping with 4-stage Runge-Kutta; multigrid on inner stages; physical time step: 0.0001 s
– Frequency content extraction: 2 possibilities– Store velocity data in 3D matrix and perform Fourier transform
– Fourier transforming the lift coefficient (at least 10 vortex sheddings)

Optimess 2005
Acoustics & Vibration Research Group
Vrije Universiteit Brussel
15
Measurement Results
Frequency content
v (m/s) freq LDV (Hz) freq St (Hz) freq CFD (Hz) freq PIV (Hz)11.2 190 175 188 19421,2 360 325 354 /31 510 476 540 /
cylinder: 14 mm
v (m/s) freq LDV (Hz) freq St (Hz) freq CFD (Hz)11.2 42 39 4321,2 80 74 8031 115 108 112
cylinder: 62 mm
error cylinder: 14 mm (%) error cylinder: 62 mm (%)LDV-PIV 2,1 /LDV-CFD 3 1,6LDV-St 7,3 6,8

Optimess 2005
Acoustics & Vibration Research Group
Vrije Universiteit Brussel
16
Measurement Results
Visual content: ∅ 0.014 m at 11.2 m/s LDV
PIV CFD

Optimess 2005
Acoustics & Vibration Research Group
Vrije Universiteit Brussel
17
Conclusions
• A Laser Doppler Vibrometer was used to characterize a cylinder wake (different cylinders+different velocities)
• The technique was validated by means of PIV-experiments and CFD-simulations
• LDV measurements proved able to extract frequency content quite well and provide a visual representation of the flow
• Advantages:• No tracer particles necessary• Full field view of flow, completely automated, almost no set-up• Ability to measure large bandwidth (1 Hz-several MHz)• Measurement time ≈ PIV, but far faster than CFD