B-Flow Sonography vs. Color Doppler ... - Thieme Connect
12
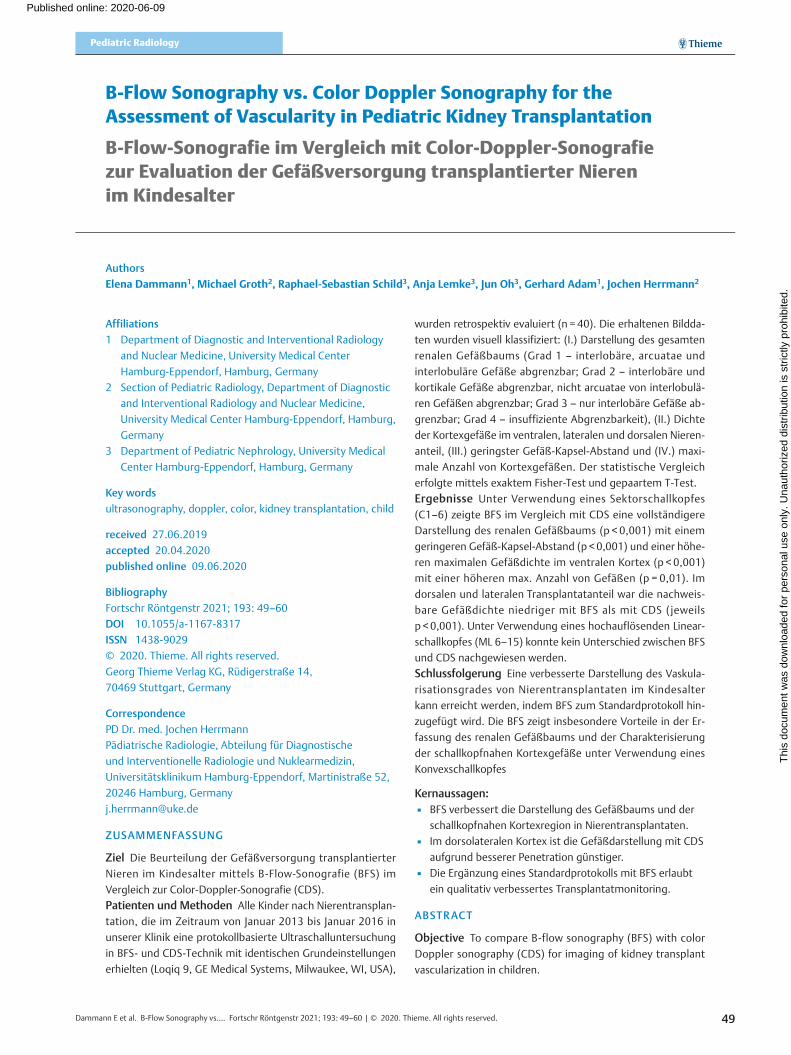
B-Flow Sonography vs. Color Doppler Sonography for the Assessment of Vascularity in Pediatric Kidney Transplantation B-Flow-Sonografie im Vergleich mit Color-Doppler-Sonografie zur Evaluation der Gefäßversorgung transplantierter Nieren im Kindesalter Authors Elena Dammann 1 , Michael Groth 2 , Raphael-Sebastian Schild 3 , Anja Lemke 3 , Jun Oh 3 , Gerhard Adam 1 , Jochen Herrmann 2 Affiliations 1 Department of Diagnostic and Interventional Radiology and Nuclear Medicine, University Medical Center Hamburg-Eppendorf, Hamburg, Germany 2 Section of Pediatric Radiology, Department of Diagnostic and Interventional Radiology and Nuclear Medicine, University Medical Center Hamburg-Eppendorf, Hamburg, Germany 3 Department of Pediatric Nephrology, University Medical Center Hamburg-Eppendorf, Hamburg, Germany Key words ultrasonography, doppler, color, kidney transplantation, child received 27.06.2019 accepted 20.04.2020 published online 09.06.2020 Bibliography Fortschr Röntgenstr 2021; 193: 49–60 DOI 10.1055/a-1167-8317 ISSN 1438-9029 © 2020. Thieme. All rights reserved. Georg Thieme Verlag KG, Rüdigerstraße 14, 70469 Stuttgart, Germany Correspondence PD Dr. med. Jochen Herrmann Pädiatrische Radiologie, Abteilung für Diagnostische und Interventionelle Radiologie und Nuklearmedizin, Universitätsklinikum Hamburg-Eppendorf, Martinistraße 52, 20246 Hamburg, Germany [email protected] ZUSAMMENFASSUNG Ziel Die Beurteilung der Gefäßversorgung transplantierter Nieren im Kindesalter mittels B-Flow-Sonografie (BFS) im Vergleich zur Color-Doppler-Sonografie (CDS). Patienten und Methoden Alle Kinder nach Nierentransplan- tation, die im Zeitraum von Januar 2013 bis Januar 2016 in unserer Klinik eine protokollbasierte Ultraschalluntersuchung in BFS- und CDS-Technik mit identischen Grundeinstellungen erhielten (Loqiq 9, GE Medical Systems, Milwaukee, WI, USA), wurden retrospektiv evaluiert (n = 40). Die erhaltenen Bildda- ten wurden visuell klassifiziert: (I.) Darstellung des gesamten renalen Gefäßbaums (Grad 1 – interlobäre, arcuatae und interlobuläre Gefäße abgrenzbar; Grad 2 – interlobäre und kortikale Gefäße abgrenzbar, nicht arcuatae von interlobulä- ren Gefäßen abgrenzbar; Grad 3 – nur interlobäre Gefäße ab- grenzbar; Grad 4 – insuffiziente Abgrenzbarkeit), (II.) Dichte der Kortexgefäße im ventralen, lateralen und dorsalen Nieren- anteil, (III.) geringster Gefäß-Kapsel-Abstand und (IV.) maxi- male Anzahl von Kortexgefäßen. Der statistische Vergleich erfolgte mittels exaktem Fisher-Test und gepaartem T-Test. Ergebnisse Unter Verwendung eines Sektorschallkopfes (C1–6) zeigte BFS im Vergleich mit CDS eine vollständigere Darstellung des renalen Gefäßbaums (p < 0,001) mit einem geringeren Gefäß-Kapsel-Abstand (p < 0,001) und einer höhe- ren maximalen Gefäßdichte im ventralen Kortex (p < 0,001) mit einer höheren max. Anzahl von Gefäßen (p = 0,01). Im dorsalen und lateralen Transplantatanteil war die nachweis- bare Gefäßdichte niedriger mit BFS als mit CDS (jeweils p < 0,001). Unter Verwendung eines hochauflösenden Linear- schallkopfes (ML 6–15) konnte kein Unterschied zwischen BFS und CDS nachgewiesen werden. Schlussfolgerung Eine verbesserte Darstellung des Vaskula- risationsgrades von Nierentransplantaten im Kindesalter kann erreicht werden, indem BFS zum Standardprotokoll hin- zugefügt wird. Die BFS zeigt insbesondere Vorteile in der Er- fassung des renalen Gefäßbaums und der Charakterisierung der schallkopfnahen Kortexgefäße unter Verwendung eines Konvexschallkopfes Kernaussagen: ▪ BFS verbessert die Darstellung des Gefäßbaums und der schallkopfnahen Kortexregion in Nierentransplantaten. ▪ Im dorsolateralen Kortex ist die Gefäßdarstellung mit CDS aufgrund besserer Penetration günstiger. ▪ Die Ergänzung eines Standardprotokolls mit BFS erlaubt ein qualitativ verbessertes Transplantatmonitoring. ABSTRACT Objective To compare B-flow sonography (BFS) with color Doppler sonography (CDS) for imaging of kidney transplant vascularization in children. Pediatric Radiology 49 Dammann E et al. B-Flow Sonography vs.… Fortschr Röntgenstr 2021; 193: 49–60 | © 2020. Thieme. All rights reserved. This document was downloaded for personal use only. Unauthorized distribution is strictly prohibited. Published online: 2020-06-09
-
Upload
khangminh22 -
Category
Documents
-
view
0 -
download
0
Transcript of B-Flow Sonography vs. Color Doppler ... - Thieme Connect
B-Flow Sonography vs. Color Doppler Sonography for theAssessment of Vascularity in Pediatric Kidney Transplantation
B-Flow-Sonografie im Vergleich mit Color-Doppler-Sonografiezur Evaluation der Gefäßversorgung transplantierter Nierenim Kindesalter
Authors
Elena Dammann1, Michael Groth2, Raphael-Sebastian Schild3, Anja Lemke3, Jun Oh3, Gerhard Adam1, Jochen Herrmann2
Affiliations
1 Department of Diagnostic and Interventional Radiology
and Nuclear Medicine, University Medical Center
Hamburg-Eppendorf, Hamburg, Germany
2 Section of Pediatric Radiology, Department of Diagnostic
and Interventional Radiology and Nuclear Medicine,
University Medical Center Hamburg-Eppendorf, Hamburg,
Germany
3 Department of Pediatric Nephrology, University Medical
Center Hamburg-Eppendorf, Hamburg, Germany
Key words
ultrasonography, doppler, color, kidney transplantation, child
received 27.06.2019
accepted 20.04.2020
published online 09.06.2020
Bibliography
Fortschr Röntgenstr 2021; 193: 49–60
DOI 10.1055/a-1167-8317
ISSN 1438-9029
© 2020. Thieme. All rights reserved.
Georg Thieme Verlag KG, Rüdigerstraße 14,
70469 Stuttgart, Germany
Correspondence
PD Dr. med. Jochen Herrmann
Pädiatrische Radiologie, Abteilung für Diagnostische
und Interventionelle Radiologie und Nuklearmedizin,
Universitätsklinikum Hamburg-Eppendorf, Martinistraße 52,
20246 Hamburg, Germany
ZUSAMMENFASSUNG
Ziel Die Beurteilung der Gefäßversorgung transplantierter
Nieren im Kindesalter mittels B-Flow-Sonografie (BFS) im
Vergleich zur Color-Doppler-Sonografie (CDS).
Patienten und Methoden Alle Kinder nach Nierentransplan-
tation, die im Zeitraum von Januar 2013 bis Januar 2016 in
unserer Klinik eine protokollbasierte Ultraschalluntersuchung
in BFS- und CDS-Technik mit identischen Grundeinstellungen
erhielten (Loqiq 9, GE Medical Systems, Milwaukee, WI, USA),
wurden retrospektiv evaluiert (n = 40). Die erhaltenen Bildda-
ten wurden visuell klassifiziert: (I.) Darstellung des gesamten
renalen Gefäßbaums (Grad 1 – interlobäre, arcuatae und
interlobuläre Gefäße abgrenzbar; Grad 2 – interlobäre und
kortikale Gefäße abgrenzbar, nicht arcuatae von interlobulä-
ren Gefäßen abgrenzbar; Grad 3 – nur interlobäre Gefäße ab-
grenzbar; Grad 4 – insuffiziente Abgrenzbarkeit), (II.) Dichte
der Kortexgefäße im ventralen, lateralen und dorsalen Nieren-
anteil, (III.) geringster Gefäß-Kapsel-Abstand und (IV.) maxi-
male Anzahl von Kortexgefäßen. Der statistische Vergleich
erfolgte mittels exaktem Fisher-Test und gepaartem T-Test.
Ergebnisse Unter Verwendung eines Sektorschallkopfes
(C1–6) zeigte BFS im Vergleich mit CDS eine vollständigere
Darstellung des renalen Gefäßbaums (p < 0,001) mit einem
geringeren Gefäß-Kapsel-Abstand (p < 0,001) und einer höhe-
ren maximalen Gefäßdichte im ventralen Kortex (p < 0,001)
mit einer höheren max. Anzahl von Gefäßen (p = 0,01). Im
dorsalen und lateralen Transplantatanteil war die nachweis-
bare Gefäßdichte niedriger mit BFS als mit CDS (jeweils
p < 0,001). Unter Verwendung eines hochauflösenden Linear-
schallkopfes (ML 6–15) konnte kein Unterschied zwischen BFS
und CDS nachgewiesen werden.
Schlussfolgerung Eine verbesserte Darstellung des Vaskula-
risationsgrades von Nierentransplantaten im Kindesalter
kann erreicht werden, indem BFS zum Standardprotokoll hin-
zugefügt wird. Die BFS zeigt insbesondere Vorteile in der Er-
fassung des renalen Gefäßbaums und der Charakterisierung
der schallkopfnahen Kortexgefäße unter Verwendung eines
Konvexschallkopfes
Kernaussagen:▪ BFS verbessert die Darstellung des Gefäßbaums und der
schallkopfnahen Kortexregion in Nierentransplantaten.
▪ Im dorsolateralen Kortex ist die Gefäßdarstellung mit CDS
aufgrund besserer Penetration günstiger.
▪ Die Ergänzung eines Standardprotokolls mit BFS erlaubt
ein qualitativ verbessertes Transplantatmonitoring.
ABSTRACT
Objective To compare B-flow sonography (BFS) with color
Doppler sonography (CDS) for imaging of kidney transplant
vascularization in children.
Pediatric Radiology
49Dammann E et al. B-Flow Sonography vs.… Fortschr Röntgenstr 2021; 193: 49–60 | © 2020. Thieme. All rights reserved.
Thi
s do
cum
ent w
as d
ownl
oade
d fo
r pe
rson
al u
se o
nly.
Una
utho
rized
dis
trib
utio
n is
str
ictly
pro
hibi
ted.
Published online: 2020-06-09

Patients and Methods All children receiving a kidney trans-
plantation who underwent a protocol-based ultrasound
examination (Loqiq 9, GE Medical Systems, Milwaukee, WI,
USA) using the BFS and CDS technique with equal settings
and probe position between January 2013 and January 2016
were retrospectively assessed (n = 40). The obtained datasets
were visually graded according to the following criteria:
(I) delineation of the renal vascular tree (Grade 1 – clear
demarcation of interlobar, together with arcuate and inter-
lobular vessels; Grade 2 – clear demarcation of interlobar
and cortical vessels, but no distinction of interlobular from
arcuate vessels; Grade 3 – only clear demarcation of interlo-
bar vessels, Grade 4 – insufficient demarcation) (II) delinea-
tion of cortical vessel density in ventral, lateral, and dorsal
part of the transplant, (III) smallest vessel-capsule distance,
and (IV) maximum cortical vessel count. Comparison between
methods was performed using Fisher’s exact and paired sam-
ple t-tests.
Results Applying a curved transducer (C1–6), BFS showed
superior delineation of the renal vascular tree (p < 0.001), a
lower vessel-capsule distance (p < 0.001), a higher cortical
vessel count (p < 0.001), and a higher cortical vessel density
in the superficial cortex (p = 0.01) than CDS. In the dorsal and
lateral aspects of the transplant, cortical vessel density was
lower with BFS (both p < 0.001). Using a linear high-resolution
transducer (ML 6–15), no significant differences between the
methods were found.
Conclusion Improved imaging of kidney transplant vascular-
ization can be achieved in children by adding BFS to a stand-
ard protocol. The BFS technique is especially beneficial for
overall assessment of the renal vascular tree together with
the extent of cortical vascularization on curved array images.
Key points:▪ Depiction of vascular tree and ventral cortical vessels is
improved by BFS.
▪ The dorso-lateral cortex was better represented with CDS
because of higher penetration.
▪ Additional monitoring with BFS improves the monitoring
of transplant viability.
Citation Format▪ Dammann E, Groth M, Schild R et al. B-Flow Sonography
vs. Color Doppler Sonography for the Assessment of
Vascularity in Pediatric Kidney Transplantation. Fortschr
Röntgenstr 2021; 193: 49–60
Introduction
Ultrasound is the method of choice for noninvasive monitoring ofkidney transplants at the bedside [1, 2]. Standard protocols assessparenchymal integrity based on B-mode and flow imaging tech-niques. For vascularity assessment color Doppler sonography(CDS) including duplex ultrasound is generally the modality ofchoice. In adults, contrast-enhanced ultrasound (CEUS) hasbecome increasingly relevant for a more specific diagnosis of allo-graft dysfunction [3]. Changes in renal vascularization and flowhave been described in rejection, infection, urinary retention,and drug toxicity [4, 5].
Imaging of renal transplant vascularization with CDS is widelyused because of the good signal-to-noise ratio and good penetra-tion into deeper structures. However, known limitations of themethod are the relatively low spatial and temporal resolution,aliasing effects with high-amplitude flow, angle dependency, andblurring artifacts [1, 4, 6–9]. Among alternatives, B-flow sonogra-phy (BFS) is a relatively new non-Doppler-based technique for thedirect visualization of blood flow and was introduced in 2000 [10].So far, BFS is available on the ultrasound platform of one manu-facturer. The technique is based on the subtraction of receivedamplitudes of grayscale ultrasound resulting in angiography-likeoverlap free flow images with very high spatial and temporal reso-lution [11].
BFS was initially introduced for linear transducers and is nowapplicable for lower frequency convex probes, also allowing theevaluation of deeper structures such as abdominal organs. Side-by-side comparison with CDS showed that BFS is especially usefulin areas with simultaneous low and high blood flow and for the
detection of small vessels [12]. Preliminary studies have beenpublished in adult patients with carotid artery stenosis or ovariantorsion, and regarding the evaluation of vascularization in trans-planted livers and kidneys [13–16]. Pediatric studies using BFSwere reported for fetal congenital cardiopathies, femoral arterystenosis before catheterization in infants and anatomy of basalcerebral arteries in newborns [17–19]. The aim of this study wasto compare BFS with CDS for the assessment of kidney transplantvascularization in children.
Patients and Methods
Patients
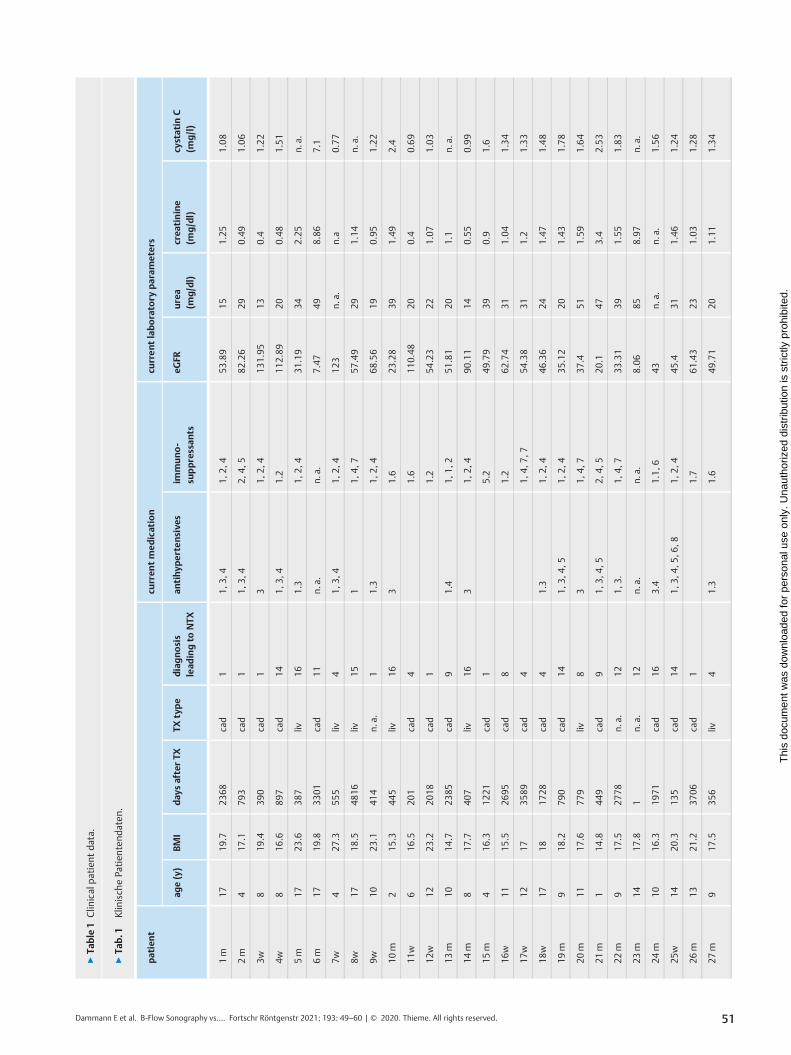
The study was approved by the institutional review board with awaiver of informed consent. All pediatric patients with kidneytransplantation and who received a protocol ultrasound examina-tion as part of their routine follow-up at our institution by thesame single sonographer with corresponding CDS and BFS imagesbetween January 2013 and January 2016 were retrospectivelyassessed. If multiple examinations were available during this pe-riod, the most recent one was chosen. Of 47 consecutive casesperformed during this period, 7 cases had to be excluded becauseof incomplete documentation or artifacts attributable to non-compliance. In total, 40 patients were included in this study(mean age 11 ± 4 years, range 1–18 years; 24 male, 16 female).The mean interval between kidney transplantation and the ultra-sound examination was 1664 ± 1420 days (range 1–4820 days).Clinical data and laboratory findings of the patients were extrac-ted from the patient record and are summarized in ▶ Table 1.
50 Dammann E et al. B-Flow Sonography vs.… Fortschr Röntgenstr 2021; 193: 49–60 | © 2020. Thieme. All rights reserved.
Pediatric Radiology
Thi
s do
cum
ent w
as d
ownl
oade
d fo
r pe
rson
al u
se o
nly.
Una
utho
rized
dis
trib
utio
n is
str
ictly
pro
hibi
ted.
▶Ta
ble1
Clin
icalpa
tien
tda
ta.
▶Ta
b.1
Klinisch
ePa
tien
tend
aten
.
patient
curren
tmed
ication
curren
tlaboratory
param
eters
age(y)
BMI
day
safterTX
TXtype
diagnosis
lead
ingto
NTX
antihyp
ertensive
sim
muno-
suppressan
tseG
FRurea
(mg/dl)
crea
tinine
(mg/dl)
cystatin
C(m
g/l)
1m
1719
.723
68cad
11,
3,4
1,2,
453
.89
151.25
1.08
2m
417
.179
3cad
11,
3,4
2,4,
582
.26
290.49
1.06
3w8
19.4
390
cad
13
1,2,
413
1.95
130.4
1.22
4w8
16.6
897
cad
141,
3,4
1.2
112.89
200.48
1.51
5m
1723
.638
7liv
161.3
1,2,
431
.19
342.25
n.a.
6m
1719
.833
01cad
11n.
a.n.
a.7.47
498.86
7.1
7w4
27.3
555
liv4
1,3,
41,
2,4
123
n.a.
n.a
0.77
8w17
18.5
4816
liv15
11,
4,7
57.49
291.14
n.a.
9w10
23.1
414
n.a.
11.3
1,2,
468
.56
190.95
1.22
10m
215
.344
5liv
163
1.6
23.28
391.49
2.4
11w
616
.520
1cad
41.6
110.48
200.4
0.69
12w
1223
.220
18cad
11.2
54.23
221.07
1.03
13m
1014
.723
85cad
91.4
1,1,
251
.81
201.1
n.a.
14m
817
.740
7liv
163
1,2,
490
.11
140.55
0.99
15m
416
.312
21cad
15.2
49.79
390.9
1.6
16w
1115
.526
95cad
81.2
62.74
311.04
1.34
17w
1217
3589
cad
41,
4,7,
754
.38
311.2
1.33
18w
1718
1728
cad
41.3
1,2,
446
.36
241.47
1.48
19m
918
.279
0cad
141,
3,4,
51,
2,4
35.12
201.43
1.78
20m
1117
.677
9liv
83
1,4,
737
.451
1.59
1.64
21m
114
.844
9cad
91,
3,4,
52,
4,5
20.1
473.4
2.53
22m
917
.527
78n.
a.12
1,3.
1,4,
733
.31
391.55
1.83
23m
1417
.81
n.a.
12n.
a.n.
a.8.06
858.97
n.a.
24m
1016
.319
71cad
163.4
1.1,6
43n.
a.n.
a.1.56
25w
1420
.313
5cad
141,
3,4,
5,6,
81,
2,4
45.4
311.46
1.24
26m
1321
.237
06cad
11.7
61.43
231.03
1.28
27m
917
.535
6liv
41.3
1.6
49.71
201.11
1.34
51Dammann E et al. B-Flow Sonography vs.… Fortschr Röntgenstr 2021; 193: 49–60 | © 2020. Thieme. All rights reserved.
Thi
s do
cum
ent w
as d
ownl
oade
d fo
r pe
rson
al u
se o
nly.
Una
utho
rized
dis
trib
utio
n is
str
ictly
pro
hibi
ted.

▶Ta
ble1
(Con
tinu
ation)
patient
curren
tmed
ication
curren
tlaboratory
param
eters
age(y)
BMI
day
safterTX
TXtype
diagnosis
lead
ingto
NTX
antihyp
ertensive
sim
muno-
suppressan
tseG
FRurea
(mg/dl)
crea
tinine
(mg/dl)
cystatin
C(m
g/l)
28m
1015
.490
cad
10
2,4,
510
7.38
150.5
n.a.
29w
1627
.120
79liv
11.3
1.7
99.12
100.67
0.73
30m
1520
.620
14cad
11.6
50.98
241.4
1.42
31w
1219
.327
07cad
73.4
2.5
59.53
211.11
1.29
32w
1620
.223
72liv
11
1.3
74.25
160.9
0.73
33m
1820
.748
20cad
42.5
38.9
n.a.
n.a.
n.a.
34m
1517
.342
93cad
95,
6,7
3,4,
619
.84
553.33
2.9
35m
117
.114
cad
12n.
a.n.
a.6.23
854.97
n.a.
36w
1723
.732
34cad
44
1.2
61.71
171.02
n.a.
37m
714
.722
04liv
75.7
32.24
281.5
1.4
38w
1520
.427
09cad
41,
3,4
117
.09
433.48
n.a.
39m
1515
.745
4cad
162,
3,4
1,3,
447
.52
201.46
0.92
40m
714
10n.
a.n.
a.n.
a.n.
a.n.
a.n.
a.n.
a.n.a.
y=years,BM
I=bo
dymassinde
x,TX
=tran
splantation,
NTX
=kidn
eytran
splantation,
cad=cada
veric,
liv=living,
diag
nosislead
ingto
NTX
:1=po
lycystickidn
eydisease;
2=glom
erulon
ephritis;3
=hy
drone
phrosis;
4=kidn
eydy
splasia;
5=pe
rina
talasphy
xia;
6=reflux
neph
ropa
thy;
7=Den
ys-D
rash
synd
rome;
8=he
molytic-uremicsynd
rome;
9=CAKUT(con
genitalano
maliesof
thekidn
eyan
durinarytract);1
0=ob
structive
urop
athy
;11=prun
ebe
llysynd
rome;
12=ox
alosis;1
3=cystinosis;1
4=ne
phroticsynd
rome;
15=uro-ano
genitalm
alform
ation;
16=po
steriorurethral
valve,
antihy
pertensives:1
=Delix(ram
ipril+
hydroc
hloro-
thiazide);2
=En
alap
ril;3=Amlodipine;
4=Be
loc-Zo
k(m
etop
rololsuc
cina
te+hy
droch
lorothiazide);5
=Dihyd
ralazine
,immun
osup
pressants:1=tacrolim
us;2
=mycop
heno
late
mofetil;
3=mycop
heno
late;4
=pre-
dnisolon
e,eG
FR=estimated
glom
erular
filtrationrate
calculated
asin
KDIGO20
12Clin
icalPractice
Guide
linefortheEvalua
tion
andMan
agem
entof
Chron
icKidn
eyDisease,n
.a.=
notavailable.
Age(y)=
Alter
(inJahren
);BM
I=Bo
dy-M
ass-Inde
x;TX
=Tran
splantation;
NTX
=Nierentransplan
tation
;DaysafterNTX
=Ta
gena
chNTX
;TX-typ
e=TX
-Art;c
ad=po
stmortem;liv=lebe
nd;D
iagn
ose,
diezu
eine
rNTX
geführtha
t:1=po
lyzystisch
eNierene
rkrank
ung;2
=Glomerulon
ephritis;3
Hyd
rone
phrose;4
=Nierend
ysplasie;5
=pe
rina
tale
Asphy
xie;
6=Re
fluxn
ephrop
athie;
7=Den
ys-D
rash-Syn
drom
;8=hä
molytisch
-urämis-
ches
Synd
rom;9
=CAKUT(Con
gen
italan
omaliesof
thekidn
eyan
durinarytract);1
0=ob
struktiveUropathie;
11=Prun
e-Be
lly-Syn
drom
;12=Oxalose;1
3=Zy
stinose;
14=ne
phrotische
sSynd
rom;1
5=uro-an
ogen
-italeFehlbildun
g;1
6=po
steriorurethralvalve;
curren
tmed
ication=Med
ikationzum
Untersuch
ung
szeitpun
kt;A
ntihyp
ertensiva:
1=Delix(Ram
ipril+
Hyd
roch
lorothiazid);2=En
alap
ril;3=Amlodipin;4
=Be
loc-Zo
k(M
etop
rololsuc
cina
t+Hyd
roch
lorothiazid);5
=Dihyd
ralazin;
Immun
suppressiva:1
=Ta
crolim
us;2
=Mycop
heno
lat-Mofetil;
3=Mycop
heno
lat;4=Pred
nisolon;
curren
tlabo
ratory
parameters=
Labo
rparam
eter
zum
Zeitpun
ktde
rUntersuch
ung;e
GFR
=ge
schä
tzte
glom
eruläreFiltration
srate,
berech
netge
mäß
KDIGO20
12Clin
icalPractice
Guide
linefortheEvalua
tion
andMan
agem
entof
Chron
icKidn
eyDisease;n
.a.=
nich
tverfüg
bar.
52 Dammann E et al. B-Flow Sonography vs.… Fortschr Röntgenstr 2021; 193: 49–60 | © 2020. Thieme. All rights reserved.
Pediatric Radiology
Thi
s do
cum
ent w
as d
ownl
oade
d fo
r pe
rson
al u
se o
nly.
Una
utho
rized
dis
trib
utio
n is
str
ictly
pro
hibi
ted.
Ultrasound monitoring
Image optimization including the CDS, power Doppler and BFStechniques was performed in a preliminary series of patients not in-cluded in this study. Power Doppler showed equivalent sensitivityregarding vessel delineation but more movement artifacts thanCDS. To reduce examination time, power Doppler was consequent-ly excluded from the final ultrasound protocol for pediatric patientswith kidney transplantation. All examinations were performed by asingle pediatric radiologist with 12 years of renal transplant ultra-sound experience, using a commercial scanner (Logiq E9, GE Medi-cal Systems, Milwaukee, WI, USA) with a curved transducer (C1–6)and a linear, high-resolution transducer (ML6–15). The standardtechnical settings for the C1–6 transducer were – frame rate (FR)5, pulse repetition frequency (PRF) 1.4, mechanical index (MI) 1.2,thermal index in soft tissue (TIs) 1.0 for CDS and – FR 16, pulserepetition interval (PRI) 12, MI 1.2, TIs 1.1 for BFS. A high detectionspeckle reduction imaging (SRI HD) strength of 2 (ranging from 0–4) was used. The setting for the CrossXBeam technique was low,the CrossXBeam-type mean. The standard settings for the ML6–15transducer were – FR 11, PRF 1.5, MI 0.6, TIs 0.5 for CDS and –FR 18, PRI 10, MI 0.4, TIs 0.7 for BFS. A high detection speckle re-duction imaging (SRI HD) strength of 1 was used. The setting forthe CrossXBeam technique was low, the CrossXBeam-type mean.
B-mode evaluation of the kidney in the longitudinal plane witha curved array was followed by documentation of vascularization:(1.) CDS images during systole with adapting of the color Dopplersensitivities from 15 to 5 cm/s; (2.) Identical BFS image during sys-tole without altering the probe position or device setting; (3) Flowanalysis of the interlobar and interlobular arteries in the lower,middle, and upper part of the transplant. The renal artery andvein were evaluated in the transverse plane. Thereafter, lineartransducer images were obtained from the ventral part of the kid-ney (most proximal to the transducer) and assessed if available.8 linear transducer sets were not completely obtainable or insuffi-cient for analysis due to non-compliance. ln total, 40 curved trans-ducer and 32 linear transducer datasets were analyzed.
Image analysis
The obtained datasets were analyzed in randomized order in con-sensus reading by two radiologists (J. H., 12 years of renal trans-plant ultrasound experience; E. D. 1 year of renal transplant ultra-sound experience). Transplant vascularization was evaluated infour categories:1. Delineation of the entire renal vascular tree (Grade 1 – clear
demarcation of interlobar, together with arcuate and interlob-ular vessels; Grade 2 – clear demarcation of interlobar andcortical vessels, but no distinction of interlobular from arcuatevessels; Grade 3 – only clear demarcation of interlobar vessels,Grade 4 – insufficient demarcation; see ▶ Fig. 1);
2. Vessel density within the external cortex (interlobular vessels)in the ventral, dorsal, and lateral aspect of the kidney (Grade 1– high density with close vessel alignment; Grade 2 – reducedvessel density with presence of small avascular gaps; Grade 3 –low vessel density with dominant large avascular gaps or ab-sence of vessels; see ▶ Fig. 2) [20, 21].
3. Vessel-capsule distance (in cm); distance from the nearestvisible cortical vessel to the renal capsule. Measurement fromcutis to renal capsule (a) on CDS image with max. velocityrange of 5 cm/s and from cutis to nearest vessel pixel on CDS(b) and on corresponding BFS image (b); vessel-capsule dis-tance equals ((b)–(a)) [22, 23].
4. Cortical vessel count; number of distinguishable interlobularvessels in a length of 1 cm on corresponding CDS and BFSimages (see ▶ Fig. 3). For standardization, measurement wasperformed perpendicular to the point where the vessel-cap-sule distance was assessed.
5. Linear transducer images were evaluated for categories 1–3,excluding the dorsal and lateral renal cortex as not depicted onthe image.
Statistical Analysis
The corresponding datasets for CDS and BFS were comparedusing Fisher’s exact tests for categorical variables (categories 1and 2) and paired sample t-tests for numeric variables (categories3 and 4). Normal distribution was tested for the numeric variables.If not stated otherwise, categorical variables are provided as num-bers and percentages, continuous variables as mean ± standarddeviation (SD). The effect of body mass index (BMI) and patientage (years) on the imaging results was calculated by ordinal re-gression (categories 1 and 2) and by a general linear model (cate-gories 3 and 4). A P-value < 0.05 was considered statistically signif-icant. All statistical analyses were computed with MedCalc forWindows (Mariakerke, Belgium), Excel (Microsoft Corporation,Redmond WA, USA), and SPSS (Version24, IBM, Armonk, USA).
RESULTS
Curved transducer
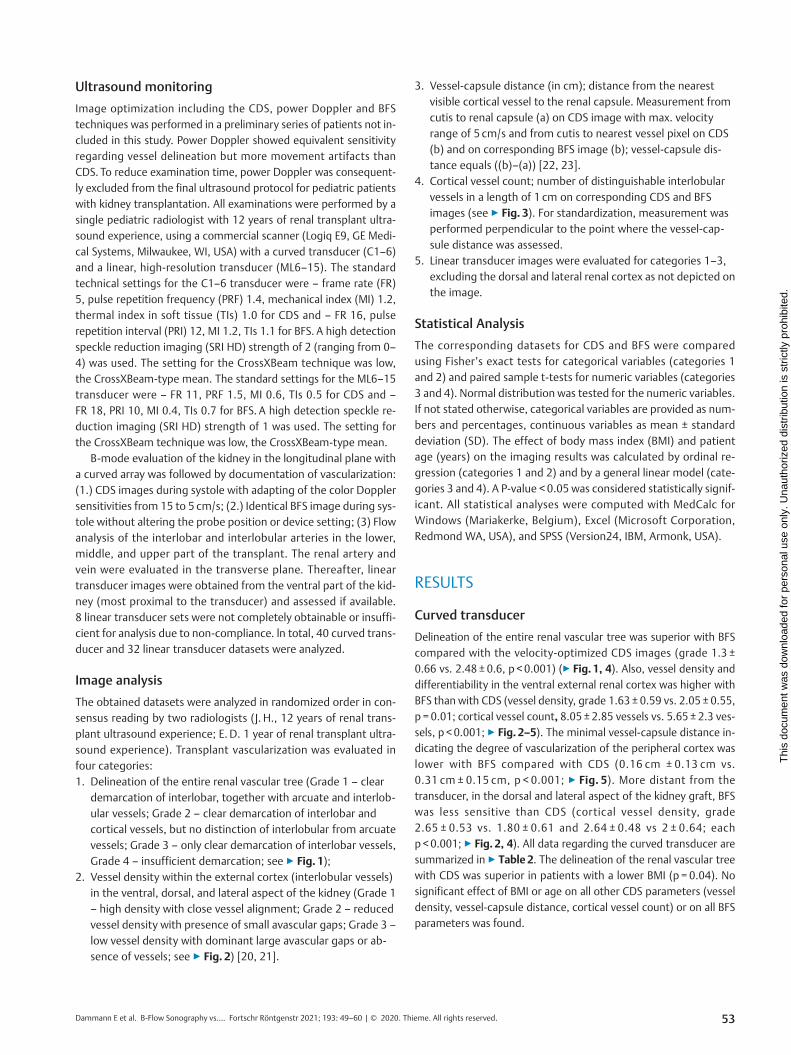
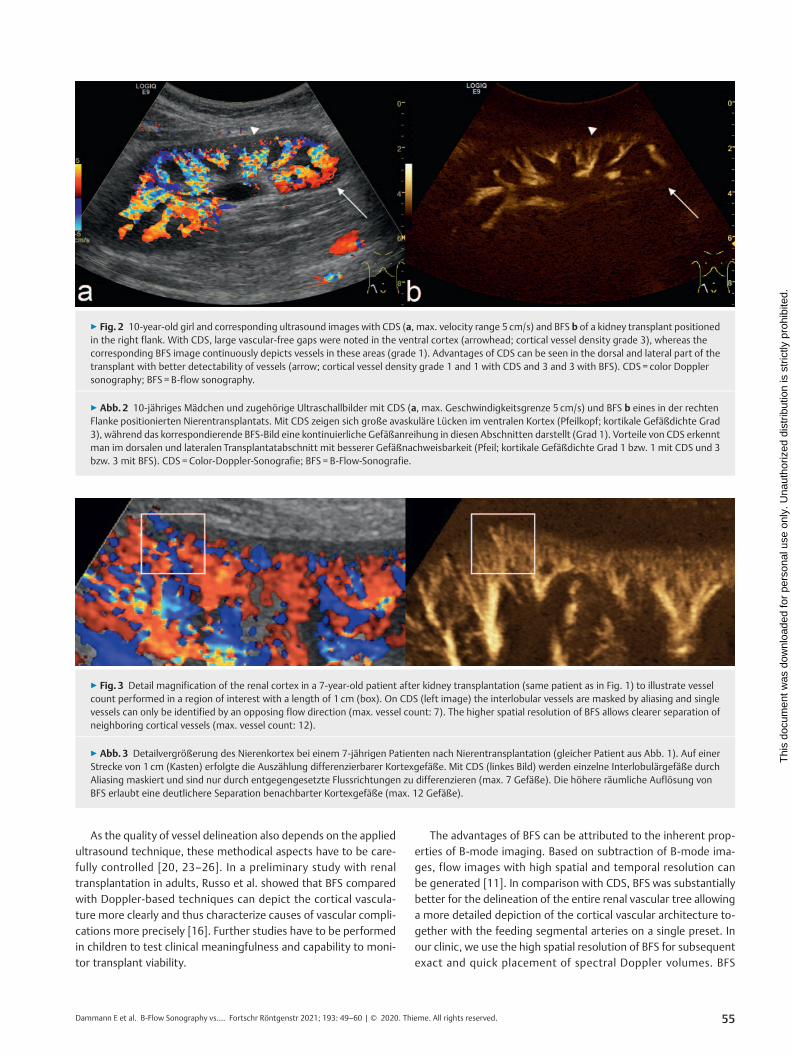
Delineation of the entire renal vascular tree was superior with BFScompared with the velocity-optimized CDS images (grade 1.3 ±0.66 vs. 2.48 ± 0.6, p < 0.001) (▶ Fig. 1, 4). Also, vessel density anddifferentiability in the ventral external renal cortex was higher withBFS than with CDS (vessel density, grade 1.63 ± 0.59 vs. 2.05 ± 0.55,p = 0.01; cortical vessel count, 8.05 ± 2.85 vessels vs. 5.65 ± 2.3 ves-sels, p < 0.001; ▶ Fig. 2–5). The minimal vessel-capsule distance in-dicating the degree of vascularization of the peripheral cortex waslower with BFS compared with CDS (0.16 cm ± 0.13 cm vs.0.31 cm ± 0.15 cm, p < 0.001; ▶ Fig. 5). More distant from thetransducer, in the dorsal and lateral aspect of the kidney graft, BFSwas less sensitive than CDS (cortical vessel density, grade2.65 ± 0.53 vs. 1.80 ± 0.61 and 2.64 ± 0.48 vs 2 ± 0.64; eachp < 0.001; ▶ Fig. 2, 4). All data regarding the curved transducer aresummarized in ▶ Table 2. The delineation of the renal vascular treewith CDS was superior in patients with a lower BMI (p = 0.04). Nosignificant effect of BMI or age on all other CDS parameters (vesseldensity, vessel-capsule distance, cortical vessel count) or on all BFSparameters was found.
53Dammann E et al. B-Flow Sonography vs.… Fortschr Röntgenstr 2021; 193: 49–60 | © 2020. Thieme. All rights reserved.
Thi
s do
cum
ent w
as d
ownl
oade
d fo
r pe
rson
al u
se o
nly.
Una
utho
rized
dis
trib
utio
n is
str
ictly
pro
hibi
ted.

Linear transducer
The analysis of the linear transducer images demonstrated no sig-nificant differences between CDS and BFS with respect to the de-lineation of the vascular tree, of the cortical vessels or the vessel-capsule distance (see ▶ Fig. 6, 7, ▶ Table 3).
Discussion
This study on kidney transplantation in children found that ima-ging of vascularization can be substantially improved by addingBFS as a non-Doppler-based vascular imaging technique to astandard protocol. The degree of transplant vascularization is ameasure of transplant viability and impairment follows acute andchronic functional disorders [1, 4, 5].
▶ Fig. 1 7-year-old boy and corresponding ultrasound images of a kidney transplant in the longitudinal plane performed with a curved transducerusing the CDS (a–c, max. velocity ranges 15 cm/s, 9 cm/s and 5 cm/s) and the BFS technique d are shown. Note the absence of vessels in the lowerkidney due to an occluded accessory lower pole renal artery (c, d; asterisk). The upper and middle parts of the kidney are well vascularized. Low-ering max. velocity ranges on CDS images a–c increases cortical vascular density but diminishes vessel delineation by aliasing and blurring artifacts.BFS d better depicts the entire vascular tree (interlobar vessel arrow, arcuate vessel dotted arrow, interlobular vessel arrowhead; renal vascular tree:grade 1) than CDS (a–c; renal vascular tree: grade 2). CDS has higher sensitivity for the detection of vessels in the deeper structures (cortical vesseldensity in the ventral aspect of the kidney: both grade 1; in the lateral aspect: CDS grade 1 and BFS grade 2; in the dorsal aspect: both grade 3).Technical parameters: a. Pulse repetition frequency (PRF) 1.4, b. PRF 0.8, c. PRF 0.5, a.-c. Mechanical index (MI) 1.2, Thermal index in soft tissue(TIs) 0.9, Frequency (Frq) 3.6, Coded harmonic imaging (CHI) Frq 6.0, d. Pulse repetition interval (PRI) 12, MI 1.2, TIs 1.7. CDS = color Dopplersonography; BFS = B-flow sonography.
▶ Abb.1 7-jähriger Junge und zugehörige Ultraschallbilder eines Nierentransplantats in Longitudinalschnitt mittels Sektorschallkopfes in CDS-(a–c, max. Geschwindigkeitsbereich 15 cm/s, 9 cm/s und 5 cm/s) und BFS-Technik d. Bemerke die Gefäßabwesenheit im kaudalen Nierenabschnittaufgrund einer verschlossenen akzessorischen Unterpolarterie (c, d; Stern) Der kraniale und mittlere Nierenabschnitt zeigen sich regelrechtdurchblutet. Das Herabsetzen der max. Geschwindigkeitsbereiche auf den CDS-Bildern a–c steigert die kortikale Gefäßdichte, schränkt die Ge-fäßdifferenzierbarkeit jedoch durch Aliasing und Unschärfeartefakte ein. BFS d stellt den gesamten Gefäßbaum besser dar (interlobäres Gefäß Pfeil,Bogengefäß gepunkteter Pfeil, interlobuläres Gefäß Pfeilkopf; renaler Gefäßbaum: Grad 1) als CDS (a–c; Grad 2). CDS hat eine höhere Sensitivitätzur Gefäßdetektion in den tiefergelegenen Nierenabschnitten (Dichte der Kortexgefäße am ventral gelegenen Nierenanteil: beide Grad 1; lateral:CDS Grad 1, BFS Grad 2; dorsal: beide Grad 3). Technische Parameter: a Pulsrepetitionsfrequenz (PRF) 1,4, b PRF 0,8, c PRF 0,5, a–c mechanischerIndex (MI) 1,2, thermischer Index in Weichteilen (TIs) 0,9, Frequenz (Frq) 3,6, Coded-harmonic-imaging (CHI) -Frq 6,0, d Pulsrepetitionsintervall(PRI) 12, MI 1,2, TIs 1,7. CDS =Color-Doppler-Sonografie; BFS = B-Flow-Sonografie
54 Dammann E et al. B-Flow Sonography vs.… Fortschr Röntgenstr 2021; 193: 49–60 | © 2020. Thieme. All rights reserved.
Pediatric Radiology
Thi
s do
cum
ent w
as d
ownl
oade
d fo
r pe
rson
al u
se o
nly.
Una
utho
rized
dis
trib
utio
n is
str
ictly
pro
hibi
ted.
As the quality of vessel delineation also depends on the appliedultrasound technique, these methodical aspects have to be care-fully controlled [20, 23–26]. In a preliminary study with renaltransplantation in adults, Russo et al. showed that BFS comparedwith Doppler-based techniques can depict the cortical vascula-ture more clearly and thus characterize causes of vascular compli-cations more precisely [16]. Further studies have to be performedin children to test clinical meaningfulness and capability to moni-tor transplant viability.
The advantages of BFS can be attributed to the inherent prop-erties of B-mode imaging. Based on subtraction of B-mode ima-ges, flow images with high spatial and temporal resolution canbe generated [11]. In comparison with CDS, BFS was substantiallybetter for the delineation of the entire renal vascular tree allowinga more detailed depiction of the cortical vascular architecture to-gether with the feeding segmental arteries on a single preset. Inour clinic, we use the high spatial resolution of BFS for subsequentexact and quick placement of spectral Doppler volumes. BFS
▶ Fig. 2 10-year-old girl and corresponding ultrasound images with CDS (a, max. velocity range 5 cm/s) and BFS b of a kidney transplant positionedin the right flank. With CDS, large vascular-free gaps were noted in the ventral cortex (arrowhead; cortical vessel density grade 3), whereas thecorresponding BFS image continuously depicts vessels in these areas (grade 1). Advantages of CDS can be seen in the dorsal and lateral part of thetransplant with better detectability of vessels (arrow; cortical vessel density grade 1 and 1 with CDS and 3 and 3 with BFS). CDS = color Dopplersonography; BFS = B-flow sonography.
▶ Abb.2 10-jähriges Mädchen und zugehörige Ultraschallbilder mit CDS (a, max. Geschwindigkeitsgrenze 5 cm/s) und BFS b eines in der rechtenFlanke positionierten Nierentransplantats. Mit CDS zeigen sich große avaskuläre Lücken im ventralen Kortex (Pfeilkopf; kortikale Gefäßdichte Grad3), während das korrespondierende BFS-Bild eine kontinuierliche Gefäßanreihung in diesen Abschnitten darstellt (Grad 1). Vorteile von CDS erkenntman im dorsalen und lateralen Transplantatabschnitt mit besserer Gefäßnachweisbarkeit (Pfeil; kortikale Gefäßdichte Grad 1 bzw. 1 mit CDS und 3bzw. 3 mit BFS). CDS =Color-Doppler-Sonografie; BFS = B-Flow-Sonografie.
▶ Fig. 3 Detail magnification of the renal cortex in a 7-year-old patient after kidney transplantation (same patient as in Fig. 1) to illustrate vesselcount performed in a region of interest with a length of 1 cm (box). On CDS (left image) the interlobular vessels are masked by aliasing and singlevessels can only be identified by an opposing flow direction (max. vessel count: 7). The higher spatial resolution of BFS allows clearer separation ofneighboring cortical vessels (max. vessel count: 12).
▶ Abb.3 Detailvergrößerung des Nierenkortex bei einem 7-jährigen Patienten nach Nierentransplantation (gleicher Patient aus Abb. 1). Auf einerStrecke von 1 cm (Kasten) erfolgte die Auszählung differenzierbarer Kortexgefäße. Mit CDS (linkes Bild) werden einzelne Interlobulärgefäße durchAliasing maskiert und sind nur durch entgegengesetzte Flussrichtungen zu differenzieren (max. 7 Gefäße). Die höhere räumliche Auflösung vonBFS erlaubt eine deutlichere Separation benachbarter Kortexgefäße (max. 12 Gefäße).
55Dammann E et al. B-Flow Sonography vs.… Fortschr Röntgenstr 2021; 193: 49–60 | © 2020. Thieme. All rights reserved.
Thi
s do
cum
ent w
as d
ownl
oade
d fo
r pe
rson
al u
se o
nly.
Una
utho
rized
dis
trib
utio
n is
str
ictly
pro
hibi
ted.
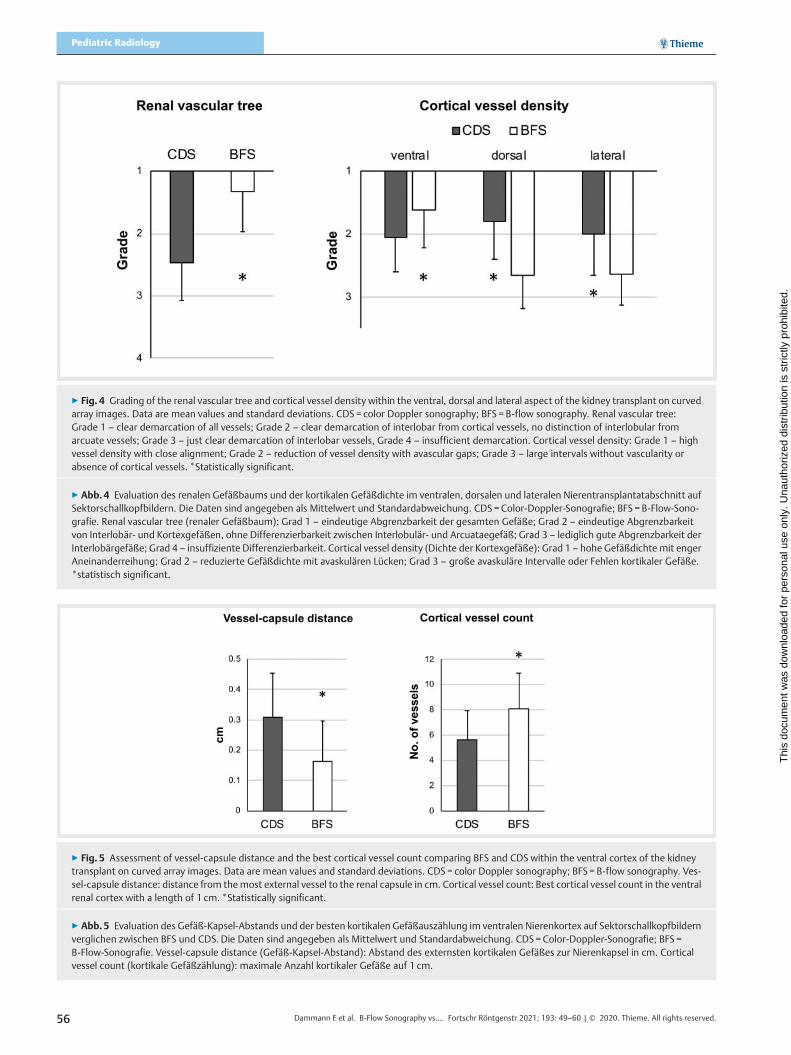
▶ Fig. 4 Grading of the renal vascular tree and cortical vessel density within the ventral, dorsal and lateral aspect of the kidney transplant on curvedarray images. Data are mean values and standard deviations. CDS = color Doppler sonography; BFS = B-flow sonography. Renal vascular tree:Grade 1 – clear demarcation of all vessels; Grade 2 – clear demarcation of interlobar from cortical vessels, no distinction of interlobular fromarcuate vessels; Grade 3 – just clear demarcation of interlobar vessels, Grade 4 – insufficient demarcation. Cortical vessel density: Grade 1 – highvessel density with close alignment; Grade 2 – reduction of vessel density with avascular gaps; Grade 3 – large intervals without vascularity orabsence of cortical vessels. *Statistically significant.
▶ Abb.4 Evaluation des renalen Gefäßbaums und der kortikalen Gefäßdichte im ventralen, dorsalen und lateralen Nierentransplantatabschnitt aufSektorschallkopfbildern. Die Daten sind angegeben als Mittelwert und Standardabweichung. CDS =Color-Doppler-Sonografie; BFS = B-Flow-Sono-grafie. Renal vascular tree (renaler Gefäßbaum): Grad 1 – eindeutige Abgrenzbarkeit der gesamten Gefäße; Grad 2 – eindeutige Abgrenzbarkeitvon Interlobär- und Kortexgefäßen, ohne Differenzierbarkeit zwischen Interlobulär- und Arcuataegefäß; Grad 3 – lediglich gute Abgrenzbarkeit derInterlobärgefäße; Grad 4 – insuffiziente Differenzierbarkeit. Cortical vessel density (Dichte der Kortexgefäße): Grad 1 – hohe Gefäßdichte mit engerAneinanderreihung; Grad 2 – reduzierte Gefäßdichte mit avaskulären Lücken; Grad 3 – große avaskuläre Intervalle oder Fehlen kortikaler Gefäße.*statistisch significant.
▶ Fig. 5 Assessment of vessel-capsule distance and the best cortical vessel count comparing BFS and CDS within the ventral cortex of the kidneytransplant on curved array images. Data are mean values and standard deviations. CDS = color Doppler sonography; BFS = B-flow sonography. Ves-sel-capsule distance: distance from the most external vessel to the renal capsule in cm. Cortical vessel count: Best cortical vessel count in the ventralrenal cortex with a length of 1 cm. *Statistically significant.
▶ Abb.5 Evaluation des Gefäß-Kapsel-Abstands und der besten kortikalen Gefäßauszählung im ventralen Nierenkortex auf Sektorschallkopfbildernverglichen zwischen BFS und CDS. Die Daten sind angegeben als Mittelwert und Standardabweichung. CDS = Color-Doppler-Sonografie; BFS =B-Flow-Sonografie. Vessel-capsule distance (Gefäß-Kapsel-Abstand): Abstand des externsten kortikalen Gefäßes zur Nierenkapsel in cm. Corticalvessel count (kortikale Gefäßzählung): maximale Anzahl kortikaler Gefäße auf 1 cm.
56 Dammann E et al. B-Flow Sonography vs.… Fortschr Röntgenstr 2021; 193: 49–60 | © 2020. Thieme. All rights reserved.
Pediatric Radiology
Thi
s do
cum
ent w
as d
ownl
oade
d fo
r pe
rson
al u
se o
nly.
Una
utho
rized
dis
trib
utio
n is
str
ictly
pro
hibi
ted.
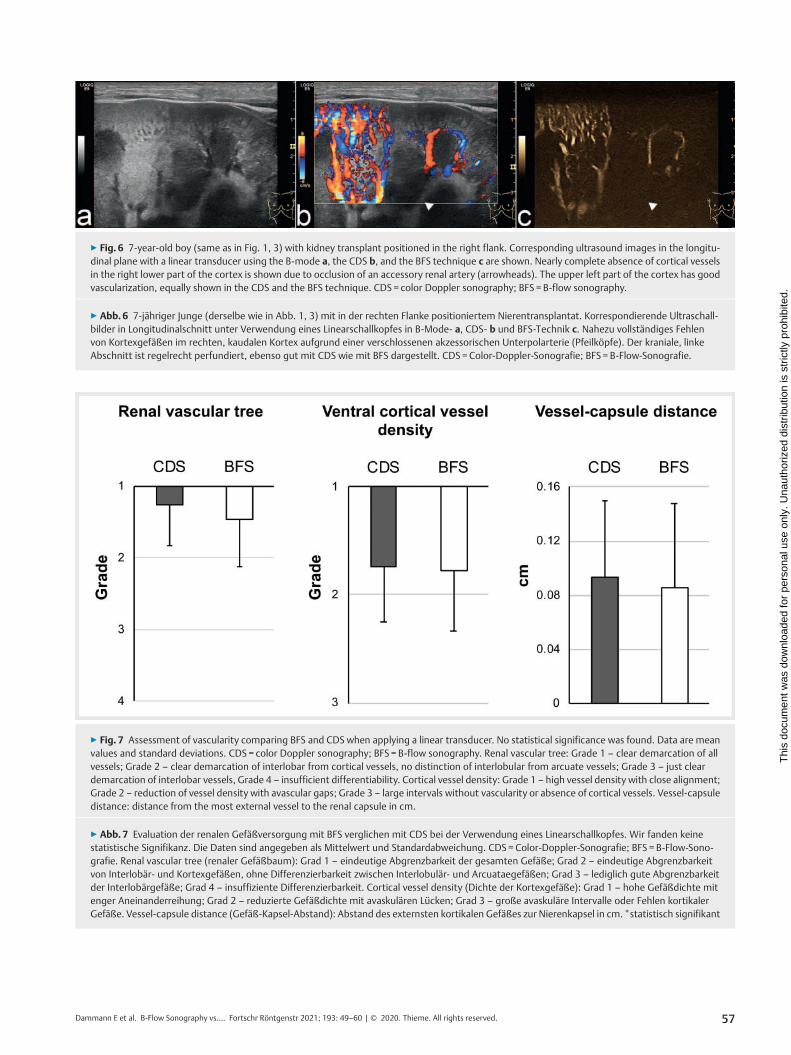
▶ Fig. 6 7-year-old boy (same as in Fig. 1, 3) with kidney transplant positioned in the right flank. Corresponding ultrasound images in the longitu-dinal plane with a linear transducer using the B-mode a, the CDS b, and the BFS technique c are shown. Nearly complete absence of cortical vesselsin the right lower part of the cortex is shown due to occlusion of an accessory renal artery (arrowheads). The upper left part of the cortex has goodvascularization, equally shown in the CDS and the BFS technique. CDS = color Doppler sonography; BFS = B-flow sonography.
▶ Abb.6 7-jähriger Junge (derselbe wie in Abb. 1, 3) mit in der rechten Flanke positioniertem Nierentransplantat. Korrespondierende Ultraschall-bilder in Longitudinalschnitt unter Verwendung eines Linearschallkopfes in B-Mode- a, CDS- b und BFS-Technik c. Nahezu vollständiges Fehlenvon Kortexgefäßen im rechten, kaudalen Kortex aufgrund einer verschlossenen akzessorischen Unterpolarterie (Pfeilköpfe). Der kraniale, linkeAbschnitt ist regelrecht perfundiert, ebenso gut mit CDS wie mit BFS dargestellt. CDS =Color-Doppler-Sonografie; BFS = B-Flow-Sonografie.
▶ Fig. 7 Assessment of vascularity comparing BFS and CDS when applying a linear transducer. No statistical significance was found. Data are meanvalues and standard deviations. CDS = color Doppler sonography; BFS = B-flow sonography. Renal vascular tree: Grade 1 – clear demarcation of allvessels; Grade 2 – clear demarcation of interlobar from cortical vessels, no distinction of interlobular from arcuate vessels; Grade 3 – just cleardemarcation of interlobar vessels, Grade 4 – insufficient differentiability. Cortical vessel density: Grade 1 – high vessel density with close alignment;Grade 2 – reduction of vessel density with avascular gaps; Grade 3 – large intervals without vascularity or absence of cortical vessels. Vessel-capsuledistance: distance from the most external vessel to the renal capsule in cm.
▶ Abb.7 Evaluation der renalen Gefäßversorgung mit BFS verglichen mit CDS bei der Verwendung eines Linearschallkopfes. Wir fanden keinestatistische Signifikanz. Die Daten sind angegeben als Mittelwert und Standardabweichung. CDS = Color-Doppler-Sonografie; BFS = B-Flow-Sono-grafie. Renal vascular tree (renaler Gefäßbaum): Grad 1 – eindeutige Abgrenzbarkeit der gesamten Gefäße; Grad 2 – eindeutige Abgrenzbarkeitvon Interlobär- und Kortexgefäßen, ohne Differenzierbarkeit zwischen Interlobulär- und Arcuataegefäßen; Grad 3 – lediglich gute Abgrenzbarkeitder Interlobärgefäße; Grad 4 – insuffiziente Differenzierbarkeit. Cortical vessel density (Dichte der Kortexgefäße): Grad 1 – hohe Gefäßdichte mitenger Aneinanderreihung; Grad 2 – reduzierte Gefäßdichte mit avaskulären Lücken; Grad 3 – große avaskuläre Intervalle oder Fehlen kortikalerGefäße. Vessel-capsule distance (Gefäß-Kapsel-Abstand): Abstand des externsten kortikalen Gefäßes zur Nierenkapsel in cm.*statistisch signifikant
57Dammann E et al. B-Flow Sonography vs.… Fortschr Röntgenstr 2021; 193: 49–60 | © 2020. Thieme. All rights reserved.
Thi
s do
cum
ent w
as d
ownl
oade
d fo
r pe
rson
al u
se o
nly.
Una
utho
rized
dis
trib
utio
n is
str
ictly
pro
hibi
ted.

shows a dynamic range to capture fast-flow and low-flow vesselson a single flow image, as initially observed by Wachsberg et al.[12]. In contrast, realistic visualization of the renal vasculature istechnically more demanding and time-consuming with CDS,where velocity encoding sensitivities need to be adapted to the
region of interest with different settings for sensitive detectionof low-flow cortical vessels or fast-flow feeding arteries to avoidaliasing artifacts [2, 12]. We showed that BFS can separate thedensely packed interlobular and arcuate vessels of the external
▶ Table 2 Comparison of vessel delineation in kidney transplants with the BFS and the CDS technique using a curved transducer.
▶ Tab. 2 Vergleich der Gefäßdarstellung in Nierentransplantaten mit BFS- und CDS-Technik unter Verwendung eines Sektorschallkopfes.
parameter BFS CDS p-value
renal vascular tree (grades 1–4) 1.33 ± 0.66 2.48 ± 0.6 < 0.001
cortical vessel density (grades 1–3)
▪ ventral external cortex 1.63 ± 0.59 2.05 ± 0.55 0.01
▪ dorsal external cortex 2.65 ± 0.53 1.80 ± 0.61 < 0.001
▪ lateral external cortex 2.64 ± 0.48 2 ± 0.64 < 0.001
vessel-capsule distance (cm) 0.16 ± 0.13 0.31 ± 0.15 < 0.001
cortical vessel count (no.) 8.05 ± 2.85 5.65 ± 2.30 < 0.001
Data are mean values and standard deviations. CDS = color Doppler sonography; BFS = B-flow sonography. Renal vascular tree: Grade 1 – clear demarca-tion of all vessels; Grade 2 – clear demarcation of interlobar from cortical vessels, no distinction of interlobular from arcuate vessels; Grade 3 – just cleardemarcation of interlobar vessels, Grade 4 – insufficient differentiability. Cortical vessel density: Grade 1 – high vessel density with close alignment;Grade 2 – reduction of vessel density with avascular gaps; Grade 3 – large intervals without vascularity or absence of cortical vessels. Vessel-capsuledistance: distance from the most external vessel to the renal capsule in cm. Cortical vessel count: Best cortical vessel count in the external renal cortexwith a length of 1 cm.Daten angegeben als Mittelwerte mit Standardabweichung. CDS = Color-Doppler-Sonografie; BFS = B-Flow-Sonografie. Renal vascular tree (renalerGefäßbaum): Grad 1 – eindeutige Abgrenzbarkeit der gesamten Gefäße; Grad 2 – eindeutige Abgrenzbarkeit von Interlobär- und Kortexgefäßen, ohneDifferenzierbarkeit zwischen Interlobulär- und Arcuataegefäßen; Grad 3 – lediglich gute Abgrenzbarkeit der Interlobärgefäße; Grad 4 – insuffizienteAbgrenzbarkeit. Cortical vessel density (Dichte der Kortexgefäße): Grad 1 – hohe Gefäßdichte mit enger Aneinanderreihung; Grad 2 – reduzierte Ge-fäßdichte mit avaskulären Lücken; Grad 3 – große avaskuläre Intervalle oder Fehlen kortikaler Gefäße. Vessel-capsule distance (Gefäß-Kapsel-Abstand):Abstand des externsten kortikalen Gefäßes zur Nierenkapsel in cm. Cortical vessel count (kortikale Gefäßzählung): maximale Anzahl kortikaler Gefäße auf1 cm.
▶ Table 3 Comparison of vessel delineation in kidney transplants with the BFS and the CDS technique using a linear transducer.
▶ Tab. 3 Vergleich der Gefäßdarstellung in Nierentransplantaten mit BFS- und CDS-Technik unter Verwendung eines Linearschallkopfes.
parameter BFS CDS p-value
renal vascular tree (grades 1–4) 1.45 ± 0.68 1.26 ± 0.58 0.31
cortical vessel density in the ventral external cortex(grades 1–3)
1.77 ± 0.56 1.74 ± 0.52 0.92
vessel-capsule distance (cm) 0.09 ± 0.06 0.09 ± 0.05 0.61
Data are mean values and standard deviations. CDS = color Doppler sonography; BFS = B-flow sonography. Renal vascular tree: Grade 1 – clear demarca-tion of all vessels; Grade 2 – clear demarcation of interlobar from cortical vessels, no distinction of interlobular from arcuate vessels; Grade 3 – just cleardemarcation of interlobar vessels, Grade 4 – insufficient differentiability. Cortical vessel density: Grade 1 – high vessel density with close alignment;Grade 2 – reduction of vessel density with avascular gaps; Grade 3 – large intervals without vascularity or absence of cortical vessels. Vessel-capsuledistance: distance from the most external vessel to the renal capsule in cm.Daten angegeben als Mittelwerte mit Standardabweichung. CDS = Color-Doppler-Sonografie; BFS = B-Flow-Sonografie. Renal vascular tree (renalerGefäßbaum): Grad 1 – eindeutige Abgrenzbarkeit der gesamten Gefäße; Grad 2 – eindeutige Abgrenzbarkeit von Interlobär- und Kortexgefäßen, ohneDifferenzierbarkeit zwischen Interlobulär- und Arcuataegefäßen; Grad 3 – lediglich gute Abgrenzbarkeit der Interlobärgefäße; Grad 4 – insuffizienteAbgrenzbarkeit. Cortical vessel density (Dichte der Kortexgefäße): Grad 1 – hohe Gefäßdichte mit enger Aneinanderreihung; Grad 2 – reduzierte Ge-fäßdichte mit avaskulären Lücken; Grad 3 – große avaskuläre Intervalle oder Fehlen kortikaler Gefäße. Vessel-capsule distance (Gefäß-Kapsel-Abstand):Abstand des externsten kortikalen Gefäßes zur Nierenkapsel in cm.
58 Dammann E et al. B-Flow Sonography vs.… Fortschr Röntgenstr 2021; 193: 49–60 | © 2020. Thieme. All rights reserved.
Pediatric Radiology
Thi
s do
cum
ent w
as d
ownl
oade
d fo
r pe
rson
al u
se o
nly.
Una
utho
rized
dis
trib
utio
n is
str
ictly
pro
hibi
ted.

renal cortex, whereas in CDS blurring boundaries of neighboringvessels were noted and explained by blooming artifacts.
On the other hand, BFS is prone to sound beam attenuation,which increases with depth [10]. Applying B-flow on kidney graftsin children is favorable as the organ is situated close to the skin inthe iliac fossa with little adjacent subcutaneous fat [2]. Yet, also inour pediatric cohort, BFS was less sensitive than color Doppler forvessel depiction in the deeper areas more distant from the centerof the transducer. Additionally, we did not notice significant dif-ferences between CDS and the BFS grading of transplant vascular-ity when using a linear, high-resolution transducer. As CDS in over-lay mode also carries information about structural parenchymalintegrity, e. g. can detect cortical scarring, we favor CDS for thisapplication. However, due to their lower display range, lineartransducers are limited to assessment of accessible regions ofthe transplant, e. g. the superficial part of the lower pole.
There are further methods recently introduced by differentmanufacturers that seem advantageous for the sonographicdepiction of complex flow and small vessels, such as AdvancedDynamic Flow (ADF) or superb micro-vascular imaging (SMI) [27,28]. However, a common problem of these newer techniques, aswell as of BFS, is the lacking overall availability on the ultrasoundsystems. Also, contrast-enhanced ultrasound (CEUS) is an increas-ingly used method for vascular assessment in kidney transplanta-tion in adults and has been recommended for this use by theEuropean federation of Societies in Ultrasound in Medicine andBiology (EFSUMB) [24, 30, 31]. To our knowledge, CEUS has notyet been systematically applied in pediatric kidney transplantationas its intravascular application in children is only approved for thecharacterization of focal liver lesions so far [29].
Our study has the following limitations: (1) The study design isretrospective and is therefore dependent on medical documenta-tion and principally prone to selection bias. (2) Results of ultra-sound investigations are operator-dependent and require a highlevel of skill. To guarantee a high level of data consistency, the in-cluded data points were limited to examinations performed by asingle expert pediatric radiologist. The inter- and intra-operatorvariability of BFS and CDS cannot be reported (3). The number ofpatients in our study was relatively low and heterogeneous withregard to age, days after transplantation, BMI, transplantationtype (living or cadaveric), clinical and laboratory findings(▶ Table 1).
In summary, BFS yields better results than CDS for assessingthe overall vascularity in pediatric kidney transplantation andthereby could improve monitoring of transplant viability. As sug-gested by previous studies focusing on other vascular territories,the B-flow technique may be especially useful in infants andyoung children [18, 19]. BFS is less favorable in larger patientsand for the deeper parts of the kidney due to sound beamattenuation and should thereby be used in addition to Doppler-based ultrasound techniques. Further standardization of the ultra-sound protocols and the reporting of the results in pediatric kid-ney transplantation is desirable for the future. There are otherfields of diagnostic ultrasound, e. g. in the domain of screeningand surveillance where standardization is already more advanced[32].
CLINICAL RELEVANCE OF THE STUDY
▪ Additional monitoring with BFS improves monitoring of
kidney transplant viability.
▪ Acute and chronic functional disorders impair transplant
vascularity. A higher quality of vessel delineation may
facilitate the early detection of graft damage.
▪ Adding BFS to a standard protocol after kidney transplan-
tation accelerates workflow as an accurate overview of the
global vascular tree is obtained and subsequent detailed
vascular assessment can be performed, e. g. placement of
spectral doppler volumes.
Conflict of Interest
The authors declare that they have no conflict of interest.
References
[1] Burgos FJ, Pascual J, Marcen R et al. The role of imaging techniques inrenal transplantation. World J Urol 2004; 22: 399–404. doi:10.1007/s00345-004-0412-1
[2] Baxter GM. Imaging in renal transplantation. Ultrasound Q 2003; 19:123–138
[3] Sugi MD, Joshi G, Maddu KK et al. Imaging of Renal Transplant Compli-cations throughout the Life of the Allograft: Comprehensive Multimod-ality Review. Radiographics 2019; 39: 1327–1355. doi:10.1148/rg.2019190096
[4] Irshad A, Ackerman SJ, Campbell AS et al. An overview of renal trans-plantation: current practice and use of ultrasound. Semin Ultrasound CTMR 2009; 30: 298–314
[5] Nixon JN, Biyyam DR, Stanescu L et al. Imaging of pediatric renal trans-plants and their complications: a pictorial review. Radiographics 2013;33: 1227–1251. doi:10.1148/rg.335125150
[6] Grenier N, Douws C, Morel D et al. Detection of vascular complications inrenal allografts with color Doppler flow imaging. Radiology 1991; 178:217–223. doi:10.1148/radiology.178.1.1984307
[7] Taylor KJ, Morse SS, Rigsby CM et al. Vascular complications in renalallografts: detection with duplex Doppler US. Radiology 1987; 162: 31–38. doi:10.1148/radiology.162.1.3538150
[8] Platt JF, Rubin JM, Ellis JH. Acute renal obstruction: evaluation withintrarenal duplex Doppler and conventional US. Radiology 1993; 186:685–688. doi:10.1148/radiology.186.3.8430174
[9] Barba J, Rioja J, Robles JE et al. Immediate renal Doppler ultrasonographyfindings (<24h) and its association with graft survival. World J Urol 2011;29: 547–553. doi:10.1007/s00345-011-0666-3
[10] Weskott HP. B-flow – a newmethod for detecting blood flow. Ultraschallin Med 2000; 21: 59–65. doi:10.1055/s-2000-319
[11] Henri P, Tranquart F. B-flow ultrasonographic imaging of circulatingblood. J Radiol 2000; 81: 465–467
[12] Wachsberg RH. B-flow, a non-Doppler technology for flow mapping:early experience in the abdomen. Ultrasound Q 2003; 19: 114–122
[13] Mikami T, Takahashi A, Houkin K. Evaluation of blood flow in carotidartery stenosis using B-flow sonography. Neurol Med Chir (Tokyo) 2003;43: 528–532; discussion 533
59Dammann E et al. B-Flow Sonography vs.… Fortschr Röntgenstr 2021; 193: 49–60 | © 2020. Thieme. All rights reserved.
Thi
s do
cum
ent w
as d
ownl
oade
d fo
r pe
rson
al u
se o
nly.
Una
utho
rized
dis
trib
utio
n is
str
ictly
pro
hibi
ted.
[14] Hancerliogullari KO, Soyer T, Tosun A et al. Is B-Flow USG superior to ColorDoppler USG for evaluating blood flow patterns in ovarian torsion?J Pediatr Surg 2015; 50: 1156–1161. doi:10.1016/j.jpedsurg.2014.08.028
[15] Wachsberg RH. B-flow imaging of the hepatic vasculature: correlationwith color Doppler sonography. Am J Roentgenol 2007; 188: W522–W533. doi:10.2214/Am J Roentgenol.06.1161
[16] Russo E, Cerbone V, Sciano D et al. Posttransplant renal monitoring withB-flow ultrasonography. Transplant Proc 2010; 42: 1127–1129.doi:10.1016/j.transproceed.2010.03.050
[17] Hongmei W, Ying Z, Ailu C et al. Novel application of four-dimensionalsonography with B-flow imaging and spatiotemporal image correlationin the assessment of fetal congenital heart defects. Echocardiography2012; 29: 614–619. doi:10.1111/j.1540-8175.2011.01639.x
[18] Groth M, Dammann E, Arndt F et al. Comparison of B-Mode with B-FlowSonography for the Evaluation of Femoral Arteries in Infants. Rofo 2017.doi:10.1055/s-0043-112249
[19] Groth M, Ernst M, Deindl P et al. B-Flow Sonography for Evaluation ofBasal Cerebral Arteries in Newborns. Clin Neuroradiol 2019; 29: 95–100.doi:10.1007/s00062-017-0624-6
[20] Trillaud H, Merville P, Tran Le Linh P et al. Color Doppler sonography inearly renal transplantation follow-up: resistive index measurementsversus power Doppler sonography. Am J Roentgenol 1998; 171: 1611–1615. doi:10.2214/ajr.171.6.9843297
[21] Martinoli C, Crespi G, Bertolotto M et al. Interlobular vasculature in renaltransplants: a power Doppler US study with MR correlation. Radiology1996; 200: 111–117. doi:10.1148/radiology.200.1.8657897
[22] Gruenewald S, Skerrett D, Dolimier D et al. Technique of color Dopplerquantification of vascularity in transplanted kidneys. J Clin Ultrasound2002; 30: 151–157
[23] Nankivell BJ, Chapman JR, Gruenewald SM. Detection of chronic allograftnephropathy by quantitative doppler imaging. Transplantation 2002;74: 90–96
[24] Schwenger V, Korosoglou G, Hinkel UP et al. Real-time contras-t-enhanced sonography of renal transplant recipients predicts chronicallograft nephropathy. Am J Transplant 2006; 6: 609–615. doi:10.1111/j.1600-6143.2005.01224.x
[25] Radermacher J, Mengel M, Ellis S et al. The renal arterial resistance indexand renal allograft survival. N Engl J Med 2003; 349: 115–124.doi:10.1056/NEJMoa022602
[26] Fischer T, Filimonow S, Dieckhofer J et al. Improved diagnosis of earlykidney allograft dysfunction by ultrasound with echo enhancer–a newmethod for the diagnosis of renal perfusion. Nephrol Dial Transplant2006; 21: 2921–2929. doi:10.1093/ndt/gfl313
[27] Heling KS, Chaoui R, Bollmann R. Advanced dynamic flow – a newmethod of vascular imaging in prenatal medicine. A pilot study of itsapplicability. Ultraschall in Med 2004; 25: 280–284. doi:10.1055/s-2004-813383
[28] Machado P, Segal S, Lyshchik A et al. A Novel Microvascular FlowTechnique: Initial Results in Thyroids. Ultrasound Q 2016; 32: 67–74.doi:10.1097/RUQ.0000000000000156
[29] Sidhu PS, Cantisani V, Deganello A et al. Role of Contrast-EnhancedUltrasound (CEUS) in Paediatric Practice: An EFSUMB Position State-ment. Ultraschall in Med 2017; 38: 33–43. doi:10.1055/s-0042-110394
[30] Harvey CJ, Sidhu PS, Bachmann Nielsen M. Contrast-enhanced ultra-sound in renal transplants: applications and future directions. Ultraschallin Med 2013; 34: 319–321. doi:10.1055/s-0033-1350138
[31] Sidhu PS, Cantisani V, Dietrich CF et al. The EFSUMB Guidelines andRecommendations for the Clinical Practice of Contrast-Enhanced Ultra-sound (CEUS) in Non-Hepatic Applications: Update 2017 (Long Version).Ultraschall in Med 2018; 39: e2–e44. doi:10.1055/a-0586-1107
[32] Morgan TA, Maturen KE, Dahiya N et al. US LI-RADS: ultrasound liverimaging reporting and data system for screening and surveillance ofhepatocellular carcinoma. Abdom Radiol (NY) 2018; 43: 41–55.doi:10.1007/s00261-017-1317-y
60 Dammann E et al. B-Flow Sonography vs.… Fortschr Röntgenstr 2021; 193: 49–60 | © 2020. Thieme. All rights reserved.
Pediatric Radiology
Thi
s do
cum
ent w
as d
ownl
oade
d fo
r pe
rson
al u
se o
nly.
Una
utho
rized
dis
trib
utio
n is
str
ictly
pro
hibi
ted.