Real-time numerical simulation of Doppler ultrasound in the presence of nonaxial flow
10
doi:10.1016/j.ultrasmedbio.2004.12.013 ● Original Contribution REAL-TIME NUMERICAL SIMULATION OF DOPPLER ULTRASOUND IN THE PRESENCE OF NONAXIAL FLOW MAHDIEH KHOSHNIAT,* † MEGHAN L. THORNE,* ‡ TAMIE L. POEPPING, § SAMIRA HIRJI,* † DAVID W. HOLDSWORTH,* †‡ and DAVID A. STEINMAN* †‡ *Imaging Research Laboratories, Robarts Research Institute, London, Ontario, Canada; † Graduate Program in Biomedical Engineering, University of Western Ontario, London, Ontario, Canada; ‡ Department of Medical Biophysics, University of Western Ontario, London, Ontario, Canada; and § Medical Physics, University of Edinburgh, Edinburgh, Scotland, United Kingdom (Received 8 June 2004; revised 29 November 2004; in final form 14 December 2004) Abstract—Numerical simulations of Doppler ultrasound (DUS) relying on computational fluid dynamics (CFD) models of nonaxial flow have traditionally employed detailed (but computationally intensive) models of the DUS physics, or have sacrificed much of the physics in the interest of computational or conceptual simplicity. In this paper, we present a compromise between these extremes, with the objective of simulating the essential charac- teristics of DUS spectrograms in a real-time manner. Specifically, a precomputed pulsatile CFD velocity field is interrogated at some number, N, of discrete points distributed spatially within a sample volume of prescribed geometry and power distribution and temporally within a prescribed sampling window. Intrinsic spectral broadening is accounted for by convolving each of the point velocities with a semiempirical broadening function. Real-time performance is facilitated through the use of an efficient algorithm for interpolating the unstructured CFD data. A spherical sample volume with Gaussian power distribution, N 1000 sampling points, and quadratic broadening function are shown to be adequate for simulating, at frame rates of 86 Hz on a 1.5 GHz desktop workstation, realistic-looking spectrograms at representative locations within a stenosed carotid bifur- cation model. Via qualitative comparisons with matched in vitro data, these simulated spectrograms are shown to mimic the distinctive spectral envelopes, broadening and power characteristics associated with common carotid, stenotic jet and poststenotic recirculating flows. We conclude that the complex interaction between Doppler ultrasound and complicated clinically relevant blood flow dynamics can be simulated in real time via this relatively straightforward semiempirical approach. (E-mail: [email protected]) © 2005 World Federation for Ultrasound in Medicine & Biology. Key Words: Doppler ultrasound, Simulation, Computational fluid dynamics, Pulsatile flow, 3-D flow, Carotid bifurcation, Stenosis, Intrinsic spectral broadening, Sample volume. INTRODUCTION Doppler ultrasound (DUS) is widely used in the diagnosis of, and treatment planning for, vascular disease; however, it provides a limited and, hence, often difficult-to-interpret window into the complicated blood flow dynamics typically associated with these diseases. Computer simulations of DUS have, therefore, been used to provide, under accu- rately and precisely controlled conditions, a valuable and convenient insight into the complex interaction between the ultrasound acoustics, signal processing, blood flow dynam- ics and clinical interpretation (Routh et al. 1989). The earliest simulations focused on the effect that moving scat- terers have on the returned DUS signal (e.g., Mo and Cobbold 1986; van Leeuwen et al. 1986; Jones and Giddens 1990), with the aim of understanding and improving the performance of signal processors under laminar flow con- ditions. In a more sophisticated approach, Kerr and Hunt (1992) coupled a point-scattering model of moving blood and stationary tissue to an acoustic impulse response method to account for the spatial effects of transducer geometry. Common to these simulations, however, was the assumption of axial flow, which allowed for the convenient prescription of an analytic, but overly simplistic, velocity field. In the last decade, computational fluid dynamics (CFD) has emerged as a practical and reliable tool for Address correspondence to: David A. Steinman, Ph.D., Imaging Research Laboratories, Robarts Research Institute, 100 Perth Drive, London, Ontario, Canada N6A 5K8. E-mail: steinman@imaging. robarts.ca Ultrasound in Med. & Biol., Vol. 31, No. 4, pp. 519 –528, 2005 Copyright © 2005 World Federation for Ultrasound in Medicine & Biology Printed in the USA. All rights reserved 0301-5629/05/$–see front matter 519
Transcript of Real-time numerical simulation of Doppler ultrasound in the presence of nonaxial flow

Ultrasound in Med. & Biol., Vol. 31, No. 4, pp. 519–528, 2005Copyright © 2005 World Federation for Ultrasound in Medicine & Biology
Printed in the USA. All rights reserved0301-5629/05/$–see front matter
doi:10.1016/j.ultrasmedbio.2004.12.013
● Original Contribution
REAL-TIME NUMERICAL SIMULATION OF DOPPLER ULTRASOUND INTHE PRESENCE OF NONAXIAL FLOW
MAHDIEH KHOSHNIAT,*† MEGHAN L. THORNE,*‡ TAMIE L. POEPPING,§ SAMIRA HIRJI,*†
DAVID W. HOLDSWORTH,*†‡ and DAVID A. STEINMAN*†‡
*Imaging Research Laboratories, Robarts Research Institute, London, Ontario, Canada; †Graduate Program inBiomedical Engineering, University of Western Ontario, London, Ontario, Canada; ‡Department of MedicalBiophysics, University of Western Ontario, London, Ontario, Canada; and §Medical Physics, University of
Edinburgh, Edinburgh, Scotland, United Kingdom
(Received 8 June 2004; revised 29 November 2004; in final form 14 December 2004)
Abstract—Numerical simulations of Doppler ultrasound (DUS) relying on computational fluid dynamics (CFD)models of nonaxial flow have traditionally employed detailed (but computationally intensive) models of the DUSphysics, or have sacrificed much of the physics in the interest of computational or conceptual simplicity. In thispaper, we present a compromise between these extremes, with the objective of simulating the essential charac-teristics of DUS spectrograms in a real-time manner. Specifically, a precomputed pulsatile CFD velocity field isinterrogated at some number, N, of discrete points distributed spatially within a sample volume of prescribedgeometry and power distribution and temporally within a prescribed sampling window. Intrinsic spectralbroadening is accounted for by convolving each of the point velocities with a semiempirical broadening function.Real-time performance is facilitated through the use of an efficient algorithm for interpolating the unstructuredCFD data. A spherical sample volume with Gaussian power distribution, N � 1000 sampling points, andquadratic broadening function are shown to be adequate for simulating, at frame rates of 86 Hz on a 1.5 GHzdesktop workstation, realistic-looking spectrograms at representative locations within a stenosed carotid bifur-cation model. Via qualitative comparisons with matched in vitro data, these simulated spectrograms are shownto mimic the distinctive spectral envelopes, broadening and power characteristics associated with commoncarotid, stenotic jet and poststenotic recirculating flows. We conclude that the complex interaction betweenDoppler ultrasound and complicated clinically relevant blood flow dynamics can be simulated in real time via thisrelatively straightforward semiempirical approach. (E-mail: [email protected]) © 2005 WorldFederation for Ultrasound in Medicine & Biology.
Key Words: Doppler ultrasound, Simulation, Computational fluid dynamics, Pulsatile flow, 3-D flow, Carotid
bifurcation, Stenosis, Intrinsic spectral broadening, Sample volume.INTRODUCTION
Doppler ultrasound (DUS) is widely used in the diagnosisof, and treatment planning for, vascular disease; however, itprovides a limited and, hence, often difficult-to-interpretwindow into the complicated blood flow dynamics typicallyassociated with these diseases. Computer simulations ofDUS have, therefore, been used to provide, under accu-rately and precisely controlled conditions, a valuable andconvenient insight into the complex interaction between theultrasound acoustics, signal processing, blood flow dynam-
Address correspondence to: David A. Steinman, Ph.D., ImagingResearch Laboratories, Robarts Research Institute, 100 Perth Drive,
London, Ontario, Canada N6A 5K8. E-mail: [email protected]519
ics and clinical interpretation (Routh et al. 1989). Theearliest simulations focused on the effect that moving scat-terers have on the returned DUS signal (e.g., Mo andCobbold 1986; van Leeuwen et al. 1986; Jones and Giddens1990), with the aim of understanding and improving theperformance of signal processors under laminar flow con-ditions. In a more sophisticated approach, Kerr and Hunt(1992) coupled a point-scattering model of moving bloodand stationary tissue to an acoustic impulse responsemethod to account for the spatial effects of transducergeometry. Common to these simulations, however, was theassumption of axial flow, which allowed for the convenientprescription of an analytic, but overly simplistic, velocity field.
In the last decade, computational fluid dynamics
(CFD) has emerged as a practical and reliable tool for
es of r
520 Ultrasound in Medicine and Biology Volume 31, Number 4, 2005
studying pulsatile blood flow dynamics in complex 3-Darterial geometries (e.g., Steinman 2002). Representative ofstudies that have exploited precomputed CFD models ofsuch nonaxial flows for the purposes of DUS simulation isthat of Wilkerson et al. (1999), who simply projected aprecomputed CFD velocity field onto the specified probedirection, which amounts to assuming an infinitesimallysmall sample volume. A more sophisticated approach waspresented by Oung and Forsberg (1996)), who modeledDUS spectra returned from a stenotic flow field by couplingan acoustic impulse response method to a precomputed 3-DCFD model. These two studies represent the extremes intrading-off the competing factors of computational com-plexity (i.e., speed) and realism of the simulated DUSphysics.
Toward our objective of real-time interactive DUSsimulation for the purposes of teaching and training, wepresent here a more balanced trade-off between speedand realism. This is done by coupling a CFD velocityfield to a simplified empirical model of the DUS physicsthat accounts for the key effects of sample volume ge-ometry (i.e., power distribution), finite temporal sam-pling window and intrinsic spectral broadening. Weshow, via comparison with matched in vitro data from astenosed carotid bifurcation model, that spectra fromnonaxial pulsatile flow can be realistically simulated inreal time, even on an inexpensive desktop workstation.
MATERIALS AND METHODS
Our approach builds upon that of Guidi et al. (1995),who simulated DUS spectra by summing the contributionsof individual point velocities, each weighted by a broaden-ing function to model intrinsic spectral broadening. Each
Fig. 1. The 3-D 30% eccentrically stenosed carotid bifupeak systole and the surface triangulation illustrating therepresentative spectrograms were simulated: (1) middleinternal carotid artery (ICA); and (3) poststenotic recircu
represent sample volum
contribution was further weighted by an empirically derived
function accounting for the nonuniform beam profile. Torender their simulation mathematically manageable, how-ever, those authors restricted themselves to a parabolicvelocity profile and a cylindrical sample volume of finitelength. In the present study, as detailed below, point veloc-ities are discretely and efficiently sampled from a precom-puted pulsatile CFD velocity field and weighted by a morerealistic, 3-D sample volume power distribution.
Computational fluid dynamics (CFD) modelAs shown in Fig. 1, the model used for this study
was a 30% eccentrically stenosed carotid bifurcationdescribed by Smith et al. (1996). Apart from its obviousclinical relevance, this model has been used previously inexperimental and/or numerical studies of stenosed ca-rotid bifurcation hemodynamics (Steinman et al. 2000;Tambasco and Steinman 2003). It has also been used forin vitro DUS studies (Poepping et al. 2002) which, asdescribed later, allowed us to make direct comparisonsbetween simulated and measured DUS spectra.
The three-dimenional pulsatile velocity field wascomputed using a well-validated in-house finite-element-based CFD solver (Ethier et al. 1999; Ethier et al. 2000).Briefly, in the finite element method, a complex geom-etry is first divided into a “mesh” of many small regularelements. By prescribing the functional shape of thevelocity and pressure fields over these elements, it ispossible to solve the governing Navier-Stokes and con-tinuity equations at the nodes connecting these elements,resulting in a piecewise continuous representation of thehemodynamic field. In the present case, the finite ele-ment mesh was composed of roughly 200 000 quadratictetrahedral elements and nearly 300 000 nodes and the
CFD model, showing the center-plane velocity field atelement mesh density. Also shown are locations where
mmon carotid artery (CCA); (2) poststenotic jet in thezone in ICA. (ECA � external carotid artery.) Spheres
oughly 1 mm diameter.
rcationfiniteof colation
inherent symmetry of the model was exploited by mesh-

Real-time doppler simulation ● M. KHOSHNIAT et al. 521
ing only half of the domain. For the purposes of thesubsequent DUS simulations, the CFD model was mir-rored about its symmetry plane.
To match the in vitro studies, flow boundary con-ditions were based upon electromagnetic flow metermeasurements in the corresponding physical model, asdescribed by Poepping et al. (2002). Specifically, fullydeveloped velocities, derived from the measured flowrates, were imposed at the common carotid artery (CCA)inlet and internal carotid artery (ICA) outlet, the latterimposed roughly 15 diameters downstream of the steno-sis. Traction-free boundary conditions were applied atthe external carotid artery (ECA) outlet to ensure con-servation of mass and no-slip (i.e., zero velocity) bound-ary conditions were applied at the walls, which wereassumed to be rigid. Owing to the slight distensibility ofthe physical model, it was necessary to align temporallythe CCA and ICA flow rate waveforms before theirapplication to the rigid CFD model.
Viscosity was assumed to be constant at 0.041Poise, consistent with the reported viscosity of the blood-mimicking fluid used for the DUS experiments. Themodel Reynolds and Womersley numbers were approx-imately 200 and 5.2, based on the prescribed pumpingfrequency (65 bpm), the nominal CCA diameter (8 mm)and the imposed mean flow rate (5.2 mL/s). The time-dependent Navier-Stokes and continuity equations werethen solved using 12 000 time-steps per cardiac cycle toensure solution stability for this highly resolved meshand two cardiac cycles were required to damp initialtransients. These resulting velocity data were used asinput for the subsequent DUS simulations.
Prescribed sample volumeUsing a phantom consisting of a vibrating point
source (Hoeks et al. 1984), it has been demonstrated thatthe DUS sample volume of a clinical US machine (ATLUltramark 8; Bothell, WA, USA) and mechanical probe(ATL Access 10-PV) could be approximated as an oblatespheroid having a full-width at half-maximum power(FWHM) of 0.75 mm along and 1.3 mm transverse to thebeam axis (Poepping et al. 2002, Fig. 5). Assuming aGaussian power distribution (e.g., Bastos et al. 2000),this converts to standard deviations (�) of 0.32 mm alongand 0.55 mm transverse to the beam axis. In this study,we considered this oblate spheroid geometry, but alsoevaluated a simpler spherical geometry of equivalentvolume (FWHM � 1.08 mm; � � 0.46 mm), since thelatter has the distinct advantage of being invariant tochanges in beam orientation and rotation.
Point velocity sampling strategyTo build up the DUS spectrum for a given time-
point, the CFD velocity field at that time-point was
discretely sampled at some number of spatial locations,N, distributed randomly throughout the prescribed sam-ple volume. The nonuniform power distribution wasaccounted for by weighting the contribution of eachpoint by a Gaussian function in each of the three cardinaldirections relative to the beam axis, based on the point’sdistance from the center of the sample volume and theprescribed standard deviations. This strategy naturallymimics the way in which a field of moving nonaggre-gating random scatterers (i.e., red blood cells) is sampledby DUS; however, to limit the otherwise infinite extentof the sample volume, points were distributed onlywithin a radius of three standard deviations, since thisencompassed more than 99% of the total power. Toidentify the number of sampling points required to pro-duce a realistic spectrum, simulations were carried out inwhich the sampling density was reduced geometrically insteps of 10 from N � 10 000 to N � 10.
The approach described above implicitly accountsfor spectral broadening due to the interaction between afinite sample volume and spatial gradients in the velocityfield. To account for the interaction between a finitesampling window and temporal velocity gradients (i.e.,nonstationary broadening (Fish 1991)) for each pointrandomly distributed within the sample volume, we alsorandomized the sampling time itself within a finite win-dow centered on the nominal time-point. In the presentstudy, a 23.2-ms-wide Hanning window was used tomatch the experimental acquisitions, based upon thespecified digitization rate and FFT size (see below).
Real-time point velocity interpolationOwing to the challenge posed by the requirement of
real-time interpolation of piecewise continuous velocitydata from unstructured finite element CFD meshes (Löh-ner 1995), which often consist of hundreds of thousands,or even millions, of elements, velocity vectors at pointswithin the sample volume were interpolated using astructured auxiliary mesh (SAM) search algorithm. In thepresent study, we used a SAM voxel volume roughly anorder of magnitude greater than the mean tetrahedralelement volume, which was previously found to optimizethe trade-off between interpolation speed and the timeand storage required to set up the necessary elementlook-up tables (Khoshniat et al. 2003). Each interpolatedvelocity vector, v, was converted to a frequency via theDoppler equation, namely, fD � 2f0v·n/c, where f0 is thetransducer frequency, c is the speed of sound (assumed tobe 1540 m/s) and n is the unit vector defining theorientation of the beam axis. The Doppler frequency wasthen converted back to the angle-corrected velocity viavD � cfD/(2f0 cos �), where � is the angle between n andthe presumed axial flow direction. (In the event that
frequency is not explicitly required, the angle-corrected
522 Ultrasound in Medicine and Biology Volume 31, Number 4, 2005
velocity may of course be calculated directly via vD �v·n/cos �.)
Prescribed intrinsic spectral broadening functionSampling the velocity field in the above manner
accounts for the spectral broadening induced by thepresence of velocity gradients coupled with a finite sam-pling; however, spectral broadening also occurs due tothe practical limitations of focusing an ultrasound beamfrom a finite-sized transducer. Rather than attempting tosimulate this intrinsic spectral broadening (ISB) mecha-nistically, at the likely expense of real-time performance,we chose to follow the approach originally suggested byCensor et al. (1988) and recently expanded upon byThompson and Aldis (2002). Specifically, each sampledDoppler frequency, fD, was convolved with a quadraticpower spread function (i.e., the square of a triangularamplitude spread function) centered on fD and having abandwidth BD � fD(W/F)tan �, where � is the Dopplerangle, W is the transducer aperture width and F is thebeam focal length (Thompson and Aldis 2002). For oursimulations, these parameters (W, F, �) were chosen tomatch the experimental set-up.
Spectrum assembly and postprocessingAfter convolving each sampled velocity with the
ISB function, a power vs. velocity spectrum was gener-ated by binning the resulting sampled and ISB-con-volved data according to a specified frequency or veloc-ity resolution and projecting the resulting spectral data(in gray-scale or color) onto the vertical axis of a time-velocity display. To achieve power levels independent ofthe number of sampling points used, each spectrum wasnormalized by its total spectral power. By repeating thisentire process at subsequent time-points, spaced accord-ing to a specified temporal resolution, a simulated DUSspectrogram was generated.
Alternatively, a pseudocolor Doppler ultrasound(CDUS) display was simulated by color-coding selectedspectral indices derived from a planar array of samplevolumes placed according to a specified resolution andfield-of-view. Following Poepping et al. (2002), thespectral peak velocity was calculated as the velocityencompassing 90% of the total spectral power. For sim-ulated spectra with both positive and negative velocities,we calculated the power threshold of 90% in both posi-tive and negative directions and the velocity having thegreater absolute value was considered as the peak. Forthe mean velocity measurement, we calculated the firstmoment of the spectrum by summing the product ofpower and velocity over the bins and dividing by thetotal summed power. The spectral broadening index
(SBI) was then simply determined as 1 � mean/peak.Experimental validationTo validate the ISB model used for the DUS sim-
ulations, we acquired spectra from the center of a 12.7mm diameter tube perfused at steady flow rates of 5, 10,15 and 20 mL/s, using the experimental apparatus andacquisition parameters described by Poepping et al.(2002) and summarized below. Given the nominal 1-mmdiameter sample volume and relatively large tube diam-eter, Poiseuille’s law indicates that the fully-developedcenter-line velocity should vary by less than 1% withinthe sample volume, which suggests that any measuredspectral broadening may be attributed almost entirely toISB, with a negligible contribution from velocity gradi-ents. The mean velocities derived from the spectra ac-quired at the four flow rates were each used to constructa simulated parabolic velocity field, each of which wasthen sampled numerically, as described above.
To validate the DUS simulations under conditionsof nonaxial flow, we employed DUS spectral data ac-quired in vitro throughout a 30% eccentrically stenosedcarotid bifurcation geometry, perfused under physiolog-ically-pulsatile flow conditions of 20 mL/s peak flowrate, 5.2 mL/s mean flow rate and 65 bpm heart rate(Poepping et al. 2002). Because the numerical and ex-perimental geometries and flow conditions were nomi-nally matched, as described above, we were able tocompare simulated DUS spectrograms at representativelocations (e.g., those identified in Fig. 1), or derivedmaps of spectral indices, against corresponding mea-sured data. For all comparisons, the experimental spectrawere phase-averaged over the 10 cardiac cycles of dataacquired, to reduce noise.
All experimental data were acquired using an Ul-tramark 8 (ATL; Bothell, WA, USA) scanner with amechanical probe (ATL Access 10-PV) operating at 5MHz with a 6.4 mm wide aperture and a 60° Dopplerangle. Other settings included a 50 Hz wall filter, 8 kHzpulse repetition frequency and smallest (1.5 mm nomi-nal) sample volume. The demodulated in-phase and an-alog signals were digitized at a rate of 44.1 kHz andprocessed using a 1024-point FFT with a 1024-pointHanning window and a 50% overlap between consecu-tive windows. This resulted in an effective temporalresolution of 11.6 ms and a 43-Hz frequency resolution;the latter corresponds to a velocity resolution of 1.33cm/s. These resolutions were provided as input parame-ters to the DUS simulations, which were performed on a1.5 GHz AMD Athlon workstation running Red HatLinux version 3.2. All simulation code was compiledusing the GNU C-compiler with level 3 and CPU-spe-cific optimizations enabled. Code timings were deter-
mined via the GNU code profiling utility.
Real-time doppler simulation ● M. KHOSHNIAT et al. 523
RESULTS
Effect of sample volume geometryTo determine first the effect of sample volume ge-
ometry independently of other factors, including ISB, wecompared spectrograms simulated using the oblate sphe-roidal and spherical sample volumes, with a high sam-pling density of N � 10 000 points. As Fig.2 demon-strates, there was a negligible effect of sample volumegeometry on spectrograms from the three representativelocations and so all subsequent results were generatedusing the more convenient spherical sample volume.
Effect of intrinsic spectral broadeningUp until this point, the effects of ISB have not been
considered, the impact of which is clearly evidenced bythe unrealistically discrete CCA spectra seen in Fig. 2.To first demonstrate the validity of our ISB modelingapproach, in Fig. 3 we show the power vs. frequency dataacquired experimentally from the middle of the tubeunder conditions of fully developed steady flow at 5, 10,15 and 20 mL/s. The spectral mean velocities derivedfrom these data were, respectively, 7.95, 15.9, 22.4 and30.3 cm/s, all within 6% of the nominal values calculatedunder the assumption of parabolic flow. As Fig. 3 clearlydemonstrates, using the parameters defined by the exper-imental set-up (i.e., W � 6.4 mm, F � 2.1 mm and � �
Fig. 2. Effect of sample volume geometry on simulated DUSspectrograms from the three locations identified in Fig. 1.Spectra were sampled using N � 10 000 points per samplevolume and are displayed with a temporal resolution of 11.6 msand a velocity resolution of 1.33 cm/s, to match the experimen-tal acquisition. For each spectrum (i.e., vertical line), the powerwas normalized by the respective total spectral power and
color-coded to the same relative power levels in all cases.
60°), spectra simulated for the matching flow conditionswere in excellent agreement with the experimentallyderived data, in terms of both the spectral shapes andnormalized spectral amplitudes. These parameters andbroadening function were subsequently used for all DUSsimulations.
The impact of now including ISB for the DUSsimulations of nonaxial flow is readily apparent by com-paring the left panel of Fig. 4 with the right panel of Fig.2. Specifically, the unrealistic discreteness of spectrafrom the mostly velocity-gradient-free center of the CCAwas eliminated, whereas only a modest change was seenin spectra from the other locations, which have morepronounced spatial velocity gradients.
Effect of sampling densityFigure 4 also demonstrates the effect of sample
point density on the simulated spectrograms. In particu-lar, down to about N � 1000, there was no perceptiblechange in the appearance of the spectrograms. With acoarser sampling of N � 100, and more so for N � 10,discretization was introduced in the jet and recirculationspectra, whereas the velocity gradient-free CCA spectraremained mostly unaffected. As Table 1 makes clear,however, clinically relevant frame rates were achievedfor N � 1000, demonstrating that real-time DUS simu-lations are possible, even for relatively fine sample pointdensities. The remaining results were, therefore, gener-ated using N � 1000 sampling points.
Comparison with experimental dataFigure 5 provides a direct comparison of simulated
Fig. 3. Simulated vs. measured spectra derived from the centerof a straight tube under conditions of fully developed steadyflow, for the flow rates indicated. The four frequencies identi-fied on the x-axis are those expected from parabolic flow based
upon the respective nominal flow rate and tube diameter.
spectrograms with matched experimental data. In partic-

d spec
524 Ultrasound in Medicine and Biology Volume 31, Number 4, 2005
ular, the temporally varying details of the spectral enve-lope and, especially, the distribution of the (intensity-coded) relative powers were remarkably well predictedby the DUS simulations. For example, the intrinsicallybroadened, but still evident, discreteness of the CCAspectra predicted during the acceleration and decelera-tion phases was apparent in the measured spectra. More-over, the complex spectral patterns measured in the dy-namic recirculation zone were well predicted numeri-cally. In fact, as we discuss later, the main differencesbetween the simulated and measured spectra (namely,overprediction of CCA and jet peak systolic amplitudes)may be attributed to the challenges of exactly matchinga numerical model to experimental conditions, ratherthan to inherent deficiencies in the DUS simulation.
Fig. 4. Effect of point sampling density (N) on simulate
Table 1. Performance of DUS spectrogram simulations on a1.5 GHz AMD Athlon workstation
NAverage time
(ms)Frame rate
(Hz)
10,000 9121 91000 917 86100 99 80010 14 5600
Average time refers to the CPU time required to generate an indi-vidual spectrogram for one cardiac cycle, based on averaging thetimings from 100 locations distributed throughout the CFD modeldomain. Frame rate refers to the estimated frame rate at which the
simulated spectra could be displayed, based on dividing number ofspectra per cardiac cycle (79 in the present case) by the average time.Finally, to demonstrate that indices derived fromthese spectra were well predicted throughout the modeldomain, Fig. 6 compares color-coded (i.e., pseudo-CDUS) images of experimentally and numerically de-rived spectral indices, from spectra sampled at 1 mmincrements on the central plane of the 3-D model, at atime 20 ms after peak systole. Generally, good agree-ment was seen in the overall distribution of peak andmean spectral velocities; however, again, differences invelocity magnitude were apparent, for reasons to bediscussed later. On the other hand, by virtue of its defi-nition as a velocity ratio, SBI should be less susceptibleto differences between the CFD and experimental veloc-ity fields and this is, in fact, confirmed by the excellentagreement between the simulated and measured SBImagnitudes.
DISCUSSION AND CONCLUSIONS
We have demonstrated that our semiempirical ap-proach is sufficient for simulating DUS spectra in thepresence of physiologically, pulsatile nonaxial flow dy-namics. In particular, we have shown, for the first time,that discrete sampling of a CFD velocity field, weightedby a Gaussian power distribution, is sufficient to capturethe spectral broadening due to the interaction betweenthe velocity gradients and a finite sample volume. Addi-tionally, convolution with an analytically-derived veloc-ity-dependent spread function was sufficient to model theeffects of intrinsic spectral broadening. Significantly,
trograms. Refer to caption of Fig. 2 for further details.
real-time performance could be achieved even for a

Real-time doppler simulation ● M. KHOSHNIAT et al. 525
relatively high sampling density of N � 1000 samplingpoints, beyond which further increases had a negligibleeffect on the appearance of the simulated spectrograms.Furthermore, we showed that modest asymmetry in theshape of the sample volume had little effect on thederived spectra, supporting the continued use of a spher-ical geometry, which is particularly convenient for the
Fig. 5. Comparison of simulated vs. measured spectrograms.The wall-filtering evident in the measured spectrograms wassimulated by setting power to zero within the two velocity binsabove and below 0 cm/s, to match the manner in which theexperimental data were postprocessed. The intensity of eachspectral line was then renormalized to the subsequent respec-tive total spectral power for both the simulations and in vitro
experiments.
Fig. 6. Comparison of simulated vs. measured pseudo-Cspectral broadening index (SBI), derived, respectively, f
central plane. The time-point selected for this compa
development of closed-form solutions incorporating an-alytically defined flows (e.g., Bastos et al. 2000). Al-though not reported in the Results, we also consideredlinear and quartic forms of the ISB function for a fixedbandwidth and observed little difference in the resultingsimulated spectra, consistent with the recent findings ofThompson and Aldis (2002) for the simpler case of axialflow. Finally, although the present study was carried outusing an idealization of a stenosed carotid bifurcation,the distinct changes in the character of the simulatedspectrograms in moving from the CCA to the stenotic jetto the poststenotic recirculation zone mirrored those typ-ically observed in vivo (e.g., Oates 2001, Fig. 3.24).
The simulated spectrograms indeed demonstratedexcellent agreement with the corresponding experimen-tally derived spectrograms, particularly with respect tothe spectral envelopes and relative power distributions.Simulated pseudo-CDUS images also agreed well; how-ever, we note that no attempt was made here to simulateCDUS images in real time. Nevertheless, our data sug-gest that this too should be possible. Consider, for ex-ample, a 3 � 3 cm2 CDUS field-of-view displayed at aspatial resolution of, say, 2 � 1 mm2 (Evans et al. 1989).This would require the simulation of 450 spectra withinabout 0.1 s to generate a single CDUS image at clinicallyrelevant frame rate. At a sampling density of N � 1000,this would obviously preclude real-time performance.Table 1 suggests, however, that real-time performancecould be achieved by reducing the number of samplingpoints to around N � 10, which Fig. 4 suggests wouldhave little impact on the derived spectral indices and,hence, the fidelity of the simulated CDUS display. Pre-liminary data, not shown here in the interest of space,does suggest that sufficiently realistic CDUS images can
mages of spectral peak and mean velocity (in cm/s) andmulated and measured spectra acquired on the model’s
DUS irom si
rison corresponds to 20 ms after peak systole.
526 Ultrasound in Medicine and Biology Volume 31, Number 4, 2005
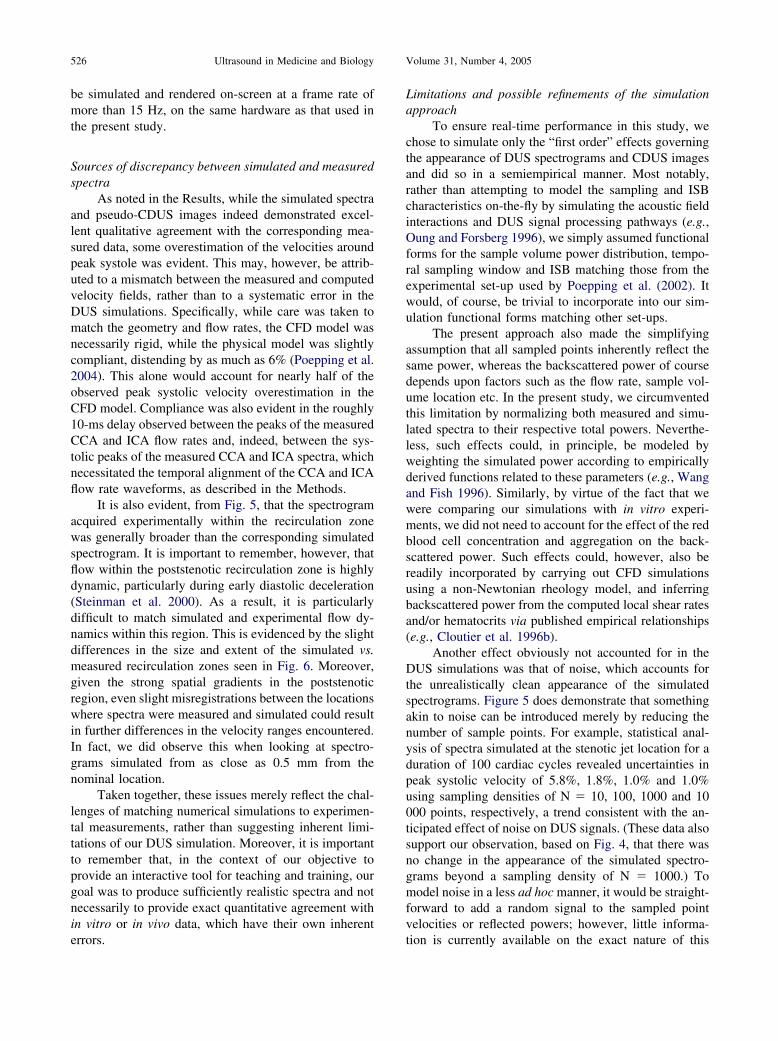
be simulated and rendered on-screen at a frame rate ofmore than 15 Hz, on the same hardware as that used inthe present study.
Sources of discrepancy between simulated and measuredspectra
As noted in the Results, while the simulated spectraand pseudo-CDUS images indeed demonstrated excel-lent qualitative agreement with the corresponding mea-sured data, some overestimation of the velocities aroundpeak systole was evident. This may, however, be attrib-uted to a mismatch between the measured and computedvelocity fields, rather than to a systematic error in theDUS simulations. Specifically, while care was taken tomatch the geometry and flow rates, the CFD model wasnecessarily rigid, while the physical model was slightlycompliant, distending by as much as 6% (Poepping et al.2004). This alone would account for nearly half of theobserved peak systolic velocity overestimation in theCFD model. Compliance was also evident in the roughly10-ms delay observed between the peaks of the measuredCCA and ICA flow rates and, indeed, between the sys-tolic peaks of the measured CCA and ICA spectra, whichnecessitated the temporal alignment of the CCA and ICAflow rate waveforms, as described in the Methods.
It is also evident, from Fig. 5, that the spectrogramacquired experimentally within the recirculation zonewas generally broader than the corresponding simulatedspectrogram. It is important to remember, however, thatflow within the poststenotic recirculation zone is highlydynamic, particularly during early diastolic deceleration(Steinman et al. 2000). As a result, it is particularlydifficult to match simulated and experimental flow dy-namics within this region. This is evidenced by the slightdifferences in the size and extent of the simulated vs.measured recirculation zones seen in Fig. 6. Moreover,given the strong spatial gradients in the poststenoticregion, even slight misregistrations between the locationswhere spectra were measured and simulated could resultin further differences in the velocity ranges encountered.In fact, we did observe this when looking at spectro-grams simulated from as close as 0.5 mm from thenominal location.
Taken together, these issues merely reflect the chal-lenges of matching numerical simulations to experimen-tal measurements, rather than suggesting inherent limi-tations of our DUS simulation. Moreover, it is importantto remember that, in the context of our objective toprovide an interactive tool for teaching and training, ourgoal was to produce sufficiently realistic spectra and notnecessarily to provide exact quantitative agreement within vitro or in vivo data, which have their own inherent
errors.Limitations and possible refinements of the simulationapproach
To ensure real-time performance in this study, wechose to simulate only the “first order” effects governingthe appearance of DUS spectrograms and CDUS imagesand did so in a semiempirical manner. Most notably,rather than attempting to model the sampling and ISBcharacteristics on-the-fly by simulating the acoustic fieldinteractions and DUS signal processing pathways (e.g.,Oung and Forsberg 1996), we simply assumed functionalforms for the sample volume power distribution, tempo-ral sampling window and ISB matching those from theexperimental set-up used by Poepping et al. (2002). Itwould, of course, be trivial to incorporate into our sim-ulation functional forms matching other set-ups.
The present approach also made the simplifyingassumption that all sampled points inherently reflect thesame power, whereas the backscattered power of coursedepends upon factors such as the flow rate, sample vol-ume location etc. In the present study, we circumventedthis limitation by normalizing both measured and simu-lated spectra to their respective total powers. Neverthe-less, such effects could, in principle, be modeled byweighting the simulated power according to empiricallyderived functions related to these parameters (e.g., Wangand Fish 1996). Similarly, by virtue of the fact that wewere comparing our simulations with in vitro experi-ments, we did not need to account for the effect of the redblood cell concentration and aggregation on the back-scattered power. Such effects could, however, also bereadily incorporated by carrying out CFD simulationsusing a non-Newtonian rheology model, and inferringbackscattered power from the computed local shear ratesand/or hematocrits via published empirical relationships(e.g., Cloutier et al. 1996b).
Another effect obviously not accounted for in theDUS simulations was that of noise, which accounts forthe unrealistically clean appearance of the simulatedspectrograms. Figure 5 does demonstrate that somethingakin to noise can be introduced merely by reducing thenumber of sample points. For example, statistical anal-ysis of spectra simulated at the stenotic jet location for aduration of 100 cardiac cycles revealed uncertainties inpeak systolic velocity of 5.8%, 1.8%, 1.0% and 1.0%using sampling densities of N � 10, 100, 1000 and 10000 points, respectively, a trend consistent with the an-ticipated effect of noise on DUS signals. (These data alsosupport our observation, based on Fig. 4, that there wasno change in the appearance of the simulated spectro-grams beyond a sampling density of N � 1000.) Tomodel noise in a less ad hoc manner, it would be straight-forward to add a random signal to the sampled pointvelocities or reflected powers; however, little informa-
tion is currently available on the exact nature of this
Real-time doppler simulation ● M. KHOSHNIAT et al. 527
randomness. Physiological “noise” due to normal cycle-to-cycle variations in heart and flow rates could also besimulated by introducing appropriately scaled randomfluctuations (e.g., Holdsworth et al. 1999) to the other-wise periodic CFD velocity field. Similarly, the effect ofturbulence on backscattered power could be modeled byexploiting published empirical relationships (e.g., Clou-tier et al. 1996a) and by adding to the sampled pointvelocities a random component scaled by the CFD-de-rived local turbulence intensity. It is important to note,however, that CFD modeling of physiologically pulsatileturbulent flow is in its relative infancy (e.g., Vargheseand Frankel 2003; Ryval et al. 2004), which is why wewere restricted here to the case of flow through a mildstenosis.
Finally, in this study, we intentionally used a lessthan state-of-the-art, economical workstation to performour simulations, in order clearly to demonstrate that ourDUS simulations did not require sophisticated computa-tional hardware. In addition to Moore’s eponymous lawregarding the rate at which CPU speeds will double, thediscrete nature of our simulations renders them ideallysuited for parallelization. As such, it is likely that real-time performance will be maintained in spite of the extracomputational effort required to incorporate future re-finements, such as those noted above.
Conclusions and future directionsWe have shown, for the first time, that the complex
interaction between Doppler ultrasound and complicatedclinically relevant blood flow dynamics can be simulatedin real time via a relatively straightforward semiempiri-cal approach. Furthermore, we have proposed a numberof ways in which the realism of these simulations may beimproved without necessarily sacrificing real-time per-formance. Current efforts are also aimed at simulatingthe Doppler interface as it is used in the clinic, bycoupling the real-time DUS simulator to a magneticallytracked hand-held probe. When coupled to anatomicallyrealistic CFD models (Steinman 2002), such real-timeand interactive “virtual Doppler ultrasound” would pro-vide a powerful interface for training sonographers andradiologists to recognize better how complex flow dy-namics are manifested in the appearance of DUS dataand, more generally, to teach basic DUS principles.Moreover, with ongoing refinements, virtual DUS couldone day serve as an efficient and economical computa-tional platform for developing and testing the next gen-eration of DUS technologies.
Acknowledgments—This work was funded by NSERC grant no. RG-PIN-249746-02 (DAS) and Heart and Stroke Foundation grant no.T-5135 (DWH). DAS and DWH are Career Investigators, supported by
the Heart and Stroke Foundation. MK and MLT were supported in partby the CIHR Group in Vascular Imaging (GR-14973).REFERENCES
Bastos CA, Fish PJ, Steel R, Vaz F. Doppler power spectrum from aGaussian sample volume. Ultrasonics 2000;37:623–632.
Censor D, Newhouse VL, Vontz T, Ortega HV. Theory of ultrasoundDoppler-spectra velocimetry for arbitrary beam and flow configu-rations. IEEE Trans Biomed Eng 1988;35:740–751.
Cloutier G, Allard L, Durand LG. Characterization of blood flowturbulence with pulsed-wave and power Doppler ultrasound imag-ing. J Biomech Eng 1996a;118:318–325.
Cloutier G, Qin Z, Durand LG, Teh BG. Power Doppler ultrasoundevaluation of the shear rate and shear stress dependences of redblood cell aggregation. IEEE Trans Biomed Eng 1996b;43:441–450.
Ethier CR, Prakash S, Steinman DA, et al. Steady flow separationpatterns in a 45 degree junction. J Fluid Mech 2000;411:1–38.
Ethier CR, Steinman DA, Ojha M. Comparisons between computa-tional hemodynamics, photochromic dye flow visualization andmagnetic resonance velocimetry. In: Xu XY, Collins MW, eds. Thehaemodynamics of arterial organs—comparison of computationalpredictions with in vivo and in vitro data. Southampton: WIT Press,1999:131–183.
Evans DH, McDicken WN, Skidmore R, Woodcock JP. Doppler ul-trasound: Physics, instrumentation and clinical applications, 2nded. Chichester: John Wiley & Sons, 1989.
Fish PJ. Nonstationarity broadening in pulsed Doppler spectrum mea-surements. Ultrasound Med Biol 1991;17:147–155.
Guidi G, Newhouse VL, Tortoli P. Doppler spectrum shape analysisbased on the summation of flow-line spectra. IEEE Trans UltrasonFerroelectr Freq Control 1995;42:907–915.
Hoeks AP, Ruissen CJ, Hick P, Reneman RS. Methods to evaluate thesample volume of pulsed Doppler systems. Ultrasound Med Biol1984;10:427–434.
Holdsworth DW, Norley CJ, Frayne R, Steinman DA, Rutt BK. Char-acterization of common carotid artery blood-flow waveforms innormal human subjects. Physiol Meas 1999;20:219–240.
Jones SA, Giddens DP. A simulation of transit time effects in Dopplerultrasound signals. Ultrasound Med Biol 1990;16:607–619.
Kerr AT, Hunt JW. A method for computer simulation of ultrasoundDoppler color flow images. I. Theory and numerical method. Ul-trasound Med Biol 1992;18:861–872.
Khoshniat M, Stuhne GR, Steinman DA. Relative performance ofgeometric search algorithms for interpolating unstructured meshdata. Lecture Notes Comput Sci 2003;2879:391–398.
Löhner R. Robust, vectorized search algorithms for interpolation onunstructured grids. J Comput Phys 1995;118:380–387.
Mo LY, Cobbold RS. A stochastic model of the backscattered Dopplerultrasound from blood. IEEE Trans Biomed Eng 1986;33:20–27.
Oates C. Cardiovascular haemodynamics and Doppler waveforms ex-plained. Cambridge: Cambridge University Press, 2001.
Oung H, Forsberg F. Doppler ultrasound simulation model for pulsatileflow with nonaxial components. Ultrason Imaging 1996;18:157–172.
Poepping TL, Nikolov HN, Rankin RN, Lee M, Holdsworth DW.An in vitro system for Doppler ultrasound flow studies in thestenosed carotid artery bifurcation. Ultrasound Med Biol 2002;28:495–506.
Poepping TL, Nikolov HN, Thorne ML, Holdsworth DW. A thin-walled carotid vessel phantom for Doppler ultrasound flow studies.Ultrasound Med Biol 2004;30:1067–1078.
Routh HF, Law YF, Mo LY, et al. Role of models in understanding andinterpreting clinical Doppler ultrasound. Med Prog Technol 1989;15:155–169.
Ryval J, Straatman AG, Steinman DA. Two-equation turbulence mod-eling of pulsatile flow in a stenosed tube. J Biomech Eng 2004;126:625–635.
Smith RF, Rutt BK, Fox AJ, Rankin RN, Holdsworth DW. Geometriccharacterization of stenosed human carotid arteries. Acad Radiol
1996;3:898–911.
528 Ultrasound in Medicine and Biology Volume 31, Number 4, 2005
Steinman DA. Image-based computational fluid dynamics modeling inrealistic arterial geometries. Ann Biomed Eng 2002;30:483–497.
Steinman DA, Poepping TL, Tambasco M, Rankin RN, Holdsworth DW.Flow patterns at the stenosed carotid bifurcation: effect of concentricversus eccentric stenosis. Ann Biomed Eng 2000;28:415–423.
Tambasco M, Steinman DA. Path-dependent hemodynamics of the ste-nosed carotid bifurcation. Ann Biomed Eng 2003;31:1054–1065.
Thompson RS, Aldis GK. Flow spectra from spectral power densitycalculations for pulsed Doppler. Ultrasonics 2002;40:835–841.
van Leeuwen GH, Hoeks AP, Reneman RS. Simulation of real-time
frequency estimators for pulsed Doppler systems. Ultrason Imaging1986;8:252–271.
Varghese SS, Frankel SH. Numerical modeling of pulsatile turbulentflow in stenotic vessels. J Biomech Eng 2003;125:445–460.
Wang Y, Fish PJ. Comparison of Doppler signal analysis techniquesfor velocity waveform, turbulence and vortex measurement: Asimulation study. Ultrasound Med Biol 1996;22:635–649.
Wilkerson PW, Levine RA, Yoganathan AP. Quantification of mitralregurgitation using corrected Doppler measurements. J Biomech
Eng 1999;121:273–280.