Predicting the intention to quit smoking: A comparative study among Spanish and Norwegian students
Upload
khangminh22Category
view
0download
0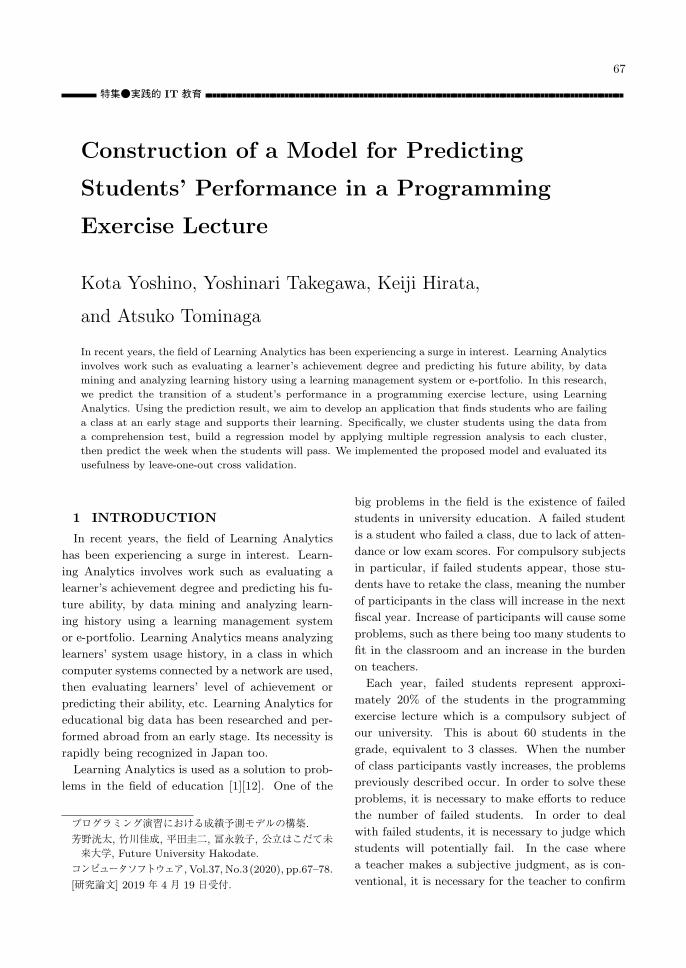
Sanshusha pLATEX2ε: 10_yoshino : 2020/7/13(11:18)
67
特集●実践的 IT 教育
Construction of a Model for Predicting
Students’ Performance in a Programming
Exercise Lecture
Kota Yoshino, Yoshinari Takegawa, Keiji Hirata,
and Atsuko Tominaga
In recent years, the field of Learning Analytics has been experiencing a surge in interest. Learning Analytics
involves work such as evaluating a learner’s achievement degree and predicting his future ability, by data
mining and analyzing learning history using a learning management system or e-portfolio. In this research,
we predict the transition of a student’s performance in a programming exercise lecture, using Learning
Analytics. Using the prediction result, we aim to develop an application that finds students who are failing
a class at an early stage and supports their learning. Specifically, we cluster students using the data from
a comprehension test, build a regression model by applying multiple regression analysis to each cluster,
then predict the week when the students will pass. We implemented the proposed model and evaluated its
usefulness by leave-one-out cross validation.
1 INTRODUCTION
In recent years, the field of Learning Analytics
has been experiencing a surge in interest. Learn-
ing Analytics involves work such as evaluating a
learner’s achievement degree and predicting his fu-
ture ability, by data mining and analyzing learn-
ing history using a learning management system
or e-portfolio. Learning Analytics means analyzing
learners’ system usage history, in a class in which
computer systems connected by a network are used,
then evaluating learners’ level of achievement or
predicting their ability, etc. Learning Analytics for
educational big data has been researched and per-
formed abroad from an early stage. Its necessity is
rapidly being recognized in Japan too.
Learning Analytics is used as a solution to prob-
lems in the field of education [1][12]. One of the
プログラミング演習における成績予測モデルの構築.
芳野洸太, 竹川佳成, 平田圭二, 冨永敦子, 公立はこだて未来大学, Future University Hakodate.
コンピュータソフトウェア, Vol.37, No.3(2020), pp.67–78.
[研究論文] 2019 年 4 月 19 日受付.
big problems in the field is the existence of failed
students in university education. A failed student
is a student who failed a class, due to lack of atten-
dance or low exam scores. For compulsory subjects
in particular, if failed students appear, those stu-
dents have to retake the class, meaning the number
of participants in the class will increase in the next
fiscal year. Increase of participants will cause some
problems, such as there being too many students to
fit in the classroom and an increase in the burden
on teachers.
Each year, failed students represent approxi-
mately 20% of the students in the programming
exercise lecture which is a compulsory subject of
our university. This is about 60 students in the
grade, equivalent to 3 classes. When the number
of class participants vastly increases, the problems
previously described occur. In order to solve these
problems, it is necessary to make efforts to reduce
the number of failed students. In order to deal
with failed students, it is necessary to judge which
students will potentially fail. In the case where
a teacher makes a subjective judgment, as is con-
ventional, it is necessary for the teacher to confirm
Sanshusha pLATEX2ε: 10_yoshino : 2020/7/13(11:18)
68 コンピュータソフトウェア
students’ test scores and submission results by him-
self/herself. In this method, when the number of
students increases, the labor of confirmation by the
teacher becomes enormous and it is unclear how
high or low the possibility of students failing is.
In this paper, we aim to construct a model that
predicts the transition of a student’s performance
by practicing Learning Analytics, targeting the pro-
gramming exercise lecture which is a compulsory
subject of our university. It is thought that by pre-
senting this prediction result to teachers and stu-
dents, and developing an application that supports
comprehension of grades, we can contribute to the
reduction of failed students.
In the targeted lecture, a condition of credit cer-
tification is that students pass the comprehension
degree confirmation test (hereafter, comprehension
test). The comprehension test is a quiz that is car-
ried out every week in the lecture. There are four
kinds of question in this test, and a student can
pass by correctly answering each kind of question
two times. In this paper, we propose a model that
predicts the week in which each student will pass
(Pass week), using the data of the comprehension
test.
2 RELATED WORKS
According to the Journal of Learning Analyt-
ics, Learning Analytics can be divided into four
topics[3][4][5][6][9][10][11][13][14]: ‘Understanding
Learning’ (analysis of factors of effective learning
environments)[4][5], ‘Improving Learning’ (research
with the aim of improving curricula and learning
materials)[3][9], ‘Meta-Issues’ (research related to
privacy and logic)[11][14] and ‘Tracing Learning’
(analysis of multimodal learning processes, visual-
ization of data, etc.)[6][10][13].
In our research, we carry out pass/fail prediction
from students’ test data, aiming towards early de-
tection of students who have a high possibility of
failing. From the point that it estimates the value
of the target valuable (objective variable) from sev-
eral parameters with differing properties (explana-
tory variable), our research is designated as belong-
ing to ‘Tracing Learning’. The novelty of our re-
search is that it does not predict grades, such as A
or B, in a subject, but focuses on assignments and
tests conducted in one subject to predict grades ev-
ery two weeks, in a gradual manner.
Ito et al. carried out grade prediction using at-
tendance data, number of submissions (of assign-
ments) and value of submissions, obtained by intro-
ducing an IC card attendance management system
and course management system [7]. The submis-
sion value of an assignment represents the speed
of submitting the assignment, wherein the value
is set to 1 at the time the submission is accepted
and 0 at the time of the submission deadline. In
this method, the earlier the task is submitted, the
higher the value. In the case of no submission,
the value is set to −1. A trend has been observed
whereby the higher the submission value is, the bet-
ter a student’s grades, so this method is considered
to be effective as one index for prediction [8]. Re-
garding the result of this research, it is said that the
grades of a large number of students are entirely or
almost consistent with predictions, thus confirming
the effectiveness of prediction. However, the per-
formance of grade prediction by this method can
only be evaluated on prediction results using data
from 11 times (the number of times the class has
been conducted). Regarding the grades predicted
using data from 7 times, these cannot be evalu-
ated because there is no final result data for the
case in which an ability-specific task was not im-
plemented. In our research, we evaluate prediction
performance according to the amount of data used
for prediction. In the results of Ito et al., there were
cases where students who were predicted to pass ul-
timately failed. In our research, we aim to identify
failed students from the comprehension test, so we
aim not to overlook students who have poor grades.
3 TARGET LECTURE
In this paper, we cover the programming exercise
lecture implemented at our university. In the target
lecture, we deal with Processing language and learn
the basics of programming. The lecture time is 90
minutes per single session and there are 14 sessions
in the second half of the semester. Many partic-
ipating students are first graders who experience
programming for the first time. From the second
week onwards, we conduct a comprehension test
that is divided into four categories from Category
1 to Category 4 for each unit. In the target lecture,
we do not use an online learning system, the com-
Sanshusha pLATEX2ε: 10_yoshino : 2020/7/13(11:18)
Vol. 37 No. 3 Aug. 2020 69
Table 1 Contents of each Category
Category Contents
Category1 Rectangular drawings, numerical calculation and variables declaration
Category2 Conditional branch syntax
Category3 Repetition syntax
Category4 Array and function definition
!"#$%&'&(")*"'+&$,'$&-"'./&$.)&
-#'*)0'1/&.#$,#0&$,%&.#0-).2&3/#0*&
/4/$%+&5'"#'61%/7
83%/$#)0&)0&"%9$'0*31'"&-"'.#0*/ :&
;<&$,%&5'"#'61%&0&#/&)<&$4(%�$2&.,'$&#/&
$,%&5'13%&)<&0&'<$%"&$,%&<)11).#0*&
(")*"'+&%=%93$#)0>
83%/$#)0&)0&03+%"#9'1&9'1931'$#)0 :&
0&?&@A&B&C&D&@E&F&C&G
HI'$%*)"4&@
Fig. 1 Example of Category1
!"#!$"%"#&'"$'()#&'$"#*"+#&,#-)'*"./"
012'",!0 #!$"3#+'"*.%'"+#)4'5"60"03,*"
0,%'7"(&'#0'"#"2&.8&#%"03#0"&'2)#('*"
03'"+#)4'"./"%"9,03"03&''"0,%'*"03'"
.&,8,!#)"+#)4'"./"%".!)1"93'!"!",*"#"
!'8#0,+'"+#)4'5
:;#0'8.&1"<
=4'*0,.!".!"(.!$,0,.!#)"-&#!(3"*1!0#> ?"
Fig. 2 Example of Category2
!"#$%#&$&'"()"$*&%+$%&,-.,%/%-%#,&%+#&
0$"/$.1#&2&/3&%+#&("4#"&56&76&86&976&956&
:(*'1#*#3%/3)&%+#&;(11(</3)=
> !$%#)("?&@
/3%&/&6&&2&A
;("&B&/&C&5&A&&&&&&&&&&&&&&&&& A&&&&&&&&&&&&& D&E
2&C&/&A
F
G-#,%/(3&(3&"#'#%/%/(3&,?3%$2&H&
Fig. 3 Example of Category3
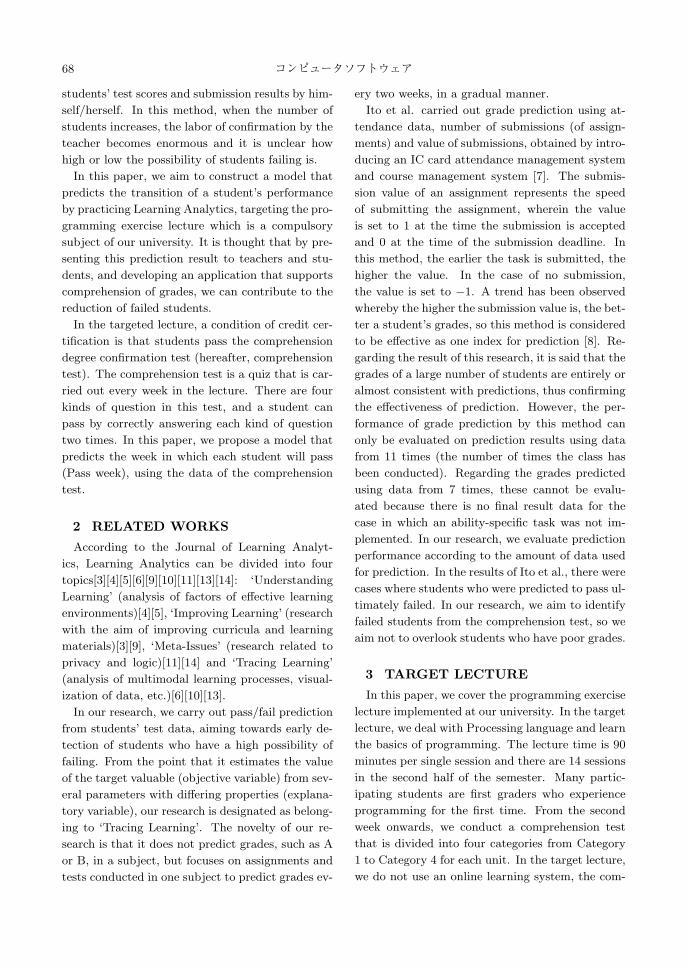
prehension test is a written exam. The number of
questions is 3 or 4, and the contents and example
questions of each category are shown in Table 1 and
Figures 1 to 4 respectively.
The credit certification (pass) condition of the
!"#$%&'%$"(%')*%#+$(,%$"(%+-..-/&01%
2,-1,#*%(3(4)$&-05
6)('$&-0%-0%#,,#7 8%
&0$%')*%9%:%;%%&%<
&0$%=>%?#$#%9%0(/%&0$%=@::>%<
+-,%A%&%9%:%<%&%B%@::%<%&%9%&%C%@%D%E
?#$#%=&>%9%&%F%&%<
G
+-,%A%&%9%H:%<%&%B%@::%<%&%9%&%C%IJ%D%E
')*%9%')*%C%?#$#%=&>%<
G
K&L(0%$/-%#,1)*(0$'%-+%$72(%&0$;%M%
#0?%N;%?(+&0(%#%+)04$&-0%$"#$%,($),0'%
$"(%')*%-+%M%#0?%NO
PQ#$(1-,7%R
6)('$&-0%-0%+)04$&-0%?(+&0&$&-0 8%
Fig. 4 Example of Category4
target lecture is to correctly answer all the ques-
tions from each of the categories 1 to 4 two times
over the course of the comprehension tests. All cat-
egories do not have to be correctly answered at the
same time, i.e. even if only one category is fully
correctly answered on a certain test, this counts
as one time for that category. Hereafter, answering
all the questions correctly is referred to as ‘complet-
ing’. Thus, if any one of Category 1 to Category
4 cannot be completed twice, the unit is unquali-
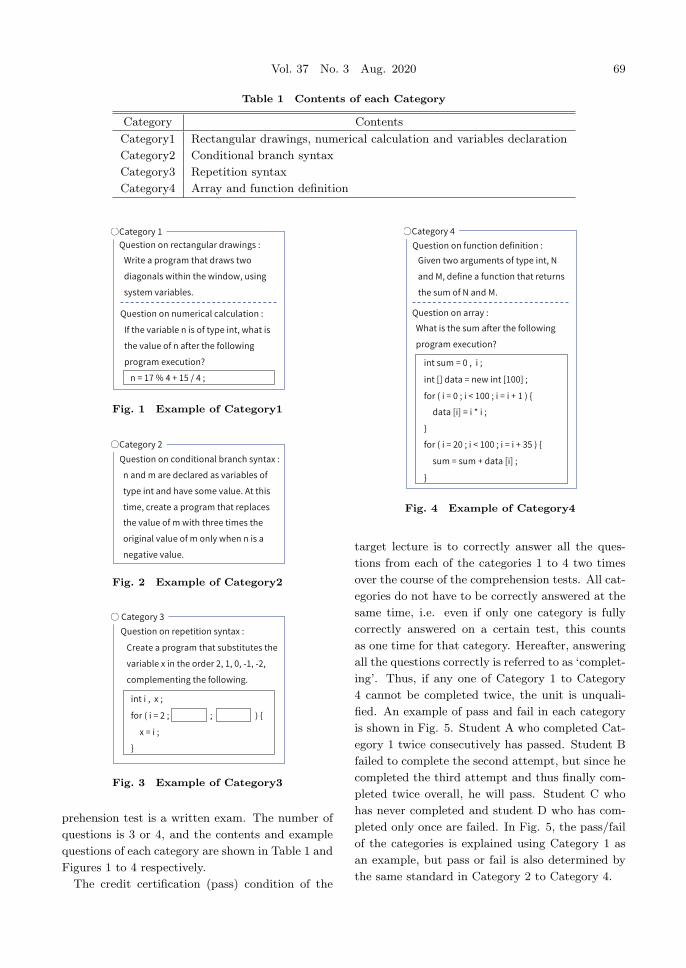
fied. An example of pass and fail in each category
is shown in Fig. 5. Student A who completed Cat-
egory 1 twice consecutively has passed. Student B
failed to complete the second attempt, but since he
completed the third attempt and thus finally com-
pleted twice overall, he will pass. Student C who
has never completed and student D who has com-
pleted only once are failed. In Fig. 5, the pass/fail
of the categories is explained using Category 1 as
an example, but pass or fail is also determined by
the same standard in Category 2 to Category 4.
Sanshusha pLATEX2ε: 10_yoshino : 2020/7/13(11:18)
70 コンピュータソフトウェア
Fig. 5 Pass Condition of a Category
Table 2 Weeks and Number of Times Each
Test
Week Category1 Category2 Category3 Category4
1 - - - -
2 1st - - -
3 2nd 1st - -
4 3rd 2nd 1st -
5 - 3rd 2nd 1st
6 4th - 3rd 2nd
7 - 4th - 3rd
8 5th - 4th 4th
9 - 5th 5th 5th
10 6th 6th - -
11 - - 6th 6th
12 - - 7th 7th
13 7th 7th 8th 8th
14 8th 8th 9th 9th
The comprehension test is carried out at the be-
ginning of the lecture from the second week on-
wards, and the time required for one test is approx-
imately 7 minutes. The test questions are different
every week, and the same question is not used twice
during the course year. The number of implementa-
tions of the comprehension test is 13 in total, from
the 2nd week to the 14th week. However, we have
an irregular embodiment whereby we do not imple-
ment all the categories each week. A summary of
the weeks and number of times the test is carried
out is shown in Table 2. The total number of times
of implementation is also different for each cate-
gory, being 8 for Category 1 and Category 2, and 9
for Category 3 and Category 4. Also, in each cat-
egory, completing twice means the student passes
the target category. In addition, it is established
that a student does not have to answer questions
for a category that he/she has already passed.
Fig. 6 Explanatory Variables of Proposed
Model
4 Proposed Model
4. 1 Using Data
The data used are the data of a comprehension
test conducted in certain lectures from the 2015 fis-
cal year to the 2017 fiscal year. We have obtained
permission from the students concerning the use
and disclosure of these data for the purpose of re-
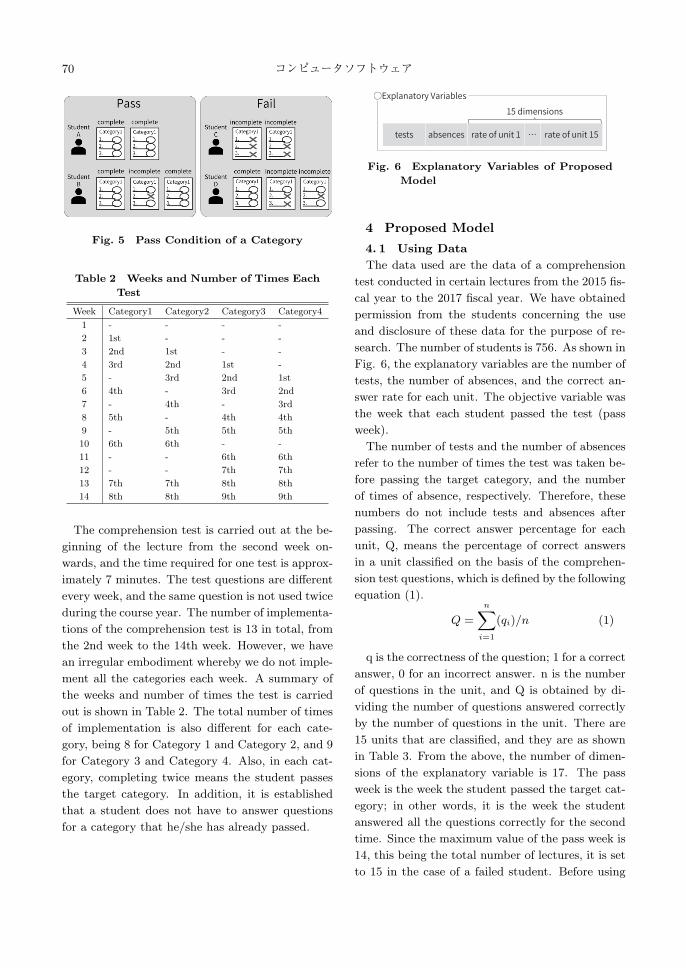
search. The number of students is 756. As shown in
Fig. 6, the explanatory variables are the number of
tests, the number of absences, and the correct an-
swer rate for each unit. The objective variable was
the week that each student passed the test (pass
week).
The number of tests and the number of absences
refer to the number of times the test was taken be-
fore passing the target category, and the number
of times of absence, respectively. Therefore, these
numbers do not include tests and absences after
passing. The correct answer percentage for each
unit, Q, means the percentage of correct answers
in a unit classified on the basis of the comprehen-
sion test questions, which is defined by the following
equation (1).
Q =
n∑i=1
(qi)/n (1)
q is the correctness of the question; 1 for a correct
answer, 0 for an incorrect answer. n is the number
of questions in the unit, and Q is obtained by di-
viding the number of questions answered correctly
by the number of questions in the unit. There are
15 units that are classified, and they are as shown
in Table 3. From the above, the number of dimen-
sions of the explanatory variable is 17. The pass
week is the week the student passed the target cat-
egory; in other words, it is the week the student
answered all the questions correctly for the second
time. Since the maximum value of the pass week is
14, this being the total number of lectures, it is set
to 15 in the case of a failed student. Before using
Sanshusha pLATEX2ε: 10_yoshino : 2020/7/13(11:18)
Vol. 37 No. 3 Aug. 2020 71
Table 3 List of Classified Units
Unit Contents
1 Rectangular drawings
2 Substitution
3 Variables declaration
4 Numerical calculation
5 Conditional expression of multiple determination
6 Conditional expression of division remainder
7 Conditional expression of range designation
8 Description of if statements
9 Fill-in-the-blank of while statements
10 Fill-in-the-blank of for statements
11 Fill-in-the-blank of for statements (1 place)
12 Array declaration
13 Substitution of array
14 Array calculation
15 Function definition
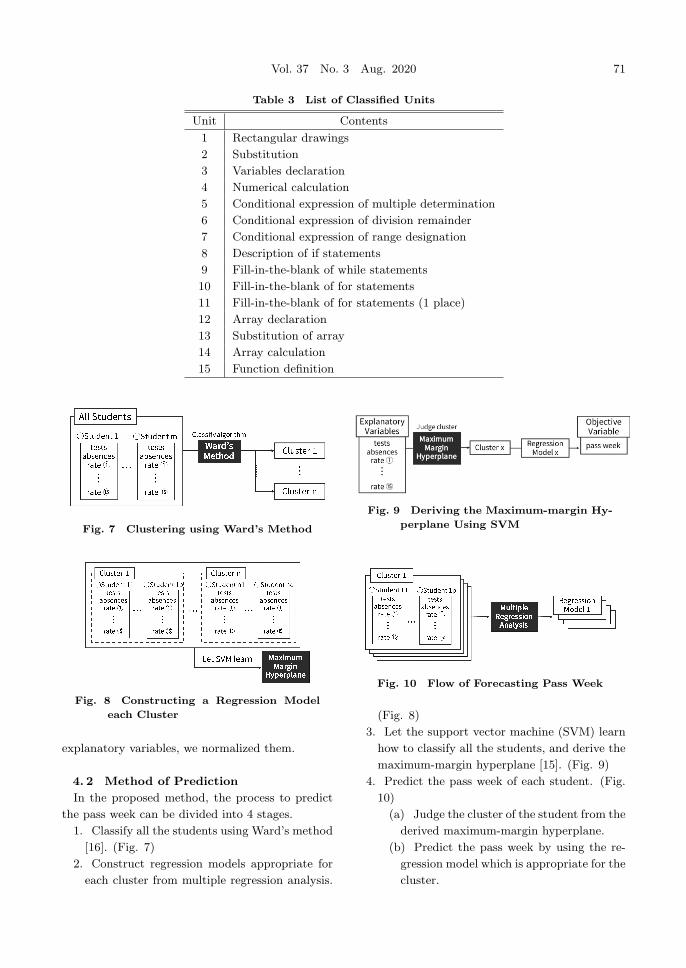
Fig. 7 Clustering using Ward’s Method
Fig. 8 Constructing a Regression Model
each Cluster
explanatory variables, we normalized them.
4. 2 Method of Prediction
In the proposed method, the process to predict
the pass week can be divided into 4 stages.
1. Classify all the students using Ward’s method
[16]. (Fig. 7)
2. Construct regression models appropriate for
each cluster from multiple regression analysis.
Fig. 9 Deriving the Maximum-margin Hy-
perplane Using SVM
Fig. 10 Flow of Forecasting Pass Week
(Fig. 8)
3. Let the support vector machine (SVM) learn
how to classify all the students, and derive the
maximum-margin hyperplane [15]. (Fig. 9)
4. Predict the pass week of each student. (Fig.
10)
(a) Judge the cluster of the student from the
derived maximum-margin hyperplane.
(b) Predict the pass week by using the re-
gression model which is appropriate for the
cluster.
Sanshusha pLATEX2ε: 10_yoshino : 2020/7/13(11:18)
72 コンピュータソフトウェア
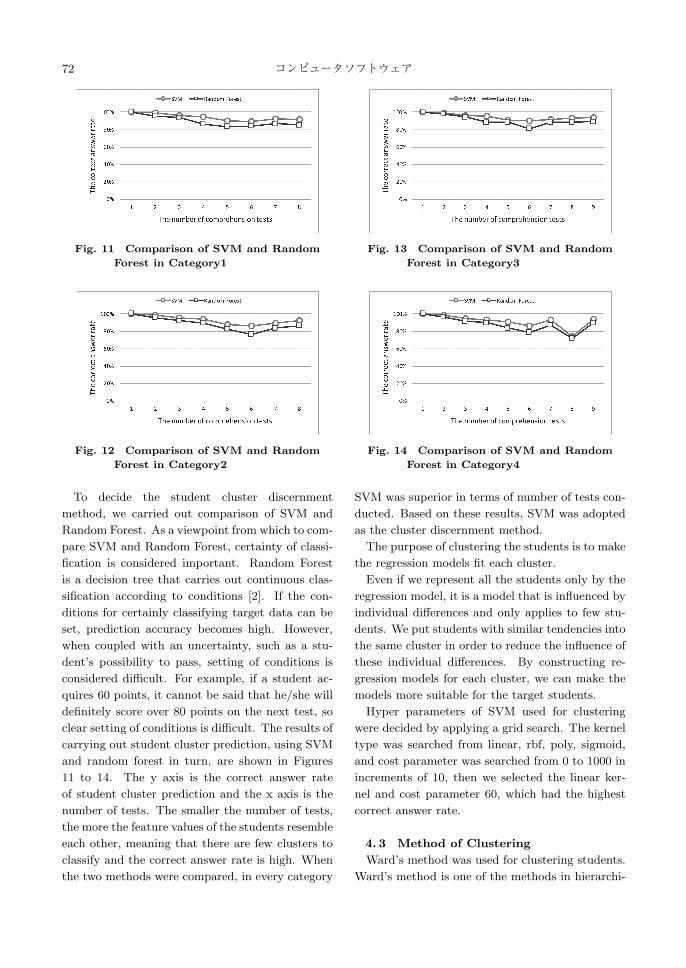
Fig. 11 Comparison of SVM and Random
Forest in Category1
Fig. 12 Comparison of SVM and Random
Forest in Category2
To decide the student cluster discernment
method, we carried out comparison of SVM and
Random Forest. As a viewpoint from which to com-
pare SVM and Random Forest, certainty of classi-
fication is considered important. Random Forest
is a decision tree that carries out continuous clas-
sification according to conditions [2]. If the con-
ditions for certainly classifying target data can be
set, prediction accuracy becomes high. However,
when coupled with an uncertainty, such as a stu-
dent’s possibility to pass, setting of conditions is
considered difficult. For example, if a student ac-
quires 60 points, it cannot be said that he/she will
definitely score over 80 points on the next test, so
clear setting of conditions is difficult. The results of
carrying out student cluster prediction, using SVM
and random forest in turn, are shown in Figures
11 to 14. The y axis is the correct answer rate
of student cluster prediction and the x axis is the
number of tests. The smaller the number of tests,
the more the feature values of the students resemble
each other, meaning that there are few clusters to
classify and the correct answer rate is high. When
the two methods were compared, in every category
Fig. 13 Comparison of SVM and Random
Forest in Category3
Fig. 14 Comparison of SVM and Random
Forest in Category4
SVM was superior in terms of number of tests con-
ducted. Based on these results, SVM was adopted
as the cluster discernment method.
The purpose of clustering the students is to make
the regression models fit each cluster.
Even if we represent all the students only by the
regression model, it is a model that is influenced by
individual differences and only applies to few stu-
dents. We put students with similar tendencies into
the same cluster in order to reduce the influence of
these individual differences. By constructing re-
gression models for each cluster, we can make the
models more suitable for the target students.
Hyper parameters of SVM used for clustering
were decided by applying a grid search. The kernel
type was searched from linear, rbf, poly, sigmoid,
and cost parameter was searched from 0 to 1000 in
increments of 10, then we selected the linear ker-
nel and cost parameter 60, which had the highest
correct answer rate.
4. 3 Method of Clustering
Ward’s method was used for clustering students.
Ward’s method is one of the methods in hierarchi-
Sanshusha pLATEX2ε: 10_yoshino : 2020/7/13(11:18)
Vol. 37 No. 3 Aug. 2020 73
cal cluster analysis [17]. In this method, the process
which merges the pair of clusters having the small-
est sum of squared deviations is repeated as long
as it satisfies the condition. The sum of squared
deviations S is the square of the difference from the
centroid of the cluster and is defined by the follow-
ing equation (2).
S =
n∑i=1
(xi − x)2 (2)
In this model, we set the condition that items
having a sum of squared deviation equal to or less
than 4.5 are grouped into the same cluster. For
the method to set the threshold, the value with
the highest prediction accuracy in all categories was
searched for and selected.
4. 4 Evaluation Method
We used leave-one-out cross validation for the
evaluation method and examined the correct an-
swer percentage of the prediction of the pass week.
In leave-one-out cross validation, we take one piece
of data from all the data as test data and regard the
remaining data as training data. Using the model
that has learned the training data, we predict the
pass week of the test data. Then, repeating this
process so that all data become test data once, eval-
uate by dividing the number of correct answers by
the total number of data.
If the value of the rounded-off prediction result
matched with the correct answer data, it was re-
garded as the correct answer. The pass week to be
predicted is a value from f to 14, wherein week f
is the earliest possible week students can pass, and
week 14 is the last week in which students can take
the test. Week f, that is the earliest week students
can pass, is different for each category, being week
3 in Category 1, week 4 in Category 2, week 5 in
Category 3, and week 6 in Category 4. As stated in
section 4. 1, the maximum value of the pass week is
14, and when a student fails it is set to 15. When
the prediction result is 15 or over, it is regarded
as failed, so if the prediction result is over 15, it is
changed to 15, and the correct answer rate is calcu-
lated. Similarly, if the prediction result is a value
less than f it is changed to f.
At the time of evaluation, we extracted the stu-
dent data with completely matching explanatory
variables, and evaluated the remaining data. If
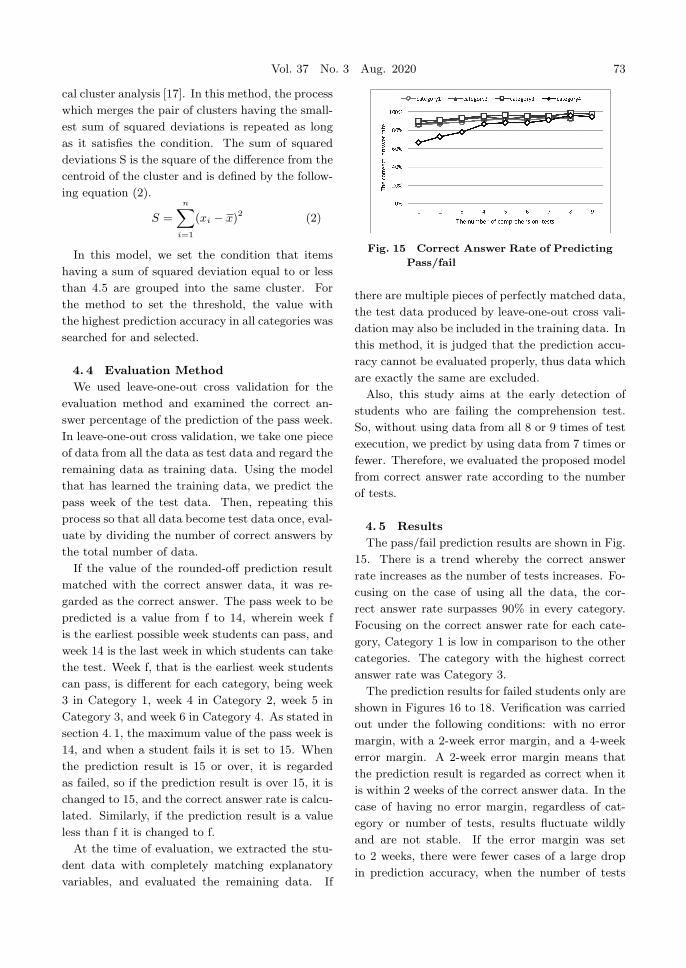
Fig. 15 Correct Answer Rate of Predicting
Pass/fail
there are multiple pieces of perfectly matched data,
the test data produced by leave-one-out cross vali-
dation may also be included in the training data. In
this method, it is judged that the prediction accu-
racy cannot be evaluated properly, thus data which
are exactly the same are excluded.
Also, this study aims at the early detection of
students who are failing the comprehension test.
So, without using data from all 8 or 9 times of test
execution, we predict by using data from 7 times or
fewer. Therefore, we evaluated the proposed model
from correct answer rate according to the number
of tests.
4. 5 Results
The pass/fail prediction results are shown in Fig.
15. There is a trend whereby the correct answer
rate increases as the number of tests increases. Fo-
cusing on the case of using all the data, the cor-
rect answer rate surpasses 90% in every category.
Focusing on the correct answer rate for each cate-
gory, Category 1 is low in comparison to the other
categories. The category with the highest correct
answer rate was Category 3.
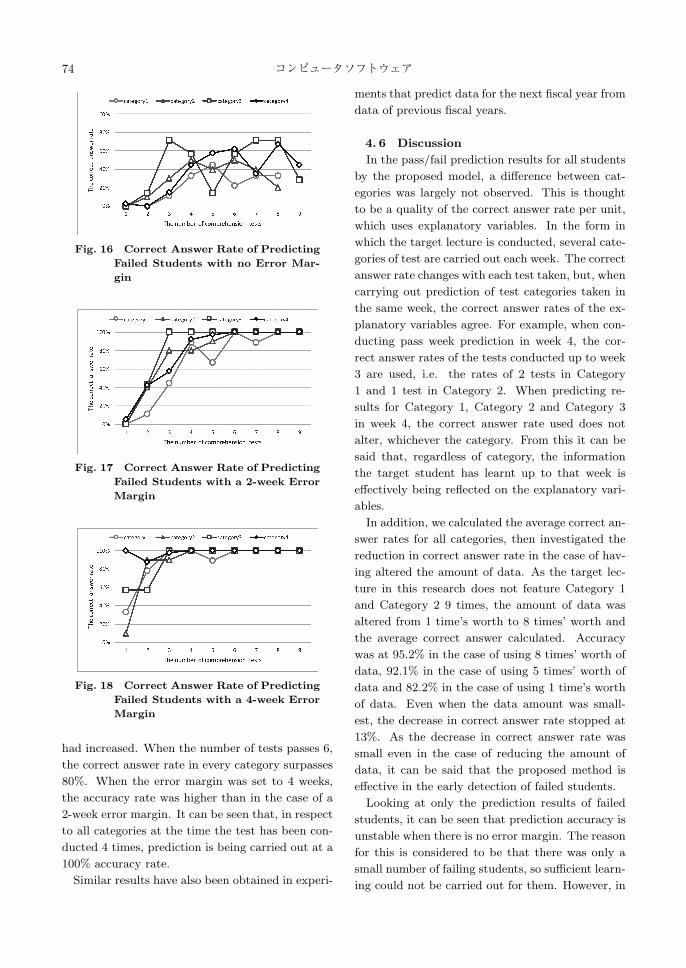
The prediction results for failed students only are
shown in Figures 16 to 18. Verification was carried
out under the following conditions: with no error
margin, with a 2-week error margin, and a 4-week
error margin. A 2-week error margin means that
the prediction result is regarded as correct when it
is within 2 weeks of the correct answer data. In the
case of having no error margin, regardless of cat-
egory or number of tests, results fluctuate wildly
and are not stable. If the error margin was set
to 2 weeks, there were fewer cases of a large drop
in prediction accuracy, when the number of tests
Sanshusha pLATEX2ε: 10_yoshino : 2020/7/13(11:18)
74 コンピュータソフトウェア
Fig. 16 Correct Answer Rate of Predicting
Failed Students with no Error Mar-
gin
Fig. 17 Correct Answer Rate of Predicting
Failed Students with a 2-week Error
Margin
Fig. 18 Correct Answer Rate of Predicting
Failed Students with a 4-week Error
Margin
had increased. When the number of tests passes 6,
the correct answer rate in every category surpasses
80%. When the error margin was set to 4 weeks,
the accuracy rate was higher than in the case of a
2-week error margin. It can be seen that, in respect
to all categories at the time the test has been con-
ducted 4 times, prediction is being carried out at a
100% accuracy rate.
Similar results have also been obtained in experi-
ments that predict data for the next fiscal year from
data of previous fiscal years.
4. 6 Discussion
In the pass/fail prediction results for all students
by the proposed model, a difference between cat-
egories was largely not observed. This is thought
to be a quality of the correct answer rate per unit,
which uses explanatory variables. In the form in
which the target lecture is conducted, several cate-
gories of test are carried out each week. The correct
answer rate changes with each test taken, but, when
carrying out prediction of test categories taken in
the same week, the correct answer rates of the ex-
planatory variables agree. For example, when con-
ducting pass week prediction in week 4, the cor-
rect answer rates of the tests conducted up to week
3 are used, i.e. the rates of 2 tests in Category
1 and 1 test in Category 2. When predicting re-
sults for Category 1, Category 2 and Category 3
in week 4, the correct answer rate used does not
alter, whichever the category. From this it can be
said that, regardless of category, the information
the target student has learnt up to that week is
effectively being reflected on the explanatory vari-
ables.
In addition, we calculated the average correct an-
swer rates for all categories, then investigated the
reduction in correct answer rate in the case of hav-
ing altered the amount of data. As the target lec-
ture in this research does not feature Category 1
and Category 2 9 times, the amount of data was
altered from 1 time’s worth to 8 times’ worth and
the average correct answer calculated. Accuracy
was at 95.2% in the case of using 8 times’ worth of
data, 92.1% in the case of using 5 times’ worth of
data and 82.2% in the case of using 1 time’s worth
of data. Even when the data amount was small-
est, the decrease in correct answer rate stopped at
13%. As the decrease in correct answer rate was
small even in the case of reducing the amount of
data, it can be said that the proposed method is
effective in the early detection of failed students.
Looking at only the prediction results of failed
students, it can be seen that prediction accuracy is
unstable when there is no error margin. The reason
for this is considered to be that there was only a
small number of failing students, so sufficient learn-
ing could not be carried out for them. However, in
Sanshusha pLATEX2ε: 10_yoshino : 2020/7/13(11:18)
Vol. 37 No. 3 Aug. 2020 75
the case of a 4-week error margin, at the time of 4
tests having been conducted, accuracy was at 100%
for all categories. From this, it can be said that it
is possible to eliminate false negatives, in which a
failing student is mis-recognized as a student who
will pass. Also, if students with a high possibility
of failure are detected at the point when the test
has been conducted 4 times, sufficient time can be
attributed to the instruction of those students.
However, the dependency between units is not
reflected in the correct answer rate for each unit,
which we used. Each unit is not independent,
and unless one understands the foundation unit,
it is thought that one cannot understand the units
which apply the foundation. If this dependency
relationship can be clarified and reflected, further
effects are expected. In addition to improving pre-
diction accuracy, we believe that by analyzing the
target unit and the correct answer rate of the unit
that is the foundation of the target unit, it is pos-
sible to grasp students’ comprehension level in the
target unit.
5 APPLICATION DEVELOPMENT
USING PROPOSED MODEL
5. 1 Purpose
We aim to support teachers and reduce failed
students by developing and providing a Web ap-
plication using the proposed model. The target
user of this application is assumed to be a teacher.
Since the model was developed in Python language,
Django was used for ease of data transmission and
reception. Django is a Web application framework
implemented in Python language.
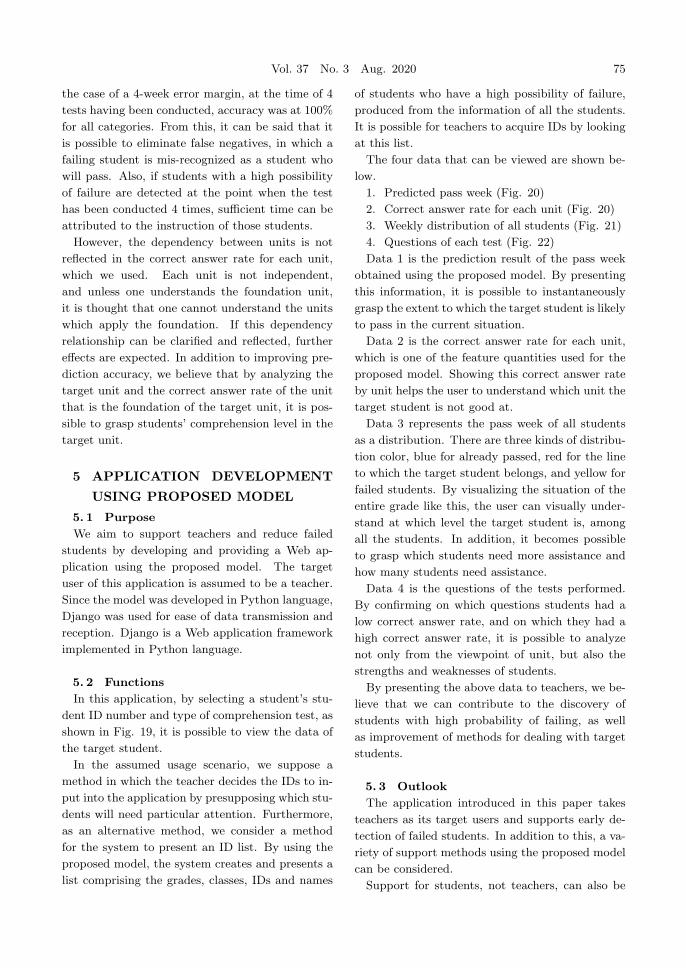
5. 2 Functions
In this application, by selecting a student’s stu-
dent ID number and type of comprehension test, as
shown in Fig. 19, it is possible to view the data of
the target student.
In the assumed usage scenario, we suppose a
method in which the teacher decides the IDs to in-
put into the application by presupposing which stu-
dents will need particular attention. Furthermore,
as an alternative method, we consider a method
for the system to present an ID list. By using the
proposed model, the system creates and presents a
list comprising the grades, classes, IDs and names
of students who have a high possibility of failure,
produced from the information of all the students.
It is possible for teachers to acquire IDs by looking
at this list.
The four data that can be viewed are shown be-
low.
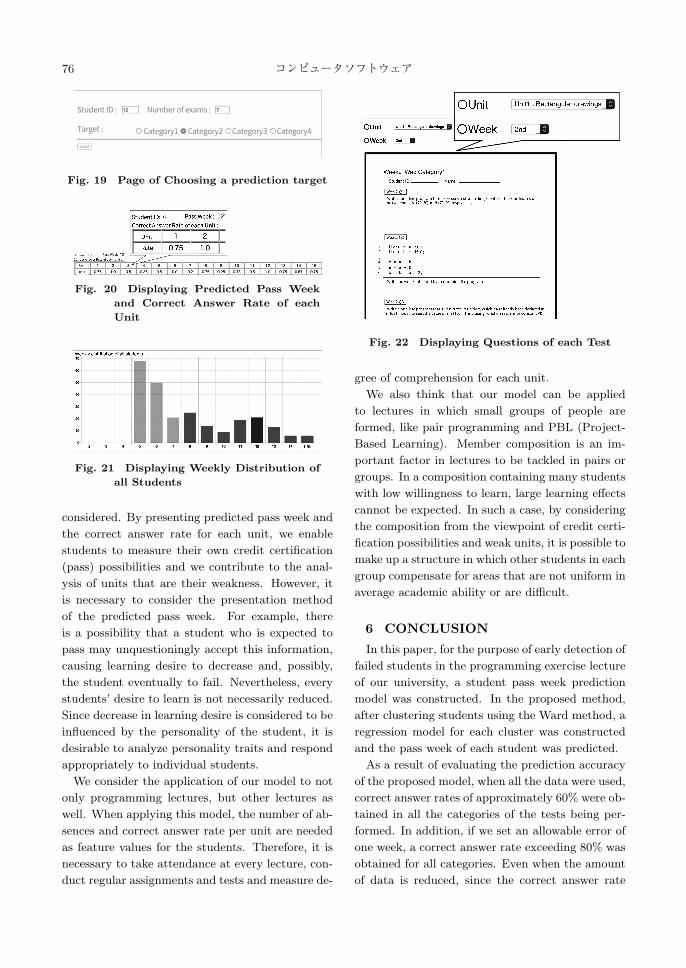
1. Predicted pass week (Fig. 20)
2. Correct answer rate for each unit (Fig. 20)
3. Weekly distribution of all students (Fig. 21)
4. Questions of each test (Fig. 22)
Data 1 is the prediction result of the pass week
obtained using the proposed model. By presenting
this information, it is possible to instantaneously
grasp the extent to which the target student is likely
to pass in the current situation.
Data 2 is the correct answer rate for each unit,
which is one of the feature quantities used for the
proposed model. Showing this correct answer rate
by unit helps the user to understand which unit the
target student is not good at.
Data 3 represents the pass week of all students
as a distribution. There are three kinds of distribu-
tion color, blue for already passed, red for the line
to which the target student belongs, and yellow for
failed students. By visualizing the situation of the
entire grade like this, the user can visually under-
stand at which level the target student is, among
all the students. In addition, it becomes possible
to grasp which students need more assistance and
how many students need assistance.
Data 4 is the questions of the tests performed.
By confirming on which questions students had a
low correct answer rate, and on which they had a
high correct answer rate, it is possible to analyze
not only from the viewpoint of unit, but also the
strengths and weaknesses of students.
By presenting the above data to teachers, we be-
lieve that we can contribute to the discovery of
students with high probability of failing, as well
as improvement of methods for dealing with target
students.
5. 3 Outlook
The application introduced in this paper takes
teachers as its target users and supports early de-
tection of failed students. In addition to this, a va-
riety of support methods using the proposed model
can be considered.
Support for students, not teachers, can also be
Sanshusha pLATEX2ε: 10_yoshino : 2020/7/13(11:18)
76 コンピュータソフトウェア
Fig. 19 Page of Choosing a prediction target
Fig. 20 Displaying Predicted Pass Week
and Correct Answer Rate of each
Unit
Fig. 21 Displaying Weekly Distribution of
all Students
considered. By presenting predicted pass week and
the correct answer rate for each unit, we enable
students to measure their own credit certification
(pass) possibilities and we contribute to the anal-
ysis of units that are their weakness. However, it
is necessary to consider the presentation method
of the predicted pass week. For example, there
is a possibility that a student who is expected to
pass may unquestioningly accept this information,
causing learning desire to decrease and, possibly,
the student eventually to fail. Nevertheless, every
students’ desire to learn is not necessarily reduced.
Since decrease in learning desire is considered to be
influenced by the personality of the student, it is
desirable to analyze personality traits and respond
appropriately to individual students.
We consider the application of our model to not
only programming lectures, but other lectures as
well. When applying this model, the number of ab-
sences and correct answer rate per unit are needed
as feature values for the students. Therefore, it is
necessary to take attendance at every lecture, con-
duct regular assignments and tests and measure de-
Fig. 22 Displaying Questions of each Test
gree of comprehension for each unit.
We also think that our model can be applied
to lectures in which small groups of people are
formed, like pair programming and PBL (Project-
Based Learning). Member composition is an im-
portant factor in lectures to be tackled in pairs or
groups. In a composition containing many students
with low willingness to learn, large learning effects
cannot be expected. In such a case, by considering
the composition from the viewpoint of credit certi-
fication possibilities and weak units, it is possible to
make up a structure in which other students in each
group compensate for areas that are not uniform in
average academic ability or are difficult.
6 CONCLUSION
In this paper, for the purpose of early detection of
failed students in the programming exercise lecture
of our university, a student pass week prediction
model was constructed. In the proposed method,
after clustering students using the Ward method, a
regression model for each cluster was constructed
and the pass week of each student was predicted.
As a result of evaluating the prediction accuracy
of the proposed model, when all the data were used,
correct answer rates of approximately 60% were ob-
tained in all the categories of the tests being per-
formed. In addition, if we set an allowable error of
one week, a correct answer rate exceeding 80% was
obtained for all categories. Even when the amount
of data is reduced, since the correct answer rate
Sanshusha pLATEX2ε: 10_yoshino : 2020/7/13(11:18)
Vol. 37 No. 3 Aug. 2020 77
does not decrease greatly, it is considered to be ef-
fective for early detection of failed students.
Proposed future tasks include collection of failed
students’ data and reduction of the error margin.
The amount of failed student data used this time
was extremely small, at between 10 and 40 stu-
dents. It is inconceivable that sufficient verification
can have been carried out with this data size, so it is
necessary to gather more data and re-verify. Also,
the degree of prediction accuracy required by the
proposed model cannot be decided unconditionally
and varies according to the target user and usage
method. When presenting the prediction results by
the proposed model to students, it is vital to pro-
ceed cautiously. Unlike teachers, students lack ex-
perience and knowledge, so prediction errors must
be made as small as possible.
Acknowledgements I would like to thank As-
sociate Professor Terai Asuka for cooperating
in pointing out corrections advising experiments.
This work was supported by JSPS KAKENHI
Grant Number 19H04157.
References
[ 1 ] Abeysekera, L. and Dawson, P. : Motivation
and Cognitive Load in the Flipped Classroom: Def-
inition, Rationale and a Call for Research, Higher
Education Research & Development, Vol. 34, No. 1
(2015), pp. 1–14.
[ 2 ] Breiman, L. : Random Forests, Machine Learn-
ing, Vol. 45, No. 1 (2001), pp. 5–32.
[ 3 ] Brennan, A., Sharma, A., and Munguia, P. : Di-
versity of Online Behaviours Associated with Phys-
ical Attendance in Lectures, Journal of Learning
Analytics, Vol. 6, No. 1 (2019), pp. 34–53.
[ 4 ] Brinkhuis, M. J. S., Savi, A. O., Hofman, A. D.,
Coomans, F., van der Maas, H. L. J., and Maris, G.
: Learning As It Happens: A Decade of Analyzing
and Shaping a Large-Scale Online Learning System,
Journal of Learning Analytics, Vol. 5, No. 2 (2018),
pp. 29–46.
[ 5 ] Harrak, F., Bouchet, F., and Luengo, V. :
From Students’ Questions to Students’ Profiles in a
Blended Learning Environment, Journal of Learn-
ing Analytics, Vol. 6, No. 1 (2019), pp. 54–84.
[ 6 ] Herodotou, C., Rienties, B., Verdin, B., and
Boroowa, A. : Predictive Learning Analytics’ At
Scale’ : Guidelines to Successful Implementation in
Higher Education, Journal of Learning Analytics,
Vol. 6, No. 1 (2019), pp. 85–95.
[ 7 ] Itoh, H., Itoh, Y., Funahashi, K., Yamamoto,
D., Saito, S., Takumi, I. and Matsuo, H. : Forecast-
ing Students’ Future Academic Records Using Past
Attendance Recording Data and Grade Data, in
Proceedings of the 17th International Conference in
Knowledge Based and Intelligent Information and
Engineering Systems, Vol. 22 (2013), pp. 921–927.
[ 8 ] Itoh, Y., Itoh, H. and Funahashi, K. : Forecast-
ing Future Students’ Academic Level and Analyz-
ing Students’ Feature Using Schooling Logs, in 2015
IEEE 4th Global Conference on Consumer Elec-
tronics, 2015.
[ 9 ] Nguyen, Q., Huptych, M., and Rienties, B. : Us-
ing Temporal Analytics to Detect Inconsistencies
Between Learning Design and Students’ Behaviours,
Journal of Learning Analytics, Vol. 5, No. 3 (2018),
pp. 120–135.
[10] Pardos, Z. A., and Horodyskyj, L. : Analysis
of Student Behaviour in Habitable Worlds Using
Continuous Representation Visualization, Journal
of Learning Analytics, Vol. 6, No. 1 (2019), pp. 1-15.
[11] Rodrguez-Triana, M.J., Martnez-Mons, A. and
Villagr-Sobrino, S. : Learning Analytics in Small-
scale Teacher-led Innovations: Ethical and Data
Privacy Issues, Journal of Learning Analytics.
Vol. 3, No. 1 (2016), pp. 43–65.
[12] Salmon, G. : E-tivities: The Key to Active On-
line Learning, Routledge, 2013.
[13] Shirvani Boroujeni, M., and Dillenbourg, P. :
Discovery and Temporal Analysis of MOOC Study
Patterns, Journal of Learning Analytics, Vol. 6,
No. 1 (2019), pp. 16–33.
[14] Steiner, C. M., Kickmeier-Rust, M. D., and Al-
bert, D. : LEA in Private: A Privacy and Data Pro-
tection Framework for a Learning Analytics Toolbox
Journal of Learning Analytics, Vol. 3, No. 1 (2016),
pp. 66–90.
[15] Vapnik, V. : The Nature of Statistical Learning
Theory, Springer, 1995.
[16] Ward, J.H. : Hierarchical Grouping to Optimize
an Objective Function, Journal of the American
Statistical Association, Vol. 58 (1963), pp. 236–244.
Kota Yoshino
Kota Yoshino received his B.S. de-
gree from Future University Hako-
date in 2018. His research inter-
ests include learning support sys-
tems and agent model.

Sanshusha pLATEX2ε: 10_yoshino : 2020/7/13(11:18)
78 コンピュータソフトウェア
Yoshinari Takegawa
Yoshinari Takegawa is an Associate
Professor at Faculty of Systems In-
formation Science, Future Univer-
sity Hakodate. He received his
BEng from Mie University in 2003,
and received his MEng and PhD from Osaka Uni-
versity in 2005 and 2007, respectively. His research
interests include human-computer interaction, edu-
cational technology, and entertainment computing.
Keiji Hirata
Doctor of Engineering from Uni-
versity of Tokyo in 1987. Joined
NTT Basic Research Laboratories
in 1987 (later changed to NTT
Communication Science Laborato-
ries) and Future University Hakodate as professor
in 2011 (- present). His research interest includes
computational music theory, algebraic framework
for music creation, mobility as a service (MaaS),
and multimodal learning support system.
Atsuko Tominaga
She is a professor at Faculty of Sys-
tems Information Science, Future
University Hakodate. She received
her Ph.D. from Waseda University
in 2012. Her interest areas are in-
structional design, e-learning, and peer tutoring.
Copyright © 2022 FDOKUMEN