Investigating Students' Adoption of MOOCs during COVID-19 ...
Upload
khangminh22Category
view
1download
0
Students, Teachers, Exams and MOOCs:
Predicting and Optimizing Attainment inWeb-Based Education Using a Probabilistic
Graphical Model
Bar Shalem1, Yoram Bachrach2, John Guiver2, and Christopher M. Bishop2
1 Bar-Ilan University, Ramat Gan, Israel2 Microsoft Research, Cambridge, UK
Abstract. Wepropose a probabilistic graphical model for predicting stu-dent attainment in web-based education. We empirically evaluate ourmodel on a crowdsourced datasetwith students and teachers;Teachers pre-pared lessons on various topics. Students read lessons by various teachersand then solved amultiple choice exam. Ourmodel gets input data regard-ing past interactions between students and teachers and past student at-tainment. It then estimates abilities of students, competence of teachersand difficulty of questions, and predicts future student outcomes.We showthat our model’s predictions are more accurate than heuristic approaches.We also show how demographic profiles and personality traits correlatewith student performance in this task.Finally, given a limited pool of teach-ers, we propose an approach for using information from our model to max-imize the number of students passing an exam of a given difficulty, by opti-mally assigning teachers to students. We evaluate the potential impact ofour optimization approach using a simulation based on our dataset, show-ing an improvement in the overall performance.
1 Introduction
Recent years have marked an enormous leap in the use of the Internet andweb-based technology. This technology had a huge impact on education, whereweb-based and online training are emerging as a new paradigm in learning [26].Distant learning technology makes it easier to access educational resources, re-duces costs and allows extending participation in education [28,2,40]. Intelligentonline educational technologies enable a deep analysis of student solutions andallows automatic tailoring of content or the difficulty of exercises to the specificstudent [11]. One innovation that could affect higher education is massive openonline courses (MOOCs), online training geared to allow large-scale participa-tion by providing open access to resources [36,16]. MOOC providers offer a wideselection of courses, some already attracting many students. 1
1 See, for example the report on Peter Norvig and Sebastian Thrun’s onlineartificial intelligence course, with its “100,000 student classroom”, in http://
www.ted.com/talks/peter norvig the 100 000 student classroom.html.
T. Calders et al. (Eds.): ECML PKDD 2014, Part III, LNCS 8726, pp. 82–97, 2014.c© Springer-Verlag Berlin Heidelberg 2014

Students, Teachers, Exams and MOOCs 83
However, web-based education also brings with it new challenges. Studentsmay become frustrated due to ambiguous instructions or lack of prompt feedback[25]. This triggers the need to manage the quality of online teaching material,and highlights the need for an objective system for measuring performance andfor efficient resource allocation [10,43,47,36].
However, measuring the quality of teaching materials or predicting the at-tainment of students are challenging. Teachers who teach a similar subject arelikely to have completely disjoint student cohorts, of different ability levels, back-grounds, and demographic traits. Further, students may solve different tasks orget different exams (with potentially some overlap in tasks or questions).
Many questions arise in such settings. How can we aggregate observations onoutcomes in order to evaluate the abilities of students, the competence of teachersand the difficulty of exams? Can we systematically predict the attainment ofstudents? Do demographic and personality traits correlate with performance?How can we optimize resource allocation, such as the assignment of teachers tostudents, so as to maximize performance?
Our Contribution: We propose a probabilistic graphical model for assessingteaching material quality and student ability, and for predicting student attain-ment in online education. Our model gets input data regarding past interactionsbetween students, teachers and exams and past outcomes (whether a studentsucceeded in answering questions in the exam), and provides predictions regard-ing future interactions. We evaluate our model based on a dataset crowdsourcedfrom Amazon’s Mechanical Turk (AMT). We divided the AMT workers into“teachers” and “students”. Each teacher prepared “lessons” on various topics,in the form of summaries of Wikipedia articles. For each topic we constructed amultiple choice “exam”, and students were asked to solve it based on the lessonprepared by one of the teachers. We show that our model can predict outcomesin such settings and estimate the abilities of students, the competence of teachersand the difficulty of questions. We show that our model outperforms heuristicapproaches for predicting outcomes. We also explore how demographic profilesand personality traits correlate with student performance in this task. Finally,given a limited pool of teachers, we propose an approach for using informationfrom our model to optimize performance in our domain, such as the number ofstudents passing a difficult exam. We do so by choosing the optimal assignmentbetween teachers and students, based on our model’s estimates, and evaluatethe potential impact of this approach using a simulation based on our dataset.
2 Probabilistic Graphical Model for PredictingAttainment in Web-Based Education
We now describe our model for predicting performance in web-based education.Our domain consists of online exams given to students who studied various topicswith the help of lessons prepared by teachers. We denote the student set as S,the teacher set as T , the topic set as M , and the set of questions comprisingthe exam on topic m as Qm. We denote the exam on topic m as Em. A student

84 B. Shalem et al.
s ∈ S learns topic m ∈ M based on the lesson prepared by teacher t ∈ T , thenanswers the exam Em on topic m ∈ M . We say the outcome for this attemptwas a success, denoted rs,q = 1, if student s answers question q correctly, andotherwise we say it is a failure, denoted rs,q = 0. The raw score of students in the exam Em is the number of questions she answers correctly. This rawscore reflects not only the ability of the student, but also how well she wastaught the topic by her teacher, and the difficulty level of the questions in theexam. Thus our dataset consists of observations of the form zi = (s, t,m, q, rs,q).Every student is taught each topic by a single teacher (though she may receivea different teacher for different topics).
Given our observations Z = {zi}wi=1, we wish to predict future outcomes: howwell is a student s likely to do in an exam Em on topic m when she is taughtby teacher t? We refer to our problem as the attainment problem. The full inputdata to the attainment problem potentially includes an entry for the outcomeon every question for every student, so its size is |S| · |Q|. Typically, however, theinput data only includes a smaller set of observations: for example, a student mayonly have been taught some of the topics, or was only tested using some of thequestions on a topic. Given the input data, our goal is to predict the outcomeson the missing entries, so a query is a tuple uj = (s, t,m, q). A query is similarto the input entries, except it is missing the outcome r, to be interpreted asrequesting the model to predict whether student s would answer the question qregarding the topic m correctly when taught by teacher t.
Predicting Outcomes Using a Probabilistic Model: We propose a proba-bilistic graphical model for the attainment problem, called the Student-Teacher-Exam-Performance model — STEP. Given the input observations Z = {zi}wi=1
and queries U = {uj}lj=1, the model’s output consists of predictions regard-ing the outcomes for the entries in the query set R = (r1, . . . , rl). STEP alsooutputs information regarding latent variables, such as the ability level of eachstudent, the competence of each teacher and difficulty of each question. The out-comes in the query set U , as well as the abilities, competences and difficulties,are modeled as unobserved random variables. In contrast, the outcomes in theobservation set Z are observed variables. The structure of our STEP model isgoverned by independence assumptions regarding the variables. Pearl discussesBayesian Networks [42] (now referred to as directed graphical models), whichrepresent conditional independence assumptions as a graph where each vertexcorresponds to a variable and the edges capture dependencies between adja-cent variables. We base STEP on a prominent extension of Bayesian Networks,called Factor Graphs (see [29]), which describes a factorial decomposition of anassumed joint probability distribution between the variables.
We first define the crux of the model in the form of a Factor Graph rep-resentation. We then set the observed variables in the graph to the values ofthe observations Z, consisting of the identities of the students, teachers, topicsand questions, and most importantly the outcomes in our observation set. Wethen use approximate message passing algorithms [29] to infer marginal prob-ability distributions of the target unknown variables: student abilities, teacher

Students, Teachers, Exams and MOOCs 85
competences, question difficulties, and of course the unobserved outcomes of thequery set. We thus get a posterior distribution over these unobserved variables.
The Graphical Model: Recall that the variable rs,q indicates whether students answered question q correctly (rs,q = 1 indicates the answer was correct andrs,q = 0 indicates it was incorrect). This variable is an observed variable forevery entry zi = (s, t,m, q, r) ∈ Z (though it is unobserved in the query set U).We model the process which causes a student s ∈ S to either answer a questioncorrectly or incorrectly. We assume every student s ∈ S has an inherent abilityas ∈ R reflecting how easy she finds it to learn new topics and answer questionson them, and that every teacher t ∈ T has an inherent competence ct ∈ R
reflecting her ability to teach students and provide them information on a topic.We assume every question q ∈ Q has an inherent difficulty dq ∈ R determininghow likely it is that a student could answer it correctly.
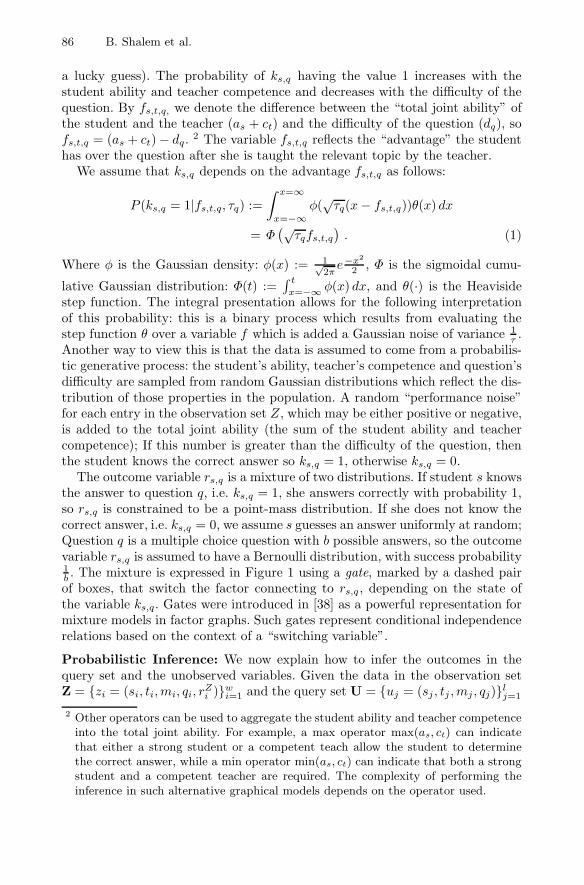
Our model is a joint probabilistic model with a factor graph representationgiven in Figure 1. The model has two parts. The first part reflects the probabilitythat student s actually knows the correct answer to a question q, denoted bythe variable ks,q, as determined by the student ability parameter as, the teachercompetence parameter ct (where t is the teacher who taught s the topic of thatquestion), and the question difficulty parameter dq. In Figure 1, this is shown tothe left and above the vertex of ks,q. The second part determines the observedoutcome, depending on ks,q and is shown to the right of the vertex of ks,q.
ks,q is a Boolean variable. A value of 1 indicates that the student s knowsthe correct answer to the question q, while a value of 0 indicates she does notknow the answer (but may still give the right answer to the question by making
Fig. 1. Factor graph for the STEP model
86 B. Shalem et al.
a lucky guess). The probability of ks,q having the value 1 increases with thestudent ability and teacher competence and decreases with the difficulty of thequestion. By fs,t,q, we denote the difference between the “total joint ability” ofthe student and the teacher (as + ct) and the difficulty of the question (dq), sofs,t,q = (as + ct)− dq.
2 The variable fs,t,q reflects the “advantage” the studenthas over the question after she is taught the relevant topic by the teacher.
We assume that ks,q depends on the advantage fs,t,q as follows:
P (ks,q = 1|fs,t,q, τq) :=∫ x=∞
x=−∞φ(√τq(x− fs,t,q))θ(x) dx
= Φ(√
τqfs,t,q). (1)
Where φ is the Gaussian density: φ(x) := 1√2π
e−x2
2 , Φ is the sigmoidal cumu-
lative Gaussian distribution: Φ(t) :=∫ t
x=−∞ φ(x) dx, and θ(·) is the Heavisidestep function. The integral presentation allows for the following interpretationof this probability: this is a binary process which results from evaluating thestep function θ over a variable f which is added a Gaussian noise of variance 1
τ .Another way to view this is that the data is assumed to come from a probabilis-tic generative process: the student’s ability, teacher’s competence and question’sdifficulty are sampled from random Gaussian distributions which reflect the dis-tribution of those properties in the population. A random “performance noise”for each entry in the observation set Z, which may be either positive or negative,is added to the total joint ability (the sum of the student ability and teachercompetence); If this number is greater than the difficulty of the question, thenthe student knows the correct answer so ks,q = 1, otherwise ks,q = 0.
The outcome variable rs,q is a mixture of two distributions. If student s knowsthe answer to question q, i.e. ks,q = 1, she answers correctly with probability 1,so rs,q is constrained to be a point-mass distribution. If she does not know thecorrect answer, i.e. ks,q = 0, we assume s guesses an answer uniformly at random;Question q is a multiple choice question with b possible answers, so the outcomevariable rs,q is assumed to have a Bernoulli distribution, with success probability1b . The mixture is expressed in Figure 1 using a gate, marked by a dashed pairof boxes, that switch the factor connecting to rs,q , depending on the state ofthe variable ks,q. Gates were introduced in [38] as a powerful representation formixture models in factor graphs. Such gates represent conditional independencerelations based on the context of a “switching variable”.
Probabilistic Inference: We now explain how to infer the outcomes in thequery set and the unobserved variables. Given the data in the observation setZ = {zi = (si, ti,mi, qi, r
Zi )}wi=1 and the query set U = {uj = (sj , tj ,mj , qj)}lj=1
2 Other operators can be used to aggregate the student ability and teacher competenceinto the total joint ability. For example, a max operator max(as, ct) can indicatethat either a strong student or a competent teach allow the student to determinethe correct answer, while a min operator min(as, ct) can indicate that both a strongstudent and a competent teacher are required. The complexity of performing theinference in such alternative graphical models depends on the operator used.

Students, Teachers, Exams and MOOCs 87
we are interested in predicting the missing outcomes for the query set {rj}lj=1.We do so by simultaneously inferring several approximate posterior (marginal)distributions: the Gaussian density of the ability of each student, competence ofeach teacher and difficulty of each question, the Bernoulli distribution indicatingwhether each student knew the answer to each question for all such entries in theobservation set and query set, and the Bernoulli distribution indicating whethereach student gave a correct response to the question asked for all entries in thequery set. The posterior distributions {p(rj |Z,U)}lj=1 can be interpreted as theprobability that the outcome in the j’th entry in the query set would be a success(i.e. the probability that the student would answer the question correctly). Thisposterior distribution is a Bernoulli distribution, so we can simply denote theprobability of a successful outcome as prj = p(rj = 1|Z,U). When requestedto make a binary prediction rather than estimate the probability of a successfuloutcome, we use the mode of that distribution: if prj > 1
2 we predict a success,and otherwise predict a failure.
To perform the inference and compute the posterior distribution in STEP, weuse Expectation-Propagation approximate message passing (see [39,29]), usingInfer.NET [37], a framework for probabilistic modeling. 3
3 Model Evaluation
We evaluated STEP using a dataset crowdsourced from Amazon’s MechanicalTurk (AMT). AMT is a crowdsourcing marketplace bringing together workersinterested in performing jobs remotely, and requesters interested in obtaininghuman labor for tasks. We constructed tasks for a remote learning experience,both on the teacher’s side and the student’ side. We first selected 10 Wikipediaarticles covering various topics such as Chad, Saffron and DNA. We composedan “exam” on each of those topics, consisting of 5 multiple choice questions(50 questions total). We divided the worker set to two groups: “teachers” and“students”. Each teacher was required to write a short (1500 character) “lesson”on each of the topics. The teachers were notified which issues to focus on whenpreparing the students for the exam (for example the history of Chad or thechemical structure of DNA). However, they did not know which specific questionswere in the exam. Each student was asked to study the topic using the lessonprovided by a teacher we chose, then solve the exam on that topic. The timegiven to solve the exam was limited to 3 minutes per topic, making it difficult(though not impossible) for students to consult external resources other thanthe teacher’s lesson.
Data Collection: Our dataset consists of observations regarding the questionssolved by students, in the form discussed in the previous section: student, teacher,
3 STEP’s factor graph is loopy, as we have multiple participants who respond to thesame question set and share the same teacher set. Thus EP computes the posteri-ors by iterating until convergence. The number of iterations used in Infer.NET isconstant, so the procedure runs in time linear in the input, i.e. in O(|S| · |Q|).

88 B. Shalem et al.
topic, question, and correctness. We sourced 237 workers for the task from AMT.We used 10 of them as teachers, and 227 as students. Each teacher had prepareda lesson on each of the 10 topics. Lessons were allocated to students as follows.Each student got 10 lessons by 10 different teachers. For each student, the teacherpermutation was modified by cyclic shift, i.e. student s got the lesson by teacher(s+m) mod |T | on topic m, where |T | is the number of teachers. Each studentanswered all 5 questions on each topic resulting in a total of 11,350 entries inour dataset.
The students were given a base payment of $2 for performing the task, and abonus of up to $3 depending on their performance, measured by the number ofquestions they answered correctly. The teachers received a base payment of $10,for writing the lessons, and engaged in a contest for an additional bonus of $10:each teacher was randomly paired up with another teacher; The teacher withbetter performing students was awarded a $10 bonus. 4 In addition to answeringthe questions, each student completed a demographics survey regarding theirage, gender, income and education. They also completed a short personalityquestionnaire called TIPI [22]. TIPI follows the Five Factor Personality Model,[13,45], a generally accepted model representing the “basic structure” underlyinghuman personality, whose ability to predict human behavior has been thoroughlyinvestigated [15,9]. 5 The key five personality traits are Openness to experience,Conscientiousness, Extroversion, Agreeableness and Neuroticism (OCEAN forshort).
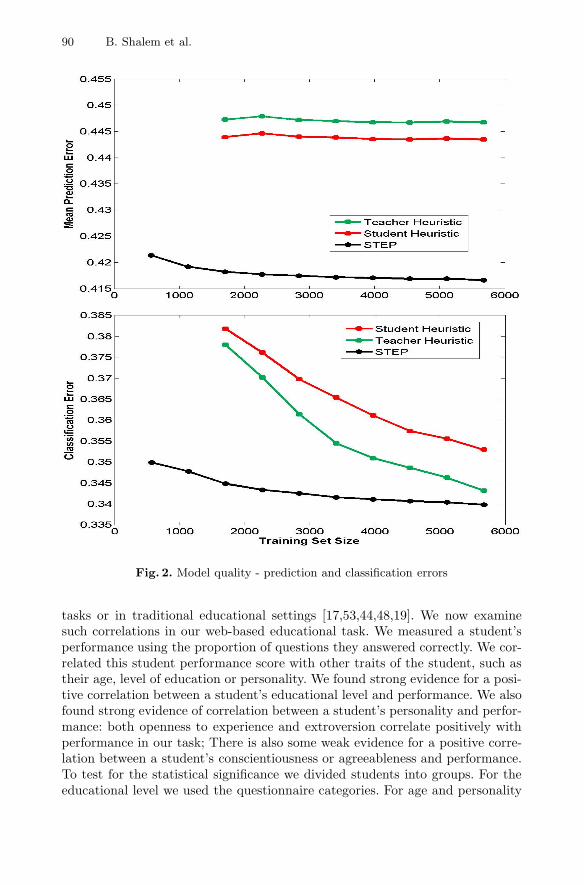
Model Performance: We examined the performance of our STEP model, eval-uated by randomly partitioning the data into a training set and a test set. Wecompared our model to heuristic approaches using two error metrics. The firsterror metric is the prediction error, which is the mean absolute difference be-tween the actual answers (0 for an incorrect answer and 1 for a correct answer)and the model estimated probability of a correct answer. The second metric isbased on a binary outcome prediction. We round the estimated probabilities ofanswering a question correctly to get a binary classification. The classificationerror is the proportion of entries where the model mis-classified the outcome.
We compared the performance of STEP with two heuristics. Given a targetstudent s, our student heuristic examines all the entries with that student inthe training set, and measures the proportion of those where the outcome wasa success (i.e. the proportion of the student’s entries where she gave a correctanswer). This proportion is then used as the estimated probability of a successfuloutcome on each of that student’s entries in the test set. Similarly, given a teacher
4 While there is a high variance in the performance of participants in AMT [30,5],such contests are known to have good properties in terms of incentivizing the par-ticipants to exert significant effort on the task [27,3,20,52] (so long as participantsare anonymous and are not colluding [35])
5 Further, it is possible to automatically infer personality traits from peoples’ socialnetwork profiles [7,32,6] or website choices [33,31], allowing such publicly availableinformation to be used to profile students and make predictions about their perfor-mance in educational settingts.

Students, Teachers, Exams and MOOCs 89
t our teacher heuristic examines all the entries with that teacher in the trainingset and measures the proportion of those entries where the outcome was a success(i.e. the proportion of the teacher’s entries where her student gave the correctanswer, no matter who that student was). This proportion is then used as theestimated probability of a successful outcome on each of that teacher’s entriesin the test set. The student heuristic ignores information regrading who theteacher was, and the teacher heuristic ignores information regarding who thestudent was, while STEP uses all the available full information.
Figure 2 compares the quality of our model with the student and teacherheuristics, in terms of the classification error and prediction error metrics. Thex-axis in both plots is the number of observations available in the training set.For each point in the plot we randomly selected a subset of questions, whosesize was determined by the location on the x-axis, and used their entries as thetraining set. The remaining entries were used as a test set, with an unobservedoutcome. We repeated the sampling 500 times and averaged the resulting errormetrics. Figure 2 shows that the STEP produces better predictions than theheuristics, as it has a lower error for both error metrics discussed above. Forboth the heuristics and STEP, the error decreases as more data is given asinput, but the improvement diminishes in the size of the data.
In addition to the outcome predictions regarding queries in the test set, theSTEP model also returns information regarding the abilities of students, compe-tence of teachers and difficulty of questions, captured as posterior distribution forthe model parameters. These parameters allow us to rank students, teachers andquestions, by their abilities, competence levels and difficulties, correspondingly.The values of these parameters are shown in Figure 3.
Figure 3 indicates high variances of the parameters. STEP sums togetherstudent ability and teacher competence and compares the sum with the questiondifficulty. The variability on the y axis between student abilities is larger thanthe variability between teacher competences, indicating that the identity of thestudent had stronger impact on performance than the identity of the teacher.
One simple way to “score” student abilities is by the proportion of questionsthey answered correctly. Correspondingly, we can score teacher competence bythe proportion of questions that their students answered correctly. Similarly,we can score question difficulty by the proportion of all students who managedto correctly answer that question (here a high score means an easy question).Unsurprisingly, there is strong positive correlation (r = 0.997) between a studentoverall score in the full exam and her inferred ability, and between the averagescore of a teacher’s students and her inferred competence (r = 0.999). Similarly,there is a strong negative correlation (r = −0.946) between the proportion ofstudents who managed to solve a question and its inferred difficulty.
Demographics and Student Success: STEP predicts student success basedon observed outcomes in previous interactions. Other sources of information re-garding a student, such as demographic traits or personality traits may also helppredict student performance. Previous work has already examined the correla-tion between a student’s demographic or personality traits and success in online
90 B. Shalem et al.
Fig. 2. Model quality - prediction and classification errors
tasks or in traditional educational settings [17,53,44,48,19]. We now examinesuch correlations in our web-based educational task. We measured a student’sperformance using the proportion of questions they answered correctly. We cor-related this student performance score with other traits of the student, such astheir age, level of education or personality. We found strong evidence for a posi-tive correlation between a student’s educational level and performance. We alsofound strong evidence of correlation between a student’s personality and perfor-mance: both openness to experience and extroversion correlate positively withperformance in our task; There is also some weak evidence for a positive corre-lation between a student’s conscientiousness or agreeableness and performance.To test for the statistical significance we divided students into groups. For theeducational level we used the questionnaire categories. For age and personality

Students, Teachers, Exams and MOOCs 91
Fig. 3. STEP parameters - student ability, teacher competence and question difficulty
traits, we divided the student population into 3 equal size groups (low, mediumand high) according to their responses in the questionnaire. We used a Mann-Whitney U-test (see [49]) to test the statistical significance of the differencesbetween the low group and the high group. The statistically significant results(at a p < 5% level) are given in Table 1.
Table 1. Demographic/personality and performance
Property Pearson Correlation p value
Education N/A 0.0001
Openness 0.2371 0.0001
Age -0.1709 0.0032
Extroversion 0.2902 0.0068
Conscientiousness 0.1526 0.0405
Agreeableness 0.1867 0.0455
Table 1 shows that young or educated students had better performance. Fur-ther, those high in openess to experience or extroversion tended to do well inour task. Figure 4 visualizes these relations, showing the average performancefor different groups (and showing the standard error).
Our results show a correlation between demographics or personality traits andperformance in our task. Despite these correlations, there is a huge variabilityin performance even for workers with very similar demographic or personalityprofiles, highlighting the need to base predictions regarding attainment on ob-servations regarding past performance, as done in the STEP model.
Student Teacher Matching: Our experiment used teaching materials pre-pared by various teachers. Online education can allow high volumes of studentsto access training material though the Internet. However, direct student-teacherinteraction, by a phone call or a chat, allows teaching more difficult material and

92 B. Shalem et al.
Fig. 4. Demographics and performance
achieves a higher rates of learning [41]. Such individual training requires hav-ing many teachers, as each teacher can only directly interact with few students.Nonetheless, one difference between traditional and online education systems isthe flexibility in assigning teachers to students. Traditional education is con-strained by physical limitations: a teacher who lives in one city cannot teach inanother remote city. In online education a single student can be taught by manydifferent teachers from across the globe, without leaving the comfort of theirown home. We show that this allows us to optimize the assignment of teachersto students in order to improve the overall student performance. We use themodel’s estimate of a teacher t’s competence in preparing teaching material as aproxy of how well they teach by direct interaction: though in our experiment theteaching materials prepared by a teacher can be used to train many students,we consider the case where a teacher can only interact with a single student.
STEP infers Gaussian posterior distributions for the competence of teachersand abilities of students. Given these parameters and a question (or exam) ofa given difficulty, it infers pc, the probability that student s would succeed inanswering the question q if she is taught by the teacher t. Let S ∼ N(μs, σ
2s)
be the inferred student s’s ability, T ∼ N(μt, σ2t ) the inferred teacher t’s com-
petence, D ∼ N(μd, σ2d) the question difficulty and N ∼ N(0, σ2
n) the Gaussiannoise used in the model. Let pc(s, t) be the probability that student s taught byteacher t knows the correct answer to a question of difficulty d (similar to the

Students, Teachers, Exams and MOOCs 93
Bernoulli variable ks,q in the previous section.) Under the assumptions of theSTEP model, pc(s, t) = Pr(S + T + N > D), we can compute pc(s, t) for anystudent s and teacher t.
Consider a domain with an equal number n of teachers and students. Supposeevery teacher has the capacity to teach a single student, and that we wish to max-imize the number of students who pass an exam of difficulty d. How should wechoose an assignment A : S → T between students and teachers, which respectsthe teacher capacity constraints (i.e. for any t ∈ T there is only one student s ∈ Ssuch that A(s) = t), so as to maximize the expected number of passing students:argmaxA
∑s∈S pc(s, A(S))? The simplest way is a random assignment, which
ignores the inferred abilities. However, when maximizing the number of pass-ing students we only care if a student passes (rather than considering the exactscore). If we have one good student and one bad student, and one good teacherand one bad teacher, we may be better off matching the good teacher to thebad student and the bad teacher to the good student, as the “returns on com-petence” can decrease with the ability of the student. 6 One heuristic is to sortstudents by increasing ability, and the teachers by decreasing competence andmatch them in that order. We call this the inverse heuristic assignment. Givenan exam of difficulty d, matching a student s with teacher t has the expected re-turn of pc(s, t). We can formulate maximizing the expected number of “passing”students as a Bipartite Maximum Weighted Matching (BMWM) problem [51];We are given a bipartite graph of students on one side and the teachers on theother, and the edge between student s and teacher t has weight w(s,t) = pc(s, t);The goal is find an assignment A : S → T matching each teacher to exactlyone student so as to maximize the sum of weights of the matching. The BMWMoutput is the assignment A maximizing
∑s∈S w(s,A(s)). This optimal assignment
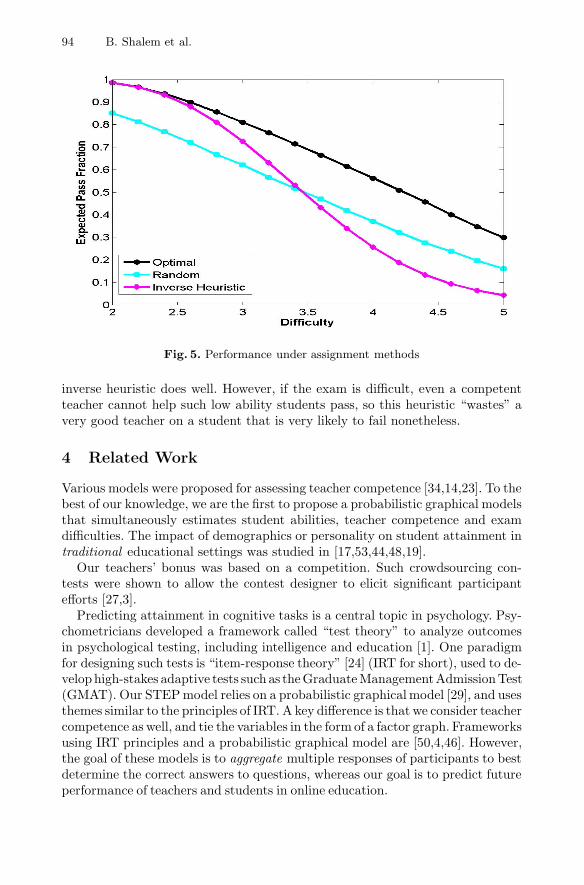
(equivalently BMWM) can be found in polynomial time [51].We compared the three matching algorithms (random assignment, inverse
heuristic assignment and the optimal assignment) in terms of their performance,measured by the expected number of passing students. As the input data forthe simulations we used the scaled output parameters of STEP on the real datadiscussed in the previous section. We only had 10 teachers in this dataset, so werandomly sampled a subset of 10 students many times, averaging the resultingperformance under the three assignment methods. We performed the analysis ona range of question difficulty levels (matching the student abilities and teachercompetences). The results are shown in Figure 5.
Figure 5 shows that for easy questions, the inverse heuristic outperforms ran-dom matching, and almost as good as the optimal assignment. However, as thedifficulty increases, the inverse heuristic’s performance degrades, until at somepoint it is even worse than random matching. For such moderate to difficultexams, there is a performance gain when switching to the optimal assignment.One possible reason for this is low ability students. If the exam is easy, suchstudents are likely to pass when assigned a highly competent teacher, so the
6 Such diminishing returns are prevalent in many resource allocation settings[12,18,8,2,40].
94 B. Shalem et al.
Fig. 5. Performance under assignment methods
inverse heuristic does well. However, if the exam is difficult, even a competentteacher cannot help such low ability students pass, so this heuristic “wastes” avery good teacher on a student that is very likely to fail nonetheless.
4 Related Work
Various models were proposed for assessing teacher competence [34,14,23]. To thebest of our knowledge, we are the first to propose a probabilistic graphical modelsthat simultaneously estimates student abilities, teacher competence and examdifficulties. The impact of demographics or personality on student attainment intraditional educational settings was studied in [17,53,44,48,19].
Our teachers’ bonus was based on a competition. Such crowdsourcing con-tests were shown to allow the contest designer to elicit significant participantefforts [27,3].
Predicting attainment in cognitive tasks is a central topic in psychology. Psy-chometricians developed a framework called “test theory” to analyze outcomesin psychological testing, including intelligence and education [1]. One paradigmfor designing such tests is “item-response theory” [24] (IRT for short), used to de-velophigh-stakes adaptive tests such as theGraduateManagementAdmissionTest(GMAT). Our STEPmodel relies on a probabilistic graphical model [29], and usesthemes similar to the principles of IRT. A key difference is that we consider teachercompetence as well, and tie the variables in the form of a factor graph. Frameworksusing IRT principles and a probabilistic graphical model are [50,4,46]. However,the goal of these models is to aggregate multiple responses of participants to bestdetermine the correct answers to questions, whereas our goal is to predict futureperformance of teachers and students in online education.

Students, Teachers, Exams and MOOCs 95
Our work ignored logical connections between questions. In many exams sev-eral questions rely on the same piece of knowledge, so a mistake regarding thisinformation is likely to affect many responses. Frameworks such as Probabilis-tic Relational Models [21] combine a logical representation with probabilisticsemantics, and can be used to express such structures.
5 Conclusion
We introduced the STEP model for estimating abilities and predicting outcomesin web-based education based on student abilities, teacher competences and ques-tion difficulties. We evaluated it on a crowdsourced dataset. We showed thatSTEP outperforms alternative approaches, and explored possible applications ofthis model. We have also analyzed the relation between attainment and demo-graphics or personality traits. Finally, we have shown that the outputs of theSTEP model regarding student abilities and teacher competences can be usedto optimize the overall attainment of all the students by best matching teachersto students. This achieves an overall performance that is much better than arandom or heuristic assignment.
Several directions remain open for future research. STEP was evaluated us-ing data from a short experiment in AMT, which does not necessarily reflecta realistic online learning environment. Can a similar model predict outcomesin traditional education systems? Do our results generalize to real-world datafrom MOOCs? Can we build a dynamic model, that tracks fluctuations in stu-dent ability and teacher competence over time? How can we express dependencyrelations between tasks and areas of expertise?
References
1. Anastasi, A., Urbina, S., et al.: Psychological testing. Prentice Hall, Upper SaddleRiver (1997)
2. Anderson, T.: The theory and practice of online learning. Au Press (2008)3. Archak, N.: Money, glory and cheap talk: analyzing strategic behavior of contes-
tants in simultaneous crowdsourcing contests on topcoder. com. In: Proceedings ofthe 19th International Conference on World Wide Web, pp. 21–30. ACM (2010)
4. Bachrach, Y., Graepel, T., Minka, T., Guiver, J.: How to grade a test withoutknowing the answers—a bayesian graphical model for adaptive crowdsourcing andaptitude testing. In: ICML (2012)
5. Bachrach, Y., Graepel, T., Kasneci, G., Kosinski, M., Van Gael, J.: Crowd iq:aggregating opinions to boost performance. In: AAMAS (2012)
6. Bachrach, Y., Graepel, T., Kohli, P., Kosinski, M., Stillwell, D.: Your digital im-age: factors behind demographic and psychometric predictions from social networkprofiles. In: AAMAS (2014)
7. Bachrach, Y., Kosinski, M., Graepel, T., Kohli, P., Stillwell, D.: Personality andpatterns of facebook usage. In: ACM WebSci (2012)
8. Bachrach, Y., Rosenschein, J.S.: Distributed multiagent resource allocation in di-minishing marginal return domains. In: AAMAS (2008)

96 B. Shalem et al.
9. Barrick, M.R., Mount, M.K.: The big five personality dimensions and job perfor-mance: a meta-analysis. Personnel Psychology 44(1), 1–26 (2006)
10. Brabazon, T.: Digital hemlock: Internet education and the poisoning of teaching.University of New South Wales Press (2002)
11. Brusilovsky, P., et al.: Adaptive and intelligent technologies for web-based eduction.KI 13(4), 19–25 (1999)
12. Clearwater, S.H.: Market-based control: A paradigm for distributed resource allo-cation (1996)
13. Costa Jr., P.T., McCrae, R.R.: Neo personality inventory–revised (neo-pi-r) andneo five-factor inventory (neo-ffi) professional manual. Psychological AssessmentResources, Odessa (1992)
14. Darling-Hammond, L.: Evaluating teacher effectiveness: How teacher performanceassessments can measure and improve teaching (2010)
15. De Raad, B., Schouwenburg, H.C.: Personality in learning and education: A review.European Journal of Personality 10(5), 303–336 (1998)
16. Downes, S.: The rise of moocs. Stephens Web (2012)17. Dumais, S.A.: Cultural capital, gender, and school success: The role of habitus.
Sociology of Education, 44–68 (2002)18. Eichler, H.-G., Kong, S.X., Gerth, W.C., Mavros, P., Jonsson, B.: Use of cost-
effectiveness analysis in health-care resource allocation decision-making: How arecost-effectiveness thresholds expected to emerge? Value in health 7(5), 518–528(2004)
19. Engle, J., Tinto, V.: Moving beyond access: College success for low-income, first-generation students. Pell Institute for the Study of Opportunity in Higher Educa-tion (2008)
20. Gao, X.A., Bachrach, Y., Key, P., Graepel, T.: Quality expectation-variance trade-offs in crowdsourcing contests. In: AAAI (2012)
21. Getoor, L., Friedman, N., Koller, D., Pfeffer, A., Taskar, B.: 5 probabilistic rela-tional models. Statistical Relational Learning, 129 (2007)
22. Gosling, S.D., Rentfrow, P.J., Swann, W.B.: A very brief measure of the big-fivepersonality domains. Journal of Research in Personality 37(6), 504–528 (2003)
23. Glazerman, S., Loeb, S., Goldhaber, D., Staiger, D., Raudenbush, S., Whitehurst,G.: Evaluating teachers: The important role of value-added. Brookings Institution(2010)
24. Hambleton, R.K., Swaminathan, H., Rogers, H.J.: Fundamentals of item responsetheory, vol. 2 (1991)
25. Hara, N.: Student distress in a web-based distance education course. Information,Communication & Society 3(4), 557–579 (2000)
26. Harasim, L.: Shift happens: Online education as a new paradigm in learning. TheInternet and Higher Education 3(1), 41–61 (2000)
27. Howe, J.: The rise of crowdsourcing. Wired Magazine 14(6), 1–4 (2006)28. Khan, B.H.: Web-based instruction. Prentice Hall (1997)29. Koller, D., Friedman, N.: Probabilistic Graphical Models: Principles and Tech-
niques (2009)30. Kosinski, M., Bachrach, Y., Kasneci, G., Van-Gael, J., Graepel, T.: Crowd iq:
Measuring the intelligence of crowdsourcing platforms. In: ACM WebSci (2012)31. Kosinski, M., Bachrach, Y., Kohli, P., Stillwell, D., Graepel, T.: Manifestations of
user personality in website choice and behaviour on online social networks. MachineLearning 95(3), 357–380 (2014)
32. Kosinski, M., Stillwell, D., Graepel, T.: Private traits and attributes are predictablefrom digital records of human behavior. PNAS (2013)

Students, Teachers, Exams and MOOCs 97
33. Kosinski, M., Stillwell, D., Kohli, P., Bachrach, Y., Graepel, T.: Personality andwebsite choice (2012)
34. Lavy, V.: Evaluating the effect of teachers group performance incentives on pupilachievement. Journal of Political Economy 110(6), 1286–1317 (2002)
35. Lev, O., Polukarov, M., Bachrach, Y., Rosenschein, J.S.: Mergers and collusion inall-pay auctions and crowdsourcing contests. In: AAMAS (2013)
36. Mackness, J., Mak, S., Williams, R.: The ideals and reality of participating in aMOOC. In: Networked Learing Conference (2010)
37. Minka, T., Winn, J.M., Guiver, J.P., Knowles, D.A.: Infer.NET 2.4 (2010)38. Minka, T., Winn, J.: Gates. In: NIPS, vol. 21 (2008)39. Minka, T.P.: A family of algorithms for approximate Bayesian inference. PhD thesis
(2001)40. Moore, M.G., Kearsley, G.: Distance education: A systems view of online learning.
Wadsworth Publishing Company (2011)41. Palloff, R.M., Pratt, K.: Lessons from the cyberspace classroom: The realities of
online teaching. Wiley. Com (2002)42. Pearl, J.: Probabilistic reasoning in intelligent systems: networks of plausible in-
ference (1988)43. Picciano, A.G.: Beyond student perceptions: Issues of interaction, presence, and
performance in an online course. Journal of Asynchronous Learning Networks 6(1),21–40 (2002)
44. Ridgell, S.D., Lounsbury, J.W.: Predicting academic success: General intelli-gence,big five personality traits, and work drive. College Student Journal 38(4),607–618 (2004)
45. Russell, M.T., Karol, D.L.: Institute for Personality, and Ability Testing. In: The16PF Fifth Edition Administrator’s Manual, Institute for Personality and AbilityTesting, Champaign (1994)
46. Salek, M., Bachrach, Y., Key, P.: Hotspotting – a probabilistic graphical model forimage object localization through crowdsourcing. In: AAAI (2013)
47. Schochet, P.Z., Chiang, H.S.: Error rates in measuring teacher and school per-formance based on student test score gains. ncee 2010-4004. National Center forEducation Evaluation and Regional Assistance (2010)
48. Scott, J.: Family, gender, and educational attainment in britain: A longitudinalstudy. Journal of Comparative Family Studies 35(4), 565–590 (2004)
49. Sprinthall, R.C., Fisk, S.T.: Basic statistical analysis. Prentice Hall, EnglewoodCliffs (1990)
50. Welinder, P., Branson, S., Belongie, S., Perona, P.: The multidimensional wisdomof crowds. In: NIPS (2010)
51. West, D.B., et al.: Introduction to graph theory, vol. 2. Prentice Hall, Upper SaddleRiver (2001)
52. Witkowski, J., Bachrach, Y., Key, P., Parkes, D.C.: Dwelling on the negative:Incentivizing effort in peer prediction. In: HCOMP (2013)
53. Yorke, M., Thomas, L.: Improving the retention of students from lower socio-economic groups. Journal of Higher Education Policy and Management 25(1),63–74 (2003)
Copyright © 2022 FDOKUMEN