Exams on Moodle - DiVA Portal
71
Master’s Thesis Exams on Moodle A mixed-methods study investigating student perception of usability when using Moodle’s test function
-
Upload
khangminh22 -
Category
Documents
-
view
1 -
download
0
Transcript of Exams on Moodle - DiVA Portal
Master’s Thesis
Exams on Moodle A mixed-methods study investigating student perception
of usability when using Moodle’s test function
Abstract The integration between Information and Communication Technologies (ICT) and the education field has led to the emergence of Learning Management Systems (LMS). Moodle serves as a platform for students to collaborate, access course material and take exams. This thesis investigates Moodle’s testing function using a mixed-method approach. 111 undergraduates responded to a survey relating to Nielsen’s usability attributes learnability, satisfaction and errors. Additionally, five students were interviewed. The qualitative data was thematically analyzed and indicated that students perceived Moodle’s testing function to be simple to use, though inflexible. Also, concerns were raised about the lack of visual hierarchy. Students suggested a more distinguished testing interface, the addition of a scratch-paper function, and automatic saving to prevent being timed out.
1

Acknowledgements
All that is gold does not glitter,
not all those who wander are lost
J.R.R. Tolkien
♡
There are those who deserve special praise, as without their influence this thesis would not exist.
Elissavet Kartaloglou and Despina Fyntanoglou, for
providing me with the guidance and supervision necessary to bring this project to a close.
Barbro, John, Gareth, Cassie, Mark, Kirsty, Jash, Kerstin and
Ture, for your encouraging support and allowing me the invaluable opportunity to pursue my dreams.
Lars, Pia, Albin, Anna, Lisa and little Alice, for filling me
with joy, laughter and optimism, and for being my sounding board, involuntarily bearing a burden I wish upon not even
my worst enemy.
2
Keywords and List of Abbreviations Information and Communication Technologies (ICT), Learning Management Systems (LMS), Moodle, Education, Cognitive Science, Visual Attention, Perception, Usability, Learnability, Satisfaction, Errors.
AI Artificial Intelligence
LMS Learning Management Systems
ICF Informed Consent Form
ICT Information and Communication Technologies
DFE Department for Education
DIUS Department for Innovation, Universities and Skills
UNESCO United Nations Educational, Scientific and Cultural Organization
3
List of Figures and Tables
Figures
Figure AA Google Scholar publications with “Moodle” in title 10
Figure AB Google Scholar publications with “Moodle” and “Usability” in the title 11
Figure A Thesis structure 14
Figure B The interconnectivity of the academic fields related to Cognitive Science. Creative Commons.
17
Figure C The evolution of visual attention models 19
Figure D The Necker Cube. Creative Commons. 20
Figure E The three components of perception 20
Figure F The Usability Taxonomy 24
Figure G Structure of Review of Literature and Theoretical Framework 25
Figure H Creswell’s Five Ethical Standards 36
Figure I Structure of Methodology 37
Figure J Structure of Empirical Findings and Discussion 49
Tables
Table A Number of Google Scholar results for each two-word criteria combination 14-15
Table B Inclusion criteria 15
Table C Primary areas of concern in Cognitive Science 17-18
Table D Nielsen’s ten heuristic principles for interface design 22
Table E Nielsen’s Usability Attributes 23
Table F An overview of research theory and their processes 28
Table G Methods of Data Collection 29-30
Table H The survey process 30-31
Table I Participants and demographic information 31-32
Table J Creswell’s three steps for data analysis 34
Table K Recollection of appropriate usability attributes 38
Table L Distribution of survey responses 39
Table M Descriptive statistics of survey responses 40
Table N UPT classification 47-48
4
Table of Contents
Abstract 1
Acknowledgements 2
Keywords and List of Abbreviations 3
List of Figures and Tables 4
Table of Contents 5
1 Background 7 1.1 Learning Management Systems and Moodle’s Testing Function 8 1.2 Purpose Statement and Research Questions 9 1.3 Topic Justification 9 1.4 Scope and Limitations 12 1.5 Structure 13
2 Review of Literature and Theoretical Framework 14 2.1 Related Studies 15 2.2 Cognitive Science 16 2.2.1 Visual Attention 18 2.2.2 Perception 19 2.3 Usability and User Experience 21 2.3.1 Heuristic Principles and Usability Attributes 21 2.3.2 Usability Problem Taxonomy 23 2.3.3 The DECIDE Framework 24 2.4 Summary of Review of Literature and Theoretical Framework 25
3 Methodology 27 3.1 Methodological Tradition 27 3.2 Methodological Approach 28 3.3.1 Quantitative Data Collection 30 3.3.2 Qualitative Data Collection 31 3.3.3 Interview Guide 32 3.4 Data Analysis 33 3.4.1 Quantitative Data Analysis 33 3.4.2 Qualitative Data Analysis 33 3.5 Validity and Reliability 34 3.5.1 Quantitative Validity and Reliability 34 3.5.2 Qualitative Validity and Reliability 35 3.6 Ethical Considerations 35
5
3.7 Summary of Methodology 36
4 Empirical Findings and Discussion 38 4.1 Quantitative Survey Results 38 4.2 Qualitative Themes 41 4.2.1 Simple to Use 41 4.2.2 Inflexibility 42 4.2.3 Teacher Inexpertise 43 4.2.4 Lack of Visual Hierarchy 44 4.2.5 Timing Out 45 4.2.6 Increased Stress 45 4.3 Suggestions 46 4.3.1 Scratch Paper 46 4.3.2 Distinguished Testing Interface 46 4.3.3 Automatic Saving 47 4.4 Usability Problem Taxonomy Classification 47 4.5 Summary of Empirical Findings and Discussion 48
5 Conclusion 50 5.1 Contribution 51 5.2 Reflections 51 5.3 Further Research 52
Bibliography 53
Appendices 62 Appendix 1: Survey 62 Appendix 2: Interview Questions 67 Appendix 3: Informed Consent Form 68
6
1 Background Technological advances throughout the foregoing decades have revolutionized the way humans deal and interact with information. Information and Communication Technologies (ICT) is the label which broadly defines software and applications used to connect people with technology (Farhadi, Salehi, Embi, Fooladi, Farhadi, Aghaei Chadegani and Ale Ebrahim, 2013). The push for ICT integration can be traced back to the turn of the century. Global organizations such as the World Bank and UNESCO have been prominent advocates of integrating technology (UNESCO 2003; World Bank, 1999) and the advancement of ICT has proven to correlate with economic growth and wellbeing within countries (Farhadi et al., 2013). In October of 2003, several government ministers gathered at the UNESCO headquarters in Paris to prepare for the World Summit on the Information Society, a two-phase United Nations sponsored event aimed at, among other things, creating a plan to enhance ICT integration globally.
“Universal access to information and knowledge cannot be obtained without the building of the relevant technological infrastructure. Information and communication technology (ICT) is a major tool for building knowledge societies, and these societies also entail many issues other than technology and connectivity.” (UNESCO, 2003)
In the resulting communiqué (official statement), attending ministers emphasized the importance of developing technological infrastructure to facilitate the leap towards knowledge societies (UNESCO, 2003). However, integrating ICT with education was not an obvious success. Initially, concerns were raised as to if such collaboration would be practical. It was argued that in certain instances, institutions may lack the resources necessary to provide their classrooms and students with the necessary ICT. Given the benefits of ICT in education, some students would fall behind academically generating a skewed distribution of student performance depending on the school they attended (Pelgrum, 2001). Additionally, there was a subtle hesitance among teachers, who perceived there to exist a knowledge barrier between them and ICT (Pelgrum, 2001). Furthermore, the teachers raised concerns about whether the emergence of technology would result in them forfeiting a degree of authority within the educational setting (Pelgrum, 2001; Nissen and Jedeskog, 2004).
7
Today, despite the inaugural reluctance, and not without concern (Khadija, 2019), education is integrated with ICT through mediums commonly referred to as Learning Management Systems. Learning Management Systems (LMS) are software that work as an online platform for students and teachers to interact. LMS offers a plethora of functions: students can enroll in courses, view syllabi and upload assignments. Likewise, teachers are able to give feedback, provide course resources and upload student grades, et cetera (Sharma and Vatta, 2013). Furthermore, Costley (2014) argued the presence of technology in education would continue to increase, implying that the integration of ICT and education is now a “how”-question as opposed to an “if”-question. Additionally, Costley (2014) asserted that successful integration was an essential factor in determining students meet their learning outcomes.
1.1 Learning Management Systems and Moodle’s Testing Function As alluded to previously, Learning Management Systems are platforms on which institutions can deliver content such as video lectures, syllabi and facilitate discussions, et cetera (Dobre, 2015). 72 percent of institutions in higher education use Moodle, Blackboard Learn or Canvas as their primary platform. Out of these, Blackboard Learn (33 percent) is the most popular, with Canvas (20 percent) and Moodle (19 percent) both used by one fifth of institutions (Edutechnica, 2017). Moodle was created by then graduate student Martin Douigmas who developed the technology during his studies at Curtin University (Dougiamas and Taylor, 2002). Moodle is open-source, which means that the source-code is free to use and customize under a public license. While the source-code is free, there are costs associated with server hosting and other services (Moodle.org, 2020). The first version was released in August 2002. As of March 10, 2020, Moodle runs version 3.8 and still supports version 3.1 (Moodle, 2020). Examples of studies that find issues relating to Moodle’s testing function are plentiful. For instance, Cohen and Sasson (2016) conducted a study with the purpose of investigating student attitudes towards quizzes on Moodle. They attempted to decipher the difference in student perception between traditional “pen-and-paper” quizzes and online quizzes. Ambiguous results encouraged the authors to conclude further research is required to improve online course design, specifically suggesting qualitative methods such as interviews.
8
1.2 Purpose Statement and Research Questions The purpose of this study is to examine student perception of Moodle’s testing function through the lens of Nielsen’s (1993c) usability attributes learnability, satisfaction and errors, and to generate suggestions which may improve the perceived usability. As the testing function of Moodle is often used in situations where time is scarce, usability attributes that assume students are already familiar with the software, in this case memorability and efficiency, are excluded from investigation. Detailed description of each usability attribute is found in the Theoretical Framework (Ch. 2.3.1). Similarly, Kakasevski, Mihajlov, Arsenovski and Chungurski (2008) argue for the existence of several problems related to the overall usability of Moodle. More specifically, they examined what is referred to as “Assignments”, which includes both the testing function (quizzes, essays, et cetera) as well as the action of uploading documents and other course materials. His study showed that 70 percent of the research subjects, consisting of both students and teachers, found the testing function sufficient for assessing knowledge, indicating a need for better understanding of how students perceive the testing software. The results are echoed by Hasan (2018), who found that 78 percent of students consider uploading assignments to be difficult. Two research questions are formulated based on the objectives of this study.
RQ1: How do undergraduate students perceive the Moodle’s testing function regarding usability, particularly learnability, satisfaction and error prevention?
and
RQ2: What ideas do undergraduate students suggest be considered regarding the user interface of Moodle’s testing function, particularly in areas of learnability, satisfaction and error prevention?
1.3 Topic Justification The policies of higher education are shaped by its present day needs and authorities. This was the case at the inception of academia in the early 13th century, evident by students at the University of Bologna rebelling against the Roman-Catholic influence (Young, 2005), and such is the case today, with universities being primarily concerned with preparing students for the job market (Tomlinson, 2012; Department for Innovation, Universities and Skills, 2008), as policy-makers actively put emphasis on employability when deciding what skills students should learn. As a result, universities and businesses collaborate in
9

order to allow for efficient transition into the job market (Wilson, 2012). Additionally, Hassard, McCann and Morris (2008) argues that the job market influence is primarily driven by the previously mentioned push for a knowledge society, a claim further concurred in the Browne Report (Department for Education, 2010) which also advocates for further increase of private funding in higher education.
“Increased private contributions and more targeted public investment to support high quality provision and allow the sector to grow to meet qualified demand.” (DFE, 2010)
As universities face economic pressures, there are incentives to move lectures and examinations online (O’Flaherty and Phillips, 2015). Many times, examinations are the ultimate determinator of whether students are granted a degree. Therefore, ensuring knowledge is assessed accurately becomes the responsibility of not only the educating institution, but also the Learning Management System (Costley, 2014). In order to gain apprehension regarding this issue, researchers conduct studies aimed at examining student perception of usability. Since its inception in October of 2002, Moodle has been a popular topic of inquiry. As of May 10, 2020, a Google Scholar query filtered to only include publications with “Moodle” in the title returns 12,900 responses. Below, Figure AA illustrates the cumulative number of publications from December 31, 2003 through 2019.
Figure AA. Google Scholar publications with “Moodle” in title.
It is important to note that not all publications with “Moodle” in the title address questions regarding usability. Therefore, Figure AB illustrates the cumulative number of Google Scholar publications including both “Moodle” and “Usability” in the title. The time-frame is matched to that of Figure AA.
10
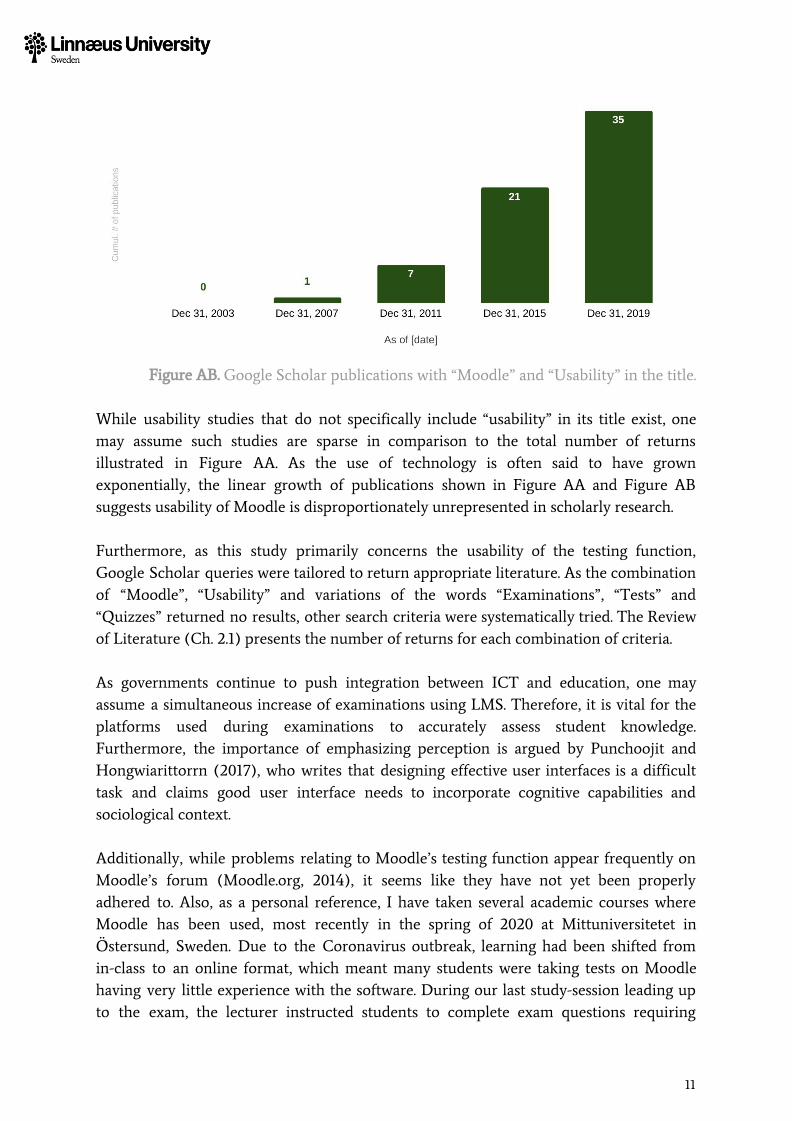
Figure AB. Google Scholar publications with “Moodle” and “Usability” in the title.
While usability studies that do not specifically include “usability” in its title exist, one may assume such studies are sparse in comparison to the total number of returns illustrated in Figure AA. As the use of technology is often said to have grown exponentially, the linear growth of publications shown in Figure AA and Figure AB suggests usability of Moodle is disproportionately unrepresented in scholarly research. Furthermore, as this study primarily concerns the usability of the testing function, Google Scholar queries were tailored to return appropriate literature. As the combination of “Moodle”, “Usability” and variations of the words “Examinations”, “Tests” and “Quizzes” returned no results, other search criteria were systematically tried. The Review of Literature (Ch. 2.1) presents the number of returns for each combination of criteria. As governments continue to push integration between ICT and education, one may assume a simultaneous increase of examinations using LMS. Therefore, it is vital for the platforms used during examinations to accurately assess student knowledge. Furthermore, the importance of emphasizing perception is argued by Punchoojit and Hongwiarittorrn (2017), who writes that designing effective user interfaces is a difficult task and claims good user interface needs to incorporate cognitive capabilities and sociological context. Additionally, while problems relating to Moodle’s testing function appear frequently on Moodle’s forum (Moodle.org, 2014), it seems like they have not yet been properly adhered to. Also, as a personal reference, I have taken several academic courses where Moodle has been used, most recently in the spring of 2020 at Mittuniversitetet in Östersund, Sweden. Due to the Coronavirus outbreak, learning had been shifted from in-class to an online format, which meant many students were taking tests on Moodle having very little experience with the software. During our last study-session leading up to the exam, the lecturer instructed students to complete exam questions requiring
11
calculations by hand on a sheet of paper, take pictures of the paper sheets, and attach these in an email. As interface designers may not be adequately skilled in these areas, one may suggest that some user interfaces fail to live up to their full potential. Studies concerned with improving the usability of the testing function of LMS are therefore justified.
1.4 Scope and Limitations This study examines the student perspective of usability when using Moodle’s testing function. However, as previously rationalized, the study excludes the usability attributes memorability and efficiency, as they refer to usability elements that relate to students previously knowing how to operate the system. In a scenario where time is scarce, a student may not have time to familiarize themselves with the system. Nielsen’s (1993) usability attributes are further explained in the Theoretical Framework (Ch. 2.3). The study targeted students at Gustavus Adolphus College, a small, liberal arts college in the United States. Therefore, the results of study should be viewed and interpreted in such regard. Initially, the minimal sample size in order to ensure quantitative validity was 100. After excluding survey responses from individuals who failed to meet necessary inclusion criteria, the total number of survey respondents were 111. While the study is mixed-methods in nature, the discussion of empirical findings is primarily based on the qualitative data generated through interviewing. However, while emphasis is placed on the interviews, the survey in this study serves three primary purposes, 1) to generate a general understanding of the student perception relating to the usability attributes learnability, satisfaction and errors, 2) to generate interview questions based on this general understanding and 3) to allow students to generate comments, contributing to the qualitative data. It is important to note that the quantitative data should not be analyzed separately as it is fundamentally used to support the qualitative section of the study. The majority of the study was conducted from February 2018 to May 2018. However, two additional subjects were interviewed in March 2020. This was done in order to strengthen validity and to further underline the qualitative emphasis of the study. While the ambition is to generate empirical data that can be applied anywhere, researchers often place limitations on their studies in order to control for confounding errors. For instance, it is inherently difficult to anticipate the quality of responses to surveys. Therefore, it is important to note that one’s perspective (and therefore answers given in surveys and to interview questions) may differ depending on the respondents
12
cognitive abilities (Shultz and Hand, 2015). A person who finds one particular software or application difficult to learn may perceive it to lack user friendliness, while another may regard its usability attributes. Harms and Adams (2008) therefore highlight perceived usability as the purpose of user-centered design. Shultz and Hand (2015) further specifies factors such as setting, age, nationality and culture may affect one's cognitive ability. To mitigate against such confounding issues, the interview subjects in this study are overwhelmingly homogenous.
1.5 Structure The thesis is divided into five chapters. The opening chapter brings the reader up to date and introduces the learning management system Moodle. The first chapter includes a rationalization of the thesis purpose, as well as an argument justifying why such research is necessary. Following the introduction, the second chapter contains a review of past usability studies on Moodle. The chapter also provides a presentation of the theoretical framework used in the study. Furthermore, methodological traditions and approaches are presented in the third chapter. Also included in the chapter are ethical considerations and a discussion regarding validity and reliability. In the fourth chapter, empirical data are presented and discussed. Quantitative data collected from the survey are presented separately from the qualitative data collected through the survey and interviews. The discussion relates the data collected to the findings and conclusions of studies examined in the chapter presenting related studies (Ch. 2.1). The thesis concludes with a discussion of its contribution. Further research topics are also suggested. Figure A provides an illustration of the thesis structure.
13
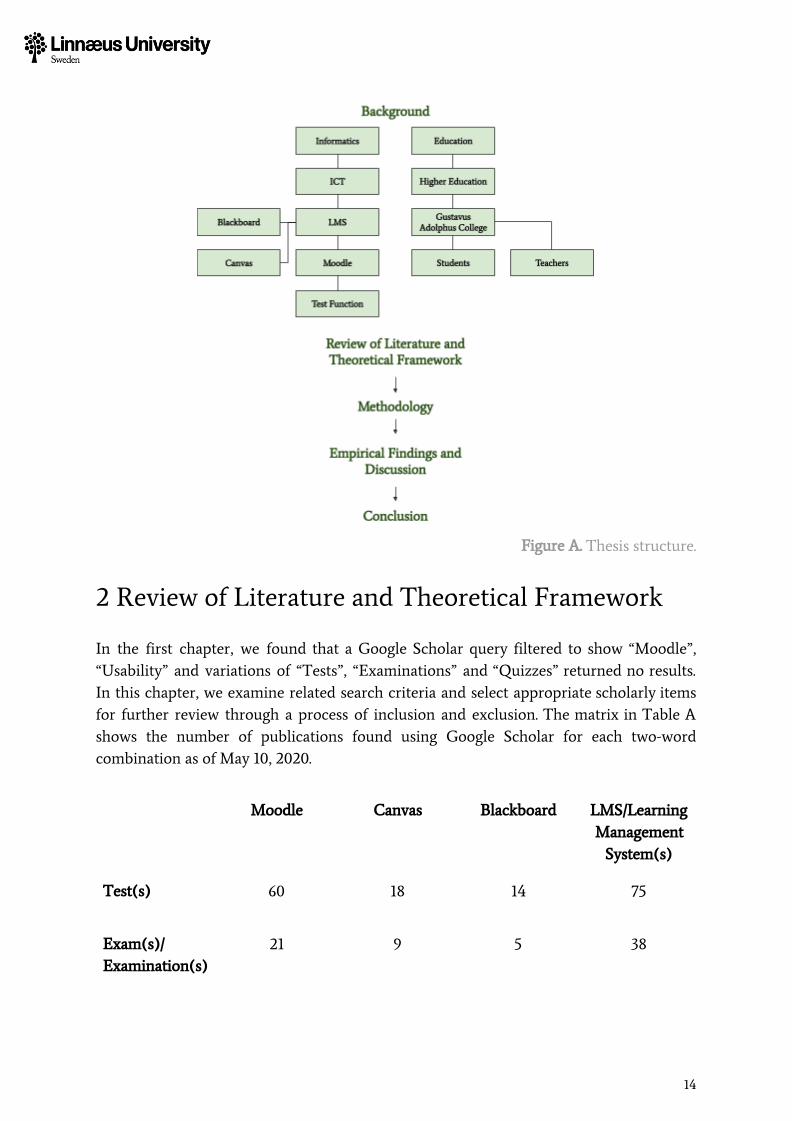
Figure A. Thesis structure.
2 Review of Literature and Theoretical Framework In the first chapter, we found that a Google Scholar query filtered to show “Moodle”, “Usability” and variations of “Tests”, “Examinations” and “Quizzes” returned no results. In this chapter, we examine related search criteria and select appropriate scholarly items for further review through a process of inclusion and exclusion. The matrix in Table A shows the number of publications found using Google Scholar for each two-word combination as of May 10, 2020.
Moodle Canvas Blackboard LMS/Learning Management
System(s)
Test(s) 60 18 14 75
Exam(s)/ Examination(s)
21 9 5 38
14
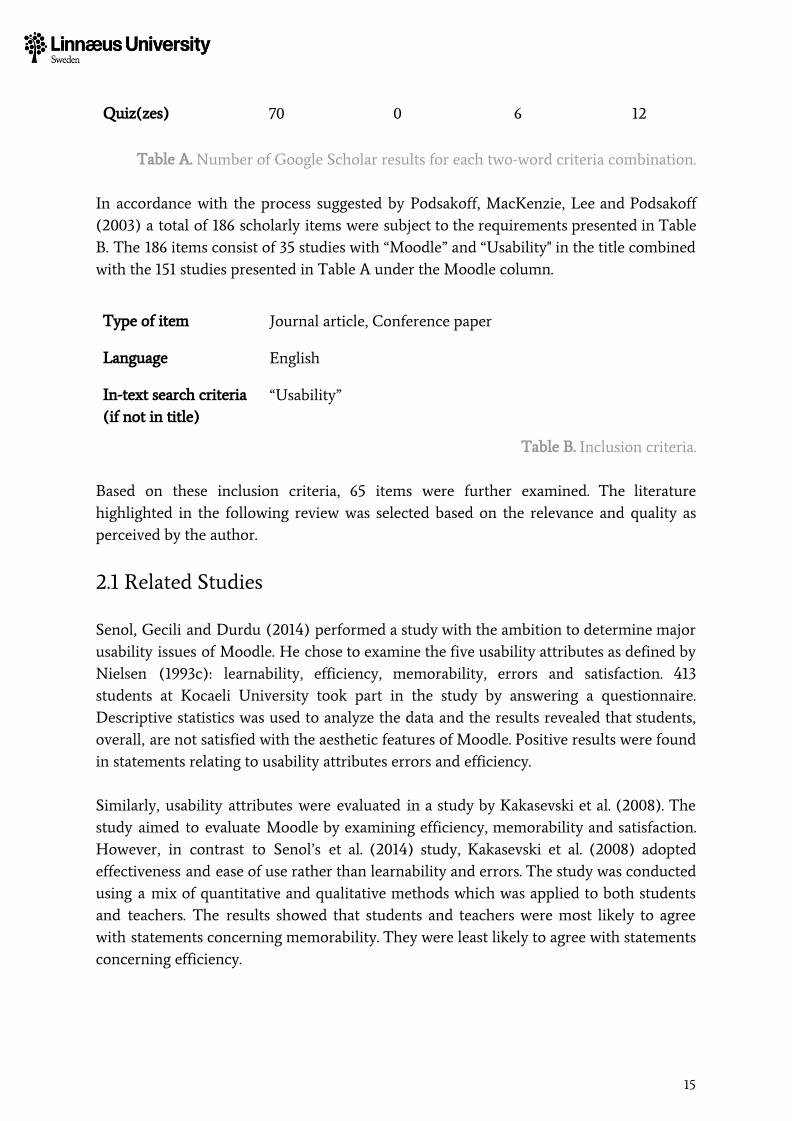
Quiz(zes) 70 0 6 12
Table A. Number of Google Scholar results for each two-word criteria combination. In accordance with the process suggested by Podsakoff, MacKenzie, Lee and Podsakoff (2003) a total of 186 scholarly items were subject to the requirements presented in Table B. The 186 items consist of 35 studies with “Moodle” and “Usability" in the title combined with the 151 studies presented in Table A under the Moodle column.
Type of item Journal article, Conference paper
Language English
In-text search criteria (if not in title)
“Usability”
Table B. Inclusion criteria. Based on these inclusion criteria, 65 items were further examined. The literature highlighted in the following review was selected based on the relevance and quality as perceived by the author.
2.1 Related Studies Senol, Gecili and Durdu (2014) performed a study with the ambition to determine major usability issues of Moodle. He chose to examine the five usability attributes as defined by Nielsen (1993c): learnability, efficiency, memorability, errors and satisfaction. 413 students at Kocaeli University took part in the study by answering a questionnaire. Descriptive statistics was used to analyze the data and the results revealed that students, overall, are not satisfied with the aesthetic features of Moodle. Positive results were found in statements relating to usability attributes errors and efficiency. Similarly, usability attributes were evaluated in a study by Kakasevski et al. (2008). The study aimed to evaluate Moodle by examining efficiency, memorability and satisfaction. However, in contrast to Senol’s et al. (2014) study, Kakasevski et al. (2008) adopted effectiveness and ease of use rather than learnability and errors. The study was conducted using a mix of quantitative and qualitative methods which was applied to both students and teachers. The results showed that students and teachers were most likely to agree with statements concerning memorability. They were least likely to agree with statements concerning efficiency.
15
Additionally, Hasan (2018) conducted a study examining Moodle from a usability perspective. The study was conducted to 1) find Moodle’s the most useful features and functions and 2) to provide suggestions and guidance to academic institutions who utilize Moodle and other LMS. The study was conducted at the Zarqa University in Jordan, the subjects were university students and the method used was a questionnaire. 17 usability problems were found and Hasan concluded the study by providing ten suggestions on how to solve them. One such suggestion was to improve the uploading function, as 70% of the students indicated they had trouble submitting their assignments. The finding was mimicked in a questionnaire given in order to evaluate and compare the usability of three learning management systems including Moodle, where Rosato, Dodds and Laughlin (2004) also found students had problems submitting assignments. Similarly, Melton (2006) employed the user testing method on Japanese students in order to examine the usability aspects of course registration and assignment uploading, and concluded half of the students found uploading assignments difficult. The result is further echoed by Thuseethan, Achchuthan and Kuhanesan (2015) who used questionnaires to evaluate student perspectives of Moodle across Sri Lanka. The study revealed usability problems concerning logging in and submitting assignments. Additionally, in the same study, visual inconsistency is expressed as a problem (specifically font size and color). Furthermore, Ifinedo, Pyke and Alvar (2018) conducted a study designed to investigate the effects certain usability factors have on undergraduate use outcomes. Use outcomes are defined as combined measurement of academic performance, perceived learning assistance, and perceived impact on learning. Additionally, the study explored the role of support coming from teachers and peers in relation to the use factors. The researchers gathered perceptions from 126 undergraduate students in Canada through the employment of a questionnaire. The perceptions were then compared to the use outcomes. They found that high marks on usability perceptions correlated with high use outcomes. However, they also found that teacher and peer support did not correlate with use outcomes. In conclusion, Al-Sarrayrih, Knipping and Zorn (2012) used questionnaires to evaluate Moodle’s usability. The results show that students express a lack of trust in Moodle, with 46 percent agreeing to a statement regarding Moodle’s ability to help them recover should they make a mistake.
2.2 Cognitive Science The field of informatics has dealt with the task of engineering information in a way that aids the life of humans. This, by nature, has led to informatics becoming an interdisciplinary field involving more disciplines than information technology. While a tremendous number of scientific fields can be attributed, some play a more profound role
16
than others, such as Cognitive Science (Nelson and Staggers, 2008). Durrani and Durrani (2009) consider the primary task for interface designers to be the creation of systems which can be used intuitively. In order to create such a system, the designer needs an understanding of human cognition. The argument is further emphasized by Punchoojit and Hongwiarittorrn (2017), who notes that designing effective user interfaces is no easy task and claims good user interface needs to incorporate, among other things, cognitive capabilities and sociological context. As interface designers may not be adequately skilled in all these areas simultaneously, one may suggest that some user interfaces fail to live up to their full potential.
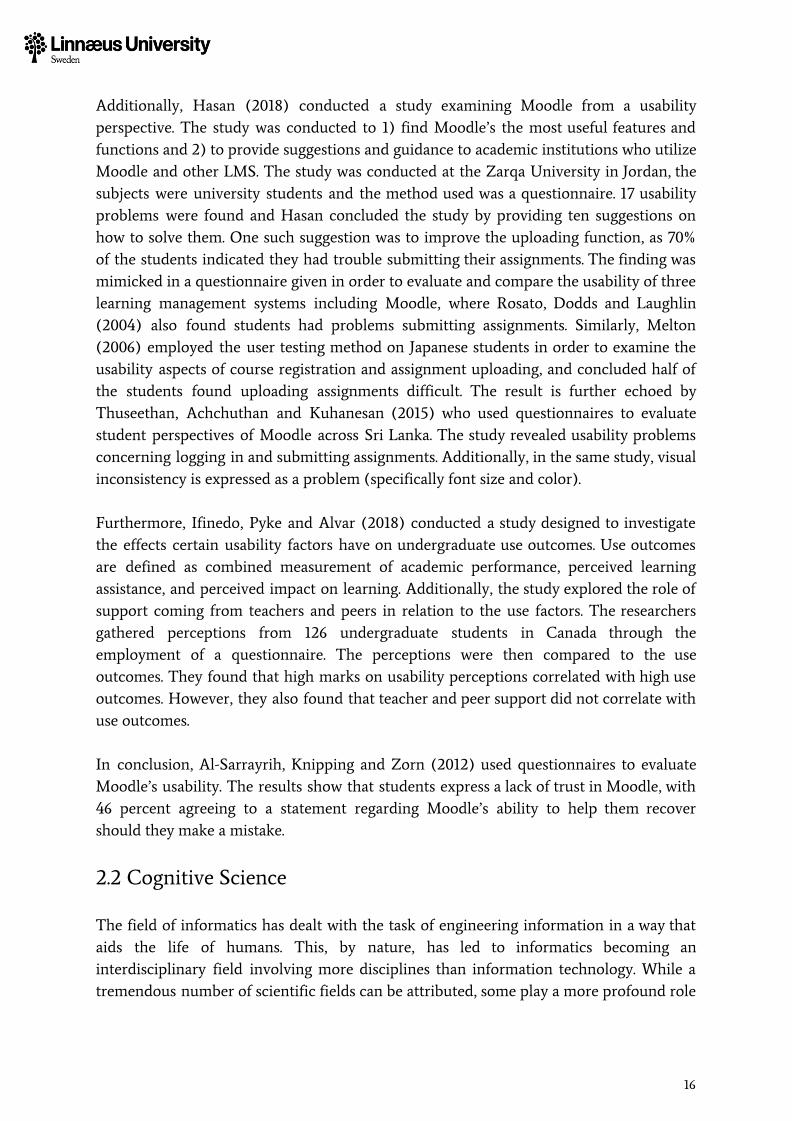
Figure B. The interconnectivity of the academic fields related to Cognitive Science.
Miller (2003). Historically, Cognitive Science has been considered an interdisciplinary field involving various corners of the academic literature such as philosophy, psychology, linguistics, computer science, neuroscience and anthropology (Miller, 2003). Figure B illustrates the interconnectivity of academic fields and Cognitive Science.
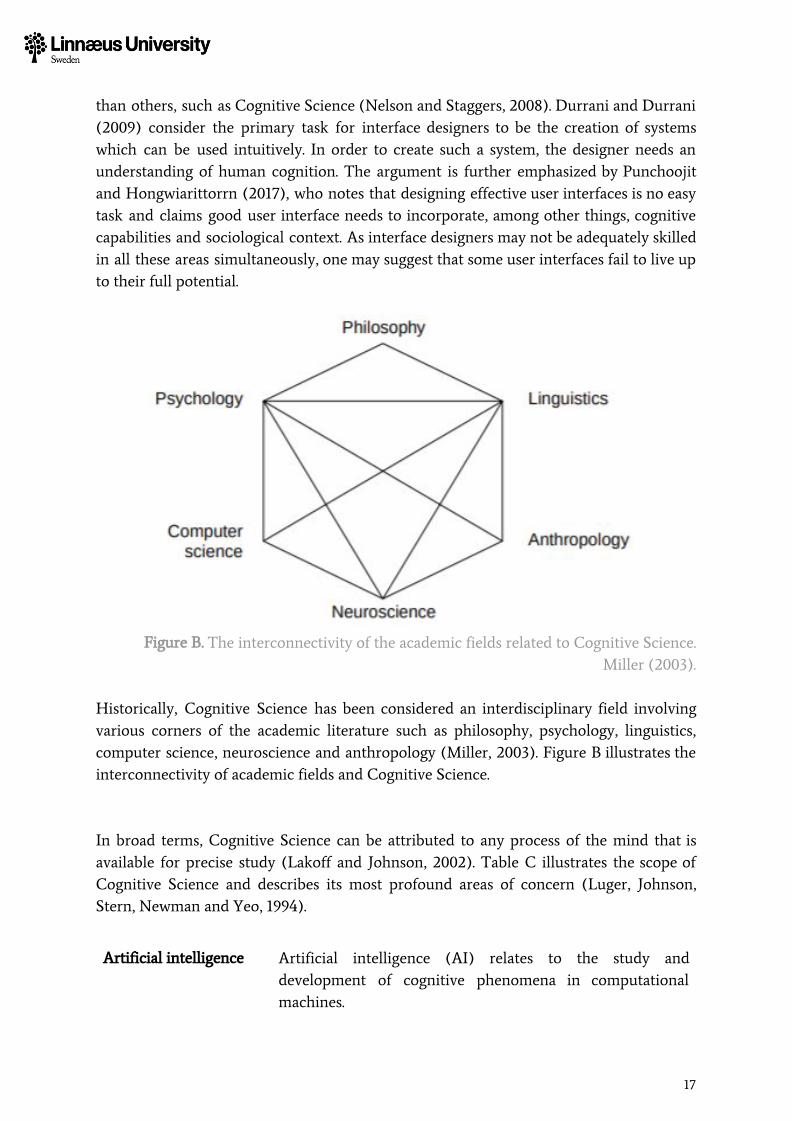
In broad terms, Cognitive Science can be attributed to any process of the mind that is available for precise study (Lakoff and Johnson, 2002). Table C illustrates the scope of Cognitive Science and describes its most profound areas of concern (Luger, Johnson, Stern, Newman and Yeo, 1994).
Artificial intelligence Artificial intelligence (AI) relates to the study and development of cognitive phenomena in computational machines.
17
Attention Attention relates to the process of filtering through stimuli.
Language processing Language processing relates to the investigation of sound and speech patterns.
Learning and development
Learning and development relates to the study of knowledge and information acquisition.
Memory Memory relates to the processes associated with information storing.
Perception Perception and relates to the transformation process of stimuli.
Consciousness Consciousness relates to the awareness of objectivity and subjectivity.
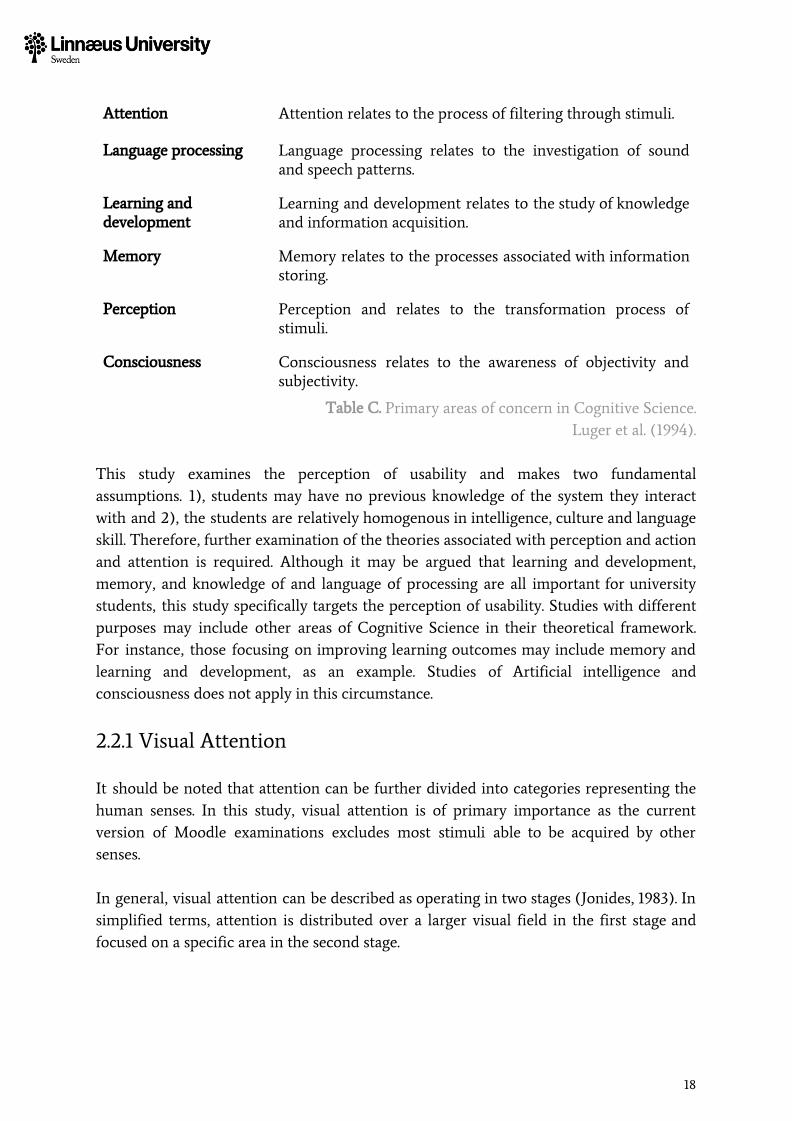
Table C. Primary areas of concern in Cognitive Science. Luger et al. (1994).
This study examines the perception of usability and makes two fundamental assumptions. 1), students may have no previous knowledge of the system they interact with and 2), the students are relatively homogenous in intelligence, culture and language skill. Therefore, further examination of the theories associated with perception and action and attention is required. Although it may be argued that learning and development, memory, and knowledge of and language of processing are all important for university students, this study specifically targets the perception of usability. Studies with different purposes may include other areas of Cognitive Science in their theoretical framework. For instance, those focusing on improving learning outcomes may include memory and learning and development, as an example. Studies of Artificial intelligence and consciousness does not apply in this circumstance.
2.2.1 Visual Attention It should be noted that attention can be further divided into categories representing the human senses. In this study, visual attention is of primary importance as the current version of Moodle examinations excludes most stimuli able to be acquired by other senses. In general, visual attention can be described as operating in two stages (Jonides, 1983). In simplified terms, attention is distributed over a larger visual field in the first stage and focused on a specific area in the second stage.
18
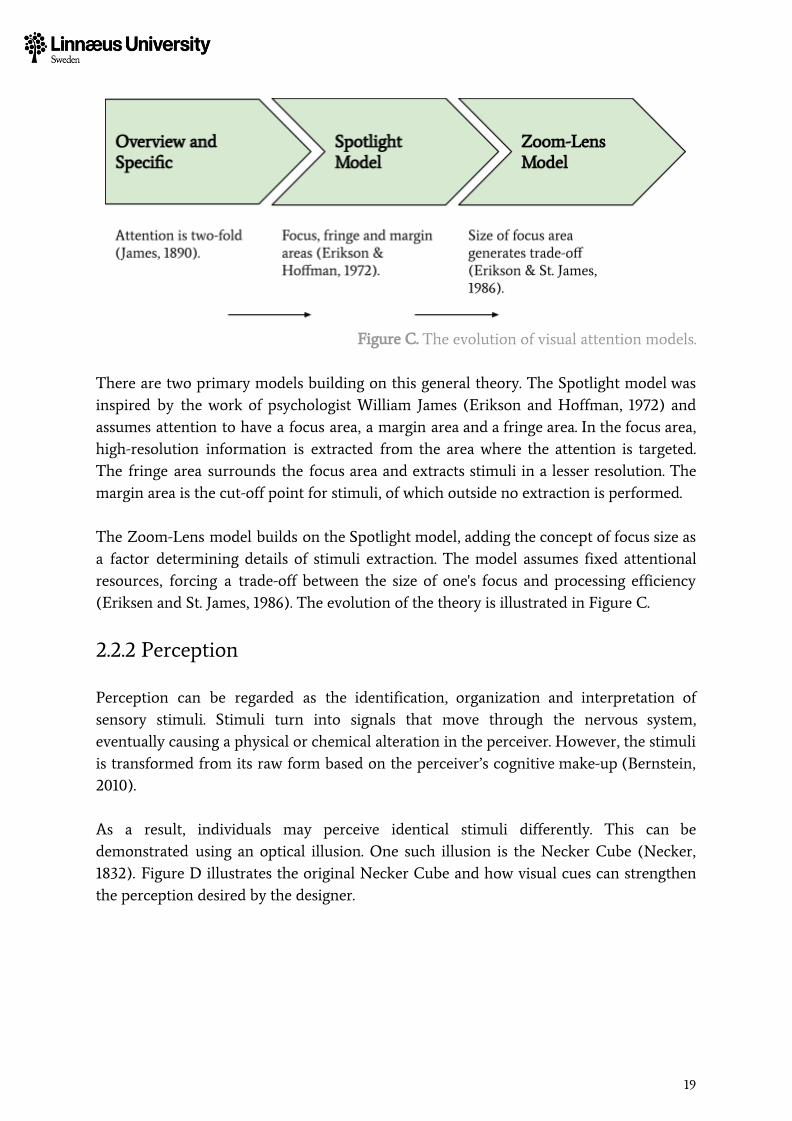
Figure C. The evolution of visual attention models.
There are two primary models building on this general theory. The Spotlight model was inspired by the work of psychologist William James (Erikson and Hoffman, 1972) and assumes attention to have a focus area, a margin area and a fringe area. In the focus area, high-resolution information is extracted from the area where the attention is targeted. The fringe area surrounds the focus area and extracts stimuli in a lesser resolution. The margin area is the cut-off point for stimuli, of which outside no extraction is performed. The Zoom-Lens model builds on the Spotlight model, adding the concept of focus size as a factor determining details of stimuli extraction. The model assumes fixed attentional resources, forcing a trade-off between the size of one's focus and processing efficiency (Eriksen and St. James, 1986). The evolution of the theory is illustrated in Figure C.
2.2.2 Perception Perception can be regarded as the identification, organization and interpretation of sensory stimuli. Stimuli turn into signals that move through the nervous system, eventually causing a physical or chemical alteration in the perceiver. However, the stimuli is transformed from its raw form based on the perceiver’s cognitive make-up (Bernstein, 2010). As a result, individuals may perceive identical stimuli differently. This can be demonstrated using an optical illusion. One such illusion is the Necker Cube (Necker, 1832). Figure D illustrates the original Necker Cube and how visual cues can strengthen the perception desired by the designer.
19
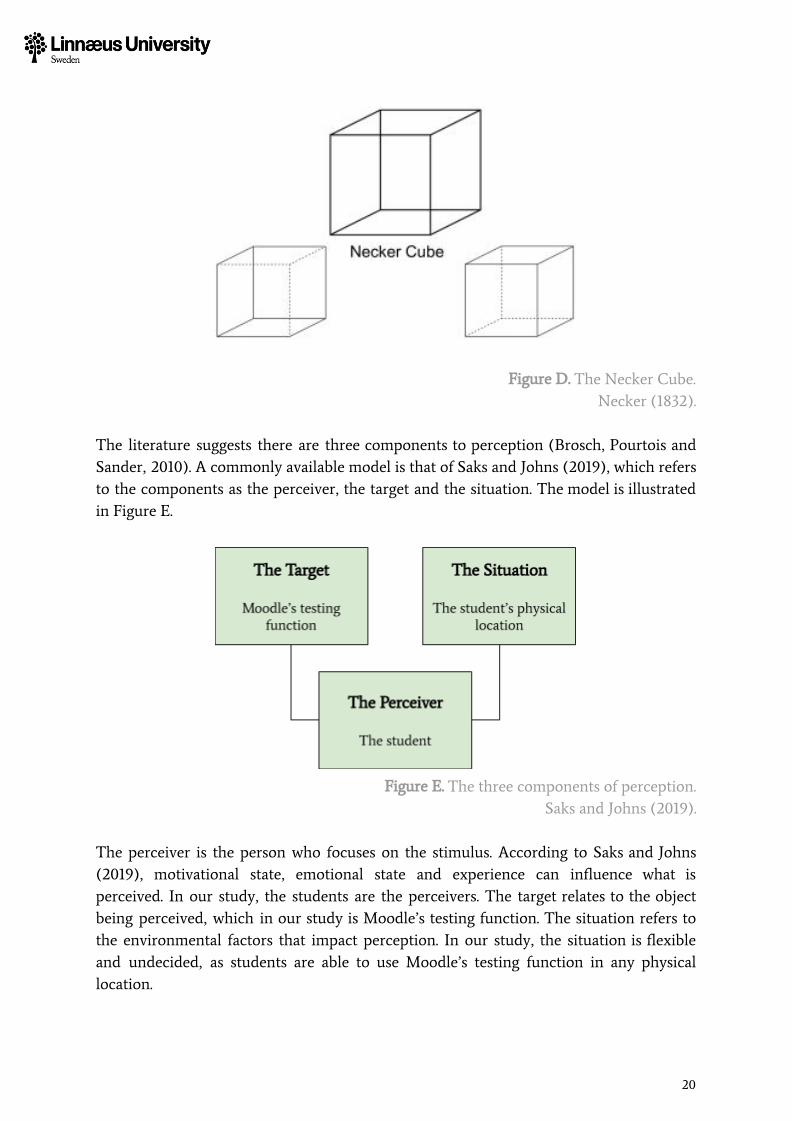
Figure D. The Necker Cube. Necker (1832).
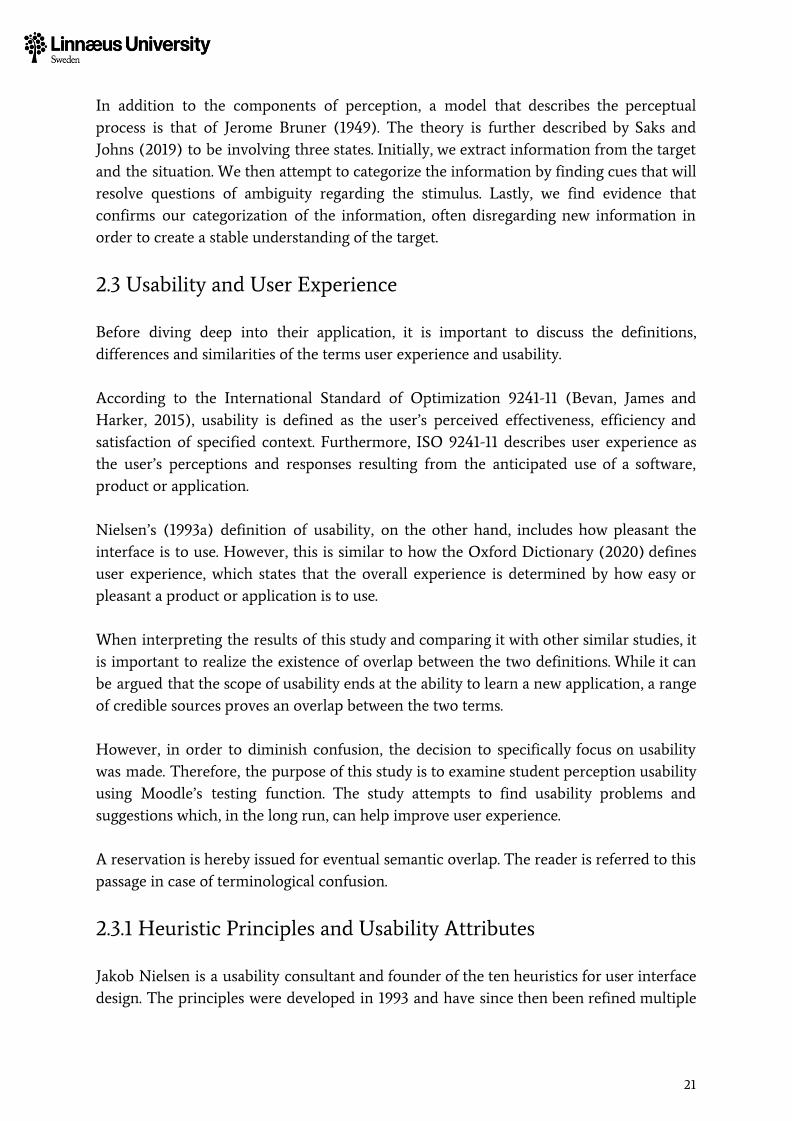
The literature suggests there are three components to perception (Brosch, Pourtois and Sander, 2010). A commonly available model is that of Saks and Johns (2019), which refers to the components as the perceiver, the target and the situation. The model is illustrated in Figure E.
Figure E. The three components of perception.
Saks and Johns (2019). The perceiver is the person who focuses on the stimulus. According to Saks and Johns (2019), motivational state, emotional state and experience can influence what is perceived. In our study, the students are the perceivers. The target relates to the object being perceived, which in our study is Moodle’s testing function. The situation refers to the environmental factors that impact perception. In our study, the situation is flexible and undecided, as students are able to use Moodle’s testing function in any physical location.
20
In addition to the components of perception, a model that describes the perceptual process is that of Jerome Bruner (1949). The theory is further described by Saks and Johns (2019) to be involving three states. Initially, we extract information from the target and the situation. We then attempt to categorize the information by finding cues that will resolve questions of ambiguity regarding the stimulus. Lastly, we find evidence that confirms our categorization of the information, often disregarding new information in order to create a stable understanding of the target.
2.3 Usability and User Experience Before diving deep into their application, it is important to discuss the definitions, differences and similarities of the terms user experience and usability. According to the International Standard of Optimization 9241-11 (Bevan, James and Harker, 2015), usability is defined as the user’s perceived effectiveness, efficiency and satisfaction of specified context. Furthermore, ISO 9241-11 describes user experience as the user’s perceptions and responses resulting from the anticipated use of a software, product or application. Nielsen’s (1993a) definition of usability, on the other hand, includes how pleasant the interface is to use. However, this is similar to how the Oxford Dictionary (2020) defines user experience, which states that the overall experience is determined by how easy or pleasant a product or application is to use. When interpreting the results of this study and comparing it with other similar studies, it is important to realize the existence of overlap between the two definitions. While it can be argued that the scope of usability ends at the ability to learn a new application, a range of credible sources proves an overlap between the two terms. However, in order to diminish confusion, the decision to specifically focus on usability was made. Therefore, the purpose of this study is to examine student perception usability using Moodle’s testing function. The study attempts to find usability problems and suggestions which, in the long run, can help improve user experience. A reservation is hereby issued for eventual semantic overlap. The reader is referred to this passage in case of terminological confusion.
2.3.1 Heuristic Principles and Usability Attributes Jakob Nielsen is a usability consultant and founder of the ten heuristics for user interface design. The principles were developed in 1993 and have since then been refined multiple
21
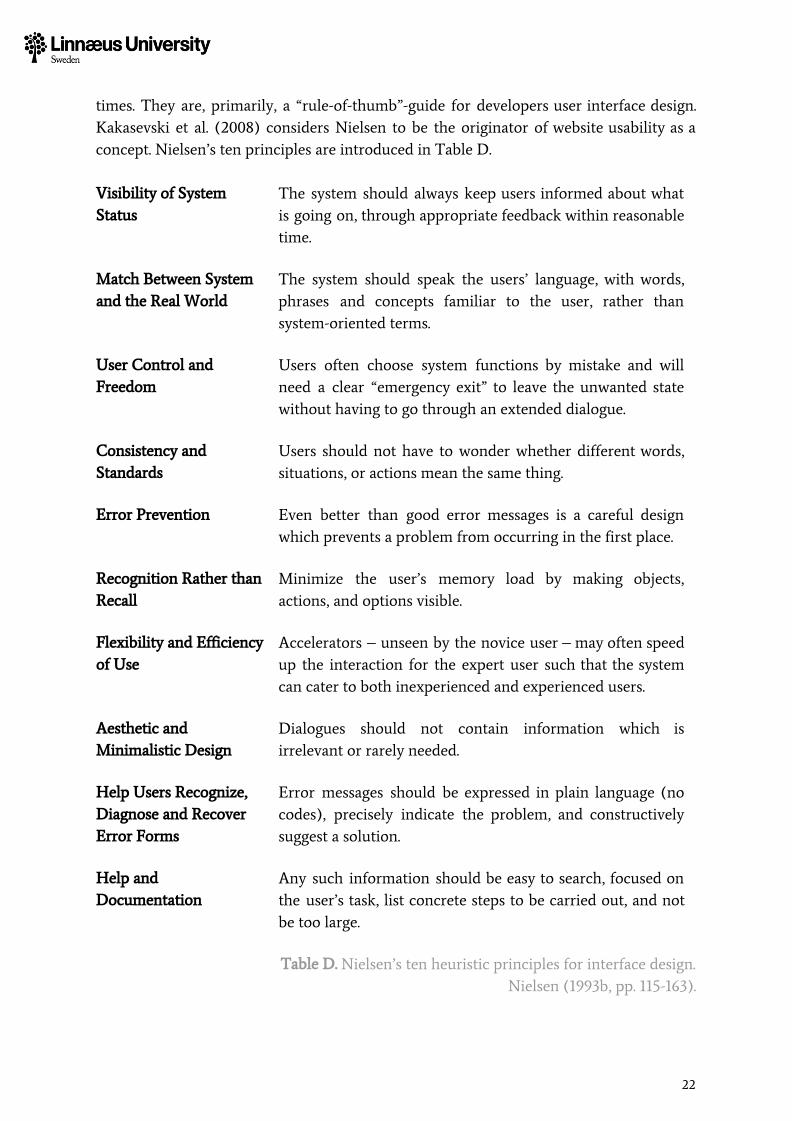
times. They are, primarily, a “rule-of-thumb”-guide for developers user interface design. Kakasevski et al. (2008) considers Nielsen to be the originator of website usability as a concept. Nielsen’s ten principles are introduced in Table D. Visibility of System Status
The system should always keep users informed about what is going on, through appropriate feedback within reasonable time.
Match Between System and the Real World
The system should speak the users’ language, with words, phrases and concepts familiar to the user, rather than system-oriented terms.
User Control and Freedom
Users often choose system functions by mistake and will need a clear “emergency exit” to leave the unwanted state without having to go through an extended dialogue.
Consistency and Standards
Users should not have to wonder whether different words, situations, or actions mean the same thing.
Error Prevention Even better than good error messages is a careful design which prevents a problem from occurring in the first place.
Recognition Rather than Recall
Minimize the user’s memory load by making objects, actions, and options visible.
Flexibility and Efficiency of Use
Accelerators – unseen by the novice user – may often speed up the interaction for the expert user such that the system can cater to both inexperienced and experienced users.
Aesthetic and Minimalistic Design
Dialogues should not contain information which is irrelevant or rarely needed.
Help Users Recognize, Diagnose and Recover Error Forms
Error messages should be expressed in plain language (no codes), precisely indicate the problem, and constructively suggest a solution.
Help and Documentation
Any such information should be easy to search, focused on the user’s task, list concrete steps to be carried out, and not be too large.
Table D. Nielsen’s ten heuristic principles for interface design. Nielsen (1993b, pp. 115-163).
22

Furthemore, Nielsen defines usability as a “quality attribute”. If the ten principles are a guide to developing interface design, a quality attribute is a criteria which determines how well the principles are being followed. The attributes, or dimensions as they are also referred to as, are learnability, efficiency, memorability, errors, and satisfaction. They are defined in Table E. Learnability Learnability asks the question of how users adapt and understand a
task or a system the first time they encounter it.
Efficiency Efficiency looks at how quickly users can perform a task once they have learned the design.
Memorability Memorability revolves around the user's retention rate after not using the design for a period of time.
Errors Errors deal with how many errors users make, as well as how severe they are.
Satisfaction Satisfaction is focused on how pleasant the design is to use.
Table E. Nielsen’s Usability Attributes. Nielsen (1993c, pp. 23-43).
In the scope of this study, the principles are used as the foundation on which the interview questions were created. They also provide a broader vocabulary when analyzing answers, as well as when categorizing them to their corresponding themes.
2.3.2 Usability Problem Taxonomy In order to find conclusive arguments when analyzing the qualitative data gathered from interviews and survey questions, a conceptual framework is used to categorize the findings. The Usability Problem Taxonomy (UPT) is one such framework (Keenan, Hartson and Kafura, 1999).
The Usability Problem Taxonomy allows us to classify our usability problems. The UPT does this by dividing the problems into two components, tasks and artifacts.
Tasks are related to user achievements and deal with functionality and purpose of the design in question. On the other hand, artifacts deal with three distinguished aspects of the design pattern. These three aspects are language, manipulation and visual look. The
23

UPT helps us examine the three chosen usability dimensions (satisfaction, error prevention and learnability) closer. It also determines what problems fall outside these three dimensions (Keenan et al., 1999). The UPT is presented in Figure F.
Figure F. The Usability Taxonomy. Keenan et al. (1999, pp. 71–104).
2.3.3 The DECIDE Framework
Another potentially useful framework is DECIDE. Preece, Rogers and Sharp (2002) describes the framework as suitable for usability evaluation. The framework consists of six elements, explained below.
1) Determine the overall goals that the evaluation addresses. 2) Explore the specific questions to be answered. 3) Choose the evaluation paradigm and techniques to answer the questions. 4) Identify the practical issues that must be addressed, such as selecting participants 5) Decide how to deal with ethical issues. 6) Evaluate, interpret, and present the data.
24
Melton (2006) conducted a small usability study of students using Moodle based on the DECIDE framework. He was particularly interested in the registration process as well as the assignment submission module. Melton’s study showed that students coped with intermediate tasks, but only reached a success rate of 50% when asked to complete a more complex exercise. His interpretation of the results was that students require more instruction and that teachers should focus on understanding the needs of students. As it predominantly suits task-based studies, which is the type of study conducted by Melton, the DECIDE framework is not utilized in this study.
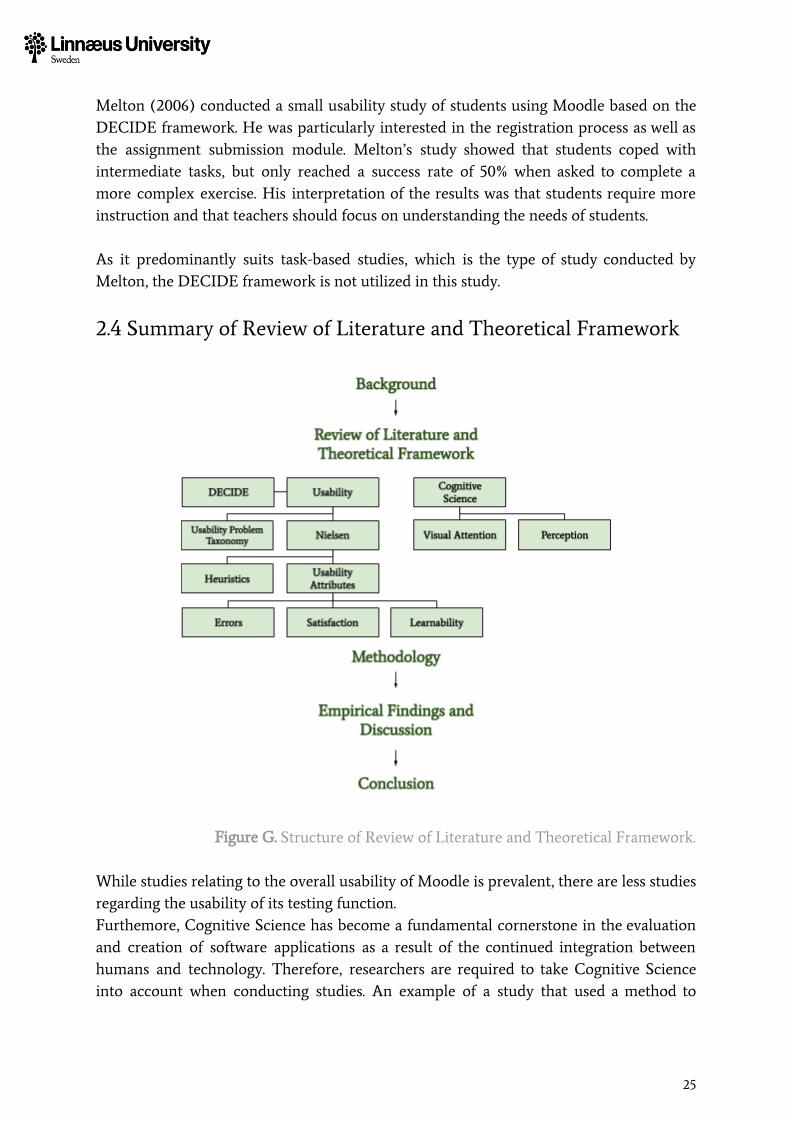
2.4 Summary of Review of Literature and Theoretical Framework
Figure G. Structure of Review of Literature and Theoretical Framework.
While studies relating to the overall usability of Moodle is prevalent, there are less studies regarding the usability of its testing function. Furthemore, Cognitive Science has become a fundamental cornerstone in the evaluation and creation of software applications as a result of the continued integration between humans and technology. Therefore, researchers are required to take Cognitive Science into account when conducting studies. An example of a study that used a method to
25

highlight the cognitive aspects of usability was that of Kushniruk and Patel (1998), who let their subjects “think aloud” when interacting with the software in question. This study investigates the usability attributes learnability, errors and satisfaction (Nielsen, 1993c). The literature on usability attributes, heuristics and Cognitive Science was used to develop an adequate vocabulary and provide a basis for in-depth interviews.
26
3 Methodology This chapter introduces the research methods utilized in this study. First, a survey of the commonly used paradigms in research is conveyed along with associated definitions and examples is presented. Thereafter, the chapter describes the collection methods for the various types of data used in the study. Additionally, validity, reliability and ethics are discussed.
3.1 Methodological Tradition Lincoln and Guba (2007) argues that the research paradigm should be interpreted as a belief system under which the study is conducted. For example, they write that the paradigm represents the worldview of the researcher and the individuals place inside that worldview. They highlight that questions concerning research methods should be asked in succession to questions of paradigm. While Lincoln and Guba (2007) suggest there are four paradigms of research (positivism, post-positivism, critical theory, and constructivism), Orlikowski and Baroudi (1991) argue that qualitative research epistemology in information systems should be based on three paradigms, thereby excluding post-positivism. Myers and Avison (2002) describes positivists as assuming reality to be objective and quantifiable by the instruments of the researcher. In IS research, Orlikowski and Baroudi (1991) suggested that the usage of quantifiable measurements, hypothesis testing or drawing knowledge about population phenomena from samples is evidence of positivism. In other words, positivists test theories in an effort to predict outcomes in the future. Both Yin (1994) and Benbasat, Goldstein and Mead (1987) conducted case studies with positivist approaches. The position of the interpretivist researcher differs from the positivist. According to Myers and Avison (2002), reality for interpretivists is based upon social constructions and lies on a foundation of hermeneutics. In informatics, researchers conduct interpretive studies as an attempt to rationalize actions by looking at the purpose and meaning given to an action. This is underlined by Walsham (1993) who considers research in informatics to be primarily focused on understanding the relationship between the system and the context it is being used in. Furthermore, Orlikowski (1991) used the interpretivist tradition in an ethnographic study of change in a large, multinational software consulting company. Walsham and Waema (1994) used the same tradition in an analysis of strategy formation in a United Kingdom
27
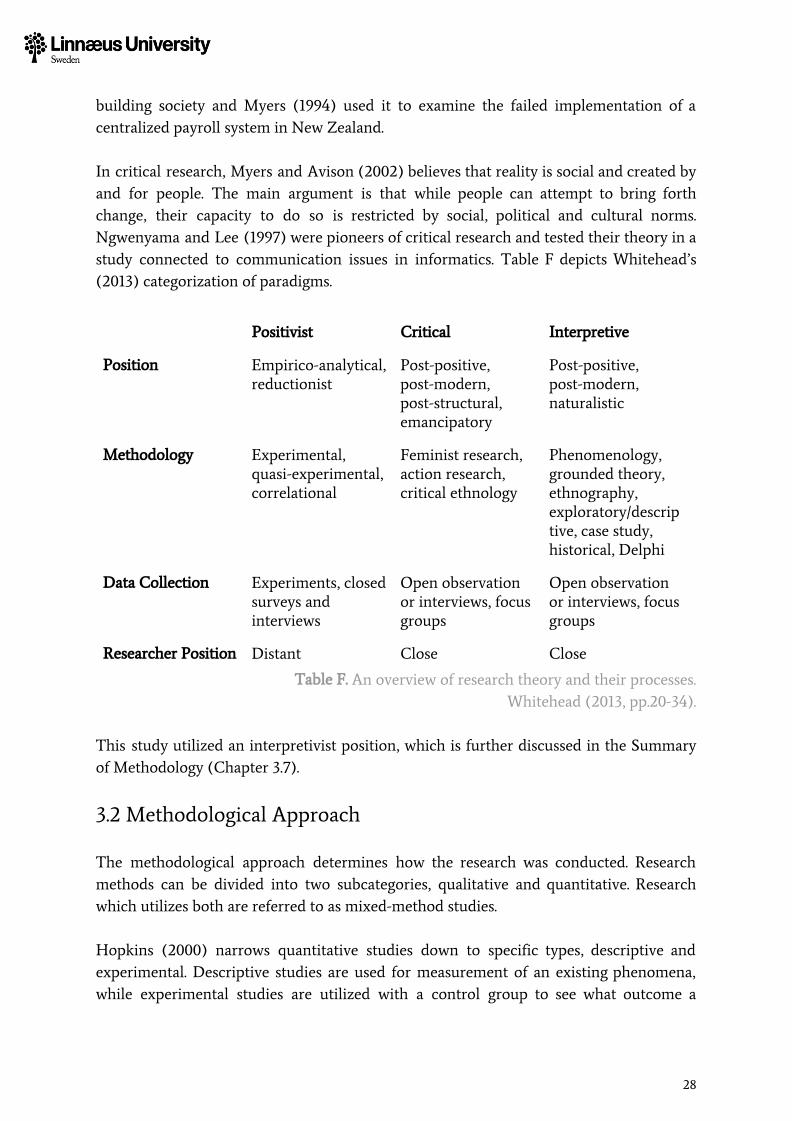
building society and Myers (1994) used it to examine the failed implementation of a centralized payroll system in New Zealand. In critical research, Myers and Avison (2002) believes that reality is social and created by and for people. The main argument is that while people can attempt to bring forth change, their capacity to do so is restricted by social, political and cultural norms. Ngwenyama and Lee (1997) were pioneers of critical research and tested their theory in a study connected to communication issues in informatics. Table F depicts Whitehead’s (2013) categorization of paradigms.
Positivist Critical Interpretive
Position Empirico-analytical, reductionist
Post-positive, post-modern, post-structural, emancipatory
Post-positive, post-modern, naturalistic
Methodology Experimental, quasi-experimental, correlational
Feminist research, action research, critical ethnology
Phenomenology, grounded theory, ethnography, exploratory/descrip
tive, case study, historical, Delphi
Data Collection Experiments, closed surveys and interviews
Open observation or interviews, focus groups
Open observation or interviews, focus groups
Researcher Position Distant Close Close Table F. An overview of research theory and their processes.
Whitehead (2013, pp.20-34). This study utilized an interpretivist position, which is further discussed in the Summary of Methodology (Chapter 3.7).
3.2 Methodological Approach The methodological approach determines how the research was conducted. Research methods can be divided into two subcategories, qualitative and quantitative. Research which utilizes both are referred to as mixed-method studies. Hopkins (2000) narrows quantitative studies down to specific types, descriptive and experimental. Descriptive studies are used for measurement of an existing phenomena, while experimental studies are utilized with a control group to see what outcome a
28
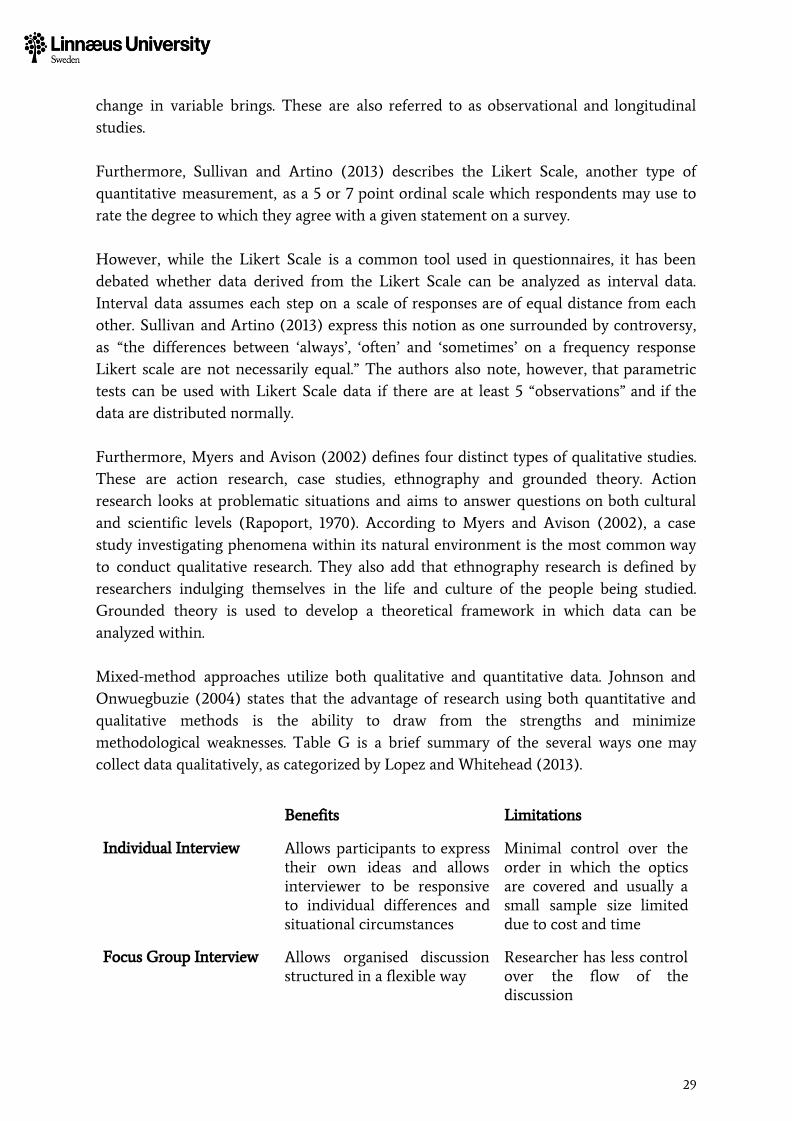
change in variable brings. These are also referred to as observational and longitudinal studies. Furthermore, Sullivan and Artino (2013) describes the Likert Scale, another type of quantitative measurement, as a 5 or 7 point ordinal scale which respondents may use to rate the degree to which they agree with a given statement on a survey. However, while the Likert Scale is a common tool used in questionnaires, it has been debated whether data derived from the Likert Scale can be analyzed as interval data. Interval data assumes each step on a scale of responses are of equal distance from each other. Sullivan and Artino (2013) express this notion as one surrounded by controversy, as “the differences between ‘always’, ‘often’ and ‘sometimes’ on a frequency response Likert scale are not necessarily equal.” The authors also note, however, that parametric tests can be used with Likert Scale data if there are at least 5 “observations” and if the data are distributed normally. Furthermore, Myers and Avison (2002) defines four distinct types of qualitative studies. These are action research, case studies, ethnography and grounded theory. Action research looks at problematic situations and aims to answer questions on both cultural and scientific levels (Rapoport, 1970). According to Myers and Avison (2002), a case study investigating phenomena within its natural environment is the most common way to conduct qualitative research. They also add that ethnography research is defined by researchers indulging themselves in the life and culture of the people being studied. Grounded theory is used to develop a theoretical framework in which data can be analyzed within. Mixed-method approaches utilize both qualitative and quantitative data. Johnson and Onwuegbuzie (2004) states that the advantage of research using both quantitative and qualitative methods is the ability to draw from the strengths and minimize methodological weaknesses. Table G is a brief summary of the several ways one may collect data qualitatively, as categorized by Lopez and Whitehead (2013).
Benefits Limitations
Individual Interview Allows participants to express their own ideas and allows interviewer to be responsive to individual differences and situational circumstances
Minimal control over the order in which the optics are covered and usually a small sample size limited due to cost and time
Focus Group Interview Allows organised discussion structured in a flexible way
Researcher has less control over the flow of the discussion
29
Involved Observation Allows researcher immersion and prolonged involvement with participants
Altered behaviours of observed groups by the presence of the researcher
Detached Observation Reveals descriptions of behaviors by stepping outside of the group
Potential research bias in the design of the study
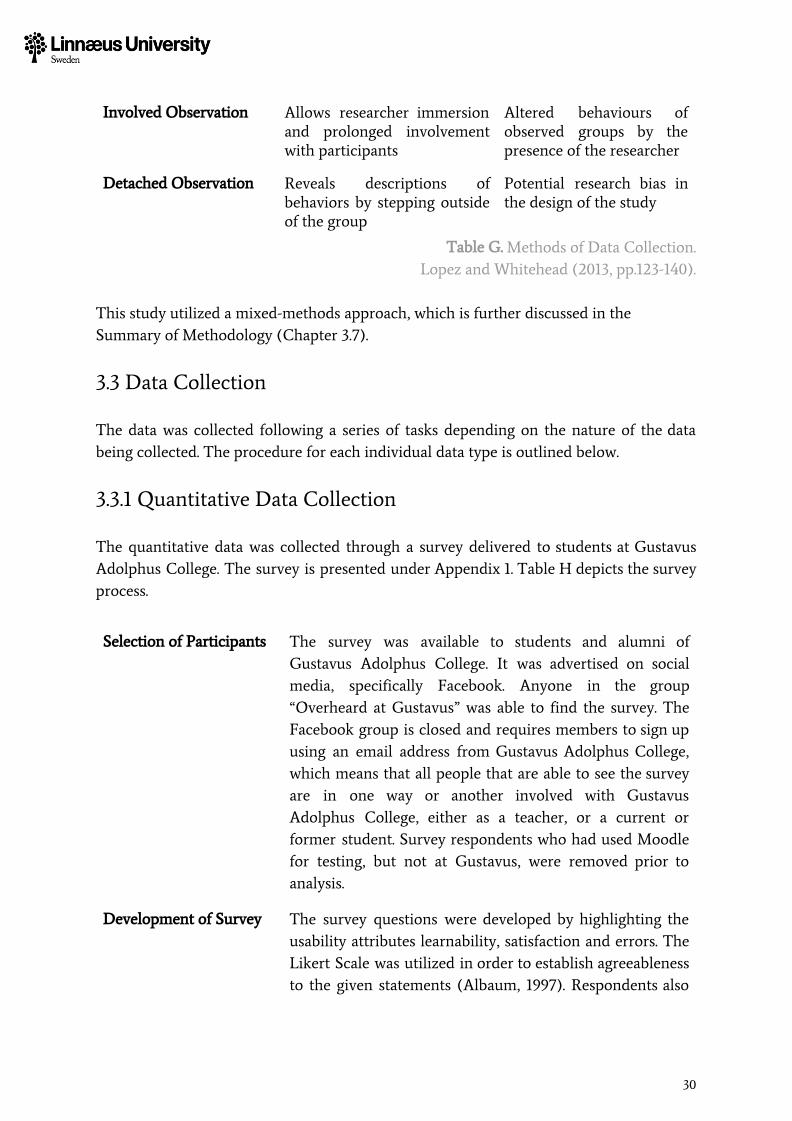
Table G. Methods of Data Collection. Lopez and Whitehead (2013, pp.123-140).
This study utilized a mixed-methods approach, which is further discussed in the Summary of Methodology (Chapter 3.7).
3.3 Data Collection The data was collected following a series of tasks depending on the nature of the data being collected. The procedure for each individual data type is outlined below.
3.3.1 Quantitative Data Collection The quantitative data was collected through a survey delivered to students at Gustavus Adolphus College. The survey is presented under Appendix 1. Table H depicts the survey process.
Selection of Participants The survey was available to students and alumni of Gustavus Adolphus College. It was advertised on social media, specifically Facebook. Anyone in the group “Overheard at Gustavus” was able to find the survey. The Facebook group is closed and requires members to sign up using an email address from Gustavus Adolphus College, which means that all people that are able to see the survey are in one way or another involved with Gustavus Adolphus College, either as a teacher, or a current or former student. Survey respondents who had used Moodle for testing, but not at Gustavus, were removed prior to analysis.
Development of Survey The survey questions were developed by highlighting the usability attributes learnability, satisfaction and errors. The Likert Scale was utilized in order to establish agreeableness to the given statements (Albaum, 1997). Respondents also
30
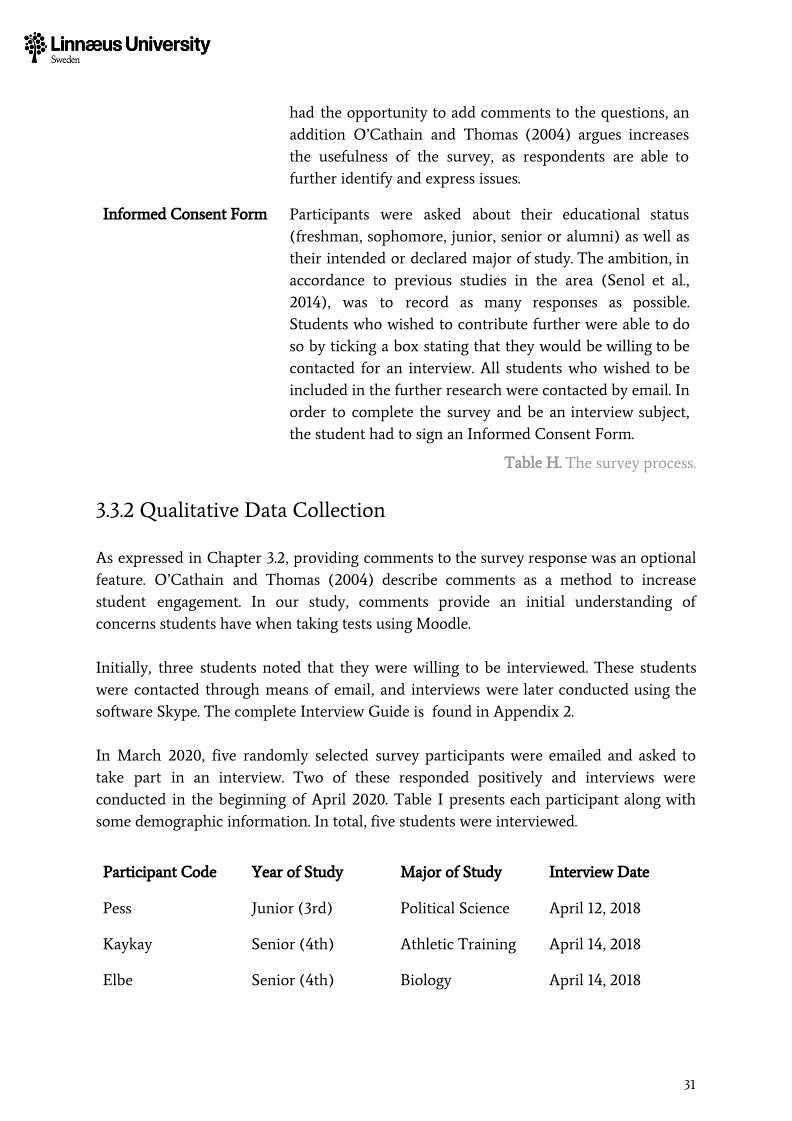
had the opportunity to add comments to the questions, an addition O’Cathain and Thomas (2004) argues increases the usefulness of the survey, as respondents are able to further identify and express issues.
Informed Consent Form Participants were asked about their educational status (freshman, sophomore, junior, senior or alumni) as well as their intended or declared major of study. The ambition, in accordance to previous studies in the area (Senol et al., 2014), was to record as many responses as possible. Students who wished to contribute further were able to do so by ticking a box stating that they would be willing to be contacted for an interview. All students who wished to be included in the further research were contacted by email. In order to complete the survey and be an interview subject, the student had to sign an Informed Consent Form.
Table H. The survey process.
3.3.2 Qualitative Data Collection As expressed in Chapter 3.2, providing comments to the survey response was an optional feature. O’Cathain and Thomas (2004) describe comments as a method to increase student engagement. In our study, comments provide an initial understanding of concerns students have when taking tests using Moodle. Initially, three students noted that they were willing to be interviewed. These students were contacted through means of email, and interviews were later conducted using the software Skype. The complete Interview Guide is found in Appendix 2. In March 2020, five randomly selected survey participants were emailed and asked to take part in an interview. Two of these responded positively and interviews were conducted in the beginning of April 2020. Table I presents each participant along with some demographic information. In total, five students were interviewed.
Participant Code Year of Study Major of Study Interview Date
Pess Junior (3rd) Political Science April 12, 2018
Kaykay Senior (4th) Athletic Training April 14, 2018
Elbe Senior (4th) Biology April 14, 2018
31
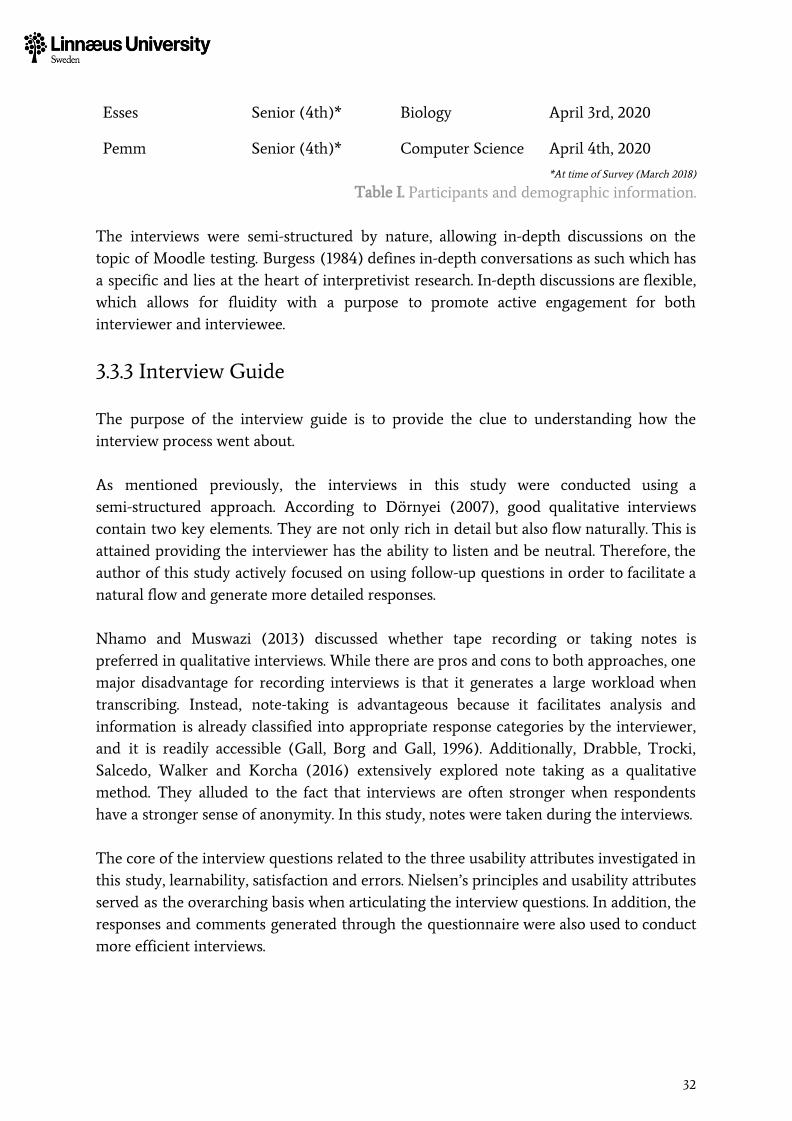
Esses Senior (4th)* Biology April 3rd, 2020
Pemm Senior (4th)* Computer Science April 4th, 2020 *At time of Survey (March 2018)
Table I. Participants and demographic information. The interviews were semi-structured by nature, allowing in-depth discussions on the topic of Moodle testing. Burgess (1984) defines in-depth conversations as such which has a specific and lies at the heart of interpretivist research. In-depth discussions are flexible, which allows for fluidity with a purpose to promote active engagement for both interviewer and interviewee.
3.3.3 Interview Guide The purpose of the interview guide is to provide the clue to understanding how the interview process went about. As mentioned previously, the interviews in this study were conducted using a semi-structured approach. According to Dörnyei (2007), good qualitative interviews contain two key elements. They are not only rich in detail but also flow naturally. This is attained providing the interviewer has the ability to listen and be neutral. Therefore, the author of this study actively focused on using follow-up questions in order to facilitate a natural flow and generate more detailed responses. Nhamo and Muswazi (2013) discussed whether tape recording or taking notes is preferred in qualitative interviews. While there are pros and cons to both approaches, one major disadvantage for recording interviews is that it generates a large workload when transcribing. Instead, note-taking is advantageous because it facilitates analysis and information is already classified into appropriate response categories by the interviewer, and it is readily accessible (Gall, Borg and Gall, 1996). Additionally, Drabble, Trocki, Salcedo, Walker and Korcha (2016) extensively explored note taking as a qualitative method. They alluded to the fact that interviews are often stronger when respondents have a stronger sense of anonymity. In this study, notes were taken during the interviews. The core of the interview questions related to the three usability attributes investigated in this study, learnability, satisfaction and errors. Nielsen’s principles and usability attributes served as the overarching basis when articulating the interview questions. In addition, the responses and comments generated through the questionnaire were also used to conduct more efficient interviews.
32
3.4 Data Analysis The data will be analyzed using different statistical tools depending on the type of data collected.
3.4.1 Quantitative Data Analysis As alluded to previously, how data from the Likert Scale should be analyzed is widely debated. Allen and Seaman (2008) argue that the initial analysis of likert scale data should not involve parametric statistics, which differs from the opinion of Sullivan and Artino (2013). However, they conclude that in order to describe the data using parametric tests, means are generally not valuable unless they follow a normal distribution. Given the continuous debate on the subject, they recommend that authors determine what descriptive statistics are used at an early stage of their study. The purpose of our questionnaire is to generate an overview of the general perception according to the usability attributes learnability, satisfaction and errors, and to collect comments from survey-takers. Boone and Boone (2012) provides a distinction between questionnaires with unique statements and questionnaires that have several questions that relate to the same area of usability. This study employed three unique statements. They are analyzed separately. To conclude, the data from this study will be primarily examined using the median and mode. However, calculations for the mean and 95% confidence interval are conducted to provide further detail. The answer choices on the Likert Scale each correlates with a numerical value (1-5). For example, the answer “Strongly Agree” is considered a five (5) and “Strongly Disagree” a one (1). The combination of over 100 survey responses and bell-shaped distributions aligns with Sullivan and Artino’s (2013) guidelines for required sample size.
3.4.2 Qualitative Data Analysis The qualitative data (survey comments and interview accounts) is analyzed using a thematic approach. According to Lichtman (2014), thematic analysis relies on the researcher categorizing the accounts and aspects he or she is told by the research subject. Furthermore, Creswell (2017) proposes a three-step guide covering all aspects of data analysis, beginning with organizing the data and ending with coding. These are described in Table J.
33
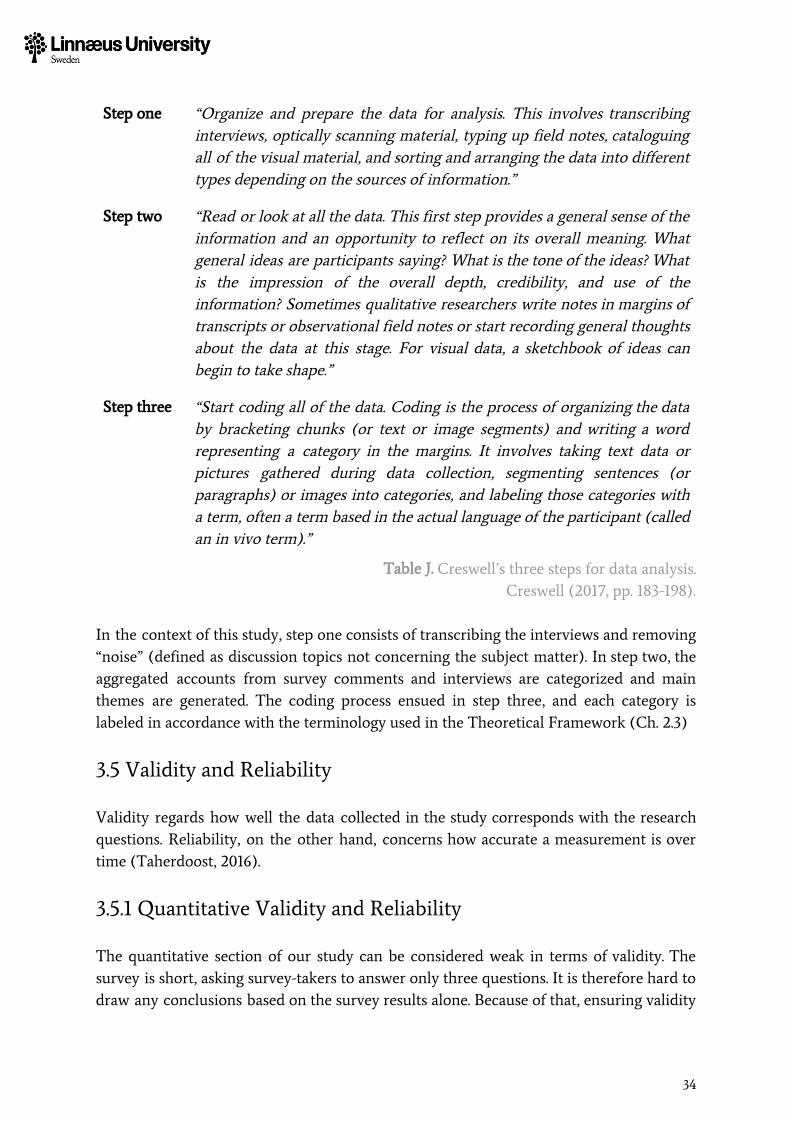
Step one “Organize and prepare the data for analysis. This involves transcribing interviews, optically scanning material, typing up field notes, cataloguing all of the visual material, and sorting and arranging the data into different types depending on the sources of information.”
Step two “Read or look at all the data. This first step provides a general sense of the information and an opportunity to reflect on its overall meaning. What general ideas are participants saying? What is the tone of the ideas? What is the impression of the overall depth, credibility, and use of the information? Sometimes qualitative researchers write notes in margins of transcripts or observational field notes or start recording general thoughts about the data at this stage. For visual data, a sketchbook of ideas can begin to take shape.”
Step three “Start coding all of the data. Coding is the process of organizing the data by bracketing chunks (or text or image segments) and writing a word representing a category in the margins. It involves taking text data or pictures gathered during data collection, segmenting sentences (or paragraphs) or images into categories, and labeling those categories with a term, often a term based in the actual language of the participant (called an in vivo term).”
Table J. Creswell’s three steps for data analysis. Creswell (2017, pp. 183-198).
In the context of this study, step one consists of transcribing the interviews and removing “noise” (defined as discussion topics not concerning the subject matter). In step two, the aggregated accounts from survey comments and interviews are categorized and main themes are generated. The coding process ensued in step three, and each category is labeled in accordance with the terminology used in the Theoretical Framework (Ch. 2.3)
3.5 Validity and Reliability Validity regards how well the data collected in the study corresponds with the research questions. Reliability, on the other hand, concerns how accurate a measurement is over time (Taherdoost, 2016).
3.5.1 Quantitative Validity and Reliability The quantitative section of our study can be considered weak in terms of validity. The survey is short, asking survey-takers to answer only three questions. It is therefore hard to draw any conclusions based on the survey results alone. Because of that, ensuring validity
34
is difficult, as the data from the survey does not provide enough base. However, the survey does provide face validity, which according to Taherdoost (2016) can be ensured if the survey looks relevant to the survey-takers and applying Cohen’s Kappa. Cohen’s Kappa is calculated by answering “Yes” or “No” to whether or not a statement in the survey is structured objectively and can be categorized. Taherdoost (2016) argues that a Kappa of 0.6 is required to ensure face validity. In our study, each statement corresponds to a usability attribute, giving it a Kappa of 1.0. Taherdoost (2016) suggests using the Cronbach Alpha to test for reliability. At least 0.7 is required for reliability. The reliability of the survey is ensured with a Cronbach Alpha of 1.0 for each statement on the survey. The high Cronbach Alpha is a result of each question relating directly to one usability attribute, which is the result of a weak survey instrument rather than strong methodology.
3.5.2 Qualitative Validity and Reliability The qualitative section of our study contains survey comments and interview testimonies. Cohen, Manion and Morison (2007) suggests validity can be ensured by minimizing bias. In our study, we have minimized bias by not stereotyping interview subjects, by not seeking confirmation of our predetermined opinions and by actively listening to interview subjects, avoiding misperceptions. Creswell (2017) finds interview reliability hard to determine. However, it is suggested the interviewer avoid asking leading questions and, if necessary, ask the interview subject to clarify. Further reliability is ensured by the interview guide in the appendix. The guide follows Kvale’s (1996) suggestions on how to construct an interview guide. The guide combines the five qualitative interviews, discusses how they went about and provides some participant data.
3.6 Ethical Considerations Creswell (2017) realizes there are certain ethical considerations researchers have to anticipate before conducting a study. In this study, the primary site is Gustavus Adolphus College, the author’s undergraduate institution. However, the choice of institution was based on convenience rather than interest in a specific outcome. The author does not aim to shed any predetermined positive or negative light on the usage of Moodle at Gustavus Adolphus College.
35
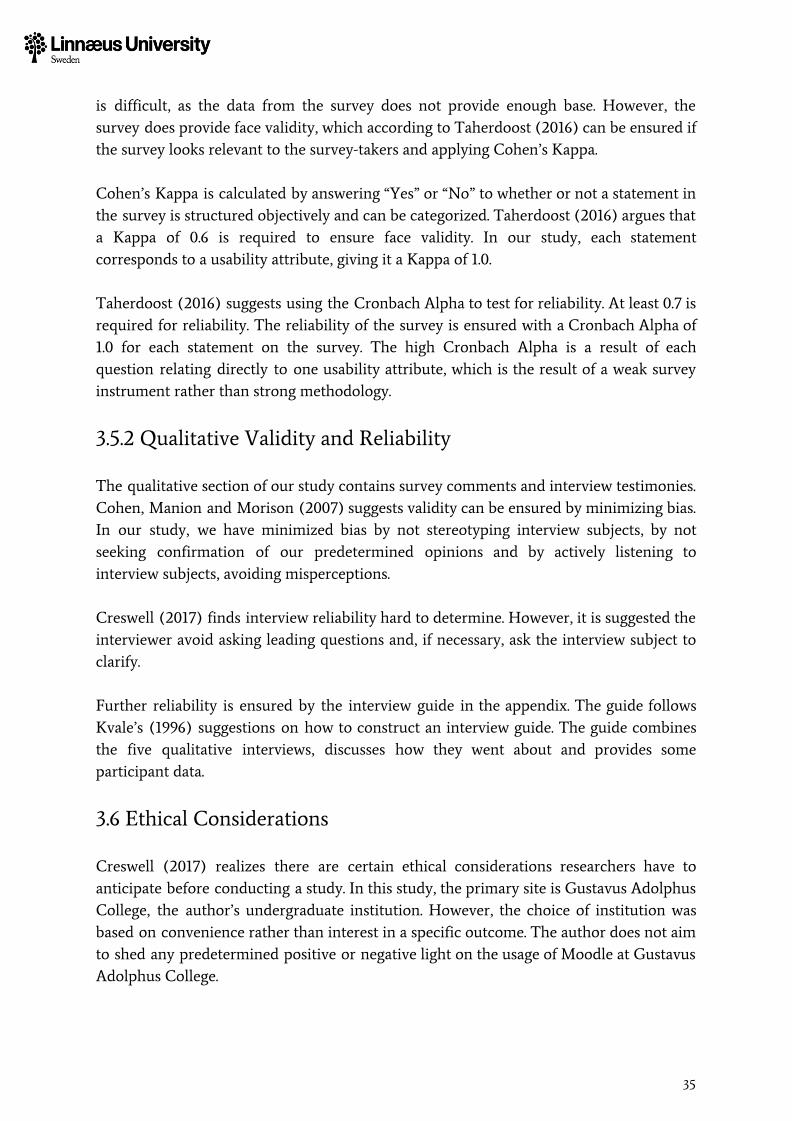
In this study, an informed consent form was used. The form was presented together with the survey and students were asked to read it before submitting their answers. If subjects wish to consent, they were asked to do so by providing an email address. As interview subjects were gathered from the pool of survey-takers, the survey and interviews were consented for simultaneously. This ensured both the survey and interviews were consented to prior to analysis of data. The informed consent form is found in Appendix 3. Furthermore, Creswell (2013) proposes five ethical standards to consider during the beginning stages of a study. The standards are described in Figure H.
Figure H. Creswell’s Five Ethical Standards. Creswell (2017).
The purpose of the study was thoroughly disclosed to all research subjects, both in the Informed Consent Form and at the beginning of each interview. The interview subjects were given an additional opportunity to review the ICF before the interview. Additionally, Creswell (2017) discusses the treatment of the data collection process and makes a note that all participants should be treated equally. In the context of this study, all students took the same survey and the author strived to conduct each interview without bias and prejudice towards the subjects.
3.7 Summary of Methodology This study utilizes an interpretive research tradition. Klein and Myers (1999) argues that interpretive research is suitable as it allows for, in this regard, a study that aims to investigate the level of meaning students attach to their experience with Moodle. As the findings in this study are based on human subjectivity, which the interpretivist paradigm allows for, the results may differ from other research in the same field (De Villiers, 2005).
36
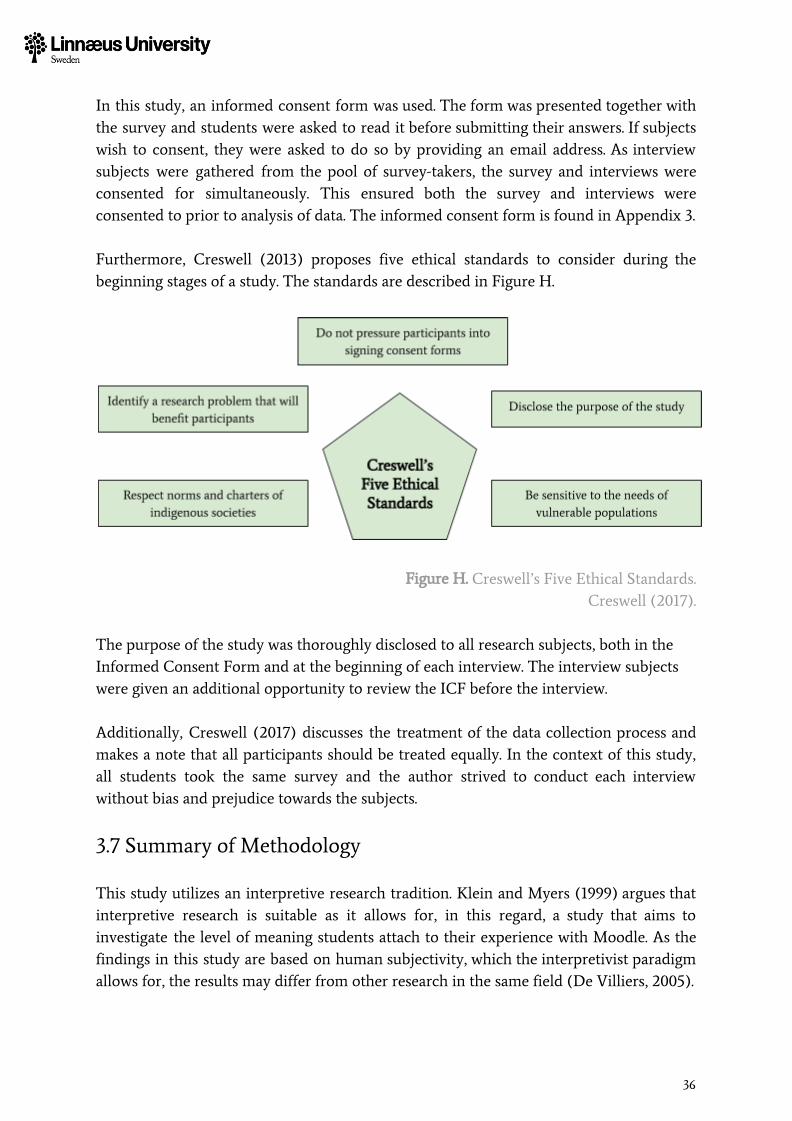
Furthermore, this study utilizes both quantitative and qualitative measurements. Creswell and Zhang (2013) acknowledges that studies who utilize both methods are difficult to define and notes that methods are often not polar opposites. The use of a survey format and Likert Scale questionnaire combined with qualitative interviews suggest mixed-methods study. However, as the primary focus is the perception, thoughts and concerns of the people being studied, the main analysis originates from the data collected through qualitative methods. The study is embedded in nature, as the quantitative results provided useful information on which the qualitative interviews could be based. In terms of data collection and analysis, data was gathered using a mix of quantitative and qualitative methods. The qualitative, Likert Scale data from the survey is analyzed using primarily non-parametric tests. The qualitative data is collected through survey comments and interviews and analyzed thematically. The methodological structure is presented in Figure I
. Figure I. Structure of Methodology.
37

4 Empirical Findings and Discussion This chapter includes the empirical findings from the study conducted in this thesis. The section is divided into two parts, one for the quantitative, Likert Scale data generated through the survey, and one for the qualitative data. This chapter also provides a discussion of the studies presented in the Review of Literature (Ch. 2). In order to recollect the theoretical framework presented, appropriate Nielsen’s (1993c) usability attributes are presented in Table K. Learnability Learnability asks the question of how users adapt and understand a
task or a system the first time they encounter it. Errors Errors deal with how many errors users make, as well as how severe
they are.
Satisfaction Satisfaction is focused on how pleasant the design is to use.
Table K. Recollection of appropriate usability attributes. Nielsen (1993c).
4.1 Quantitative Survey Results
The questionnaire returned 116 responses, however, 4 people revealed they had taken tests on Moodle, but not at Gustavus. 1 respondent had not taken a Moodle test at Gustavus or any other place. These were eliminated prior to analysis, leaving a total of 111 responses. Out of the 111 responses, 93 were current students and 18 were alumni. Out of the 93 current students, seven were in their freshman year, 26 in their sophomore year, 25 in their junior year and 36 in their senior year, indicating a slight bias towards older students. Each question on the questionnaire corresponded to one of the attributes studied. The findings for each attribute included in the study are outlined in Table L.
38
Statement Strongly Agree
(5)
Agree (4)
Neutral (3)
Disagree (2)
Strongly Disagree
(1)
Learnability “I find Moodle’s test function easy to understand”
33 (29.7%)
67 (60.4%)
5 (4.5%)
5 (4.5%)
1 (0.9%)
Satisfaction “The design of Moodle’s test function to be satisfactory”
13 (11.7%)
69 (62.2%)
15 (13.5%)
12 (10.8%)
2 (1.8%)
Errors “I am confident Moodle will help me recover if an error occurs”
3 (2.7%)
16 (14.4%)
32 (28.8%)
48 (43.2%)
12 (10.8%)
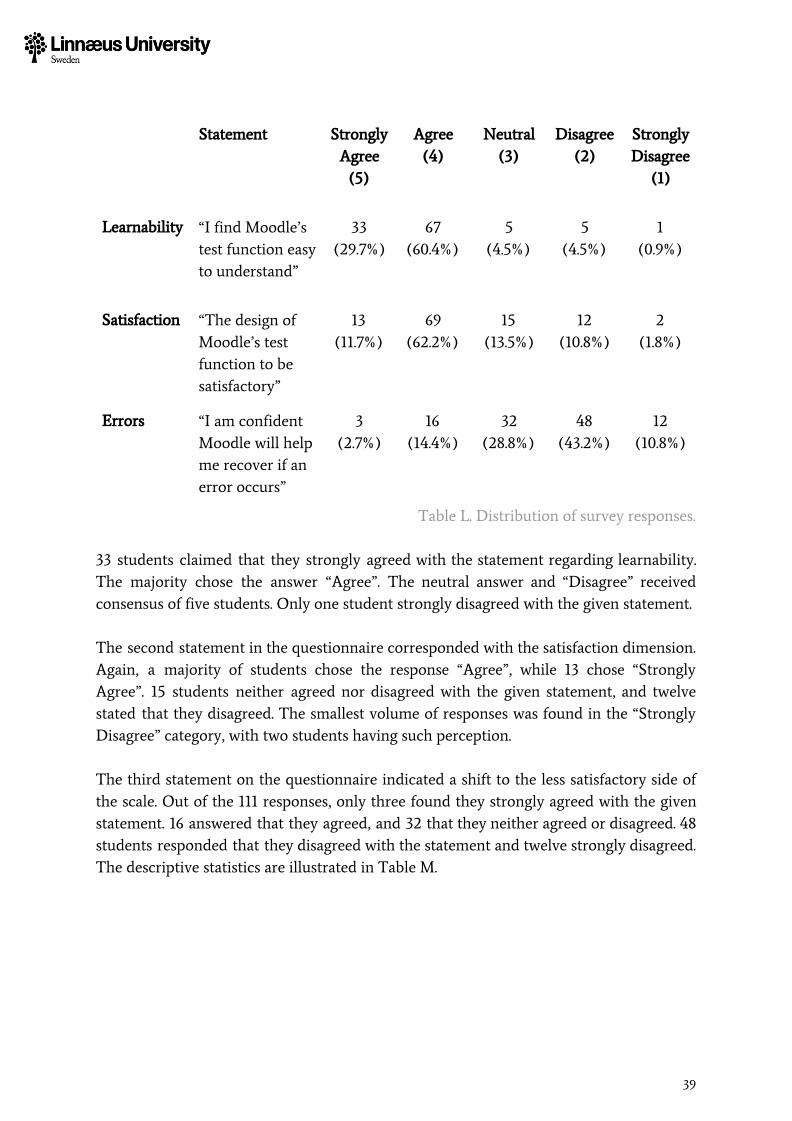
Table L. Distribution of survey responses. 33 students claimed that they strongly agreed with the statement regarding learnability. The majority chose the answer “Agree”. The neutral answer and “Disagree” received consensus of five students. Only one student strongly disagreed with the given statement. The second statement in the questionnaire corresponded with the satisfaction dimension. Again, a majority of students chose the response “Agree”, while 13 chose “Strongly Agree”. 15 students neither agreed nor disagreed with the given statement, and twelve stated that they disagreed. The smallest volume of responses was found in the “Strongly Disagree” category, with two students having such perception. The third statement on the questionnaire indicated a shift to the less satisfactory side of the scale. Out of the 111 responses, only three found they strongly agreed with the given statement. 16 answered that they agreed, and 32 that they neither agreed or disagreed. 48 students responded that they disagreed with the statement and twelve strongly disagreed. The descriptive statistics are illustrated in Table M.
39
Statement Mean Median Mode 95% CI
Learnability “I find Moodle’s test function easy to understand”
4.14 “Agree” “Agree” [4.00, 4.28]
Satisfaction “The design of Moodle’s test function is satisfactory”
3.71 “Agree” “Agree” [3.55, 3.87]
Errors “I am confident Moodle will help me recover if an error occurs”
2.55 “Disagree” “Disagree” [2.37, 2.73]
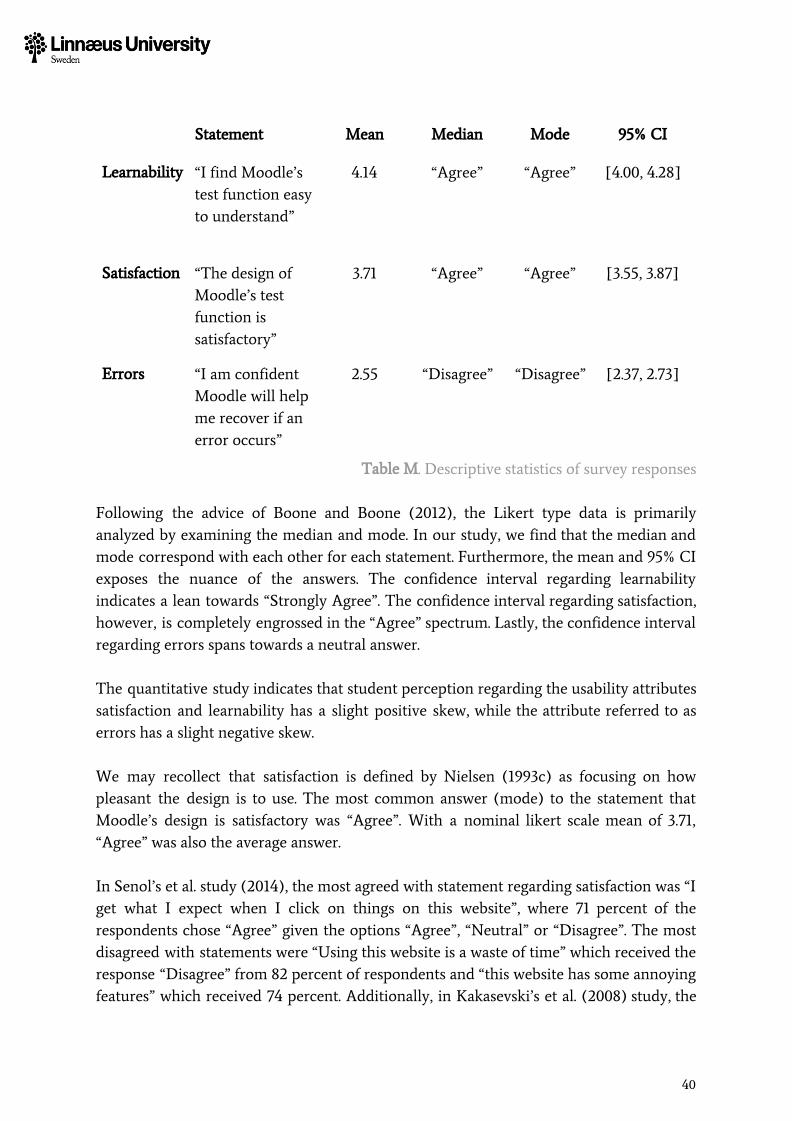
Table M. Descriptive statistics of survey responses Following the advice of Boone and Boone (2012), the Likert type data is primarily analyzed by examining the median and mode. In our study, we find that the median and mode correspond with each other for each statement. Furthermore, the mean and 95% CI exposes the nuance of the answers. The confidence interval regarding learnability indicates a lean towards “Strongly Agree”. The confidence interval regarding satisfaction, however, is completely engrossed in the “Agree” spectrum. Lastly, the confidence interval regarding errors spans towards a neutral answer. The quantitative study indicates that student perception regarding the usability attributes satisfaction and learnability has a slight positive skew, while the attribute referred to as errors has a slight negative skew. We may recollect that satisfaction is defined by Nielsen (1993c) as focusing on how pleasant the design is to use. The most common answer (mode) to the statement that Moodle’s design is satisfactory was “Agree”. With a nominal likert scale mean of 3.71, “Agree” was also the average answer. In Senol’s et al. study (2014), the most agreed with statement regarding satisfaction was “I get what I expect when I click on things on this website”, where 71 percent of the respondents chose “Agree” given the options “Agree”, “Neutral” or “Disagree”. The most disagreed with statements were “Using this website is a waste of time” which received the response “Disagree” from 82 percent of respondents and “this website has some annoying features” which received 74 percent. Additionally, in Kakasevski’s et al. (2008) study, the
40
most common (mode) answer to the statements regarding the usability attribute satisfaction was “Strongly agree”, indicating a coherence between previous studies and our in terms of satisfaction. Moving on to learnability, it is described by Nielsen (1993c) as examining user adaptability, and their ability to understand a system the first time they use it. In our study, the most common response to the question regarding Moodle being easy Moodle is to understand was “Agree”. It was also the median answer, with 67 people choosing to “Agree” with the statement. However, the mean of all answers was 4.51 which tells us that nominally, “Strongly Agree” was the average answer. Careful examination of the results in Senol et al.’s (2014) study tells us that no statement regarding learnability received a significant positive majority. However, the statement “It is difficult to move around this website” received the response “Disagree” from 66 percent of the respondents. Lastly, the most common answer to the statement regarding Moodle’s ability to prevent errors was “Disagree”, with 48 students choosing that option. “Disagree” was also the median. The average response was 2.58. In Senol’s et al. (2014) section on Error Prevention, 68 percent of respondents agreed with the statement “this website seems logical to me”. To summarize, our quantitative results suggest a positively skewed perception towards learnability and satisfaction. The result is echoed by Senol et al. (2014) who indicates only a few students find learning how to use Moodle difficult. On the contrary, further examination of the results show issues regarding the satisfaction attribute, where “improper color use and unattractive pages” is highlighted.
4.2 Qualitative Themes This section attempts to answer the first research question by presenting the findings gathered from the survey comments and interview testimonies. Furthermore, the findings are discussed and compared to related studies. Themes were analyzed according to Creswell’s (2014) three-step guide presented in the chapter on Data Analysis (Ch. 3.4.1).
4.2.1 Simple to Use An overwhelming majority of the evidence gathered from the interviews support the notion that Moodle is a software that is simple to use. Multiple choice quizzes were highlighted specifically, with four students mentioning that such methods of examination suit Moodle’s simplicity the best. For instance, one student commented that most aspects
41
of the tests they had taken were self-explanatory and easy to follow. This experience was shared by another student who commented that, although they had only taken a multiple-choice test, it was “extremely straight forward”. Overall, the comments showed no criticism towards Moodle in terms of being confusing or challenging to use. However, one student added the notion that the difficulty may be partly determined by how skilled the professor is at using Moodle, as they impact how examinations are set up. Furthermore, all interview subjects regarded Moodle’s testing function as a part of the software that, in general, is simple to use. In fact, Elbe and Kaykay were unable to differentiate the testing function from the rest of Moodle, the former explicitly stating that “the test function is not different from the rest of the program.” The consensus among interview subjects is corroborated by related studies. Kakasevski et al. (2008) found the most common answer (mode) to his statements regarding Moodle’s overall ease of use to be of a positive nature. Lastly, the perception is further supported in Senol’s et al. (2014) study, where statements such as “I can upload homework easily” and “I can access online exams easily” received an overwhelmingly positive response. Also, as mentioned previously, Senol’s et al. (2014) study indicated only a small amount of students find learning how to use Moodle difficult. The theme suggests student perception of usability positively corresponds with two of Nielsen’s (1993b) principles: Consistency and Standards, and Aesthetic and Minimalistic Design.
4.2.2 Inflexibility Four out of five interview subjects mentioned lack of flexibility as an issue. Kaykay said it was tough imagining anything other than quizzes being credibly tested on Moodle and gave several examples of tests that she felt could not be taken on Moodle’s current platform. One such example tests in mathematics, where one may be asked to show work. The opinion was shared by Elbe who, spinning off the discussion about its ease of use, noted that Moodle’s simplicity may be a limitation, stating that anything so generic may actually be a limitation. His belief is that if the institution aspires to have, as an example, a chemistry test where you are required to draw atomic models, a more flexible and complex software is necessary. He notes, however, that “if it’s multiple-choice type quizzes the school is going for, simplicity is obviously desired,” making the point that it is up to the academic institution to determine what level of sophistication they want on their Moodle tests.
42
Several students wrote comments that linked the notion raised in the first theme (that a professors’ ability to use Moodle may have an effect on its perceived level of difficulty) to inflexibility and functionality. One student stated they worry about the act of typing their answers. They argue as Moodle is “just a computer”, so not typing the exact answer that Moodle considers correct, you may get an answer that is incorrect although it could be right technically. Another student commented, on a similar notion, that they lack clarification from teachers on some questions, which is something they could have received in a traditional test setting. It is important to note that there is a differentiation between inflexibility regarding Moodle’s functionality and inflexibility depending on a professor’s inability to correctly use Moodle. This theme specifically regards functionality. There is conclusive evidence that both types are apparent, however, in order to further distinguish the two, a separate theme discussing teacher expertise has been created. Moodle’s testing function was seen as outdated and inflexible by students in our study. Furthermore, many students failed to see how Moodle could provide credible exams in other ways than multiple-choice quizzes. This is echoed by Kakasevski et al. (2008) who, regarding the testing function specifically recommended Moodle administrators, because of the difference in opinion to use only multiple choice questions and essays. The results revealed that 70% of the surveyed students approved of multiple-choice quizzes and essays, hinting that the results for other types of assignments received lower scores. Therefore, it can be assumed that Kakasevski et al.’s (2008) study corroborates the findings in our study.
4.2.3 Teacher Inexpertise As discussed previously, there is some overlap between inflexibility and perceived teacher inexpertise. What for the student may seem like software inflexibility may instead be teachers lacking ability to utilize Moodle’s full capacity. Because of that, a distinctive theme providing the findings concerning how students perceive the teacher-Moodle interaction is suitable. In our interview, Sess was not sure if Moodle allowed setting up multiple correct answers in case of obvious misspellings. However, when asked follow-up questions about her perception of the teacher's ability to interact with Moodle, she raised concerns about whether they had the technical expertise necessary to give tests online, claiming that “it is quite clear many professors have sub-par technological expertise.” She added, however, that the lack of ability most likely covered all use of technology, and not only Moodle. She added nuance to her concerns by revealing that her experience may
43

not be a perfect example, as many of her professors “have been quite old”. Lastly, she admitted that while things do go wrong, it is often resolved without much trouble. The concern is echoed by several commenters, one stating that the inability of teachers to correctly format tests is a frequent concern of theirs. Additionally, one student commented that they had been a teaching assistant where part of their duties was to create quizzes on Moodle, which they found easy. This indicates technological ability is important. As the theme teacher inexpertise inherently refers to the cognitive ability of a third party, this section does not include a discussion regarding the student perception of it. However, the Conclusion (Ch. 5) addresses the topic as prospective research.
4.2.4 Lack of Visual Hierarchy Problems relating to the theory of visual hierarchy were mentioned several times in the interviews. In our interview, Pess expressed she felt the design does not provide emphasis on anything particular. She also said that it is “old” and “outdated”. Another problem, she argues, is that there is no real distinction between the regular Moodle user interface and the test pages. Kaykay discussed a similar type of concern, stating it is easy to be distracted when taking a test in browser-mode. The notion is further expressed in comments to the survey. As an example, one student wrote that the test taking part of Moodle is uninviting and boring. Our findings reveal a common concern with Moodle’s testing function is the lack of visual hierarchy. In essence, visual hierarchy means that designers have taken users’ cognitive aspects into consideration when creating the interface. Visual hierarchy is a core ingredient when creating a user interface and Nielsen’s (1993b) stresses its importance in three of his principles: Flexibility and Efficiency of Use, Match Between System and the Real World, and Recognition Rather than Recall. In addition, Djamasbi, Siegel and Tullis (2011) describes visual hierarchy as the use of size, colors and images to guide and direct the attention of users. Previously, we discussed Senol’s et al. (2014) study which concluded that users tend to believe Moodle is a simple, uncomplex program that is easy to use. However, the study also notes that there are problems with its aesthetics. Further examination of Senol’s et al. (2014) results reveal that the primary issue specifically concerns improper color use and unattractive pages, which can be argued to fall into the category of visual hierarchy. Similarly, out of the 17 usability problems found by Hasan (2018), five related to the design. The problems included “Inappropriate choice of colours” and “Unaesthetic design of the pages”.
44

4.2.5 Timing Out Many students expressed fear of being timed out” Being timed out means you have been automatically logged out of a system, and is usually the result of being idle for a certain period of time. In many cases, losing connection to the internet also means being timed out. In the comments to the survey, one person stated that Moodle does not let the user know if you have been logged out, but that it allows you to continue taking the test. This results in a situation where a person who is finishing a test is automatically logged out once they click submit, which may delete their work. Another survey comment admitted they had lost their test answers several times unexpectedly. A fear of timing out was a concern for all five interview subjects. Kaykay believes that it adds stress to test taking. Elbe, who considers himself “tech savvy”, mentioned that he usually prepares for the internet being cut off. This was corroborated by a survey commenter, who stated that a trick to prevent being timed out is to save answers and essays into a word document before submitting the test. In our study, students expressed a lack of trust in Moodle’s ability to communicate a loss of internet connection. However, that perception is not shared in Kakasevski et al.’s (2008) study. There, 48% of students agreed with the statement “I feel in control when I'm using this website”. 18% disagreed with the statement and the remaining 34% claimed to hold a neutral position.
4.2.6 Increased Stress Students mentioned an array of stress factors arising from the computerized assessment style. During the interviews, students expressed a belief that online quizzes and assignments are taken less seriously than pen and paper tests. Elbe said that it is harder to get into a serious “test mindset” when you can take it from your dorm room. He added that it may be hard to find the space necessary to take the test peacefully. Pess found distractions to be a problem as well, adding that for people with learning and attention disabilities, such as Attention Deficit Disorder (ADD), it may already be hard to concentrate. Additionally, evidence of a general pen and paper preference was found in several survey comments. One student declared they find the online format stressful and that they sometimes struggle to read questions on the computer screen. Another student found the presence of a timer to be a stressor.
45
Furthermore, the students expressed that the issues discussed in themes Timing Out (Ch. 4.2.5), Inflexibility (Ch. 4.2.2) and Teacher Inexpertise (Ch. 4.2.3) were all potential stress factors. Sess said that having to get in touch with the professor if there is an error can be stressful. One student commented that they were paranoid about losing work. As the main sources of stress are discussed in previous themes there is no separate discussion for this increased stress.
4.3 Suggestions The second research question asks what undergraduate students suggest be changed to the user interface of Moodle to improve usability. The suggestions were analyzed and compiled according to the three-step guide presented by Creswell (2017).
4.3.1 Scratch Paper A desire for greater flexibility was described by four interview subjects and in several survey comments. One student commented that Moodle does not let your work be shown, which is in line with what Kaykay lifted as a limitation in the theme inflexibility. In our interview, Elbe also raised this concern and suggested Moodle could have a scratch-writing function in which a person could either type using the keyboard of the computer, or draw using the mouse or touchpad. The lack of scratch paper is discussed by Al-Qdah and Ababneh (2017) who sought to find what types of exams are suitable to be given in an online format. They found multiple-choice quizzes, true or false questions, and matching-type questions to be nearly identical when given online. However, they state that calculation-type questions require special care and consideration, as they often require scratch paper.
4.3.2 Distinguished Testing Interface A common discussion topic during the interviews regarded the interface design of Moodle’s testing function. Pess made several suggestions aimed at improving the interface. These included a more interactive design with “bigger buttons”, clearer instructions, and a more distinctive testing environment. The suggestions were corroborated by Kaykay, who believed the test function could be more distinguishable from the rest of Moodle. The appreciation for a more complex and interactive interface was corroborated in Putnik, Ivanovic, Komlenov Mudrinski, Welzer, Hölbl and Beranic’s (2013) study, where
46
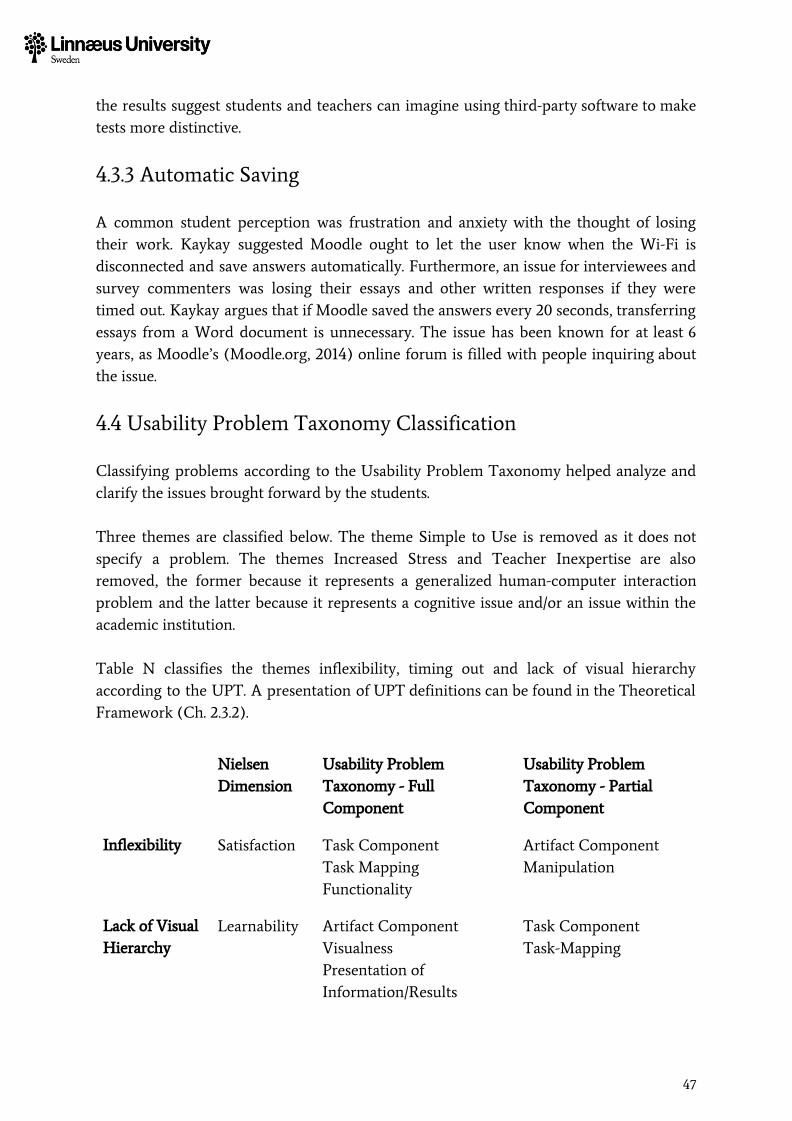
the results suggest students and teachers can imagine using third-party software to make tests more distinctive. 4.3.3 Automatic Saving A common student perception was frustration and anxiety with the thought of losing their work. Kaykay suggested Moodle ought to let the user know when the Wi-Fi is disconnected and save answers automatically. Furthermore, an issue for interviewees and survey commenters was losing their essays and other written responses if they were timed out. Kaykay argues that if Moodle saved the answers every 20 seconds, transferring essays from a Word document is unnecessary. The issue has been known for at least 6 years, as Moodle’s (Moodle.org, 2014) online forum is filled with people inquiring about the issue.
4.4 Usability Problem Taxonomy Classification Classifying problems according to the Usability Problem Taxonomy helped analyze and clarify the issues brought forward by the students. Three themes are classified below. The theme Simple to Use is removed as it does not specify a problem. The themes Increased Stress and Teacher Inexpertise are also removed, the former because it represents a generalized human-computer interaction problem and the latter because it represents a cognitive issue and/or an issue within the academic institution. Table N classifies the themes inflexibility, timing out and lack of visual hierarchy according to the UPT. A presentation of UPT definitions can be found in the Theoretical Framework (Ch. 2.3.2).
Nielsen Dimension
Usability Problem Taxonomy - Full Component
Usability Problem Taxonomy - Partial Component
Inflexibility Satisfaction Task Component Task Mapping Functionality
Artifact Component Manipulation
Lack of Visual Hierarchy
Learnability Artifact Component Visualness Presentation of Information/Results
Task Component Task-Mapping
47

Timing Out
Errors Task Component Task-Facilitation Task/Function Automation
Artifact Component Manipulation Cognitive Aspects
Table N . UPT classification. The theme “Inflexibility” falls under the “Satisfaction” attribute. In the UPT, it is primarily classified as a problem regarding functionality within the Task Component category. Its partial component is classified as a Manipulation problem. The theme “Visual hierarchy” falls under the “Learnability” dimension. It is primarily classified as a problem regarding the Presentation of Information/Results within the Artifact Component category. Its partial component is classified as a Task-Mapping problem. The theme timing out falls under the errors dimension. It is primarily classified as a problem regarding Task/Function Automation within the Task Component category. Its partial component is classified as a Cognitive Aspects problem.
4.5 Summary of Empirical Findings and Discussion This study posed two research questions. The research questions are of different nature, as the first question uses a problem-seeking rhetoric and the second question seeks to problem-solve. The first research question examines student perception of usability regarding Moodle’s testing function.
How do undergraduate students perceive the Moodle’s testing function regarding usability, particularly learnability, satisfaction and error prevention?
The second research question investigates what suggestions students have to improve usability.
What ideas do undergraduate students suggest be considered regarding the user interface of Moodle’s testing function, particularly in areas of learnability, satisfaction and error prevention?
One suggestion is to implement a function equivalent to in-class scratch paper. Students argue this could solve several inflexibility issues as, for instance, it would help facilitate complex tests where one may be obliged to show work.
48
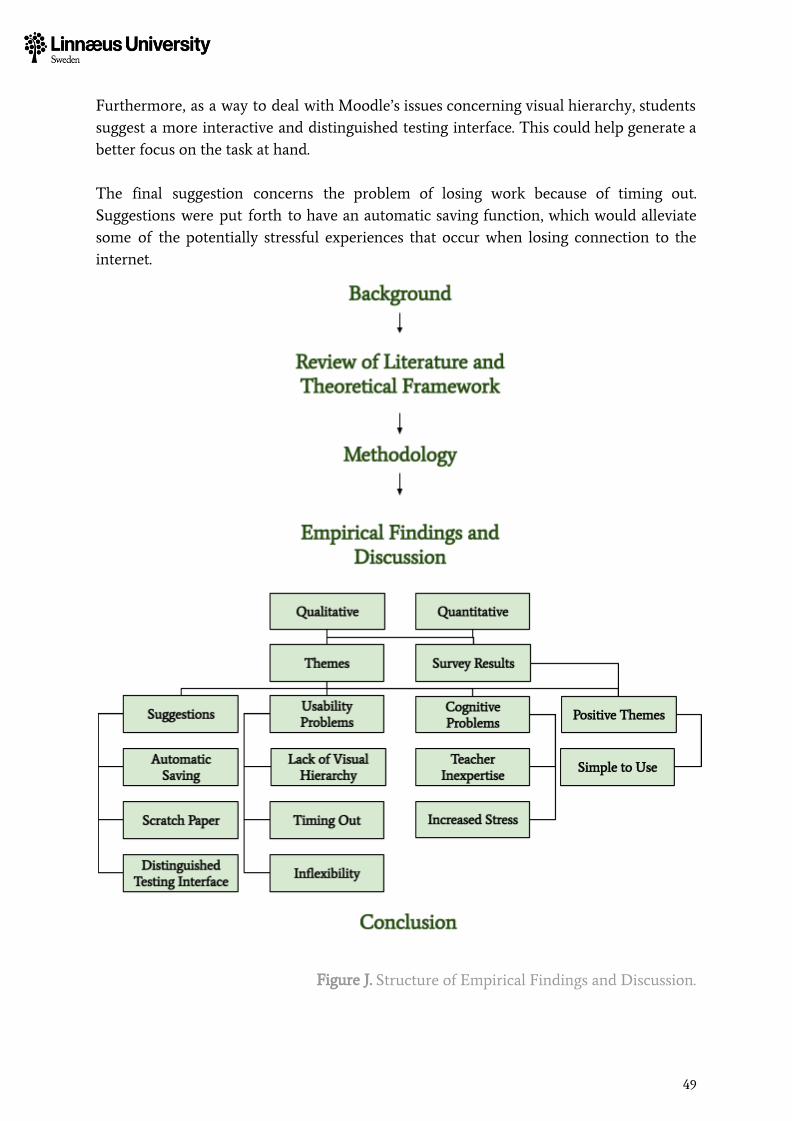
Furthermore, as a way to deal with Moodle’s issues concerning visual hierarchy, students suggest a more interactive and distinguished testing interface. This could help generate a better focus on the task at hand. The final suggestion concerns the problem of losing work because of timing out. Suggestions were put forth to have an automatic saving function, which would alleviate some of the potentially stressful experiences that occur when losing connection to the internet.
Figure J. Structure of Empirical Findings and Discussion.
49
5 Conclusion The purpose of this study was to generate further understanding about how students perceive Moodle’s test function. Through a mixed-methods approach, three usability attributes (learnability, satisfaction and errors) were examined. Additionally, the study intended to find solutions to problems raised by the students. The consensus among survey-takers and interview subjects was that Moodle, in general, is an easy software to use. Comparable findings were made in many previous studies (Hasan, 2018; Kakasevski et al., 2008; Senol et al., 2014). Additionally, we found a similar perception to be true of the testing function. However, students raised concerns that the simplicity of the software may be a limitation. The overarching accord throughout the interviews alluded to Moodle, in its current shape, only being sufficient for certain types of assignments, such as multiple-choice quizzes. Students gave several ideas which could improve Moodle’s functionality. A common suggestion was to implement the equivalent of scratch paper, which would give the student an opportunity to complete more complex assignments. An example of a more complex assignment may include the task of drawing an atomic model, which currently requires a third-party software. A scratch paper function would allow the student to, using the mouse or touchpad of their computer, draw on a blank answer sheet. Furthermore, our study found that students perceive Moodle as lacking visual hierarchy. While students agreed Moodle is self-explanatory in general, the lack of visual hierarchy may prolong the time necessary for students to process information presented in the software. This may negatively impact student results during an exam where time is scarce. Many students inferred that the current design of the testing function is causing undue stress and anxiety. However, it should be noted that the stress and anxiety may be a result of the exam being given in an online format, confounding the correlation between the testing function and stress. Overall, as corroborated by Al-Qdah and Ababneh (2017) and Putnik et al. (2013), students prefer traditional “pen-and-paper” tests. In our study, students suggested a more distinguished testing function. In order to improve the current design, more focus ought to be put on visual hierarchy, applying the environmental context of the test-taker when making decisions about design. Previous studies show a common error related to the difficulty of uploading assignments (Melton, 2006; Hasan, 2018). While our study did not find such a task to be problematic, our results nonetheless show that students perceive Moodle to be unreliable. Should an error occur, students stated they were not confident in Moodle’s ability to resolve the
50
problem. Students expressed that timing out is a common and frustrating issue during test-taking, which may lead to essays and other answers being lost. Students suggest an automatic save function to mitigate such errors. Lastly, albeit not a usability issue, students express there appears to be a lack of expertise from the course administrator(s). In this case, the administrator(s) are often teachers. Our findings show that student perception of usability may be impacted by the level of expertise held by the administrator. The importance of teacher support is emphasized in previous studies (Kakasevski et al., 2008) and other studies have found low levels teacher support to be related to higher dropout rates (Gaudioso, Montero, Talavera, Hernandez del Olmo, 2009) and high levels to be related to enhanced user satisfaction (Diep, Cocquyt, Zhu and Vanwing, 2016).
5.1 Contribution This study examined how undergraduate students at Gustavus Adolphus College perceive the test-taking function on Moodle in regards to the usability attributes learnability, satisfaction and errors, as well as their suggestions on how to improve their perceived usability. Our study suggests Moodle test function is somewhat limited and only reliable for multiple-choice quizzes. Other types of exams, such as long and short answer questions, mathematical and/or scientific questions which require the student to show their work and longer essay type questions all accompany usability problems. To conclude, this study provides empirical evidence of both problems and solutions. Moodle is easy to use, but lacks the functionality necessary to facilitate exams often given in higher education. Because of the problems articulated through the analysis of our results, combined with the suggestions to improve user interface in order to better fit test-taker needs, the purpose of bridging the gap between traditional and online exams is accomplished.
5.2 Reflections I found conducting this study both interesting and useful. The topic combines education, a field I care strongly about, and technology, a field most people accept as part of their lives no matter how strongly they care for it. The entire research process has been useful on a personal level, as its conclusion marks the completion of my first full-scale academic paper.
51
In terms of study outcomes, my personal bias would have suggested that students do feel anxious about taking tests online. Anxiety about tests is nothing new as they are naturally filled with emotions of expectation and nervosity. However, specifying the aspects that generate anxiety leads to better understanding on what solution is suitable. Lastly, reflecting on my personal learning, I found interviewing to be the most fulfilling part of the study. I enjoyed the semi-structured interviews, which allowed interviews to proceed with a flow that invited follow-up questions and deeper investigation. I hope to conduct many more interviews throughout my academic career, perfecting my techniques along the way.
5.3 Further Research The test-taking functions of Moodle and other Learning Management Systems is an aspect that is not thoroughly studied. This study aims to address that gap of knowledge, however, the quantitative section of this study is limited which means that in the future, studies that use larger samples, different software and other approaches are important in order to learn more about how students perceive taking tests online. Another limitation of this study is that it only includes college-age students. Studies concerning non-students may be important in the future, as online and computer testing is not exclusive to academia. For instance, the theoretical part of a driving exam is often taken on a computer. Lastly, this study provides evidence showing that it is vital for continued research that examines cognitive aspects of the teacher-student relationship. As the perception of Moodle seems to be severely impacted by the technological expertise of the teacher, some issues of usability may potentially be solved through improving communication, rather than focusing on design.
52
Bibliography Al-Sarrayrih, H. S., Knipping, L. and Zorn, E. 2010.
Evaluation of a Moodle based learning management system applied at Berlin institute of technology based on Iso-9126. In Proceedings of ICL 2010 Conference, pp.880-887.
Al-Qdah, M. and Ababneh, I., 2017.
Comparing Online and Paper Exams: Performances and Perceptions of Saudi Students. International Journal of Information and Education Technology, 7(2), pp.106–109.
Albaum, G., 1997.
The Likert Scale Revisited. Market Research Society. 39(2), pp.1–21. Allen, I. E., and Seaman, J., 2008.
Staying the course: Online education in the United States. The Sloan Consortium. Benbasat, I., Goldstein, D.K. and Mead, M., 1987.
The Case Research Strategy in Studies of Information Systems. MIS Quarterly, 11(3), pp.369.
Bernstein, D.A., 2010.
Essentials of Psychology . Cengage Learning, pp.123–124. Bevan, N., Carter, J. and Harker, S., 2015.
ISO 9241-11 Revised: What Have We Learnt About Usability Since 1998?, pp.143-151.
Boone, H.N. and Boone, D.A., 2012. Analyzing Likert Data. The Journal of Extension, 50, pp.1-5.
Brosch, T., Pourtois, G. and Sander, D., 2010. The perception and categorisation of emotional stimuli: A review. Cognition and Emotion , 24:3, pp.377-400.
Bruner, J.S. and Postman, L., 1949. Perception, Cognition and Behavior. Journal of Personality, 18: pp.14-31.
Burgess, R.G., 1988.
53
Conversations with a Purpose; the ethnographic interview in educational research. Qualitative Methodology. Butler, T., 2016.
Towards a Hermeneutic Method for Interpretive Research in Information Systems.
Enacting Research Methods in Information Systems: Volume 2, pp.11–39. Crane, T., 2009.
Is Perception A Propositional Attitude? The Philosophical Quarterly, 59(236), pp.452–469.
Creswell, J.W., 2017.
Research Design, Qualitative, Quantitative and Mixed Method Approaches (5th ed.). Sage Publications Inc , pp. 183-198.
Cohen, L., Manion, L., and Morison, K., 2007.
Research Methods in Education (6th ed.). Routledge. Cohen, D. and Sasson, I., 2016.
Online quizzes in a virtual learning environment as a tool for formative assessment. 6. pp.188-208. 10.3926/jotse.217.
Costley, K., 2014.
The positive effects of technology on teaching and student learning. ERIC Ed , viewed May 27, 2020. <https://eric.ed.gov/?id=ED554557>.
Department for Innovation, Universities and Skills, 2008.
Higher Education at Work — High Skills: High Value. HMSO, pp.68, viewed May 27, 2020. < https://assets.publishing.service.gov.uk/government/uploads/system/uploads/attac
hment_data/file/238731/7392.pdf>. Department for Education, 2010.
Securing a Sustainable Future for Higher Education (The Browne Report): HMSO, viewed May 27, 2020. < http://www.educationengland.org.uk/documents/pdfs/2010-browne-report.pdf>.
Diep, A.N., Cocquyt, C., Zhu, C. and Vanwing, T., 2016.
Predicting adult learners' online participation: Effects of altruism, performance expectancy, and social capital. Computers & Education , vol. 101, pp. 84-101.
54
Djamasbi, S., Siegel, M. and Tullis, T., 2011.
Visual Hierarchy and Viewing Behavior: An Eye Tracking Study. pp.331-340. Drabble, L., Trocki, K. F., Salcedo, B., Walker, P. C. and Korcha, R. A., 2016.
Conducting qualitative interviews by telephone: Lessons learned from a study of alcohol use among sexual minority and heterosexual women. Qualitative social work: research and practice, pp.118–133.
Dobre, I., 2015.
Learning Management Systems for Higher Education - An Overview of Available Options for Higher Education Organizations. Procedia - Social and Behavioral Sciences , 180, pp.313–320.
Dougiamas, M. and Taylor, P., 2002.
Interpretive analysis of an internet-based course constructed using a new courseware tool called Moodle. 2nd Conference of HERDSA.
Durrani, S. and Durrani, Q.S., 2009. Applying Cognitive Psychology to User Interfaces. Proceedings of the First International Conference on Intelligent Human Computer Interaction , pp.156–168.
Dornyei, Z., 2007.
Research methods in applied linguistics. New York: Oxford University. Press. Edutechnica, 2017.
Annual LMS Update, viewed May 27, 2020. < http://edutechnica.com/2017/09/17/5th-annual-lms-data-update/>.
Eriksen, C.W. and St. James, J.D., 1986. Visual attention within and around the field of focal attention: A zoom lens model. Perception and Psychophysics 40, pp.225–240.
Eriksen, C.W. and Hoffman, J.E., 1972.
Temporal and spatial characteristics of selective encoding from visual displays. Perception and Psychophysics 12, pp.201–204.
Gall, M. D., Borg, W. R., and Gall, J. P, 1996.
Educational Research (6th ed.). Longman Publishers USA. Gaudioso, E., Montero, M., Talavera, L. and Hernández del Olmo, F., 2009.
55
Supporting teachers in collaborative student modeling: A framework and an implementation. Expert Syst. Appl.. 36. 2260-2265.
Hasan, L., 2018.
Usability Problems on Desktop and Mobile Interfaces of the Moodle Learning Management System (LMS). Proceedings of the 2018 International Conference on E-Business and Applications.
Hassard, J., McCann, L. and Morris, J.L., 2008.
Managing in the New Economy: Restructuring White-Collar Work in the USA, UK
and Japan. Cambridge University Press. Hopkins, W., 2003.
Quantitative Research Design. Sportscience, viewed May 27, 2020. <http://www.sportsci.org/jour/0001/wghdesign.html>.
Ifinedo, P., Pyke, J. and Anwar, A., 2018.
Business undergraduates’ perceived use outcomes of Moodle in a blended learning environment: The roles of usability factors and external support. Telematics and Informatics, 35(1), pp.93–102.
Jedeskog, G. and Nissen, J., 2004. ICT in the Classroom: Is Doing More Important than Knowing? Education and Information Technologies, 9(1), pp.37–45.
Johns, G. and Saks, A.M., 2019. Organizational behaviour: understanding and managing life at work. Pearson .
Johnson, M. and Lakoff, G., 2002. Why cognitive linguistics requires embodied realism. Cognitive Linguistics , 13(3).
Johnson, R.B. and Onwuegbuzie, A.J., 2004.
Mixed Methods Research: A Research Paradigm Whose Time Has Come. Educational Researcher, 33(7), pp.14–26.
Jonides, J., 1983. Further toward a model of the Mind’s eye’s movement. Bull. Psychon. Soc. 21, pp.247–250.
Kakasevski, G., Mihajlov, M., Arsenovski, S., and Chungurski, S., 2008.
56
Evaluating usability in learning management system moodle. ITI 2008 - 30th International Conference on Information Technology Interfaces.
Moodle.org, 2014.
Moodle in English: Moodle Connection Time Out Issue, viewed May 27, 2020. < https://moodle.org/mod/forum/discuss.php?d=257487 >.
Keenan, S.L., Hartson, H.R., Kafura, D.G., 1999 .
The Usability Problem Taxonomy: A Framework for Classification and Analysis. Empirical Software Engineering 4, pp.71–104.
Khadija, A., 2019.
Four Ways Technology Has Negatively Changed Education. Journal of Educational
and Social Research . 9. 10-20. 10.2478/jesr-2019-0049. Klein, H. K., & Myers, M. D., 1999.
A Set of Principles for Conducting and Evaluating Interpretive Field Studies in Information Systems. MIS Quarterly, 23(1), pp.67-93.
Kushniruk, A.W. and Patel, V.L., 1998.
Cognitive evaluation of decision making processes and assessment of information technology in medicine. International Journal of Medical Informatics, 51(2-3), pp.83–90.
Kvale, S., 1996.
Interview Views: An Introduction to Qualitative Research Interviewing. Sage Publications.
Lichtman, M., 2014.
Qualitative Research for the Social Sciences. 10.4135/9781544307756. Lincoln, Y.S. and Guba, E.G., 2007.
Paradigms. The Blackwell Encyclopedia of Sociology . Lopez, V. and Whitehead, D., 2013.
Sampling data and data collection in qualitative research. Nursing & Midwifery Research: Methods and Appraisal for Evidence-Based Practice , pp.123-140.
Luger, G. F., Johnson, P., Stern, C., Newman, J. E., and Yeo, R., 1994.
Cognitive science: The science of intelligent systems. Academic Press.
57
Miller, G ., 2003.
The cognitive revolution: a historical perspective. Trends in Cognitive Sciences, p.7. Muswazi, M. and Nhamo, E., 2013.
Note taking: a lesson for novice qualitative researchers. J. Res. Method Educ. . 2. pp.13-17.
Myers, M., 1994.
A disaster for everyone to see: An interpretive analysis of a failed is project. Accounting, Management and Information Technologies , Volume 4, Issue 4.
Myers, M. and Avison, D., 2002.
Qualitative Research in Information Systems. London, Sage. ISBN 0761966323. Necker, L.A., 1832.
Observations on some remarkable optical phænomena seen in Switzerland; and on an optical phænomenon which occurs on viewing a figure of a crystal or geometrical solid. The London, Edinburgh, and Dublin Philosophical Magazine and Journal of Science, 1:5, pp.329-337.
Nelson, R. and Staggers, N., 2008.
Implications of the American Nurses Association Scope and Standards of Practice for nursing informatics for nurse educators: A discussion. Nursing Outlook, 56(2), pp.93–94.
Ngwenyama, O. K., and Lee, A. S., 1997. Communication Richness in Electronic Mail: Critical Social Theory and the Contextuality of Meaning. MIS Quarterly, 21(2), pp. 145-167.
Nielsen, J., 1993a. Usability Assessment Methods beyond Testing. Usability Engineering ,
pp.207–226.
Nielsen, J., 1993b. Usability Heuristics. Usability Engineering , pp.115–163.
Nielsen, J., 1993c. What Is Usability? Usability Engineering , pp.23–48.
58

O'Cathain, A. and Thomas, K.J., 2004. "Any other comments?" Open questions on questionnaires – a bane or a bonus to research? BMC Medical Research Methodology , 4(1).
O'Flaherty, J. and Phillips, C., 2015. The use of flipped classrooms in higher education: A scoping review. The Internet and Higher Education , 25, pp.85-95.
Orlikowski, W.J. and Baroudi, J.J., 1991.
Studying Information Technology in Organizations: Research Approaches and Assumptions. Information Systems Research , 2(1), pp.1–28.
Oxford Dictionary, 2020.
User Experience, viewed May 27, 2020. < https://www.oxfordlearnersdictionaries.com/definition/english/user-experience>
Partos, T.R., Cropper, S.J. and Rawlings, D., 2016. You Don’t See What I See: Individual Differences in the Perception of Meaning from Visual Stimuli. Plos One, 11(3).
Pelgrum, W., 2001.
Obstacles to the integration of ICT in education: results from a worldwide educational assessment. Computers and Education, 37(2), pp.163–178.
Podsakoff, P.M., MacKenzie, S.B., Lee, J.Y. and Podsakoff, N.P., 2003.
Common method biases in behavioral research: A critical review of the literature and recommended remedies. Journal of applied psychology, 88(5), p.879.
Preece, J. Rogers, Y. and Sharp, H., 2002.
Interaction Design. Wiley, New York. Punchoojit, L. and Hongwarittorrn, N., 2017.
Usability Studies on Mobile User Interface Design Patterns: A Systematic Literature Review. Advances in Human-Computer Interaction , 2017, pp.1–22.
Putnik, Z., et al., 2013.
Usability and Privacy Aspects of Moodle - Students' and Teachers' Perspective. Informatica . 37.
Rapoport, R. N., 1970.
Three Dilemmas in Action Research: With Special Reference to the Tavistock Experience. Human Relations, 23 (6), pp.499–513.
59
Rosato, J., Dodds, C., and Laughlin, S., 2004.
Usability of course management systems by students. Department of Computer Information Systems/ Computer Science, College of Scholastica, Duluth.
Şenol, L., Gecili, H. and Durdu, P., 2014.
Usability Evaluation of a Moodle based Learning Management System. World Conference on Educational Multimedia, Hypermedia and Telecommunications. 1.
Sharma, A and Vatta, S., 2013. Role of Learning Management Systems in Education. International Journal of Advance Research in Computer Science and Software Engineering . Vol. 3 issue 6.
Shultz, S. and Hand, M., 2015.
Usability: A Concept Analysis. Journal of Theory Construction and Testing, 19(2), pp. 65-70.
Sullivan, G. and Artino, A., 2013.
Analyzing and Interpreting Data From Likert-Type Scales. Journal of graduate medical education. 5. 541-2. 10.4300/JGME-5-4-18.
Thuseethan S., Achchuthan S., and Kuhanesan S. (2014).
Usability evaluation of learning management systems in Sri Lankan universities. arXiv preprint arXiv:1412.0197.
Tomlinson, M., 2012.
Graduate Employability: A Review of Conceptual and Empirical Themes. High Educ Policy 25, pp.407–431.
UNESCO, 2003.
Ministerial Round Table on Knowledge Societies. UNESCO Digital Library, viewed May 27, 2020. <https://unesdoc.unesco.org/ark:/48223/pf0000132114>.
Verweij, M. et al., 2015. Emotion, rationality, and decision-making: how to link affective and social neuroscience with social theory. Frontiers in Neuroscience , 9.
De Villiers, M.R., 2005.
Models for Interpretive Information Systems Research, Part 1. Research Methodologies, Innovations and Philosophies in Software Systems Engineering and Information Systems, pp.222–237.
60
Walsham, G. (1993).
Interpreting Information Systems in Organizations. Chichester: John Wiley and Sons.
Walsham, G., & Waema, T., 1994.
Information Systems Strategy and Implementation: A Case Study of a Building Society. ACM Transactions on Information Systems, 12(2), pp.150-173.
Whitehead, D., 2013. An overview of research theory and process. Nursing & Midwifery Research: Methods and Appraisal for Evidence-Based Practice. Mosby, Marrickville, Sydney. pp.20-34.
Wilson, T., 2012.
A review of business–university collaboration. The Wilson Review, viewed on May 27, 2020. <https://www.gov.uk/government/publications/business-university-collaboration- he-wilson-review>
Yin, R.K., 1994. Discovering the future of the case study method in evaluation research. Evaluation Practice , 15(3), pp.283–290.
Young, S., 2005.
Universities, governments and industry: can the essential nature of universities survive the drive to commercialize? Journal of psychiatry and neuroscience: JPN. vol. 30,3, pp.160-163.
Zhang, W. and Creswell, J., 2013.
The use of "mixing" procedure of mixed methods in health services research. Med Care . 51(8):e51-e57.
61
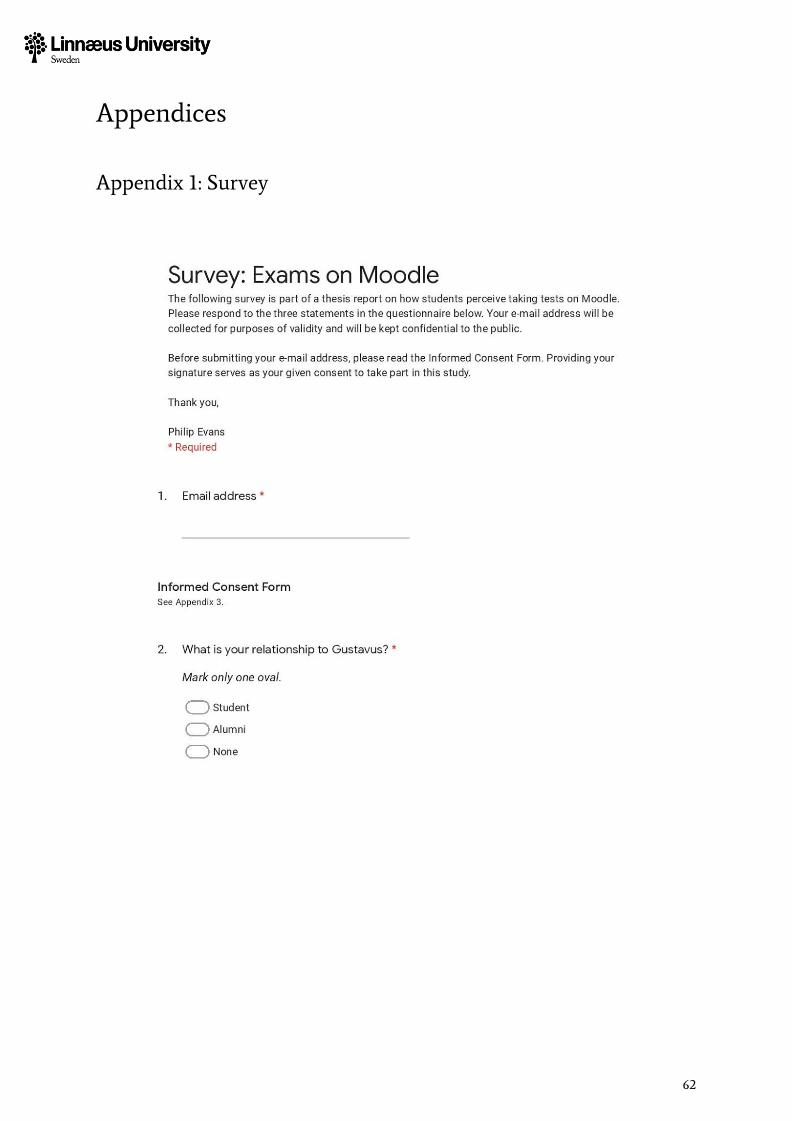
Appendices Appendix 1: Survey
62
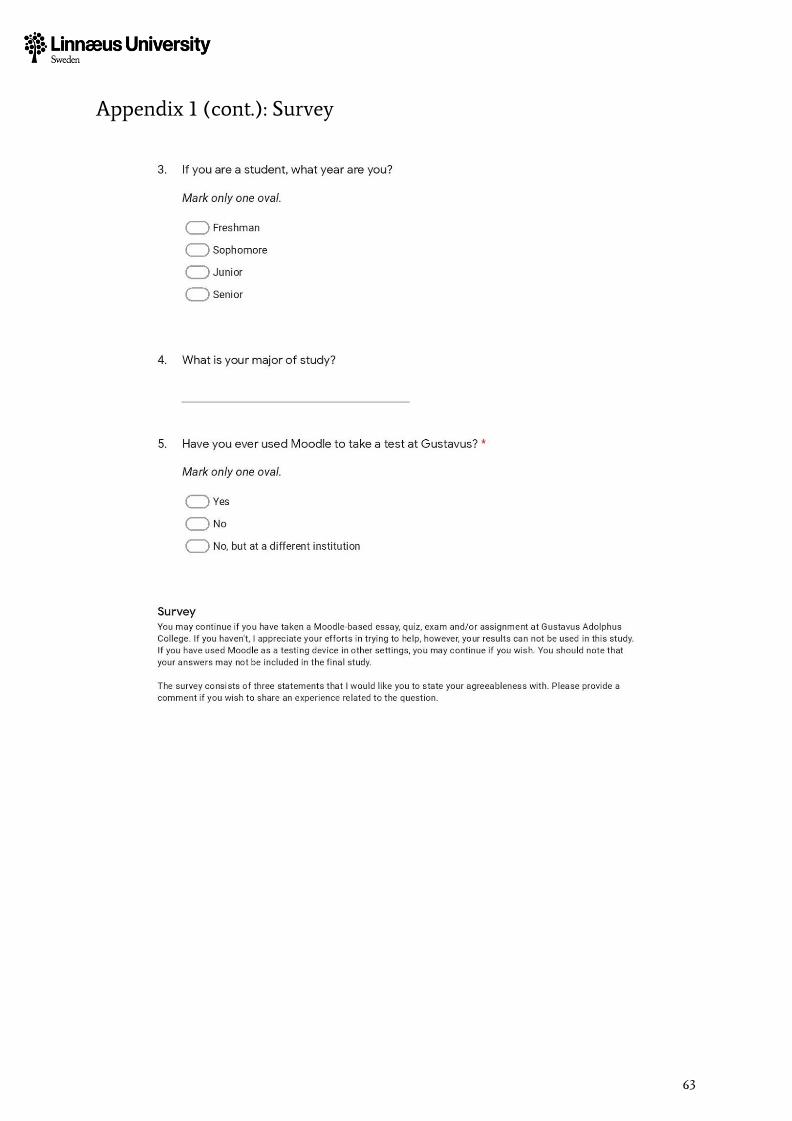
Appendix 1 (cont.): Survey
63
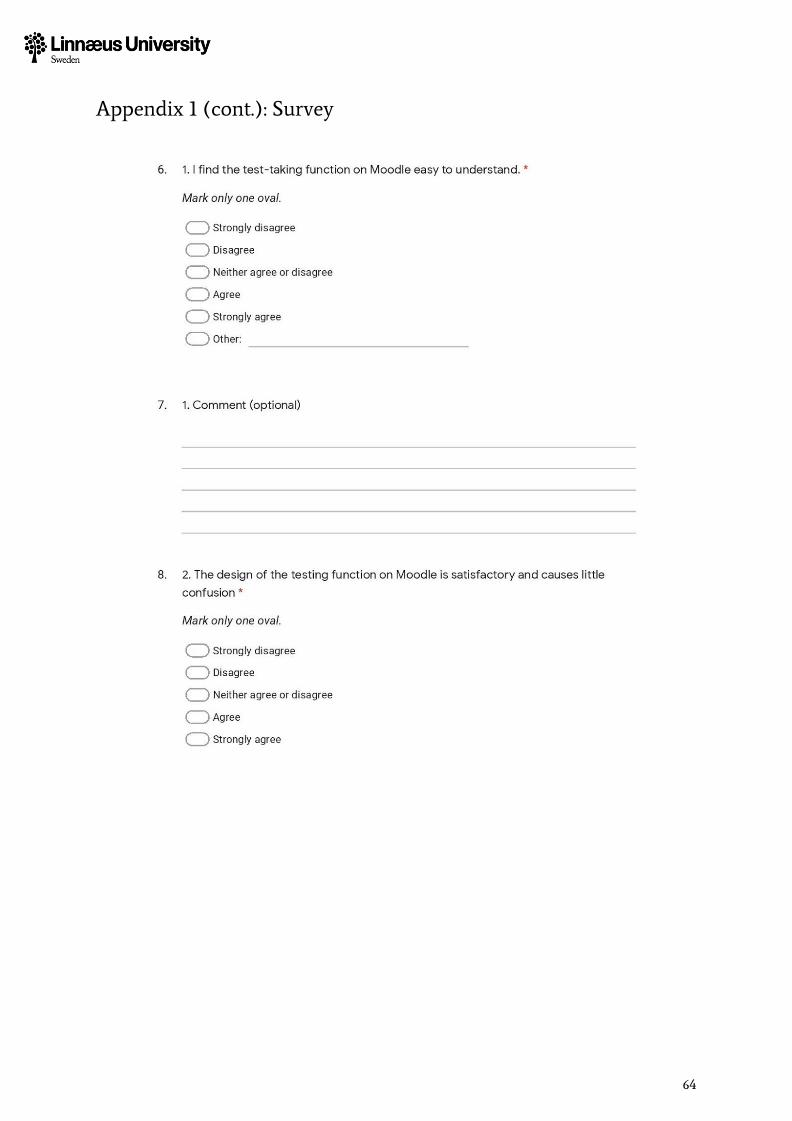
Appendix 1 (cont.): Survey
64
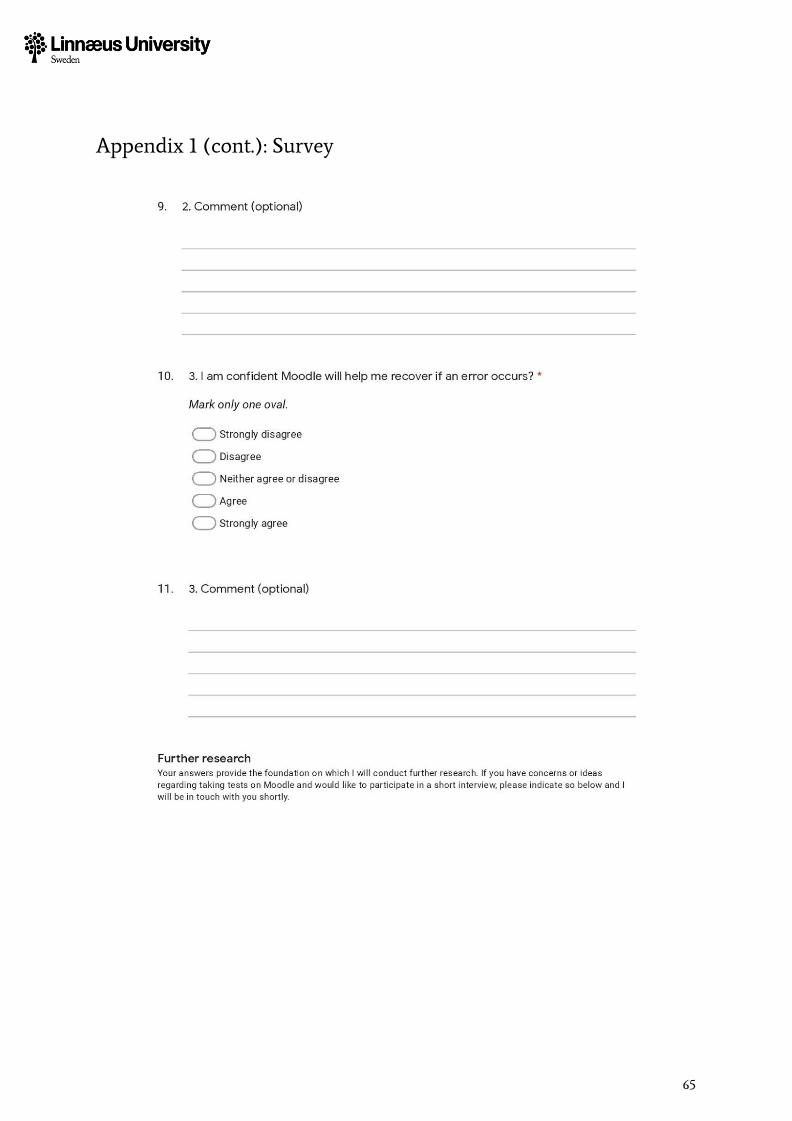
Appendix 1 (cont.): Survey
65
Appendix 1 (cont.): Survey
66
Appendix 2: Interview Questions The following questions guided the semi-structured interviews. Follow-up questions deviated in varying degrees from the prepared outline.
The general notion seems to be that Moodle is somewhat easy to use, and that the testing function is self-explanatory. What are your thoughts on that? Some students found Moodle’s testing function to be quite limiting, is this something you have an opinion on? What changes could be made for it to be more appealing and better suit your needs? Some students argued that they preferred a pen-and-paper test, is this something you have an opinion on? What could be done to the interface of Moodle to better mimic a pen-and-paper test? Based on questionnaire results, it seems like students are somewhat confused about Moodle’s ability to guide them through an unforeseen error. What are your thoughts about unforeseen errors while taking tests on Moodle? How do they make you feel? What are you most concerned about in regards to errors? What could be done to Moodle’s testing interface to reduce your level of concern? The survey results reveal some students find taking tests on Moodle to be a stressor, is this something you agree with? What suggestions do you have to decrease student stress levels when taking tests on Moodle?
67
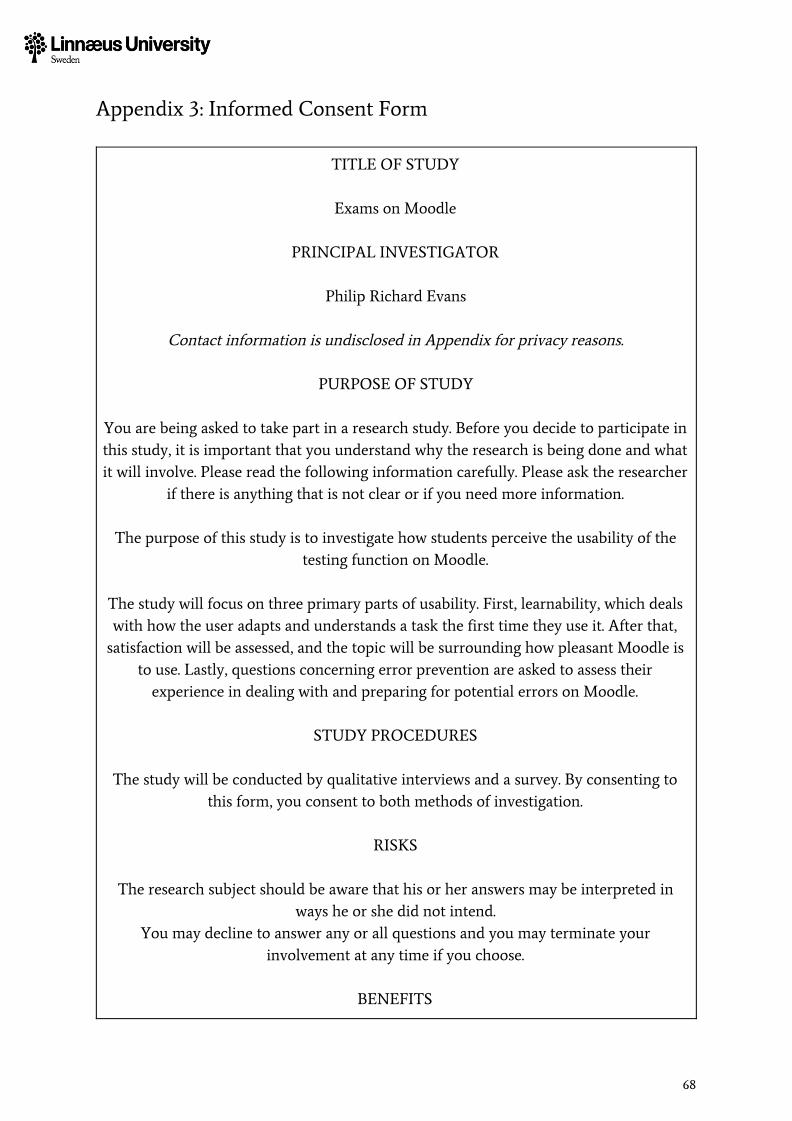
Appendix 3: Informed Consent Form
TITLE OF STUDY
Exams on Moodle
PRINCIPAL INVESTIGATOR
Philip Richard Evans
Contact information is undisclosed in Appendix for privacy reasons.
PURPOSE OF STUDY
You are being asked to take part in a research study. Before you decide to participate in this study, it is important that you understand why the research is being done and what it will involve. Please read the following information carefully. Please ask the researcher
if there is anything that is not clear or if you need more information.
The purpose of this study is to investigate how students perceive the usability of the testing function on Moodle.
The study will focus on three primary parts of usability. First, learnability, which deals with how the user adapts and understands a task the first time they use it. After that,
satisfaction will be assessed, and the topic will be surrounding how pleasant Moodle is to use. Lastly, questions concerning error prevention are asked to assess their
experience in dealing with and preparing for potential errors on Moodle.
STUDY PROCEDURES
The study will be conducted by qualitative interviews and a survey. By consenting to this form, you consent to both methods of investigation.
RISKS
The research subject should be aware that his or her answers may be interpreted in
ways he or she did not intend. You may decline to answer any or all questions and you may terminate your
involvement at any time if you choose.
BENEFITS
68
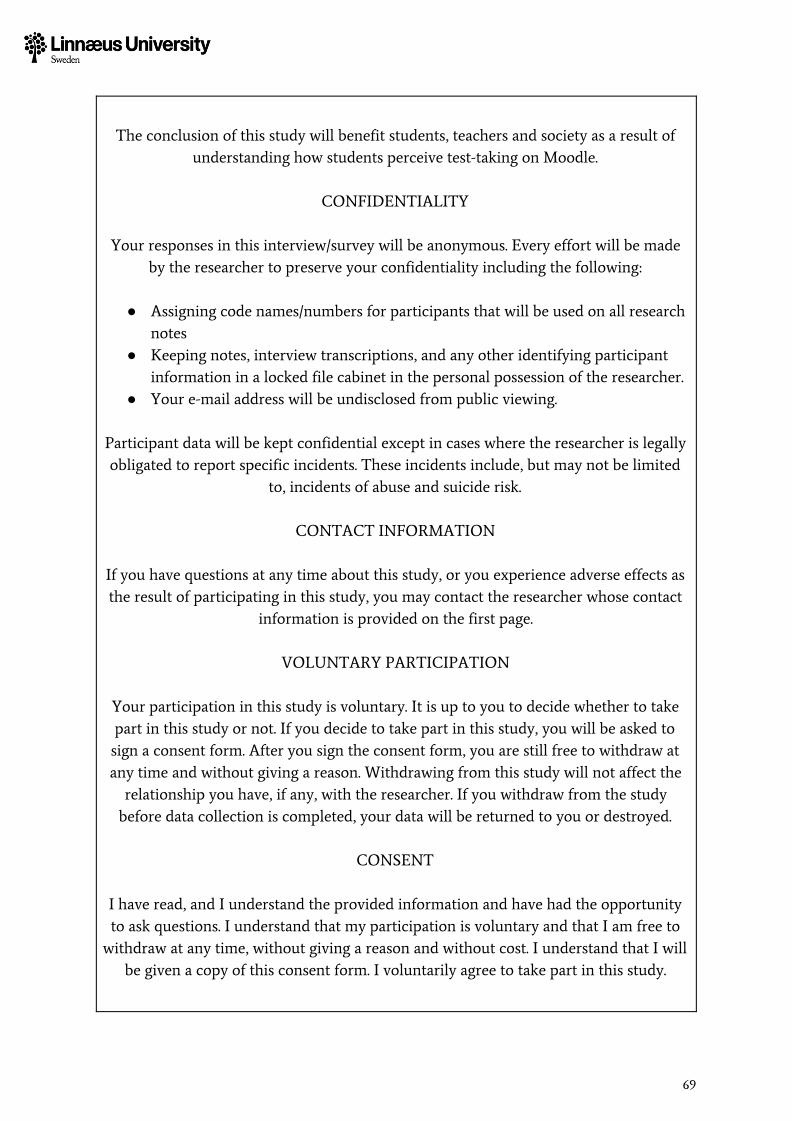
The conclusion of this study will benefit students, teachers and society as a result of
understanding how students perceive test-taking on Moodle.
CONFIDENTIALITY
Your responses in this interview/survey will be anonymous. Every effort will be made by the researcher to preserve your confidentiality including the following:
● Assigning code names/numbers for participants that will be used on all research
notes ● Keeping notes, interview transcriptions, and any other identifying participant
information in a locked file cabinet in the personal possession of the researcher. ● Your e-mail address will be undisclosed from public viewing.
Participant data will be kept confidential except in cases where the researcher is legally obligated to report specific incidents. These incidents include, but may not be limited
to, incidents of abuse and suicide risk.
CONTACT INFORMATION
If you have questions at any time about this study, or you experience adverse effects as the result of participating in this study, you may contact the researcher whose contact
information is provided on the first page.
VOLUNTARY PARTICIPATION
Your participation in this study is voluntary. It is up to you to decide whether to take part in this study or not. If you decide to take part in this study, you will be asked to sign a consent form. After you sign the consent form, you are still free to withdraw at any time and without giving a reason. Withdrawing from this study will not affect the
relationship you have, if any, with the researcher. If you withdraw from the study before data collection is completed, your data will be returned to you or destroyed.
CONSENT
I have read, and I understand the provided information and have had the opportunity to ask questions. I understand that my participation is voluntary and that I am free to
withdraw at any time, without giving a reason and without cost. I understand that I will be given a copy of this consent form. I voluntarily agree to take part in this study.
69
Participant's signature _________________ Date _________________ Participant's signature _________________ Dat e _________________ OR Sign electronically by checking box on survey and by writing your e-mail address Thank you. Signed, Date Participant's s P.R. Evans _______ ______ Da _________________
70