Transport in plants - IG Exams
10
Transport in plants Question Paper Level IGCSE Subject Biology Exam Board CIE Topic Transport in plants Sub-Topic Paper Type Alternative to Practical Booklet Question Paper Time Allowed: 57 minutes Score: /47 Percentage: /100 www.igexams.com
-
Upload
khangminh22 -
Category
Documents
-
view
1 -
download
0
Transcript of Transport in plants - IG Exams
Transport in plants Question Paper
Level IGCSE
Subject Biology
Exam Board CIE
Topic Transport in plants
Sub-Topic
Paper Type Alternative to Practical
Booklet Question Paper
Time Allowed: 57 minutes
Score: /47
Percentage: /100
www.igexams.com
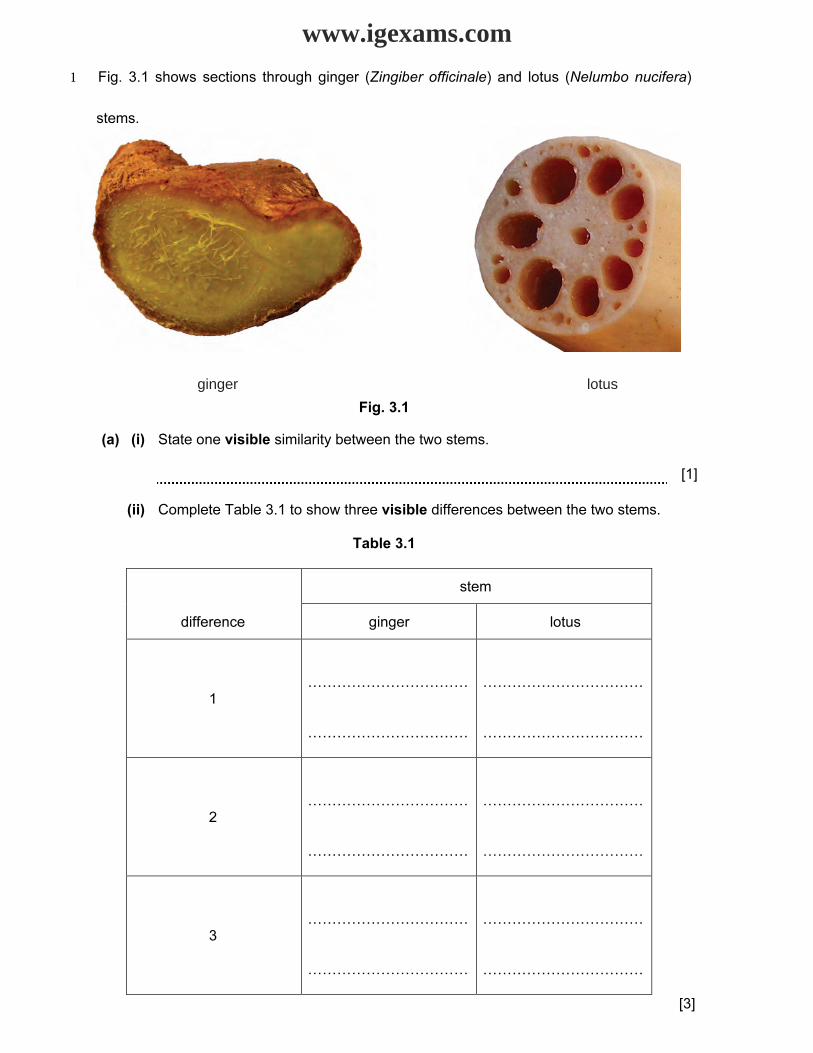
1 Fig. 3.1 shows sections through ginger (Zingiber officinale) and lotus (Nelumbo nucifera)
stems.
lotusgingerFig. 3.1
(a) (i) State one visible similarity between the two stems.
[1]
(ii) Complete Table 3.1 to show three visible differences between the two stems.
Table 3.1
stem
difference ginger lotus
1 ……………………………
……………………………
……………………………
……………………………
2 ……………………………
……………………………
……………………………
……………………………
3 ……………………………
……………………………
……………………………
……………………………
[3]
www.igexams.com
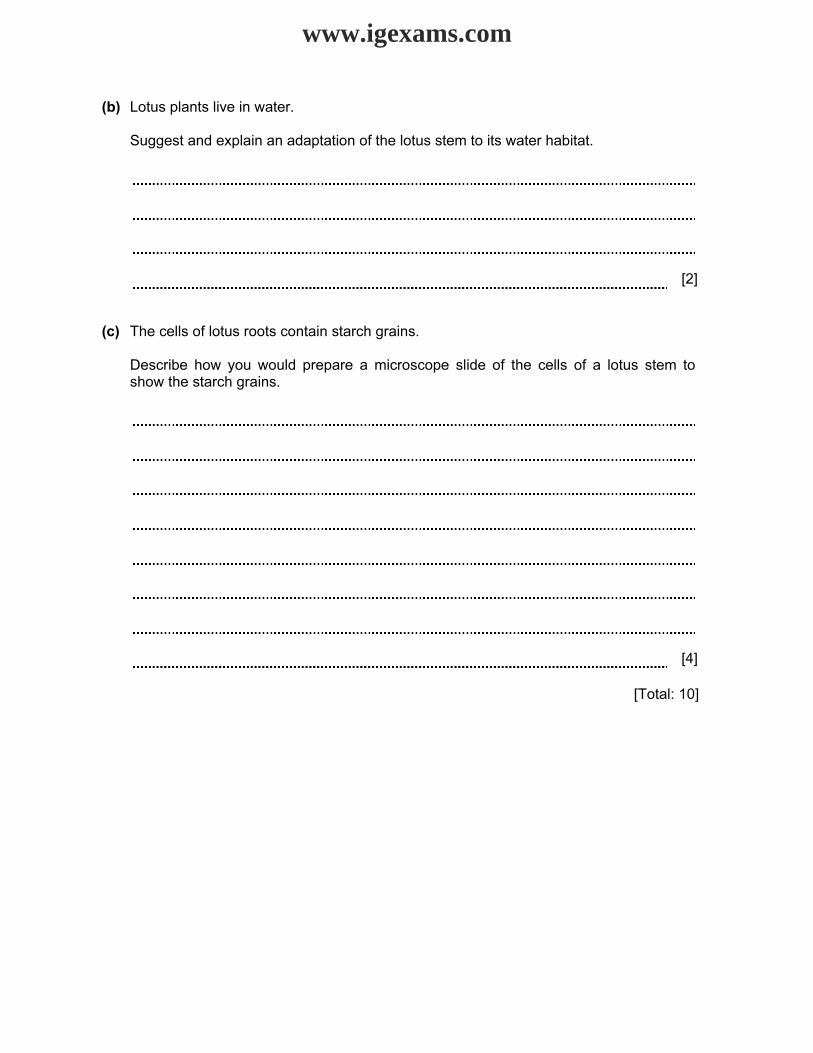
(b) Lotus plants live in water.
Suggest and explain an adaptation of the lotus stem to its water habitat.
[2]
(c) The cells of lotus roots contain starch grains.
Describe how you would prepare a microscope slide of the cells of a lotus stem toshow the starch grains.
[4]
[Total: 10]
www.igexams.com
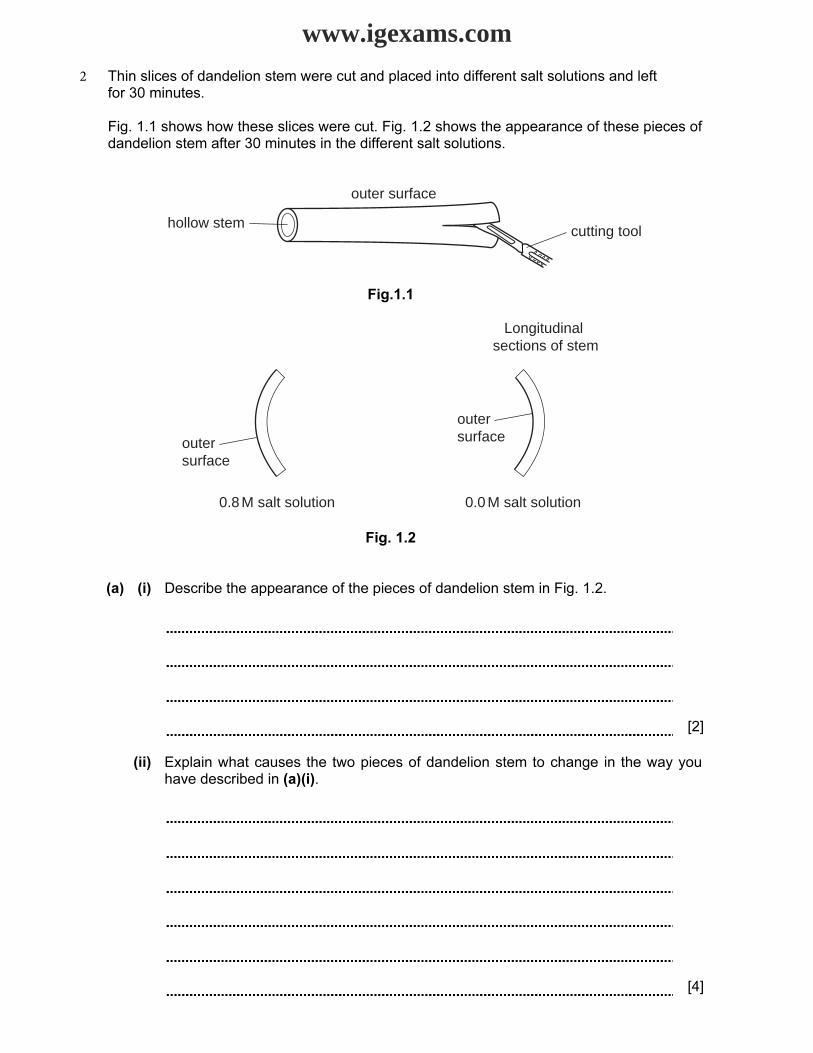
2 Thin slices of dandelion stem were cut and placed into different salt solutions and leftfor 30 minutes.
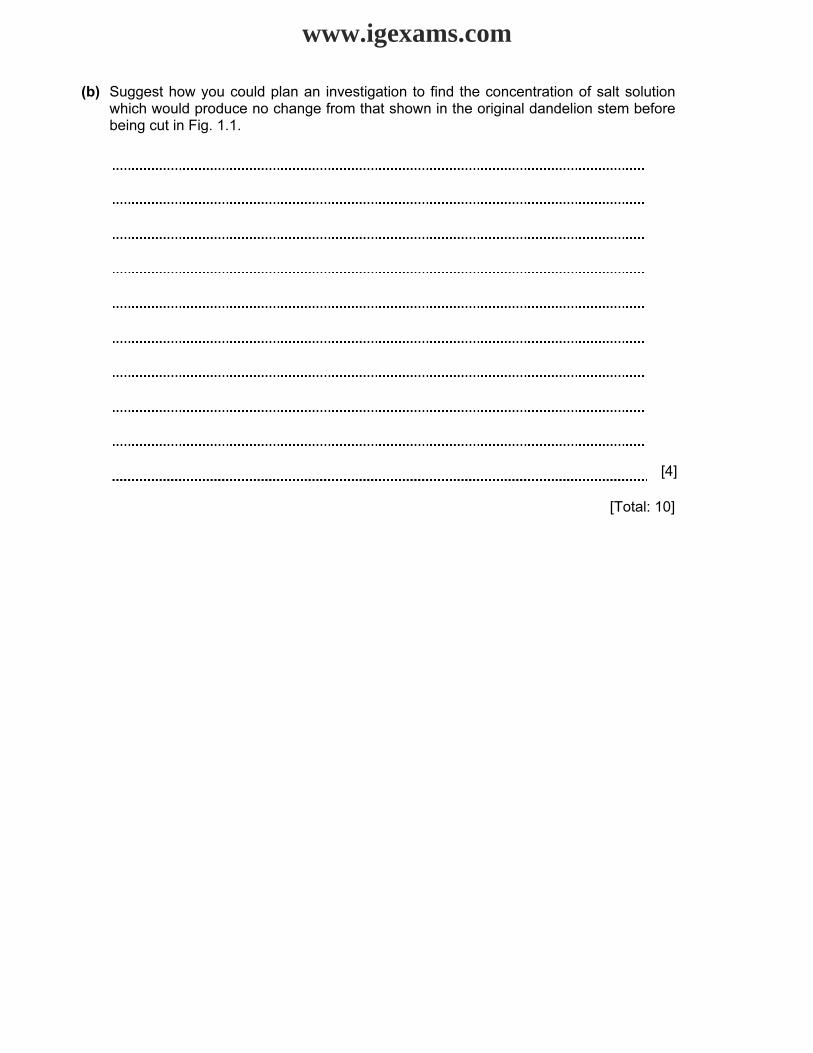
Fig. 1.1 shows how these slices were cut. Fig. 1.2 shows the appearance of these pieces of dandelion stem after 30 minutes in the different salt solutions.
outer surface
hollow stem cutting tool
Fig.1.1
0.8 M salt solution 0.0 M salt solution
outersurface
outersurface
Longitudinal sections of stem
Fig. 1.2
(a) (i) Describe the appearance of the pieces of dandelion stem in Fig. 1.2.
[2]
(ii) Explain what causes the two pieces of dandelion stem to change in the way youhave described in (a)(i).
[4]
www.igexams.com
(b) Suggest how you could plan an investigation to find the concentration of salt solutionwhich would produce no change from that shown in the original dandelion stem beforebeing cut in Fig. 1.1.
[4]
[Total: 10]
www.igexams.com
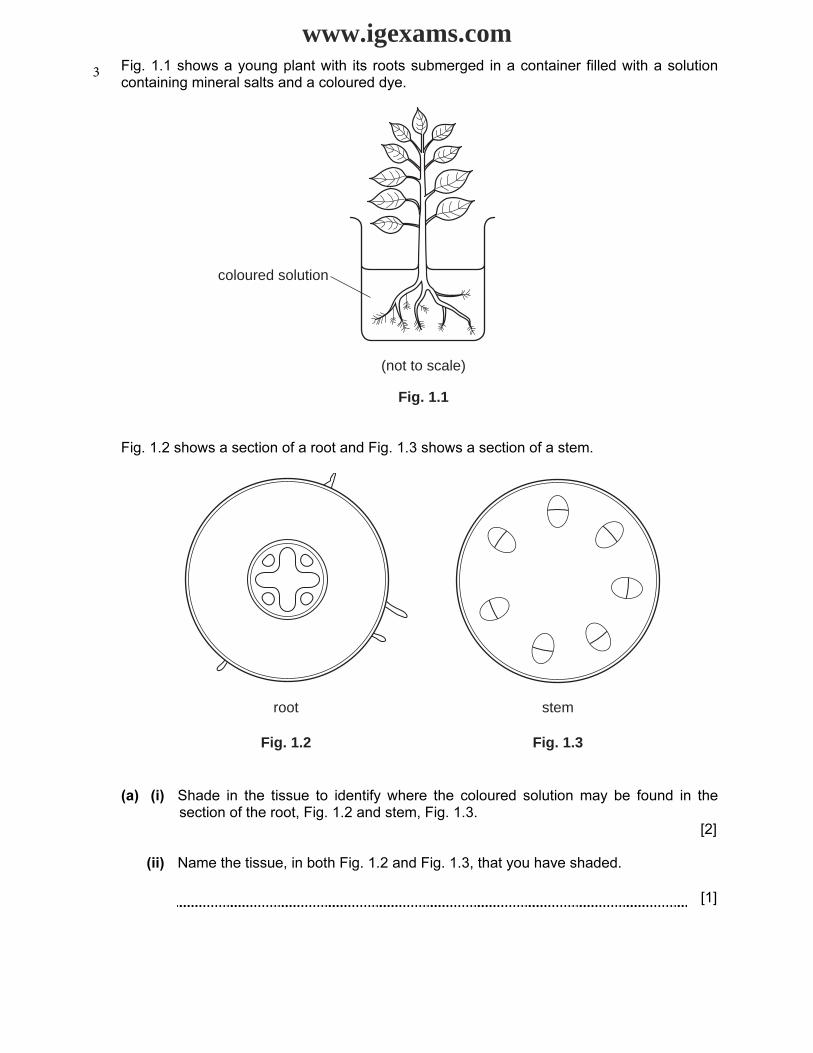
3 Fig. 1.1 shows a young plant with its roots submerged in a container filled with a solutioncontaining mineral salts and a coloured dye.
coloured solution
(not to scale)
Fig. 1.1
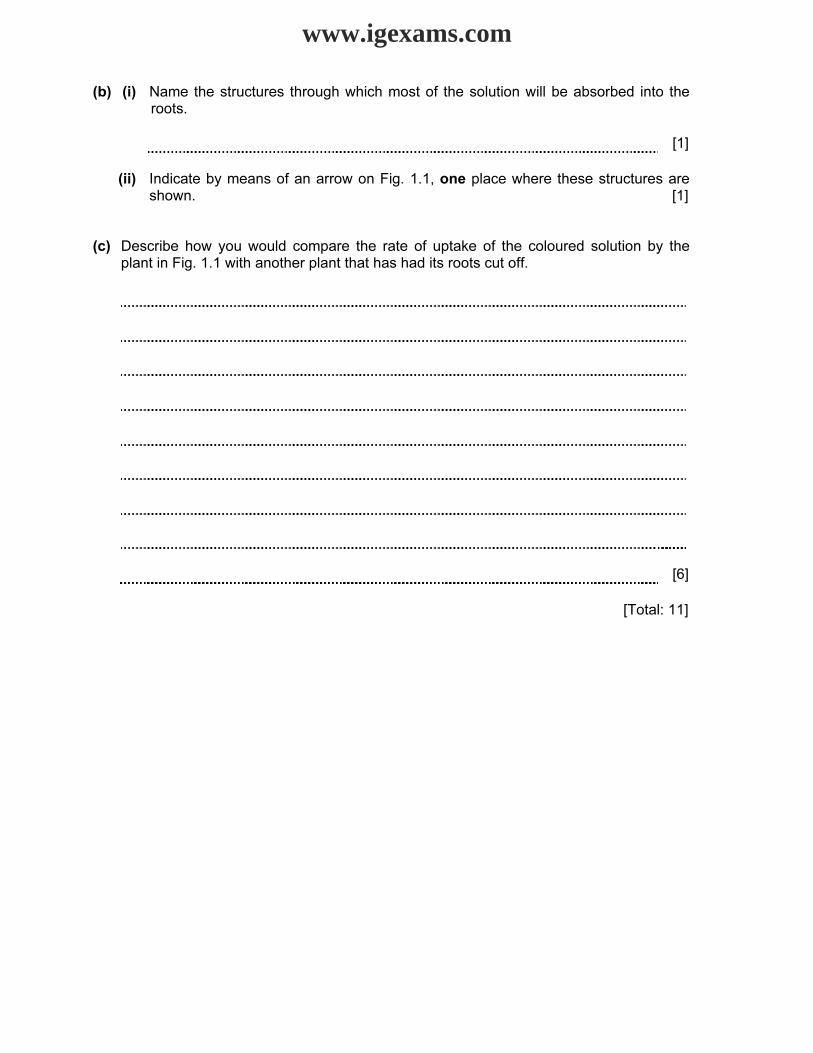
Fig. 1.2 shows a section of a root and Fig. 1.3 shows a section of a stem.
root
Fig. 1.2
stem
Fig. 1.3
(a) (i) Shade in the tissue to identify where the coloured solution may be found in thesection of the root, Fig. 1.2 and stem, Fig. 1.3.
[2]
(ii) Name the tissue, in both Fig. 1.2 and Fig. 1.3, that you have shaded.
[1]
www.igexams.com
(b) (i) Name the structures through which most of the solution will be absorbed into theroots.
[1]
(ii) Indicate by means of an arrow on Fig. 1.1, one place where these structures areshown. [1]
(c) Describe how you would compare the rate of uptake of the coloured solution by theplant in Fig. 1.1 with another plant that has had its roots cut off.
[6]
[Total: 11]
www.igexams.com
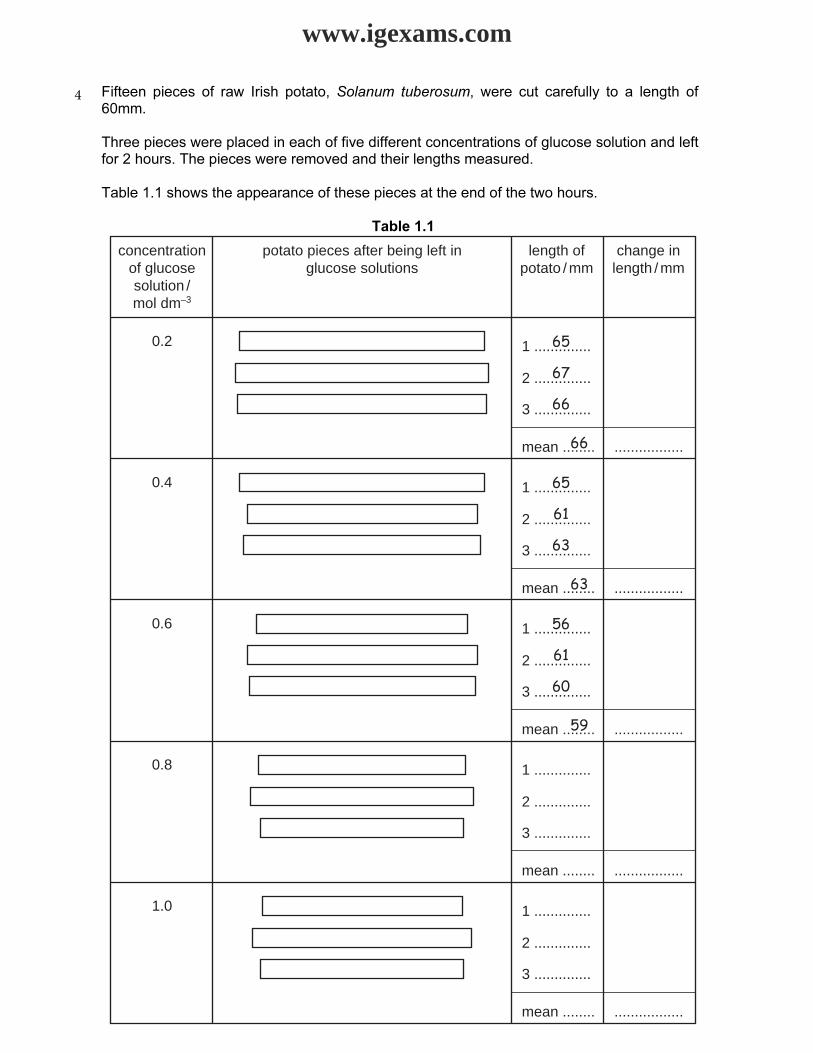
4 Fifteen pieces of raw Irish potato, Solanum tuberosum, were cut carefully to a length of60mm.
Three pieces were placed in each of five different concentrations of glucose solution and left for 2 hours. The pieces were removed and their lengths measured.
Table 1.1 shows the appearance of these pieces at the end of the two hours.
Table 1.1
concentrationof glucosesolution /mol dm–3
0.2
length ofpotato / mm
potato pieces after being left inglucose solutions
change inlength / mm
1 ..............
2 ..............
3 ..............
mean ........ .................
65
67
66
66
0.4 1 ..............
2 ..............
3 ..............
mean ........ .................
65
61
63
63
0.6 1 ..............
2 ..............
3 ..............
mean ........ .................
56
61
60
59
0.8 1 ..............
2 ..............
3 ..............
mean ........ .................
1.0 1 ..............
2 ..............
3 ..............
mean ........ .................
www.igexams.com

(a) (i) Measure the length of each piece carefully and record these measurements inTable 1.1. Write in the figures on the dotted lines. Nine measurements have been completed for you.
[1]
(ii) Calculate the mean [average] length of the potato pieces. The first three rows havebeen completed for you.
[1]
(iii) Calculate the change in mean length in all five concentrations of glucose solutions.[2]
(iv) Explain why three pieces of potato were used in each solution and not just onepiece.
[1]
(b) (i) Plot the change in mean length of potato against concentration of glucose solutionon the grid below.
Draw a line of best fit through the points.
changein meanlength/ mm
concentration of glucose solution / mol dm–3
+
–
[4]
www.igexams.com
(ii) Describe and explain the changes in mean length of the potato pieces in the differentglucose solutions.
[4]
(c) (i) Using the information from the graph, estimate the glucose concentration whichresults in no change in mean length.
[1]
(ii) Suggest why, at this glucose concentration, there is no change in length.
[2]
total [16]
www.igexams.com


![“পরীক্ষা পরীক্ষা [Exam, Exams]”](https://static.fdokumen.com/doc/165x107/632b8af39c349fded708ab41/-exam-exams.jpg)