Assessing MOOCs Discussion Forums - INESC-ID
82
Assessing MOOCs Discussion Forums Gonçalo Duarte Varela Thesis to obtain the Master of Science Degree in Information Systems and Computer Engineering Supervisor: Prof. Maria Luísa Torres Ribeiro Marques da Silva Coheur Examination Committee Chairperson: Prof. Mário Jorge Costa Gaspar da Silva Supervisor: Prof. Maria Luísa Torres Ribeiro Marques da Silva Coheur Member of the Committee: Prof. João Miguel de Sousa de Assis Dias November 2015
-
Upload
khangminh22 -
Category
Documents
-
view
0 -
download
0
Transcript of Assessing MOOCs Discussion Forums - INESC-ID

Assessing MOOCs Discussion Forums
Gonçalo Duarte Varela
Thesis to obtain the Master of Science Degree in
Information Systems and Computer Engineering
Supervisor: Prof. Maria Luísa Torres Ribeiro Marques da Silva Coheur
Examination Committee
Chairperson: Prof. Mário Jorge Costa Gaspar da SilvaSupervisor: Prof. Maria Luísa Torres Ribeiro Marques da Silva CoheurMember of the Committee: Prof. João Miguel de Sousa de Assis Dias
November 2015

ii

Dedicated to my mother.
iii

iv

Acknowledgments
Foremost, i want to thank my mother for the education and unconditional support during these long
years.
To my family, that were always there, who helped me with words of encouragement, useful advices
and monetary support when i needed most.
To professors Luísa Coheur and Cláudia Antunes, for their guidance, time and knowledge transmit-
ted. Also, to Instituto Superior Técnico for providing me the conditions to complete this course.
Finally, to my friends, those who were present all the time, who helped me abstract all problems and
those who proportionated a joyful time even in difficult situations.
v

vi
Resumo
Com a recente popularidade dos MOOCs, os instrutores destes cursos enfrentam agora o problema de
ter de escolher, de entre as centenas de posts dos fóruns dos seus cursos, os que precisam de resposta
mais imediata. Nesta tese usamos técnicas das áreas de Análise de Sentimentos e Processamento de
Língua Natural para classificar/extrair informação destes posts, com o objetivo futuro de contribuir para
esta escolha. Num primeiro estudo, desenvolvemos um modelo de classificação que nos permite iden-
tificar se uma mensagem pertence a um instrutor ou estudante. Os melhores resultados do cálculo da
F-measure (80.76% para categoria estudante e 80.38% para categoria instrutor) foram obtidos usando
unigramas como features e tendo usado um stemmer sobre os posts. O segundo estudo visou a im-
plementação de um classificador que devolve a polaridade de um post com base na polaridade dos
seus termos, tal como definida no léxico SenticNet. Os melhores resultados obtidos no cálculo da F-
measure foram de 74.6% na identificação de termos positivos batendo os resultados do SentiStrength
e de 38.3% na identificação de termos negativos. Finalmente, num terceiro estudo identificámos as
expressões mais frequentes por parte de instrutores e estudantes, bem como os termos mais comuns
aos diferentes e específicos cursos. Concluímos que existem de facto expressões específicas e que
podem ser úteis na identificação de instrutores e estudantes, bem como a diferentes cursos.
Palavras-chave: Cursos Online, estudantes, instrutores, polaridade, fóruns de discussão,
mensagens, sentimento.
vii

viii
Abstract
With the recent popularity of Massive Open Online Courses (MOOCs), instructors of these courses now
face the problem of having to choose from among the hundreds of posts from forums of their courses,
who need more immediate response. In this thesis we use techniques from the fields of Sentiment
Analysis and Natural Language Processing to classify / extract information from these posts, with the
future goal of contributing to this choice. In a first study, we developed a classification model that allows
us to identify whether a message belongs to an instructor or student. The best F-measure (F1) results
(80.76 % for student category and 80.38 % for instructor category) were obtained using unigrams as
features and having used a stemmer on the posts. The second study aimed at implementing a classifier
that detects the polarity of a post based on the polarity of their terms, as defined in SenticNet lexicon.
The best F-measure (F1) results were 74.6 % in the identification of positive terms beating the results
of SentiStrength, and 38.3 % in the identification of negative terms. Finally, a third study identified the
most frequently used expressions by instructors and students as well as the most common terms to the
different and specific courses. We concluded that there are in fact specific expressions that could help
in the identification of students and instructors as well as for the different courses.
Keywords: MOOCs, student, instructor, polarity, discussion forums, posts, sentiment.
ix

x

Contents
Acknowledgments . . . . . . . . . . . . . . . . . . . . . . . . . . . . . . . . . . . . . . . . . . . v
Resumo . . . . . . . . . . . . . . . . . . . . . . . . . . . . . . . . . . . . . . . . . . . . . . . . . vii
Abstract . . . . . . . . . . . . . . . . . . . . . . . . . . . . . . . . . . . . . . . . . . . . . . . . . ix
List of Tables . . . . . . . . . . . . . . . . . . . . . . . . . . . . . . . . . . . . . . . . . . . . . . xiv
List of Figures . . . . . . . . . . . . . . . . . . . . . . . . . . . . . . . . . . . . . . . . . . . . . xvi
Nomenclature . . . . . . . . . . . . . . . . . . . . . . . . . . . . . . . . . . . . . . . . . . . . . . 1
Glossary . . . . . . . . . . . . . . . . . . . . . . . . . . . . . . . . . . . . . . . . . . . . . . . . 1
1 Introduction 1
1.1 Motivation . . . . . . . . . . . . . . . . . . . . . . . . . . . . . . . . . . . . . . . . . . . . . 1
1.2 Objectives . . . . . . . . . . . . . . . . . . . . . . . . . . . . . . . . . . . . . . . . . . . . . 2
1.3 Structure . . . . . . . . . . . . . . . . . . . . . . . . . . . . . . . . . . . . . . . . . . . . . 2
2 Related Work 3
2.1 Useful Resources . . . . . . . . . . . . . . . . . . . . . . . . . . . . . . . . . . . . . . . . 3
2.1.1 Coursera Discussion Forums . . . . . . . . . . . . . . . . . . . . . . . . . . . . . . 3
2.1.2 EmotiWorld . . . . . . . . . . . . . . . . . . . . . . . . . . . . . . . . . . . . . . . . 3
2.1.3 Linguistic Inquiry and Word Count . . . . . . . . . . . . . . . . . . . . . . . . . . . 4
2.1.4 WordNet and WordNet-Affect . . . . . . . . . . . . . . . . . . . . . . . . . . . . . . 4
2.1.5 SentiWordNet . . . . . . . . . . . . . . . . . . . . . . . . . . . . . . . . . . . . . . . 4
2.1.6 SenticNet . . . . . . . . . . . . . . . . . . . . . . . . . . . . . . . . . . . . . . . . . 4
2.1.7 Sentiful . . . . . . . . . . . . . . . . . . . . . . . . . . . . . . . . . . . . . . . . . . 5
2.1.8 AFINN . . . . . . . . . . . . . . . . . . . . . . . . . . . . . . . . . . . . . . . . . . . 5
2.1.9 SentiStrength . . . . . . . . . . . . . . . . . . . . . . . . . . . . . . . . . . . . . . . 5
2.1.10 Merged Lexicon: WordNet-Affect + SenticNet . . . . . . . . . . . . . . . . . . . . . 6
2.2 General Sentiment Analysis . . . . . . . . . . . . . . . . . . . . . . . . . . . . . . . . . . . 8
2.2.1 Addressing the Difficulties of Sentiment Classification . . . . . . . . . . . . . . . . 8
2.2.2 Methodology for Sentiment Classification in Textual Reviews . . . . . . . . . . . . 10
2.2.3 Sentiment Classification Algorithm . . . . . . . . . . . . . . . . . . . . . . . . . . . 11
2.2.4 Sentence Oriented Classifiers . . . . . . . . . . . . . . . . . . . . . . . . . . . . . 12
2.3 Sentiment Analysis in MOOCs and Forums . . . . . . . . . . . . . . . . . . . . . . . . . . 16
xi

2.3.1 Detecting Emotional Expressions in MOOCs . . . . . . . . . . . . . . . . . . . . . 16
2.3.2 Emotion Detection in E-Learning . . . . . . . . . . . . . . . . . . . . . . . . . . . . 20
2.3.3 Sentiment Analysis for Online Forums Hotspot Detection . . . . . . . . . . . . . . 22
3 Distinguishing Students’ from Instructors’ Posts in Education Forums 25
3.1 The Corpus of Education Forums . . . . . . . . . . . . . . . . . . . . . . . . . . . . . . . . 25
3.2 Architecture . . . . . . . . . . . . . . . . . . . . . . . . . . . . . . . . . . . . . . . . . . . . 28
3.3 Implementation . . . . . . . . . . . . . . . . . . . . . . . . . . . . . . . . . . . . . . . . . . 30
3.4 Evaluation Setup . . . . . . . . . . . . . . . . . . . . . . . . . . . . . . . . . . . . . . . . . 32
3.5 Experiences . . . . . . . . . . . . . . . . . . . . . . . . . . . . . . . . . . . . . . . . . . . . 33
3.6 Discussion . . . . . . . . . . . . . . . . . . . . . . . . . . . . . . . . . . . . . . . . . . . . 35
4 Polarity assessment in students posts 37
4.1 Architecture . . . . . . . . . . . . . . . . . . . . . . . . . . . . . . . . . . . . . . . . . . . . 37
4.2 Implementation . . . . . . . . . . . . . . . . . . . . . . . . . . . . . . . . . . . . . . . . . . 39
4.3 Extending with other lexicons and languages . . . . . . . . . . . . . . . . . . . . . . . . . 42
4.4 Building a reference . . . . . . . . . . . . . . . . . . . . . . . . . . . . . . . . . . . . . . . 42
4.5 Evaluation Setup . . . . . . . . . . . . . . . . . . . . . . . . . . . . . . . . . . . . . . . . . 43
4.6 Experiences . . . . . . . . . . . . . . . . . . . . . . . . . . . . . . . . . . . . . . . . . . . . 44
4.7 Discussion . . . . . . . . . . . . . . . . . . . . . . . . . . . . . . . . . . . . . . . . . . . . 45
5 Most common expressions used in MOOCs 48
6 Conclusions and Future Work 51
6.1 Future Work . . . . . . . . . . . . . . . . . . . . . . . . . . . . . . . . . . . . . . . . . . . . 52
Bibliography 57
A Courses’ most frequent terms 59
xii

List of Tables
2.1 [40]. Features used from the International Survey on Emotion Antecedents and Reactions
(ISEAR) columns. . . . . . . . . . . . . . . . . . . . . . . . . . . . . . . . . . . . . . . . . 6
2.2 [7]. Phenomena which influence the valence of text. . . . . . . . . . . . . . . . . . . . . . 9
2.3 [32]. Dataset used for SemEval-13 with the distribution of tweets and Short Message
Service (SMS). . . . . . . . . . . . . . . . . . . . . . . . . . . . . . . . . . . . . . . . . . 11
2.4 [19]. Examples of the different categories of affect . . . . . . . . . . . . . . . . . . . . . . 17
2.5 [19]. Test results of the automatic classification of the affect. . . . . . . . . . . . . . . . . 18
2.6 [56]. Examples of Sink and Source . . . . . . . . . . . . . . . . . . . . . . . . . . . . . . 19
2.7 [8]. Results of the classification algorithms[8] . . . . . . . . . . . . . . . . . . . . . . . . . 23
3.1 Example of easy assessment posts. . . . . . . . . . . . . . . . . . . . . . . . . . . . . . . 30
3.2 Example of posts that can cause confusion. . . . . . . . . . . . . . . . . . . . . . . . . . . 30
3.3 Results of the classification on dataset considering Instructor as expected category. . . . 34
3.4 Results of the classification on dataset considering Student as expected category. . . . . 34
3.5 Results of the classification on dataset without stopwords considering Instructor as ex-
pected category. . . . . . . . . . . . . . . . . . . . . . . . . . . . . . . . . . . . . . . . . . 34
3.6 Results of the classification on dataset without stopwords considering Student as ex-
pected category. . . . . . . . . . . . . . . . . . . . . . . . . . . . . . . . . . . . . . . . . . 35
3.7 Results of the classification on dataset only using stems, with Instructor as expected
category. . . . . . . . . . . . . . . . . . . . . . . . . . . . . . . . . . . . . . . . . . . . . . 35
3.8 Results of the classification on dataset only using stems with Student as expected category. 35
4.1 Example of the structured lists containing the posts and the terms present in both lexicon
and post . . . . . . . . . . . . . . . . . . . . . . . . . . . . . . . . . . . . . . . . . . . . . . 41
4.2 (Ax)- Annotator x. Inter-annotator agreement using Cohen’s kappa values. . . . . . . . . . 42
4.3 Results of the classification on different experiences when expecting a positive result. . . 44
4.4 Results of the classification on different experiences when expecting a negative result. . . 44
4.5 Results of the SentiStrength algorithm on different experiences when expecting a positive
result. . . . . . . . . . . . . . . . . . . . . . . . . . . . . . . . . . . . . . . . . . . . . . . . 44
4.6 Results of the SentiStrength algorithm on different experiences when expecting a negative
result. . . . . . . . . . . . . . . . . . . . . . . . . . . . . . . . . . . . . . . . . . . . . . . . 45
xiii

4.7 Results of our classifier when compared with the Spedial project scores. . . . . . . . . . . 45
4.8 Results of our classifier when compared with the Pang&Lee sentences dataset scores. . 45
5.1 The most common expressions belonging to instructors and students when searching
with 5-grams. . . . . . . . . . . . . . . . . . . . . . . . . . . . . . . . . . . . . . . . . . . . 48
5.2 The most common expressions belonging to instructors and students when searching
with 5-grams. . . . . . . . . . . . . . . . . . . . . . . . . . . . . . . . . . . . . . . . . . . . 50
A.1 The 5 most used specific terms found in each course using unigrams as search feature
ordered by their occurrence frequency. . . . . . . . . . . . . . . . . . . . . . . . . . . . . . 66
xiv

List of Figures
2.1 [33]. Steps for sentiment classification. . . . . . . . . . . . . . . . . . . . . . . . . . . . . 10
2.2 [51]. The segmentation and classification process in the Joint Segmentation and Classifi-
cation Framework (JSC) sentiment classifier. CG represent candidate generation model,
SC the sentiment classification model, SEG refers to the segmentation ranking model.
The arrows means the use of a specified model (Down) and the update of a model (Up). 13
2.3 [35]. Dependency subtrees polarities. Each subtree contains its respective polarity ac-
cording their terms. . . . . . . . . . . . . . . . . . . . . . . . . . . . . . . . . . . . . . . . 14
2.4 [35]. Probabilistic Model based on Dependency Tree. The node s2 is the head modifier,
which shift the polarity of the sentence and consequently gives the polarity of the root
node. . . . . . . . . . . . . . . . . . . . . . . . . . . . . . . . . . . . . . . . . . . . . . . . 14
3.1 An excerpt of the data contained in our dataset (format JSON). . . . . . . . . . . . . . . . 26
3.2 Format of our data after extracting the author and respective post. . . . . . . . . . . . . . 26
3.3 Posts containing no information regarding their author type. . . . . . . . . . . . . . . . . . 27
3.4 The result of applying the regex removal function in an excerpt of posts. . . . . . . . . . . 27
3.5 Post before e-mail/URL expression removal.. . . . . . . . . . . . . . . . . . . . . . . . . . 27
3.6 Post after e-mail/URL expression removal.. . . . . . . . . . . . . . . . . . . . . . . . . . . 27
3.7 Excerpt of a post containing a mathematical/code function before the regex transformation. 27
3.8 Excerpt of a post containing a mathematical/code function after the regex transformation. 27
3.9 Example of 2 posts before the execution of the line processing function. . . . . . . . . . . 28
3.10 Example of 2 posts after the execution of the line processing function. . . . . . . . . . . . 28
3.11 Excerpt of the dataset without the blank lines. . . . . . . . . . . . . . . . . . . . . . . . . . 28
3.12 The posts generated by the partition of 2 posts (Figure 1.9/10). . . . . . . . . . . . . . . . 29
3.13 A set of posts before the application of the stemmer. . . . . . . . . . . . . . . . . . . . . . 29
3.14 The set of posts after the application of the stemmer. . . . . . . . . . . . . . . . . . . . . . 29
3.15 Architecture. . . . . . . . . . . . . . . . . . . . . . . . . . . . . . . . . . . . . . . . . . . . 30
3.16 An excerpt of the evaluation process of the TalKit SVM Machine Learning classifier. . . . 31
3.17 Example of ngrams: green - unigrams, blue - bigrams, red - trigrams. . . . . . . . . . . . . 31
3.18 Excerpt of dataset after pre-process phase. . . . . . . . . . . . . . . . . . . . . . . . . . . 32
3.19 Excerpt of dataset after the removal of stopwords. . . . . . . . . . . . . . . . . . . . . . . 32
3.20 Excerpt of dataset after the employment of a stemmer. . . . . . . . . . . . . . . . . . . . . 33
xv

3.21 Examples of posts classified as incorrect and their faulty expressions. . . . . . . . . . . . 36
4.1 Architecture of the posts classification framework. . . . . . . . . . . . . . . . . . . . . . . 38
4.2 Excerpt of SenticNet lexicon before the processing and extraction of concept and polarity. 39
4.3 Excerpt of SenticNet lexicon after the extraction and formatting. . . . . . . . . . . . . . . . 39
4.4 Example of expressions with their polarity altered by adverbs or negation. . . . . . . . . . 40
4.5 Example of expression matching and capture. . . . . . . . . . . . . . . . . . . . . . . . . . 40
4.6 Example of the final presentation of the results. . . . . . . . . . . . . . . . . . . . . . . . . 41
4.7 Example of posts that were incorrectly classified due to the absence of stems. . . . . . . 45
4.8 Example of posts that were incorrectly classified due to the presence of expressions of
difficult assessment. . . . . . . . . . . . . . . . . . . . . . . . . . . . . . . . . . . . . . . . 46
4.9 Example of posts that were incorrectly classified due to the absence of Part of Speech
(POS) tagging. . . . . . . . . . . . . . . . . . . . . . . . . . . . . . . . . . . . . . . . . . . 46
4.10 Example of posts that were incorrectly classified due to the presence of expressions
where students do not explicit their sentiment. . . . . . . . . . . . . . . . . . . . . . . . . . 46
4.11 Example of posts that were annotated as neutral but contain foreign words. . . . . . . . . 46
xvi

Chapter 1
Introduction
1.1 Motivation
Massive Open Online Courses (MOOCs) are an in expansion web-based resource for e-learning that
offer students the possibility of distance education. These courses are usually free and offer the op-
portunity of proper education to people, only requiring a computer and an internet connection. There
are numerous companies that provide MOOCs. Amongst the most notorious: Coursera.org1 and edX2.
These courses, like traditional classes, comprise several aspects of presential learning where students
can attend and participate in different classes.
One of the most important features in MOOCs are the discussion forums. These forums are the only
way that students have to interact with the instructors, allowing them to submit their work and share their
knowledge and doubts, not only with instructors but also with others students, forming what we can call
an online community.
Due to the large amount of participants in these courses, these forums tend to have large amounts of
posts and threads making the instructors’ job very difficult in terms of data analysis. Thus, we will work
on some tasks that could assist the instructors, such as the detection of written students’ emotional
expressions.
In this work we are going to analyze discussion forums of Coursera courses to determine, based on
the posts of instructors and students in a training set, which features offer better results in the classifica-
tion of posts’ authors referring to instructors and students. These forums were used as corpora during
the development of this thesis and were kindly provided by Lorenzo Rossi, Rossi and Gnawali [45]. The
purpose of this study, is to establish, based on our dataset that already include this type of information,
a starting point and useful knowledge for helping future works where this kind of information may be
lacking. Then, we will propose an approach to evaluate the polarities of these posts, making it possible
to instructors identify which posts are most likely to contain doubts or dissatisfaction by students. Also,
we will identify in all courses which students’ expressions are the most commonly used.
In this thesis we discuss topics of different study fields, such as Natural Language Process-
1https://www.coursera.org/2https://www.edx.org/
1
ing (NLP) to address text processing techniques to assess the written posts of students, and Opinion
Mining/Sentiment Analysis to determine the emotion polarities and the affect these words and ex-
pressions infer. These assignments will have the assistance of useful resources such lexicons that will
provide the polarities and scores for the classification process.
1.2 Objectives
In summary, the objectives proposed in this thesis are the following:
• Survey the state of the art of related fields such as emotion detection in e-learning, discerning
emotional expressions in discussion forums and several algorithms of sentiment classification.
• Development of a model of classification for training classifiers for distinguishing post authors in
education forums.
• Development of a classifier for identifying polarity in students’ posts on MOOCs discussion forums.
• Study of the most common expressions used in MOOCs.
1.3 Structure
This thesis is organized as follows: In Chapter 2 we present the dataset we will use and the related
work. In Chapter 3 we specify the methodology for training a classifier to distinguish the post authors in
a dataset. The task of developing a methodology for polarity assessment in students posts are explained
in Chapter 4. In Chapter 5 a study of the most common expressions used in MOOCs is made. Finally,
in Chapter 6, we present a conclusion and a starting point for future work.
2
Chapter 2
Related Work
In this section we will describe the related work; in the Section 3.1 we present the dataset and a survey
of resources that we will use; in Section 3.2 we present the difficulties and the existing work on senti-
ment classification; and finally in Section 3.3 we mention papers on capturing emotional expressions in
MOOCs and the role of sentiment analysis in emotion detection.
2.1 Useful Resources
For the implementation of this thesis were provided useful resources that include several types of lexi-
cons and a dataset containing information from discussions forums.
2.1.1 Coursera Discussion Forums
For this work a dataset containing threads from forums of 60 different courses of Coursera 1 was thought-
fully facilitated by Lorenzo Rossi who worked on it for a paper, Rossi and Gnawali [45]. For his paper,
the author studied these forums and captured data that gives insight about the basic data of the courses
(name, id, duration, number of users and threads, etc); threads and subforums (course and thread ids,
name of the forums, etc); and data about the posts (posts, threads and courses ids, the author and their
type, number of votes, etc).
2.1.2 EmotiWorld
EmotiWorld2 is a lexicon conceived only with emoticons. Usually each emoticon represents an emotion
state and consist in using several characters and symbols, like punctuation, to draw in most cases, a
representation of a facial expression, like a smile (:)) or a grin (:D). EmotiWorld contains a database with
emoticons to express and represent states such as happiness, sadness, surprise, confusion among
others. In discussions forums these emoticons are largely used and to address them the EmotiWorld
could be useful.1https://www.coursera.org/2http://en.emotiworld.com/
3

2.1.3 Linguistic Inquiry and Word Count
Other available resource is the Linguistic Inquiry and Word Count (LIWC), (James W. Pennebaker and
Francis [15]). It is a text analysis software that, based on the lexicon LIWC2007 dictionary, calculates
how many times a word category is used across a wide array of texts such as speeches, emails, etc.
This dictionary contains around 4500 words and stems individually representing one or more word
categories or subdictionaries. These categories will have their scores incremented when each of their
respective words were found in text. For example, the word ‘cried’ is represented by 5 word categories:
sadness, negative emotion, overall affect, verb and past tense verb, meaning that each of these cate-
gories will have their scores incremented when the word cried were found in text.
2.1.4 WordNet and WordNet-Affect
WordNet is an available online lexicon developed by Miller [29] which organize in synsets several English
words, adjectives, verbs and adverbs related with the same lexical concepts. The WordNet-Affect Valitutti
[53] is an extension of WordNet referring to affective concepts. The synsets of WordNet containing
emotional words that express emotional states, moods or responses are selected and labeled to suitably
represent affective concepts. For example, the word joy, is associated with a positive emotion, and
amusement and contentment are two of the several words that are in the same synset of joy.
2.1.5 SentiWordNet
In their work Esuli and Sebastiani [10] describe another resource for opinion mining, named SentiWord-
Net. SentiWordNet also makes use of the WordNet synsets and allocate to each of their terms, one of
three possible labels: objective, positive or negative. Also it quantifies the association of these labels
with the synsets through a numerical score ranged between 0.0 and 1.0.
These scores are determined through a combination of eight classifiers that are trained in different
training sets, thus providing different results, and the agreement about a score assignment is made
proportionally according to the classifiers that have assigned it.
2.1.6 SenticNet
SenticNet developed by Cambria et al. [4] is a public available opinion mining resource containing
the most common used concepts associated with polarities, and their respective scores regarding the
strength of its positivity and negativity. In contrast with SentiWordNet it does not contain words with
neutral polarity being them eliminated when their scores are neutral. Also, it takes into account not only
polarities at a syntactical level but also in a semantic level being able to attribute polarities at concepts
such ‘accomplish goal’ or ‘bad feeling’.
4

2.1.7 Sentiful
Another useful resource available was described in Neviarouskaya et al. [36], Sentiful is a sentiment
lexicon that automatically assigns sentiment scores to terms, with the peculiarity of being able to classify
terms which are not present in the lexicon database.
In this process of classification is explored the relation of the terms with their synonyms, antonyms
and hyperonyms, and also, their derivations and compositions, to find and score these non-existent
terms. Examples of each relations are shown below.
• Synonym: pride | congratulations.
• Antonym: falsehood | truth.
• Hyponym: success | winning.
• Derivation: honest | dishonest, honestly, etc...
• Composition: risk and free | risk-free.
2.1.8 AFINN
The AFINN, Nielsen [37], is an affective lexicon labeled by Finn Arup Nielsen containing a list of 2477
English words and phrases along with its valence from a range between -5 and 5, with the particularity
of including obscene words.
This lexicon has the particularity of taking into consideration Internet slang acronyms, like “LOL",
“WTF" or “LMAO" which are also scored regarding its sentiment strength and can be useful when work-
ing with short informal texts like microblogs or forums.
This lexicon started with a version of 1468 different words (AFINN-96) and then updated to a version
containing 2477 words (AFINN-111).
2.1.9 SentiStrength
SentiStrength (Thelwall et al. [52]) is an algorithm developed for sentiment detection focused in user
behavior. It extracts the sentiment strength from English texts contemplating the spelling styles of cy-
berspace. The SentiStrength predicts the sentiment strength of texts in a range of [-5,-1] for negative
emotions and [1,5] for the positive ones, differing from other different sentiment detection algorithms by
mixing both positive and negative emotions. In this way a written text can possess both positive and
negative scores which according to a psychological study it is how we process emotions.
This algorithm started to be developed exploring a corpus of from 2600 MySpace comments and
resorts to a machine learning approach to enhance the sentiment weights of the terms.
5
2.1.10 Merged Lexicon: WordNet-Affect + SenticNet
To enhance the capabilities of the actual lexicons such as WordNet-Affect, Poria et al. [40] provided a
weighted in-depth lexicon to be used in sentiment analysis as a more resourceful alternative of the exis-
tent emotion lexicons. Their work offer a methodology that combines two frequently used lexicons, the
already mentioned WordNet-Affect and SenticNet, and merge them to greatly increase the knowledge
and performance in affect classification, offering the largest emotion lexicon. As previously said, Sentic-
Net provide values for sentiment words accordingly with their polarity, positive or negative. Nevertheless
it cannot offer detailed information about specific emotions. WordNet-Affect relate the word polarities
quantified in SenticNet labeling them with more appropriate and different concepts such as the words
‘angered’ and ‘infuriated’ that have the same label.
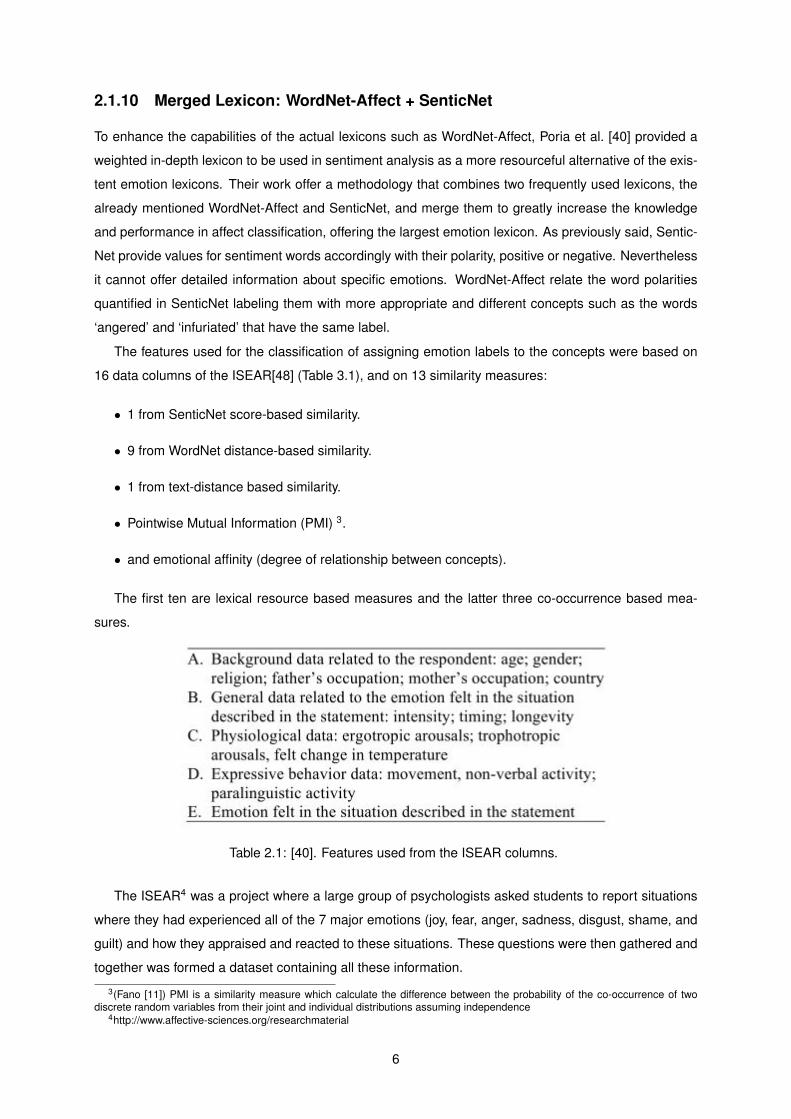
The features used for the classification of assigning emotion labels to the concepts were based on
16 data columns of the ISEAR[48] (Table 3.1), and on 13 similarity measures:
• 1 from SenticNet score-based similarity.
• 9 from WordNet distance-based similarity.
• 1 from text-distance based similarity.
• Pointwise Mutual Information (PMI) 3.
• and emotional affinity (degree of relationship between concepts).
The first ten are lexical resource based measures and the latter three co-occurrence based mea-
sures.
Table 2.1: [40]. Features used from the ISEAR columns.
The ISEAR4 was a project where a large group of psychologists asked students to report situations
where they had experienced all of the 7 major emotions (joy, fear, anger, sadness, disgust, shame, and
guilt) and how they appraised and reacted to these situations. These questions were then gathered and
together was formed a dataset containing all these information.
3(Fano [11]) PMI is a similarity measure which calculate the difference between the probability of the co-occurrence of twodiscrete random variables from their joint and individual distributions assuming independence
4http://www.affective-sciences.org/researchmaterial
6

For the ISEAR data-based features, in the data columns of Table 3.1, each column value corre-
sponded to a feature (treated as a categorical feature), for example, in the column ‘country’ which con-
tained 16 numerical codes (each representing a country) were selected 16 features. This was made for
all the columns except in the age column which was divided in three categorical features representing
the intervals established (18-23 years, 23-28 and older than 28). In total, 100 categorical features were
selected.
These features were then applied as dimensions for a feature vector being term frequency used
to count the occurrences of each value. Concerning the case of the example above, if there was 5
occurrences of a country code 1, and 3 occurrences of country code 2, the feature vector would be (...,
5, 3, ...).
Regarding similarity measures, in SenticNet-based similarity, the similarity was given calculating the
inverse of the distance between the polarities of each SenticNet concept.
In WordNet distance-based similarity was used a WordNet package (WordNet::Similarity) (Pedersen
and Patwardhan [39]) for distance measurement between tokens. Some of the concepts of SenticNet
that were not found in WordNet-Affect had to be rephrased manually (concepts like ‘make mistake’
were reduced to ‘mistake’), or had their similarity, regarding other concepts, set to random values. The
similarity for each pair of WordNet concepts was calculated as the maximum similarity between all of the
first concepts in the pair and all of the second.
In ISEAR text distance-based similarity, the similarity was given calculating the inverse of the mini-
mum average distance between the concept tokens, according with their positional information.
For PMI and emotional affinity between two concepts, the similarity was defined by measuring the oc-
currence of both concepts in a sentence, but in the latter instead of sentences, was calculated regarding
the complete statement.
For classification purposes, it was assigned one emotion label for each concept present in the
WordNet-Affect lists. The classification was taken care by a Support Vector Machine (SVM)5 frame-
work using a library from the WEKA toolset (libsvm), Hall et al. [12].
For evaluation they used 10-fold cross validation6 to estimate the precision of the features combined.
It was observed that the use of both similarity measures and ISEAR features combined obtained better
results (85.12%) than using only the similarity measures (59.27%). Nevertheless word sense ambiguity
and the co-occurrence of related words in the same statement but in different sentences still offer some
problems.
5SVM (Cortes and Vapnik [6]) is a non-probabilistic classifier, associated with supervised learning algorithms, that consistsin a set of points which defines the separation plan between different classes. The major asset of this classifier is its capacity,of alongside with Kernel functions, handle non-linearly separable instances in a defined space transforming them into a highdimensional space, and thus become linearly separable.
6The k(10)-fold cross validation consist in splitting the dataset in k equal and mutual exclusive subsets, using one subset fortests and the other k-1 subsets to estimate the parameters and accuracy of the model. This process is used several times changingthe subset of test each time.[23]
7

2.2 General Sentiment Analysis
In this section, we will address the difficulties found when classifying emotional expressions and docu-
ments (Section 3.2.1). Also, we exposed a sentiment classification7 framework, in Section 3.2.2, which
present a sentiment classifier and the steps involved in the process of sentiment classification. Although
the work in this paper are made in a movie review dataset, this approach could be adapted and extended
to a discussion forum environment. In Section 3.2.3, we present an algorithm for sentiment classification
for small portions of text such as tweets or SMS. Finally, in Section 3.2.4, are presented two algorithms
for sentiment classification considering entire sentences.
2.2.1 Addressing the Difficulties of Sentiment Classification
Denis et al. [7] focused on the creation of a general purpose tool for sentimental analysis and emotion
detection, and how they could prevent the difficulties met on creating a sentiment analysis tool for emo-
tion detection. These problems, are usually associated with text mining and the emotion classification of
text, e.g.the different polarities that a word can have according with the context where the term is used.
The Difficulties of Sentiment Classification and Possible Solutions
This study addressed the potential problems that a general purpose tool could face and a set of al-
ternatives were discussed. One of the problems is the erroneous attribution of polarity to emotional
expressions. There are several situations where this problem can be found, such as negation, common
sense, points of view, etc. Different examples of these situations are shown in Table 3.2. For this re-
search, the datasets from SemEval-07 affective task with 1000 utterances and SemEval-13, containing
7500 utterances, were employed.
Denis et al. [7] revised some works and approaches to respond the complexity of these problems,
such as: the use of machine learning with an unsupervised approach which used PMI to assess the
differences in the valence of words in reviews; the use of annotations to label reviews to train classifiers
such as SVM; and the study of Conditional Random Fields (CRF) (Nakagawa et al. [35]) and autoen-
coders (learning networks that transform efficiently inputs into outputs with the least possible amount of
distortion Rumelhart et al. [46]), to assess sentimental analysis.
Also, this general purpose tool took into consideration three other different problems: domain depen-
dence, interoperability and multilinguality.
The first problem refers to the use of supervised machine learning and its dependence to the available
training sets. To solve this problem, the most appropriate approaches are the semi-supervised and
unsupervised machine learning, and hybrid methods. The interoperability problem is related with the lack
of consensus in emotional representation. W3C8 proposed a recommendation for these representations,
the EmotionML. The problem of the multilinguality is that most of the works and developments are made
7Sentiment classification focuses on the text classification of documents, through the categorization of the terms in thesedocuments according with association rules previously defined. Each category (e.g.positive or negative) corresponds to a distinctcollection with different labels which are assigned to their terms.
8http://www.w3.org/
8
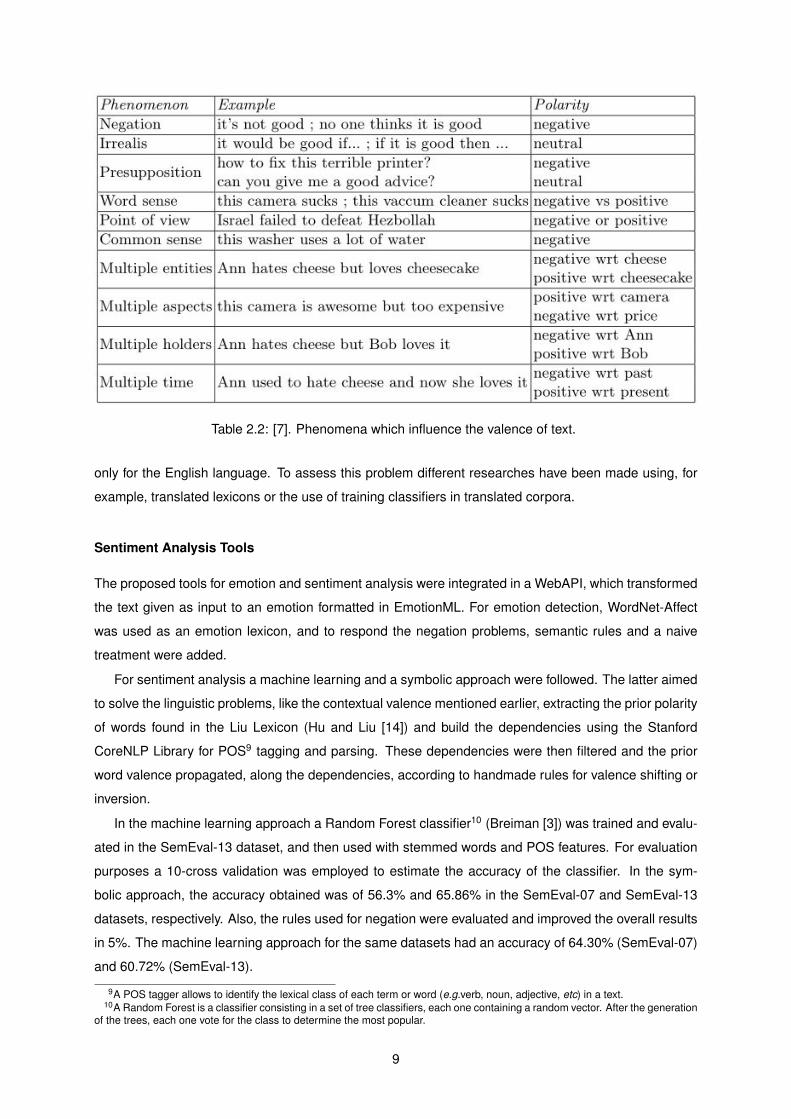
Table 2.2: [7]. Phenomena which influence the valence of text.
only for the English language. To assess this problem different researches have been made using, for
example, translated lexicons or the use of training classifiers in translated corpora.
Sentiment Analysis Tools
The proposed tools for emotion and sentiment analysis were integrated in a WebAPI, which transformed
the text given as input to an emotion formatted in EmotionML. For emotion detection, WordNet-Affect
was used as an emotion lexicon, and to respond the negation problems, semantic rules and a naive
treatment were added.
For sentiment analysis a machine learning and a symbolic approach were followed. The latter aimed
to solve the linguistic problems, like the contextual valence mentioned earlier, extracting the prior polarity
of words found in the Liu Lexicon (Hu and Liu [14]) and build the dependencies using the Stanford
CoreNLP Library for POS9 tagging and parsing. These dependencies were then filtered and the prior
word valence propagated, along the dependencies, according to handmade rules for valence shifting or
inversion.
In the machine learning approach a Random Forest classifier10 (Breiman [3]) was trained and evalu-
ated in the SemEval-13 dataset, and then used with stemmed words and POS features. For evaluation
purposes a 10-cross validation was employed to estimate the accuracy of the classifier. In the sym-
bolic approach, the accuracy obtained was of 56.3% and 65.86% in the SemEval-07 and SemEval-13
datasets, respectively. Also, the rules used for negation were evaluated and improved the overall results
in 5%. The machine learning approach for the same datasets had an accuracy of 64.30% (SemEval-07)
and 60.72% (SemEval-13).
9A POS tagger allows to identify the lexical class of each term or word (e.g.verb, noun, adjective, etc) in a text.10A Random Forest is a classifier consisting in a set of tree classifiers, each one containing a random vector. After the generation
of the trees, each one vote for the class to determine the most popular.
9

2.2.2 Methodology for Sentiment Classification in Textual Reviews
To enhance precision in document level classification, Mouthami et al. [33] proposed a new algorithm
called Sentiment Fuzzy Classification algorithm. This algorithm was conceived to classify textual re-
views, more precisely a movie reviews dataset, in order to better represent the ambiguity of sentiments.
For this research, the dataset with positive and negative reviews of the Cornell movie-review corpora11
were adopted, with a limit of 20 posts for each reviewer.
In this method fuzzy set theory and POS tagging were applied. Fuzzy set theory Lowen [25] al-
lows elements of a set to have a gradual degree of membership (values between the interval of [0,1])
contrasting with bivalent condition where an element either belongs to a set or not.
Figure 2.1: [33]. Steps for sentiment classification.
The figure 3.1 illustrate the steps and techniques of the sentiment classification proposed in this
work. In the text pre-processing step, the author used a tokenizer to parse the documents into tokens,
and a stop word removal, which eliminated stop words (e.g. “a”, “of”, “the”, “it”) from a stop word list, as
they do not had any meaning and offered no support.
In the transformation process, the sum of the terms’ weights of each sentence were calculated to de-
termine their score. These weights were computed by tf.idf12 taking into account the previously extracted
POS tagged adjective words.
For the feature selection step, were chosen the frequent words and identified their polarities. Then,
they were grouped to increase the probability of the document to be part of the correct category (ac-
cordingly with its polarity).
In the Sentimental Fuzzy Classification process, sentiment classes were redefined by a function
11http://www.cs.cornell.edu/people/pabo/movie-review-data/.12The tf.idf (Manning et al. [27]) is weighting measure that takes into account the number of occurrences of a term in a document
or text considering its rarity across the whole corpus.
10

into three fuzzy sets (positive, negative or neutral). This function made use of the documents opinions
weights previously calculated through tf.idf.
The measures accuracy, precision, recall and F-measure were used in the evaluation process. Nev-
ertheless no results were shown neither comparisons with other algorithms.
2.2.3 Sentiment Classification Algorithm
From time to time, a Conference on Semantic Evaluation Exercises (mostly known as SemEval) is
organized, focusing on semantic analysis and scrutiny of natural language used in computation. In
these events, several competitions are hold where teams compete to develop the best project related
with this area of expertise. In one of these conferences (SemEval-2013), a team (NRC-Canada) formed
by Mohammad et al. [32] developed two classifiers to detect emotions on both message-level and term-
level tasks. Two SVM for sentiment detection (positive, negative or neutral) were created, one for tweets
and SMS and other for terms within a message. For this research, two lexicons were developed as well
as semantic and sentimental features. The results of the algorithms were good, being ranked in first on
both classifiers.
For this competition two datasets were provided by the organization, one for tweets with labels re-
garding the sentiment and divided in sets for training, development and testing, and one for SMS where
the total of messages were used for testing (no training or developments sets used). Table 3.3 shows
the distribution of data throughout both datasets.
Table 2.3: [32]. Dataset used for SemEval-13 with the distribution of tweets and SMS.
Sentiment lexicons were created using other established lexicons like NRC Emotion Lexicon (Mo-
hammad and Turney [30], Mohammad and Yang [31]), Multi-Perspective Question Answering (MPQA)
Lexicon (Wilson et al. [55]) and Bing Liu Lexicon (Hu and Liu [14]). The add-ons made to these new lex-
11

icon included hashtag sentiment polarity detection, being the hashtags from tweets extracted and ana-
lyzed. The previous mentioned PMI was used to calculate the score of a term regarding their association
with positive (or negative) sentiments. Also, different pairs of unigrams, bi-grams, and a combination of
both were generated and some punctuation removed. The second lexicon was created using the same
methodology but dedicated to sentiment emoticons instead of hashtags.
SVM was applied for sentiment detection in messages. The tweets were normalized, tokenized and
POS tagged. Each tweet had a feature vector containing the features: word n-grams and character n-
grams, the number of words written all in caps, the number of ocurrences of each POS tag, the number
of hashtags, lexicons, punctuation, emoticons, elongated words, clusters and negations.
SVM was also used with a linear kernel for the automatic sentiment detection of terms in a message,
and the features applied in this classification were: word and character n-grams, elongated words and
punctuation if were present, emoticons, upper case, stopwords, lenghts, negation, position of the term
(beggining, end, or another position), sentiment lexicons, term splitting, and others (if a term contained
an user name or an URL).
For evaluation purposes, the classifiers were applied to training, development and testing sets and
measured by F-score, obtaining the results of 69.02 and 88.93 in the message-level and term-level
tasks, respectively.
2.2.4 Sentence Oriented Classifiers
Joint Segmentation and Classification Framework
With the purpose of obtaining better results in sentiment classification, Tang et al. [51] conceived a JSC
where the sentence segmentation and the sentence sentiment classification processes were made at
the same time, upgrading the segmentator with better sentiment results and the classifier with more
reliable segments.
In this study, was proposed a framework to analyze the documents and statements as sentences
instead of word by word, making possible to catch expressions with inconsistent polarities, e.g.“not bad”
or “a great deal of” that would be wrongly classified.
This method has an advantage over pipeline methods considering that is unaffected by error prop-
agation. Pipeline methods of sentiment classification are a two-step method that performs sentence
segmentation, through techniques such as “bag-of-words” followed by feature learning and sentiment
classification with the segments retrieved from the previous segmentation. However, these methods
can be affected by error propagation because the segmentation and the classifications are not made
simultaneously.
This framework uses a log-linear model for scoring purposes and a marginal log-likelihood13 (Harris
and Stöcker [13]) for updates. The former scores each segment of a sentence and the latter is used for
optimization, taking into account the segments. Both are applied simultaneously, forming a joint model
and used for sentiment classification based (only) in the sentiment polarity of the sentences.
13Statistical function that simplifies the calculation of the maximum likelihood, estimating unknown parameters for given statistical
12
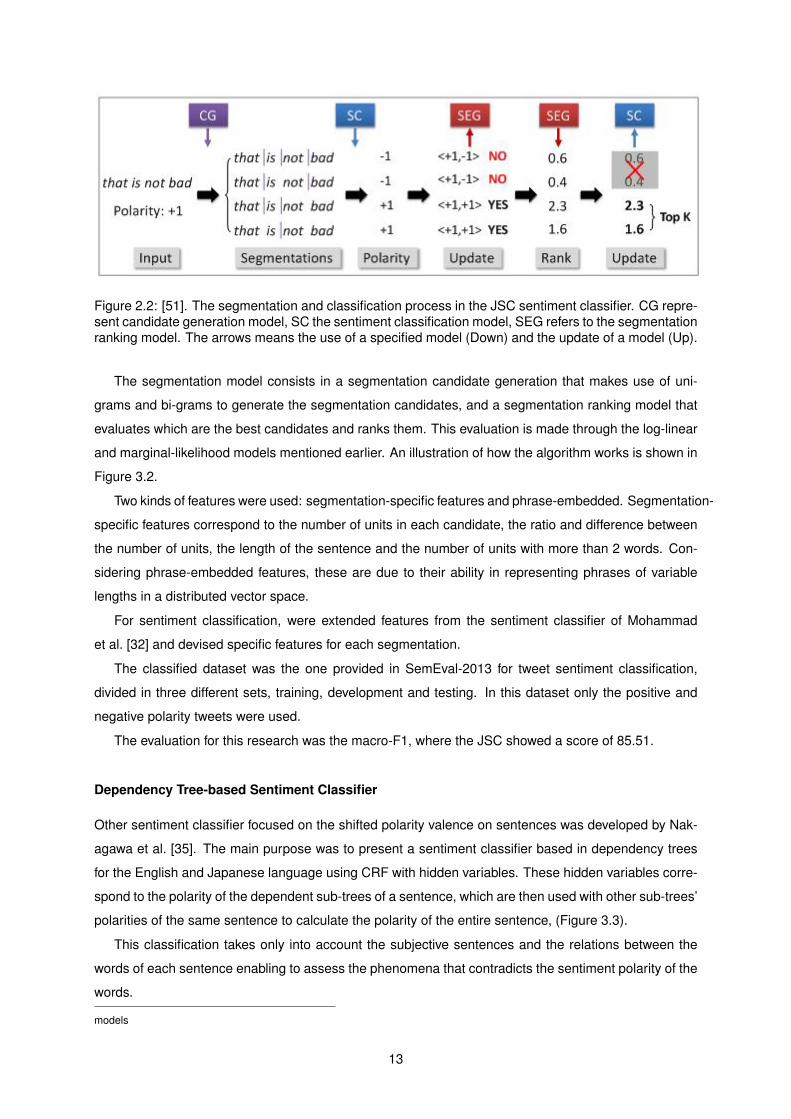
Figure 2.2: [51]. The segmentation and classification process in the JSC sentiment classifier. CG repre-sent candidate generation model, SC the sentiment classification model, SEG refers to the segmentationranking model. The arrows means the use of a specified model (Down) and the update of a model (Up).
The segmentation model consists in a segmentation candidate generation that makes use of uni-
grams and bi-grams to generate the segmentation candidates, and a segmentation ranking model that
evaluates which are the best candidates and ranks them. This evaluation is made through the log-linear
and marginal-likelihood models mentioned earlier. An illustration of how the algorithm works is shown in
Figure 3.2.
Two kinds of features were used: segmentation-specific features and phrase-embedded. Segmentation-
specific features correspond to the number of units in each candidate, the ratio and difference between
the number of units, the length of the sentence and the number of units with more than 2 words. Con-
sidering phrase-embedded features, these are due to their ability in representing phrases of variable
lengths in a distributed vector space.
For sentiment classification, were extended features from the sentiment classifier of Mohammad
et al. [32] and devised specific features for each segmentation.
The classified dataset was the one provided in SemEval-2013 for tweet sentiment classification,
divided in three different sets, training, development and testing. In this dataset only the positive and
negative polarity tweets were used.
The evaluation for this research was the macro-F1, where the JSC showed a score of 85.51.
Dependency Tree-based Sentiment Classifier
Other sentiment classifier focused on the shifted polarity valence on sentences was developed by Nak-
agawa et al. [35]. The main purpose was to present a sentiment classifier based in dependency trees
for the English and Japanese language using CRF with hidden variables. These hidden variables corre-
spond to the polarity of the dependent sub-trees of a sentence, which are then used with other sub-trees’
polarities of the same sentence to calculate the polarity of the entire sentence, (Figure 3.3).
This classification takes only into account the subjective sentences and the relations between the
words of each sentence enabling to assess the phenomena that contradicts the sentiment polarity of the
words.
models
13

Figure 2.3: [35]. Dependency subtrees polarities. Each subtree contains its respective polarity accordingtheir terms.
This research addresses a sentiment classifier that enables the treatment of sentences with polarity
contradictions, e.g. “The medicine kill cancer cells”, where, despite of the words found and classified
alone have negative polarity, the complete sentence has positive polarity because the word “kill” negates
the polarity of the words “cancer cells”. This method was called Dependency Tree-based Sentiment
Classification and uses CRF and hidden values. This approach, unlike other methods that use bag-of-
features, takes into account the syntactic structure of the sentences.
For sentiment classification were used a probabilistic model (Figure 3.4). In this model, each phrase
in the sentence contained a random value with the polarity of the dependency sub-tree. These sentiment
polarities were calculated applying a joint probability distribution14 using log-linear models (Knoke and
Burke [22]).
Each sentence has associated a root node, corresponding to the correct sentiment polarity of a
sentence, and is the only value that is labeled in the annotating process. This value is calculated through
the sum of all possible combinations of hidden values of the same sentence, using a sum-product belief
propagation (to calculate the marginal distributions of the nodes) (MacKay [26]).
Figure 2.4: [35]. Probabilistic Model based on Dependency Tree. The node s2 is the head modifier,which shift the polarity of the sentence and consequently gives the polarity of the root node.
As features, were used node and edge features: in node features, was only considered the nodes
of a sentence individually, and in edge features the nodes and their head modifiers (when two phrases
have opposite polarities, the head is the phrase which reverse sentiment polarity).
As features were used combinations of the following:
14The distribution of numerous random variables defined in the same probability space (Prohorov et al. [41])
14

• The hidden variable representing the polarity of the dependency subtree whose root node in the
phrase.
• The prior polarity of the phrase.
• The polarity reversal of the phrase.
• The number of words in the phrase.
• The surface and base form.
• Coarse-grained POS and fine-grained POS tags of a word in the phrase.
JUMAN (User-Extensible Morphological Analyzer for Japanese) and KNP15 (Japanese Dependency
and Case Structure Analyzer) were used for morphological analysis and processiing of Japanese data.
For English data, the POS tagger MX-POST (Ratnaparkhi [43]) and the MaltParser16, which like KNP is
a dependency parser.
In addiction, were used different dictionaries1718 of sentiment polarity for both languages experi-
ments.
The data used in this study consisted in eight corpora for sentiment classification, four for each
language (English and Japanese). The four corpora used for Japanese classification are the Polarity-
tagged corpus (ACP) (Kaji and Kitsuregawa [17]), the Kyoto University and NTT Blog corpus (KNB)19,
the NTCIR Japanese opinion corpus (NTC-J) (combined the NTCIR-6 and NTCIR-7 corpus) (Seki et al.
[49], Seki et al. [50]), and the 50 Topics Evaluative Information corpus (Nakagawa et al. [34]). For
the English classification the authors used the Customer Review data (CR)20, the MPQA21, the Movie
Review Data (MR)22, and the NTCIR English opinion corpus (NTC-E) (combining NTCIR-6 and 7) (Seki
et al. [49], Seki et al. [50]).
For evaluation purposes, the authors conducted a 10-fold cross validation and the accuracy was then
estimated. The algorithm were compared with other 6 baseline methods and obtained the best results in
all Japanese and English corpora with accuracies of 0.846 (Automatically Constructed Polarity-tagged
corpus), 0.847 (Kyoto University and NTT Blog Corpus), 0.826 (NTCIR-Japanese opinion corpus) and
0.841 (50 topics Evaluative Information Corpus) for the Japanese corpora and 0.814 (Customer Review),
0.861 (MPQA), 0.773 (Movie Review Data) and 0.804 (NTCIR-English Opinion corpus) for the English
corpora.
15http://nlp.kuee.kyoto-u.ac.jp/nl-resource/16http://maltparser.org/17http://cl.naist.jp/ inui/research/EM/sentiment-lexicon.html18http://www.cs.pitt.edu/mpqa/19http://nlp.kuee.kyoto-u.ac.jp/kuntt/20http://www.cs.uic.edu/liub/FBS/sentiment-analysis.html21http://www.cs.pitt.edu/mpqa/22http://www.cs.cornell.edu/People/pabo/movie-review-data/
15

2.3 Sentiment Analysis in MOOCs and Forums
In this section, we will expose works focused on determining which sentiments are usually present in
MOOCs discussion forums, and how these sentiments can be captured, (Section 3.3.1). In Section
3.3.2, we will mention a method that could be used to quantify the user attention on any forum using
sentiment analysis, and methods for emotion detection in learning experiments (Section 3.3.3).
2.3.1 Detecting Emotional Expressions in MOOCs
To provide instructors with enhanced information to assess their students regarding performance and
discussion outcomes based on interactions in online Question and Answer (Q&A) Kim et al. [19] in their
research determined information based in students’ affect. 1030 student posts were analyzed in 210
threads from a Q&A board of an Operating Systems course and presented a set of emotion acts used
by students in a computer science class, like frustration or certainty. It also covered the identification of
affect categories, their frequency in the corpus by different measures (e.g. gender, types of participants),
the influence in instructors’ feedback, the correlation between them in thread resolution and how it can
be used to predict discussion outcomes.
Four different emotion roles categories were established - (high and low) certainty, frustration, tension
and politeness. Examples of expressions of these categories are shown in Table 3.4.
Cohen’s kappa coefficient was used as inter-annotator agreement and 322 messages in 30 threads
were assessed for this purpose. These annotators allowed to assess the affect frequency by type of
participants, allowing to determine, for example, which gender seemed less frustrated or polite, and the
influence of instructors’ feedback. It was also developed an heuristic with the purpose of classifying
threads based on the resolution of threads. Thus, it was possible to determine which students are in
need of help.
Regarding automatic classification of emotion acts, the text in annotated threads were pre-processed,
removing common typos, transforming all words to formal words and some expressions into keywords
replacing, for example, contractions like ‘You’re’ into ‘You are’.
As features were used:
• Expressions and their position in the posts (using n-grams).
• The message position in the thread.
• The emotion acts in the previous message.
• The class of the authors (student or instructor).
• The poster changes.
• The length of the posts.
16

Table 2.4: [19]. Examples of the different categories of affect
17

Table 2.5: [19]. Test results of the automatic classification of the affect.
The selection of the features and the feature space was established using Information Gain23 (Quin-
lan [42]). SVM were also used as well as a 5-fold cross validation and a kernel function Radial Basis
Function (RBF)24.
The final classification was evaluated by precision, recall and F-score measures. The obtained re-
sults show that the classification of the emotion acts are possible (Table 3.5), but need more annotated
data available to be applied in a functional setting.
Also, Yoo and Kim [56] developed an application of online discussion analysis to answer this prob-
lem of capturing difficult expressions in forums. This application also focus on gathering participants’
information (questions and answers) and determine their emotions, like frustration or tension, and the
degree of certainty, being able to classify students and make predictions about which students’ are in
need of monitoring.
In their study, a set of emotion roles were defined. Message role classifiers were presented, which
use natural language processing and machine learning techniques to find emotion and informational
roles through the use of the generated message and thread-level features. The message features
captures emoticons and n-grams in the message and the thread level features use the position of the
message. The classified dialogue role information was used to analyze the discussion patterns and to
determine the performance of each student.
For the message-level features, in order to capture expressions containing more than one word
(e.g.do not, still do not) were used diferent sizes of n-grams with two (bigrams) and three (trigram)
terms.
The data used for the study was made available by the Computer Science department, University of
Southern California, and consisted on data collected from 8 semesters with 5056 messages and 1532
threads from 370 participants in the course of Operating Systems.
To determine the emotions, different categories were examined based in the same three different
selection criteria as used in Kim et al. [19] research. As a result, four different emotion roles categories
- (high and low) certainty, frustration and tension - and two informational roles categories - source and
sink (Table 3.6) - were established.
Affect expressions in students’ posts were identified and annotated. For this annotation process, due
to misspellings, grammar issues, syntactical errors and/or other irregularities in the message contents,
there was a great amount of effort for the selection of annotators and Cohen’s Kappa values were used
to reach an agreement between two annotators.
23The amount of information gained (reduction of entropy) before and after the application of the features24A function whose value only depends on the distance to their origin, or the center of another point
18

Table 2.6: [56]. Examples of Sink and Source
Because natural language makes use of a vast set of expressions, e.g. sarcasm or rhetorical ques-
tions, it was necessary to define a set of rules for data processing for automated message role classifi-
cation. This way, messages were converted into keywords, becoming coherent, for example, ‘yea’ and
‘yup’ were converted to ‘yes’. Annotators were used to generate two kinds of features: message-level
(to capture standard N-grams and emoticons from the message content), and thread-level (to author
changes, position of the message and user roles). To eliminate any irrelevant and redundant information
were used Information Gain scores.
To distinguish which questions were resolved, emotional expressions were explored as well as the
position of the messages. Annotated data from the dataset threads were analyzed and difficult ex-
pressions were measured taking into account the position of the message. This analysis showed that
frustration are usually present in top messages (first replies of the initial post), but this value tended to
increase in the unresolved ones. Tension and low certainty could be found mostly in the bottom mes-
sages (last replies of the initial post), but they were more usual in the unresolved ones. High certainty
could be found more in the bottom than low certainty but even lower in the resolved messages. Also the
sinks were naturally used in the top position and source in the bottom.
It was used a predictive model to verify if the length of threads were somehow related with emotional
and information roles, and it was concluded that frustration was positively correlated with the length of
the threads and when they had more participants. Also, high certainty threads tended to be shorter,
being negatively correlated with the thread length.
Through this study it was predicted that students with low performance usually asked questions
more frequently and the ones who answered with high certainty were related with students with better
performances. Tension was also positively correlated with higher grades. It showed that the increase of
frustration was also related with lower grades.
To prevent the dropouts and support the participation of students, it was estimated the behavior and
opinions of these students toward online courses. Wen et al. [54] in their study focused on the affect
expressed by the students in MOOCs discussion forums and how that affect interfere in the dropout rate
of the courses through the students’ opinions in relation to the courses. The author seeked to understand
if there was any correlation between the students’ engagement and course completion and, if so, offer
information to support the instructors encouraging participation.
For their analysis they used data from 3 different courses from Coursera.org: social sciences, litera-
ture and programming. The first comprehended 1146 active users with 5107 total posts during 53 days
(avg. 96 posts per day). The literature course had 771 active users with 6520 posts during 43 days (avg.
152 posts per day) and the latter was frequented by 3590 active users with 24963 posts during 49 days
19

(avg. 510 posts per day).
In the range of online courses topic, positive and negative sentiment words were extracted in students
opinions related with the topic, and survival analysis25 were used to determine how students’ sentiment
predict their continuation in the course. Survival analysis measured the dropout of students by studying
the sentiments expressed by each student in each week and assess if these sentiments were somehow
correlated with their dropout.
To determine the keywords for each topic and identify clusters of words from related contexts it
was used a distributional similarity technique called Brown clustering26 which based in the results ob-
tained and with some human interaction (selecting some keywords) created keyword lists for each topic
(Course, Lecture, Assignment or Peer-assessment).
The positive and negative sentiment words were ranked by the PMI between the word and the topic
keyword. These positive and negative sentiment words were established previously and estimated
through the topic sentiment ratio. This value was smoothed over time with smoothing techniques to
offer a steadier signal. To understand the relation between affect expressions of students in their posts
and the dropout rates, survival analysis was applied.
In this analysis was measured the positivity and negativity of the user’s posts each week, as well as
the average positively and negativity of students’ exposure. The results of the survival analysis showed
that these measures could not be consistent and they vary from each course. As example, the sentence
“The Death Gate Cycle was such a haunting story!" in the Fantasy course showed a high negativity
score of 0.23, but in a Fantasy course these kind of expressions are usual and can be referred to
positive scores, it all depends the context. In relation to the Python course, as it is a more problem-
solving course, large quantity of positive posts were posts expressing gratitude, whereas the negative
posts were related to the posting of problems.
2.3.2 Emotion Detection in E-Learning
Binali et al. [1] explored opinion mining techniques to build a conceptual framework for students’ emotion
detection in e-learning, and thus identify which students were struggling and in need of monitoring. The
data used for this conceptual solution was retrieved from students’ weekly reviews about their partici-
pation and commitment in the course. These reviews were posted every week in each student online
journal and used at the end of the semester to make their self-evaluation regarding participation and
level of commitment.
According to this research, the states of confusion, frustration, boredom, flow/engagement and inter-
est were those that were more associated with the learning process, hence need the intervention of an
instructor (in this paper an AutoTutor) to motivate and enhance self-confidence in students before their
dropout or complete disinterest.
Some of the e-learners reported confusion, anxiety, distress and/or frustration, which were often
25Survival analysis, (Kleinbaum [21]) is a statistical technique that focus on the analysis of events regarding their time duration.26The Brown clustering is a distributional similarity technique which identifies finer grained clusters of words based on their
contexts and groups them in classes.
20

associated with unclear course objectives and communication. This situation was assumed owing to the
discrepancy in learning criterion between digital natives (people born in digital era) and digital immigrants
(people adapted to digital era).
Some of the techniques or theories mentioned in this study, such as appraisal theory, play an im-
portant role in the development of sentiment analysis. In appraisal theory words are treated as attribute
groups, and is commonly used to identify semantic orientation. This theory usually benefits with the
employment of “bag-of-words”, which selects the frequent used words in a document to be weighted for
classification. These words are classified as being ‘good’ or ‘bad’ and grouped accordingly.
Other important technique that was used for feature identification was statistical schema matching.
This technique was used to find and group features of reviews. In order to label words and find those
that were emotional, were used annotations along annotation rules.
The primary focus of their conceptual solution was to improve the detection of emotions in e-learning
systems, with the help of opinion mining techniques. The conceptual solution proposed in this research
assessed opinion mining in students’ information using General Text and Language Engineering In-
frastructure (GATE) which is a tool that was developed to perform language processing and can make
annotations on text and quantitative analysis. It contains a word splitter, a tokenizer, a gazetteer and a
POS tagger.
It was conceived an implementation of a NLP system based on emotion detection theory and opinion
mining research, focusing on lexical analysis and annotations. These techniques will work on data
previously collected from students’ posts and the results will be available through graphs and emoticons.
To improve the learning experience of students, Kim and Calvo [20], took 3353 students’ responses
from 909 textual open-ended questionnaires as Unit of Study Evaluation (USE)27 or Students Evalua-
tions of Teaching (SET)[28], and automatically extracted the sentiment polarity of these responses to
assess the usefulness of sentiment analysis in the study of textual responses. Another goal they aimed
with their research was to compare and present two emotion prediction models and their strengths: the
categorical and dimensional models. These emotion models are employed to represent emotions and
explore methods to estimate the emotional states of a person.
While the categorical model correspond to the handmade selection of the best suited and repre-
sentative emotional state from an existing set of emotions categories, the Ekman’s basic emotions (joy,
anger, disgust, fear, sadness and surprise), the dimensional model corresponds to the estimation of
rating scales of each dimension, such as the degree of valence (positive vs negative emotions), arousal
(excited vs calm state) and dominance (feel in control state).
For categorical classification was employed the lexical repository WordNet-Affect along with the
Vector Space Model (VSM) (Salton et al. [47]), which represent documents by vectors in a k-dimensional
space, and their relevance was measured according their weights, calculated using tf.idf.
This technique made possible to represent all the contextual information of the documents with vec-
tors which were used along with a cosine angle similarity measure to calculate the emotion expressed by
27http://www.itl.usyd.edu.au/use/about.cfm
21

each sentence. After that Latent Semantic Analysis (LSA)28 and Negative Matrix Factorization (NMF)29
were used to reduce the dimensions of VSM.
For dimensional estimation were used a set of normative emotional ratings for collections of words
called ANEW. ANEW provides the degree of valence, arousal and dominance for each word by means
of the Self Assessment Manikin (SAM) (Bradley and Lang [2]) which is a technique for dimension (i.e.
valence, arousal, dominance) measurement based in non-verbal pictures. Each emotion position is
calculated with recourse to the use of WordNet-Affect, and if the centroid of an input sentence were
close to an emotion the sentence were tagged to that emotion.
For evaluation, were implemented in Matlab five approaches: a categorical model, Majority Class
Baseline (MCB)30, Keyword Spotting (KWS)31, LSA-based categorical classification (CLSA), NMF-based
categorical classification (CNMF) and Dimension-based Estimation (DIM). Also, it was removed stop
words and were used stemming. The results of these algorithms were assessed through precision,
recall and F-measure.
In the end, at sentiment identification of positive sentiments, MCB and CNMF showed better results
in recall and F-measure and DIM in precision, while in the negative sentiments DIM offered better re-
sults. In neutral sentiments KWS showed better results in recall and F-measure and CNMF in precision.
Regarding sentiment recognition NMF-based categorical and dimensional models showed better results.
2.3.3 Sentiment Analysis for Online Forums Hotspot Detection
With the increase of information made available by users on the web, such as reviews and forums,
many companies started to assess and make use of this knowledge to improve their business. Several
techniques of data mining and natural language processing started to be developed in order to answer
this search for knowledge.
In Devi and Bhaskaran [8] were employed sentiment analysis on text data of forums to discern online
hotspot forums. In this work, were extracted opinion words, such as ‘great’ or ‘bad’ which indicate
positive or negative opinions with the assistance of machine learning techniques for classification.
In this work, data from 37 forums and 1616 threads, gathered between January to October of 2011
(after cleaned and formatted) of the website forums.digitalpoint.com was studied.
First it was extracted from each forum of the dataset (after the elimination of irrelevant data) thread’s
related features, e.g. average number of replies for each thread and number of threads. For each thread,
its replies were parsed into keywords and evaluated by an algorithm called SentiStrengh (tool for text
sentiment analysis that estimate the strength of positive and negative sentiment in small pieces of text)
which assigned a sentiment value to each one. Together, the sum of all of these sentiment values gave
the sentiment value of the respective threads.
28LSA is a method to extract and represent the contextual meaning of words in a large corpus of text through statistical compu-tations. Landauer et al. [24].
29According jen Lin [16], NMF is an algorithm for semantic analysis (among other multivariate analysis) that given a non-negative matrix, finds non-negative factors that are reduced-dimensional matrices, which when multiplied can reconstruct theoriginal matrix. This technique is suited for handling text data that require non-negative contraints using the columns of one of thereduced-dimensional matrices to classify the sentences.
30MCB, a classifier that assigns all data points to the most frequent represented class in the training set31KWS is an approach that counts the presence of affect words (extracted from WordNet-Affect)
22

Table 2.7: [8]. Results of the classification algorithms[8]
A k-means clustering algorithm32 was then applied, being each forum represented as a datapoint
in the vector space. During the feature extraction the forums along with their emotional polarity, rep-
resented in a vector, were given as input to the algorithm do determine the hotspot and non-hotspot
forums.
For forum classification, was used SVM, that received as input a forum representation vector, and
was applied at each time window, using the resulting k-means clusters of the prior time window, iteratively
classifying each forum as hotspot or non-hotspot. Results showed consistency with the k-means results.
This consistency was measured through the metrics: accuracy, sensitivity, specificity and positive and
negative predictive value.
The results were then compared with other classification algorithms assessing their accuracy through
the same time windows used in the SVM classification process. These results showed that SVM had
slight better results in more time windows than the other algorithms, as shown in Table 3.7.
32K-means (Kanungo et al. [18]) is a partition algorithm, which means it organizes objects of a database into k partitions(clusters). These clusters are then used to optimize the clustering criteria, like similarity, to seize better results accordingly withour goals. It is a centroid-based technique where clusters are represented by a central vector.
23

24

Chapter 3
Distinguishing Students’ from
Instructors’ Posts in Education
Forums
As previously mentioned, this thesis targets the classification of forums’ posts in order to identify – either
students or instructors – based on the expressions they use. Thus, the main objective of this study was
to develop a model for classification, which together with all relevant information present in an online
course, such as the posts, comments and its authors type, would allow instructors to evaluate and
assess students and their questions more quickly and easily, offering at the same time useful knowledge
to other systems about the best features to use when trying to determine the type of the posts’ authors
using the vocabulary they employ in their posts.
The first task aim at classifying, using a set of features, which posts are more predictable to be part of
the category of instructors (Instructor ), and those who were more predictable to belong to the category
of students (Student). This classification process is tested using a set of different approaches, such as
the removal of stopwords and the use of stems in the dataset, and assessed which of these methods
offered better classification results.
In the following section we will describe the pre-processing phase (Section 3.1). Afterward, we
present the architecture of the proposed system (Section 3.2) followed by their implementation (Section
3.3). Next, the settings for evaluation of our task will be described (Section 3.4) and the results of the
different experiences noted in Section 3.5. Finally, these results are discussed in Section 3.6.
3.1 The Corpus of Education Forums
We adopted the dataset specified in Section 1.2 as the primary source of information containing all
the posts used in the implementation and development of our tasks. First, we conducted a series of
preprocessing tasks to format these data onto a set of posts proper to use.
25

This data was divided according with the different courses, some of them lectured in other languages
than English, and in the format of JavaScript Object Notation (JSON) (Figure 3.1). The non-English
courses were removed considering that they do not provide any benefit for the development of the
proposed tasks due to the content of the lexicon resources, which only had English vocabulary.
Figure 3.1: An excerpt of the data contained in our dataset (format JSON).
Although these courses have been removed, given the diversity of students of different nationalities
present in MOOCs, and their possibility on creating study groups between them, where they could
interact using their native language, several posts were still found written in other languages. These
posts were kept as result of the high cost of manually remove them.
Next, all of the data was converted into text files (one for each of the different courses) through a
JSON parser class that was employed and modified to extract and format in text form the posts and its
authors from the different courses of the dataset. Several types of authors have been found namely:
Student, Instructor, Coursera staff, CourseraStaff, Community TA, CommunityTA, Coursera Instructor
and CourseraInstructor. As result of applying the JSON parser class, a text file was created containing
all the required information in the format - Author: Post/Comment - at each line, like as showed in the
Figure 3.2. These files were encoded in UTF-8 and the Byte Order Mark (BOM) mode turned off to
ignore some unnecessary characters. Useless information for this work was eliminated, such as tags
containing the author name, the date of the post, etc.
Figure 3.2: Format of our data after extracting the author and respective post.
Once properly formatted, as some of the posts did not have information regarding the author (Figure
3.3) and contained some characters or information that did not offer any benefit to the development of
the tasks, such as mathematical functions, pieces of code or the printed outputs of the answers posted
by the students. To clean up and standardize the data as much as possible we implemented a function
that, through regular expressions, allows to eliminate this undesirable information (Figure 3.4).
Also, expressions were added to remove tags containing images, tabulations or other listing rules,
URL’s, e-mails, among others, as they do not offer any support to the tasks, (Figure 3.5 and Figure 3.6).
In addition to these, other expressions were combined for emoticons detection, starting by gathering a
list containing some of the most usual emoticons used in forums. This list was conceived by resorting the
website and “lexicon” EmotiWorld.com (Section 2.1.2) and the entry “List of Emoticons” from Wikipedia.
26

Figure 3.3: Posts containing no information regarding their author type.
Figure 3.4: The result of applying the regex removal function in an excerpt of posts.
The emoticons were then labeled and added to this class in the pre-processing step, thus modifying all
occurrences of emoticons by their respective concept.
Figure 3.5: Post before e-mail/URL expression removal..
Figure 3.6: Post after e-mail/URL expression removal..
After the analysis of the dataset and discover of mathematical functions and chunks of code present
in the data, we noticed that some expressions were frequently delimited by the characters “$$”, which
offered a pattern and allowed to replace these expressions by the term “(function)”, maintaining any
contextual information regarding a question or a doubt that a student could have, while simplifying and
cleaning irrelevant information (Figure 3.7 e 3.8).
Figure 3.7: Excerpt of a post containing a mathematical/code function before the regex transformation.
Figure 3.8: Excerpt of a post containing a mathematical/code function after the regex transformation.
Due to the large quantity of author types present in the dataset, and being most of them redundant,
27

an expression was added to normalize all types to only two: Student and Instructor. Other expressions
were also considered, namely the use of multiple and followed punctuation, like “??????????” or “;;;;;”,
which were replaced with just one punctuation mark (“?” or “;”).
With the structured posts, the focus turned to the elimination of line breaks in the written posts, which
were aggregated into unique lines, to have a well-defined format to be analyzed of one sentence or post
by line. This format was also necessary to ensure that the posts could be used in the classifier during
the classification process (Figure 3.9 e 3.10). To answer this question we implemented a function that
would aggregate the posts that did not contain an author label at the beginning of the line to the previous
post that had it.
Figure 3.9: Example of 2 posts before the execution of the line processing function.
Figure 3.10: Example of 2 posts after the execution of the line processing function.
With the implementation of a function for formatting the posts to a single line, the lines containing
the previous pieces of the posts began to be empty, which led to the development of another function to
remove these blank lines and get a more cleaned view (Figure 3.11).
Figure 3.11: Excerpt of the dataset without the blank lines.
We also developed a function to split the posts regarding their punctuation and the conventions used
in the United States English language. The label of the original post was then attached to the split posts,
resulting in a different line and consequently interpreted by the classifier as a distinct post. (Figure 3.12)
Finally, the processes of removing regular expressions and the subsequent cleaning of empty lines
were once again applied in order to correct any misconception following the modifications that were
made after the last time the process was ran.
3.2 Architecture
For this task, the goal was to determine, based on the dataset containing the posts and respective
authors, the best way to classify the data by identifying the author (student or instructor) of a post
28

Figure 3.12: The posts generated by the partition of 2 posts (Figure 1.9/10).
through its terms. After the pre-processed phase, the data was classified using a classifier along with a
set of features.
In order to reach the best outcome possible and optimize the capture of expressions that would
indicate if a post belong to an instructor or a student, the dataset was subjected to other different ap-
proaches, such as the removal of stopwords and the use of stems, to assess which of these experiences
could offer better results on identifying authored expressions.
The introduction of a stemmer was employed in the original dataset to allow the capture of more
terms and expressions reducing all terms to its root form and thus expand the number of equal terms
and expressions that before were written in different verbal forms.
Figure 3.13: A set of posts before the application of the stemmer.
Figure 3.14: The set of posts after the application of the stemmer.
All posts have their category recognized by the classifier which then, according with a set of features
applied on the posts, determine to which class the post belong according to its terms and the resulting
measures from this classification.
The major problem of this approach is that it only focus on the vocabulary used by the authors which
sometimes can cause some confusion. For example:
One can easily identify the authors of the posts written in Table 3.1 just by reading the posts due to
29

Figure 3.15: Architecture.
Table 3.1: Example of easy assessment posts.Instructor: We will discuss the polynomial example in module 3, upcoming next week.Student: Thanks a million for all the team members and staff who have contributed to this course.
the vocabulary used. For example, in the first post the terms “We will discuss" and “upcoming next week"
suggest that the author has some kind of control over what will be done and when. As the opposite,
in the second post, the term “Thanks" is usually found in students post, for example when a doubt or
question they had is answered.
Table 3.2: Example of posts that can cause confusion.Student: am very happy, this course has changed my daily teacher routines. felt in love with flipped classroom model.Instructor: I’ve learnt stuff.
Unlike the first two posts, these ones presented in Table 3.2 can cause some confusion when trying
to classify them without knowing their author. In the first post, the terms “my daily teacher routines"
suggest that the author of the post is a teacher although it does not belong to the set of instructors
that teach this course which can cause this post to be wrongly classified. The last example also bring
difficulties because in the scenario of an education tool it is less expected from an instructor to write
something as “I’ve learn something", being these expressions more common between students.
3.3 Implementation
After cleaning the data, an excerpt of the dataset was randomly selected as training set containing
10,000 posts, 5,000 from each author type.
A SVM Machine Learning classifier with a linear kernel type was chosen. The choice of this clas-
30

sifier was made after the study of some papers (Section 2.2.3) related with this area of specialization,
concluding that this type of classifier was majority considered and used in those works.
These type of classifier was implemented in the TalKit (Dias [9]), which we used and modified in
order to satisfy our requirements. In the TalKit classifier, in order to determine the class or category of
a post between two possible classes – Instructor or Student, a modification was performed consisting
in the conversion of the format of how the corpus would be represented, transforming it to the format –
“category : post".
For evaluation purposes, the TalKit classifier allows to evaluate our dataset using a k-fold cross-
validation technique, and in addition to the accuracy measure that it had already implemented and was
able to calculate, we added the possibility to estimate the precision, recall and F-measure scores for a
more complete evaluation setup in our project. These measures are usually used in Information Retrieval
and Text Classification as referred by Rijsbergen [44]. Furthermore, a status of how the post were being
classified was added, showing if a post was correctly being classified or not (Figure 3.19).
Figure 3.16: An excerpt of the evaluation process of the TalKit SVM Machine Learning classifier.
With the classifier and evaluation code appropriately modified, some classification features that were
already implemented were used, consisting in different ngrams combinations and sizes, in order to ver-
ify which offered better results. The following set of features was used: Unigrams, Bigrams, Trigrams
(Figure 3.20); and all combinations of those, including: Unigrams+Bigrams, Unigrams+Trigrams, Bi-
grams+Trigrams and finally Unigrams+Bigrams+Trigrams.
Figure 3.17: Example of ngrams: green - unigrams, blue - bigrams, red - trigrams.
31

For the evaluation of the models, both 10-fold cross-validation and the added measures precision,
recall, accuracy and F-measure were used. These measures were calculated using as expected cat-
egory the Instructors and Students posts independently. These experiments were repeated posteriorly
for different training sets: one without stopwords (words that are normally used as connectors and are
generally the most common words in a language) and other only using the stems of the posts.
To remove stopwords, a function containing all the words present in the list of stopwords of the TalKit
project was used. Regarding the stemmer, the already mentioned Porter Algorthim Stemmer was used.
3.4 Evaluation Setup
For the evaluation of this task, the already mentioned dataset (in Section 3.1) containing posts from
several courses of Coursera was used. These data was divided in a training set containing 10.000
posts, being 5.000 from students and the remaining 5.000 from instructors. These sets were used in
all the experiments with the respective modifications (remotion of stopwords, and using stems only) and
evaluated in this section.
The training data was subjected to a k-fold cross-validation technique for model validation purposes,
partitioning the data into 10 folds.
3 different approaches were made to assess which one would offer better results. For the first
experiment, the data was taken from the pre-processing phase and offered it directly to the classifier.
The second experiment consisted in removing the stopwords from the dataset, using the list of stopwords
of the TalKit project. The last approach consisted in only using the stems from all words reducing them
to its base or root form, in this last experiment the Porter Stemming Algorithm was used as stemmer.
Figure 3.18: Excerpt of dataset after pre-process phase.
Sem StopWords.jpg
Figure 3.19: Excerpt of dataset after the removal of stopwords.
32

Sem Stems.jpg
Figure 3.20: Excerpt of dataset after the employment of a stemmer.
As evaluation measures, it was employed the accuracy measure, along with the measures precision,
recall, and F-measure.
Accuracy is the percentage of correct classified examples to the number of examples.
Accuracy =TP + TN
TP + TN + FP + FN(3.1)
TP stands for true positive and is the number of correct items predicted as positive. TN (true negative)
is the number of correct items predicted as negative. FP (false positive) are the items erratically predicted
as positive and FN (false negative) is the number of items erratically predicted as negative.
Precision consist in the percentage of selected items that are correct. It is the fraction of relevant
retrieved examples.
Precision =TP
TP + FP(3.2)
Recall is the percentage of correct items that are selected. It is the fraction of retrieved relevant
examples.
Recall =TP
TP + FN(3.3)
The F1-score is a specification of the F-measure, which considers precision and recall as having the
same weight. It combines both precision and recall measures, and is defined as a weighted harmonic
mean of both precision and recall.
F1 =2 ∗ Precision ∗RecallPrecision+Recall
(3.4)
In all this classifications and for the evaluations, the feature used consisted in ngrams of different
sizes - Unigrams, Bigrams and Trigrams - and combinations between them, more precisely - Unigrams-
Bigrams-Trigrams, Unigrams-Bigrams, Unigrams-Trigrams and Bigrams-Trigrams.
3.5 Experiences
The dataset and both experiments of removing stopwords and employing a stemmer to the original
dataset were evaluated and ran with the classifier to estimate which features would be best employed
33
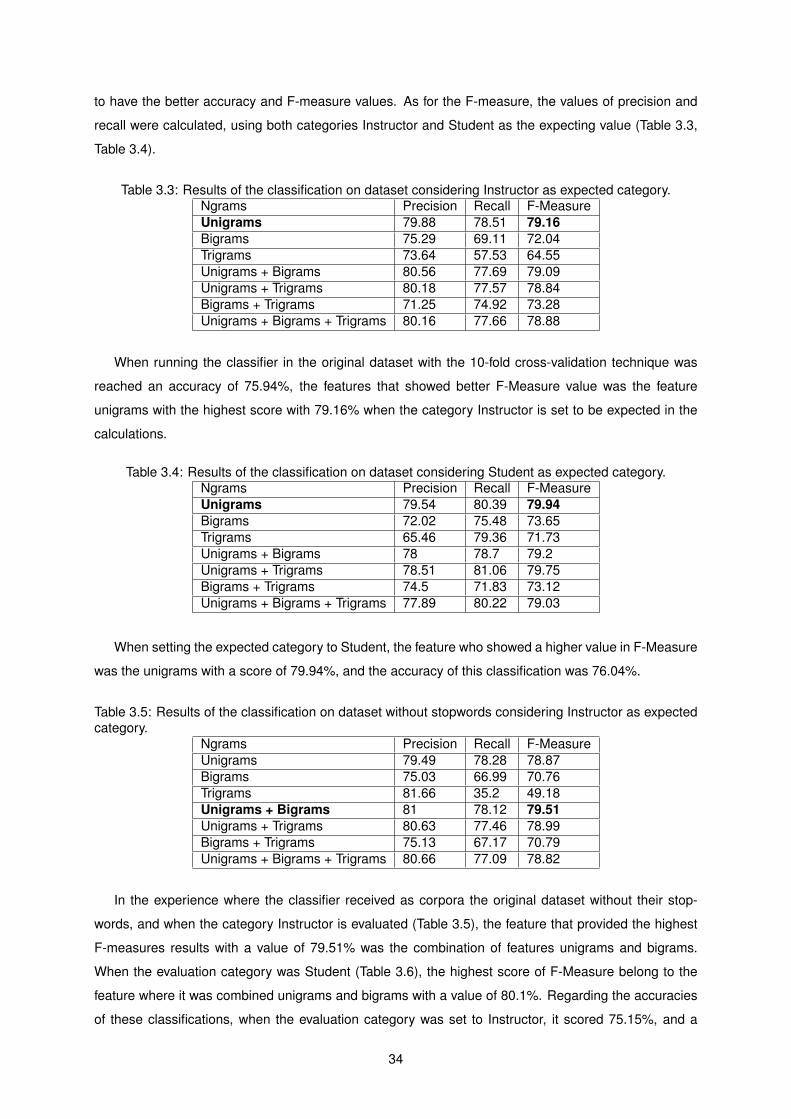
to have the better accuracy and F-measure values. As for the F-measure, the values of precision and
recall were calculated, using both categories Instructor and Student as the expecting value (Table 3.3,
Table 3.4).
Table 3.3: Results of the classification on dataset considering Instructor as expected category.Ngrams Precision Recall F-MeasureUnigrams 79.88 78.51 79.16Bigrams 75.29 69.11 72.04Trigrams 73.64 57.53 64.55Unigrams + Bigrams 80.56 77.69 79.09Unigrams + Trigrams 80.18 77.57 78.84Bigrams + Trigrams 71.25 74.92 73.28Unigrams + Bigrams + Trigrams 80.16 77.66 78.88
When running the classifier in the original dataset with the 10-fold cross-validation technique was
reached an accuracy of 75.94%, the features that showed better F-Measure value was the feature
unigrams with the highest score with 79.16% when the category Instructor is set to be expected in the
calculations.
Table 3.4: Results of the classification on dataset considering Student as expected category.Ngrams Precision Recall F-MeasureUnigrams 79.54 80.39 79.94Bigrams 72.02 75.48 73.65Trigrams 65.46 79.36 71.73Unigrams + Bigrams 78 78.7 79.2Unigrams + Trigrams 78.51 81.06 79.75Bigrams + Trigrams 74.5 71.83 73.12Unigrams + Bigrams + Trigrams 77.89 80.22 79.03
When setting the expected category to Student, the feature who showed a higher value in F-Measure
was the unigrams with a score of 79.94%, and the accuracy of this classification was 76.04%.
Table 3.5: Results of the classification on dataset without stopwords considering Instructor as expectedcategory.
Ngrams Precision Recall F-MeasureUnigrams 79.49 78.28 78.87Bigrams 75.03 66.99 70.76Trigrams 81.66 35.2 49.18Unigrams + Bigrams 81 78.12 79.51Unigrams + Trigrams 80.63 77.46 78.99Bigrams + Trigrams 75.13 67.17 70.79Unigrams + Bigrams + Trigrams 80.66 77.09 78.82
In the experience where the classifier received as corpora the original dataset without their stop-
words, and when the category Instructor is evaluated (Table 3.5), the feature that provided the highest
F-measures results with a value of 79.51% was the combination of features unigrams and bigrams.
When the evaluation category was Student (Table 3.6), the highest score of F-Measure belong to the
feature where it was combined unigrams and bigrams with a value of 80.1%. Regarding the accuracies
of these classifications, when the evaluation category was set to Instructor, it scored 75.15%, and a
34

Table 3.6: Results of the classification on dataset without stopwords considering Student as expectedcategory.
Ngrams Precision Recall F-MeasureUnigrams 78.78 80.16 79.44Bigrams 70.43 78.39 74.17Trigrams 59.01 91.8 71.83Unigrams + Bigrams 78.63 81.65 80.1Unigrams + Trigrams 78.34 81.06 79.65Bigrams + Trigrams 69.84 78.01 73.68Unigrams + Bigrams + Trigrams 78.17 81.02 79.54
value of 75.2% when its category was Student.
Table 3.7: Results of the classification on dataset only using stems, with Instructor as expected category.Ngrams Precision Recall F-MeasureUnigrams 81.11 80.46 80.76Bigrams 74.91 72.25 73.5Trigrams 73.71 60.23 66.27Unigrams + Bigrams 79.81 78.35 79.05Unigrams + Trigrams 80.53 77.95 79.2Bigrams + Trigrams 73.18 75.5 74.3Unigrams + Bigrams + Trigrams 80.36 78.5 79.26
Table 3.8: Results of the classification on dataset only using stems with Student as expected category.Ngrams Precision Recall F-MeasureUnigrams 80.24 80.55 80.38Bigrams 73.13 76.57 74.56Trigrams 66.33 78.55 71.88Unigrams + Bigrams 78.65 81.04 79.82Unigrams + Trigrams 79.05 81.06 80Bigrams + Trigrams 74.58 71.77 73.13Unigrams + Bigrams + Trigrams 78.65 80.65 79.62
Regarding the approach where we applied a stemmer to all terms of the posts, and when evaluating
the category Instructor (Table 3.7), it scored an accuracy of 76.63%. The resulting values of the use of
the classifier demonstrate that when applied the unigrams feature it provided a better f-measure result
with a value of 80.76%. For the same dataset but a classification where the evaluated category was
Student (Table 3.8), the accuracy of the classification was 76.55%, and the feature that showed higher
score were also the unigrams with an f-measure value of 80.38%.
3.6 Discussion
With this evaluation, we concluded that the F-measure score when evaluating the models increase
considerably when using the unigrams or combinations where it is employed with other feature, which
one can conclude that exist in the data set some single terms and vocabulary very specific used by
instructors that could identify the author of the posts when employed.
35

For example (Figure 3.21), after a study of a training and test set generated, the unigrams “strictly"
and “Excellent" were terms classified as being instructors’ terms due to their employability in the training
set were usually associated to instructors posts. When these terms appeared in students’ posts on
the test set, the classifier automatically classified these posts as being from instructors, which caused
an incorrect classification. The same happened when the term “loops" were found in instructors posts
which the classifier categorized as being a student term. Regarding the classification of trigrams, some
expressions such as, “you are saying" or “of the language" were found in the training set and classified
as being students expressions, and the posts starting with “The video was", or containing the expression
“the same issues" were classified as instructor expressions.
Figure 3.21: Examples of posts classified as incorrect and their faulty expressions.
Also, the use of stems slightly improve this score as well as the accuracy retrieved by the classifier,
which can be explained by the diversity of verbal forms and grammar of the English vocabulary when
used in the communication between individuals. For example, the terms “prefer" and “odd" are mostly
found in students’ posts but the terms “preference" or “oddly" are more frequently found in instructors
posts. The same goes for the term “particular" and “particularly", where the term “particular" is usually
found in students’ posts and the term “particularly" in instructors’ posts.
36

Chapter 4
Polarity assessment in students posts
For the second task, we implemented a function that, giving a post or a set of posts, allows an instructor
to determine the sentiment expressed by students in their posts, based on the polarities of the terms
written. For this task, the polarity of each post present in the lexicon SenticNet (Section 2.1.6) were
employed, and through the combination of these values, posts were ranked, considering those who
have higher levels of negativity, the ones which need to be addressed in the first place.
As dataset for the development of this classifier we used the same dataset used in the previous task
(Chapter 3) with its format established in the Section 3.1.
In the following sections we present the architecture of the proposed task (Section 3.1) followed by
their implementation (Section 3.2). Afterward, we present how our classifier can be extended in order
to use different lexicons and languages (Section 3.3), and the creation of a reference for evaluation
purposes (Section 3.4) will also be discussed. Furthermore, the settings for evaluating our task will be
described (Section 3.5) and the results of the different experiences will be presented in Section 3.6.
Finally, these results are briefly discussed in Section 3.7.
4.1 Architecture
The objective with the development of this task is to offer instructors the possibility of determining in an
easier way, the polarity and valence of the students’ posts in order to determine which need to be aided
and which show satisfaction in their posts.
In order to detect the sentiment expressed in students’ posts, the lexicon SenticNet was exploited.
Also, we made experiments where we tried to merge the concepts found in emosenticnet with the Sen-
ticNet and extend our lexicon to comprehend a larger set of vocabulary and expressions, however these
concepts do not include the polarity valence of its terms and thus it proved to be unprofitable to our task.
Using the SenticNet lexicon, information containing the terms and expressions was extracted along
with the respective polarities, and crossed with the same terms and expressions found in the posts.
These posts were subjected to a set of experiments to assess if it would be possible to capture more
terms and expressions due to some verbal conjugations or some expressions where its stopwords were
37

ignored.
The introduction of a stemmer in the original dataset as an experiment was considered due to the fact
that a large number of terms and expressions raised by students were not always in the same verb form
and therefore wasn’t always contemplated by the lexicon even though they have the same sentimental
value. The application of a stemmer in both the lexicon and the posts allows to normalize all terms and
expressions to be possible to take the greatest number of occurrences of these and thus obtain a more
accurate classification.
The final polarity of each post were then calculated through the arithmetic mean of its terms’ polarities
(4.1), which was considered more suitable for this classification instead of summing all terms’ polarities
(4.2), as it takes into consideration the number of terms of the post present in the lexicon and thus
granting that smaller posts with fewer terms could be evenly weighted.
PostPolarity =
∑TheirSentimentTermsPolarity
NumberOfSentimentTerms(4.1)
PostPolarity =∑
TheirSentimentTermsPolarity (4.2)
Finally, the posts are presented to the instructor with the possibility of showing only the posts whose
polarity value is lower than zero, due to be considered as those with highest priority.
Figure 4.1: Architecture of the posts classification framework.
38

In addition to this classifier, and based in the same process, another functionality was created to be
deployed in other projects, that instead of offering a set of posts, it allows the classification of a single
sentence along with the lexicon that we want to consider and apply to classify it. This functionality was
developed to offer other projects of Q&A a resource to evaluate submitted questions with their sentiment
polarity.
4.2 Implementation
For the development of this task, the first step was to observe and study the SenticNet lexicon to deter-
mine what would be necessary and useful for the implementation of our task. The SenticNet is a lexicon
created and employed for sentiment analysis task and contains, like every other lexicon of this type,
concepts that transmit some kind of sentiment or emotion. However, unlike other lexicons, in SenticNet
all concepts have associated a set of values referring the degree of pleasantness, attention, sensitiv-
ity, aptitude, polarity and also synsets (set of synonyms) with all their related terms also present in the
lexicon, Figure 4.2.
Figure 4.2: Excerpt of SenticNet lexicon before the processing and extraction of concept and polarity.
Taking this into account, the next step was to format the SenticNet lexicon into a text file with its
concepts along with their respective polarities. Figure 4.3.
Figure 4.3: Excerpt of SenticNet lexicon after the extraction and formatting.
With the lexicon file properly formatted, the code of our function started to be implemented. For this
task, we used the Java programming language, since we felt more comfortable with.
The classifier begun to be developed by creating the structures for our data. The SenticNet concepts
39

were then saved in a hash map containing the concepts and its values, as well as the posts that were
also saved in a hash map alongside with an id to identify them. The terms of each post that were present
in the lexicon (Table 4.1), were saved in a list, one for each post, and then, grouped in another list.
After the posts and concepts properly added to the structures, the lists of terms began to be popu-
lated. It started reading each line of the posts file at a time and for each line, all the terminations “n’t"
for the word “not" were replaced in order to capture and invert the polarity of the concepts that follows it.
The category of each post – Student: or Instructor: was removed as well as the punctuation marks, “.",
“;" and “,". Finally, the “?" and “!" symbols was also separated from the words by a whitespace character
to be possible the inclusion of these words on our search. Also, all words were posteriorly formatted to
lower case so they could be treated and classified equally.
In order to improve the accuracy in weighting some expressions not considered in the lexicon, a set
of adverbs has been used. If the word immediately before the term is one of these adverbs, the polarity
value of the term would be emphasized or depreciated depending on the adverb found. These adverbs
were treated like the already mentioned word not, but instead of reversing the polarity of the term, its
polarity was increased or diminished. Among these adverbs, the positive ones were quite, very, more
and several while the negative adverbs were the words few and less. (Figure 4.4)
Figure 4.4: Example of expressions with their polarity altered by adverbs or negation.
With the sentences formatted, each word was crossed with all concepts of the lexicon taking into
consideration previous and posterior words and thereby allow the capture of expressions (Figure 4.5).
Also, the concepts present in the lexicon that followed the word “not" were also added to the list of words
to treat some negative expressions, as well as the words that followed the adverbs that were added.
Figure 4.5: Example of expression matching and capture.
After the matching, to prevent the classifier to consider both the term and expression that contains
the same term, for example, that both of the terms “angry" and “get angry" were considered and added
to the post, was used a function to remove the words that were a substring of another, and thus the
40

concept “angry" was not added to the list.
Table 4.1: Example of the structured lists containing the posts and the terms present in both lexicon andpost
POST: Student: Turns out, it’s pretty common in the forums. think you’re at the top of the forum this week. . . just say’n (feel happy)TERMS: [think, common, feel happy, pretty, top, just]
Upon all the populated structures, for each set of terms of a post, their polarities were summed in
order to calculate the polarity of the post. This measure was then replaced after considering it unfair
when the posts were more extensive, due to the possibility of these posts had lowest score and therefore
highest priority not considering correctly the strength of the concepts. To avoid this problem, the resulting
value was fractioned with the number of terms to achieve an arithmetic mean.
For the terms that started with the word not its value was multiplied with -1 to invert its value. For
example, if the expression not happy was present in the post, and such the polarity of the term happy
is 0.298 its final result would be -0.298. The same treatment has been made for the adverbs mentioned
above. The terms that contained one of the positive adverbs (quite, very, more and several) were
multiplied by 1.25, while the negative adverbs (few and less) by 0.75.
Finally, the resulting value was rounded to three decimal places to clarify the visualization, and saved
alongside with the terms of the post.
To complete the task, we implemented a notification method, which added to a list all the posts that
contained as last term (corresponding to the value of the polarity already calculated) a value lower than
zero, i.e. the posts that contained a negative polarity. The final results were displayed in the format
shown in Figure 4.6.
For an easily and proper archiving of the classes and to create an executable application a jar was
created, and the parameters needed for their proper run are:
java -jar PostsPolarity.jar PostsFile.txt Lexicon.txt
Figure 4.6: Example of the final presentation of the results.
Finally, an evaluation class to estimate the scores of precision, recall, accuracy and f-measure of our
classifier when ranking the posts using a specific lexicon was built. This evaluation class was posteriorly
used to determine which experience offered the best results in terms of the posts polarity and also was
used to measure the performance of our classifier against other sentiment detection algorithms.
To execute the evaluation procedure a jar was created, which is ran by the command:
java -jar Evaluation.jar <FileToBeEvaluated.txt> <pos/neg>
The file must be in the format where in the first column correspond to the expected results and in the
second column the results of the classifier. In this evaluation only the polarity of the posts or sentences
are considered – symbols “+" or “-". The category to be evaluated is indicated as the last parameter,
<pos> if we want to evaluate regarding a positive classification, and <neg> otherwise.
41
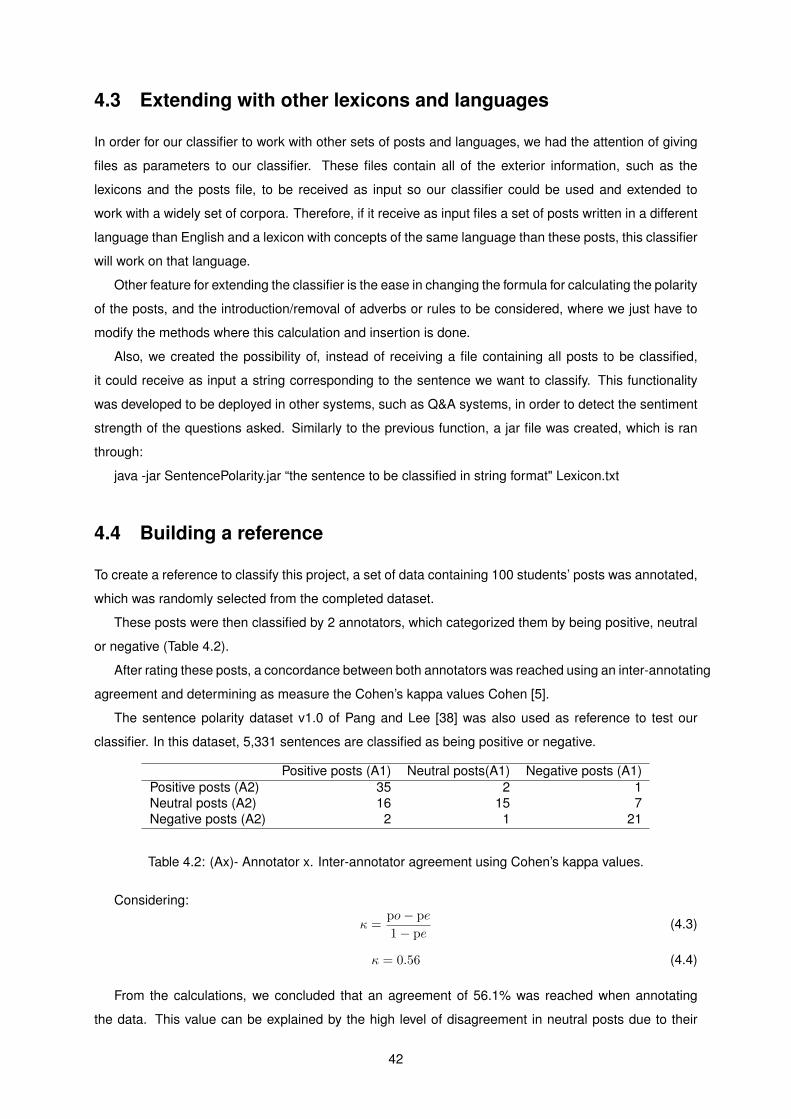
4.3 Extending with other lexicons and languages
In order for our classifier to work with other sets of posts and languages, we had the attention of giving
files as parameters to our classifier. These files contain all of the exterior information, such as the
lexicons and the posts file, to be received as input so our classifier could be used and extended to
work with a widely set of corpora. Therefore, if it receive as input files a set of posts written in a different
language than English and a lexicon with concepts of the same language than these posts, this classifier
will work on that language.
Other feature for extending the classifier is the ease in changing the formula for calculating the polarity
of the posts, and the introduction/removal of adverbs or rules to be considered, where we just have to
modify the methods where this calculation and insertion is done.
Also, we created the possibility of, instead of receiving a file containing all posts to be classified,
it could receive as input a string corresponding to the sentence we want to classify. This functionality
was developed to be deployed in other systems, such as Q&A systems, in order to detect the sentiment
strength of the questions asked. Similarly to the previous function, a jar file was created, which is ran
through:
java -jar SentencePolarity.jar “the sentence to be classified in string format" Lexicon.txt
4.4 Building a reference
To create a reference to classify this project, a set of data containing 100 students’ posts was annotated,
which was randomly selected from the completed dataset.
These posts were then classified by 2 annotators, which categorized them by being positive, neutral
or negative (Table 4.2).
After rating these posts, a concordance between both annotators was reached using an inter-annotating
agreement and determining as measure the Cohen’s kappa values Cohen [5].
The sentence polarity dataset v1.0 of Pang and Lee [38] was also used as reference to test our
classifier. In this dataset, 5,331 sentences are classified as being positive or negative.
Positive posts (A1) Neutral posts(A1) Negative posts (A1)Positive posts (A2) 35 2 1Neutral posts (A2) 16 15 7Negative posts (A2) 2 1 21
Table 4.2: (Ax)- Annotator x. Inter-annotator agreement using Cohen’s kappa values.
Considering:
κ =po− pe
1− pe(4.3)
κ = 0.56 (4.4)
From the calculations, we concluded that an agreement of 56.1% was reached when annotating
the data. This value can be explained by the high level of disagreement in neutral posts due to their
42

ambiguity.
Other reference we used, to evaluate our classifier rating texts out of the MOOCs scope, was the
SpeDial results on a set of movie texts. The SpeDial is a Spoken Dialogue System that have the ability
to perform affective modeling of spoken dialogue.
It is a dataset containing 3826 rated texts that we used as reference, and compared with the results
achieved by our classifier.
4.5 Evaluation Setup
To evaluate the classifier for polarity assessment in students’ posts, the employed dataset consisted
in an excerpt of the same dataset used for the first task and mentioned in section 2.1.1. This excerpt
contains 100 posts, all of them posted by students and selected randomly. These posts were posteriorly
labeled as negative, positive or neutral posts accordingly to their vocabulary by two annotators and an
inter-annotator agreement reached using Cohen’s kappa values as previously explained.
Different experiments were made, with the inclusion of a stopword removal and a stemmer. The
removal of stopwords disabled the majority of the expressions of the lexicon due to some of these were
composed by two or more words interconnected with the presence of stopwords such as “a little”, “a lot
of study” or “work to earn money”.
The evaluation measures applied in the first task of this thesis (Section 3.4) were again used and
so, the accuracy, precision, recall and f-measure calculated to estimate the performance of our classifier
when running with different experiments, lexicons and when compared with other valence classifiers.
As mentioned in the previous sections, the lexicon employed in this project for the classification of
the posts was the SenticNet lexicon (Section 2.1.6), which was also the lexicon used when evaluating
the mentioned experiences from where the stopwords were removed and a stemmer employed. Our
classifier was also used and evaluated using a different lexicon, the AFINN lexicon (Section 2.1.8), and
the SentiWordNet lexicon (Section 2.1.5) was studied to infer how it could be used and applied.
In order to determine the best classifier in measuring the polarity strengths of posts, the performance
of this classifier was compared with the sentiment analysis tool SentiStrength (Section 2.1.9) to assess
which one would offer better results.
Our classifier was also used in a set of texts already evaluated by the Spedial project, allowing to
determine how accurate they were when using in texts outside of the MOOCs domain.
We tried to contact the authors of other classifiers, namely the authors of the classifiers NRC-Canada
(Section 2.2.3) and JSC Framework (Section 2.2.4) but while in the NRC the classifier was not yet
ready for distribution, the JSC classifier was made available but we could not adapt it to work under our
requirements.
43

4.6 Experiences
A series of experiments were made, where we removed the stopwords and employed a stemmer in the
original dataset. Also, the classifier was evaluated using a different lexicon, the AFINN, where the same
approaches were made (Table 4.3, Table 4.4).
Table 4.3: Results of the classification on different experiences when expecting a positive result.Lexicon Precision Recall Accuracy F-MeasureSenticNet 63.49 76.92 59 69.57SenticNet w/o Stopwords 64.06 78.85 60 70.69SenticNet w/Stems 63.51 90.38 62 74.6AFINN 72.72 46.15 51 56.47AFINN w/o Stopwords 72.72 46.15 51 56.47AFINN w/Stems 74.42 61.54 57 67.37
Table 4.4: Results of the classification on different experiences when expecting a negative result.Ngrams Precision Recall Accuracy F-MeasureSenticNet 40.91 34.62 59 37.5SenticNet w/o Stopwords 42.86 34.62 60 38.3SenticNet w/Stems 44.44 30.77 62 36.36AFINN 52.63 38.46 51 44.44AFINN w/o Stopwords 55.56 38.46 51 45.45AFINN w/Stems 55.56 38.46 57 45.45
The results of this evaluation showed that our classifier was more accurate when employing the
lexicon SenticNet with stems with an accuracy score of 62%, and when the expected result was the
positive one it also showed the best score in calculating the f-measure with a value of 74.6%. Regarding
the estimation of the f-measure when the negative result was expected, the lexicon AFINN without
stopwords and with stems had the same highest result of 45.45%.
After running and evaluating our classifier with different experiments and using different lexicons,
other sentiment detection algorithm called SentiStrength was also ran and evaluated to assess the
performance of our classifier when comparable to others. (Table 4.5, Table 4.6) The SentiStrength
operates by receiving as input a file with several sentences (1 for each line) or just a single one, and like
our classifier, retrieve the polarity strength of that sentences.
Table 4.5: Results of the SentiStrength algorithm on different experiences when expecting a positiveresult.
Ngrams Precision Recall Accuracy F-MeasureSentiStrength 70 40.38 45 51.22SentiStrength w/o Stopwords 70.97 42.31 46 53.01SentiStrength w/Stems 62.96 32.69 42 43.04
According to the SentiStrength algorithm, the experiment that offered the best results when compar-
ing their evaluation with the data annotated was the approach where we removed the stopwords from
the original dataset reaching an accuracy of 46% and an f-measure of 53.01% when expecting a positive
result and 40% when evaluating for a negative result.
44

Table 4.6: Results of the SentiStrength algorithm on different experiences when expecting a negativeresult.
Ngrams Precision Recall Accuracy F-MeasureSentiStrength 45 34.62 45 39.13SentiStrength w/o Stopwords 47.37 34.62 46 40SentiStrength w/Stems 42.11 30.77 42 35.56
After evaluating our classifier and comparing it with other sentiment detection algorithm, our classifier
was subjected to other dataset out of the domain of MOOCs to assess their performance. For this last
experiment, we recurred to a set of texts used and already evaluated and scored by the Spedial project
and compared their results with the results achieved with our classification. (Table 4.7)
Table 4.7: Results of our classifier when compared with the Spedial project scores.Expected Result Precision Recall Accuracy F-MeasurePositive 46.16 65.1 45.27 54.02Negative 82.42 29.93 45.27 43.92
This experiment showed that our classifier had an accuracy of 45.27% when estimating the sentiment
strength of the texts used in Spedial, and that their performance was higher when evaluating the positive
results showing a score of 54.02%
Regarding the results of our classifier when evaluating the sentences from the Pang&Lee dataset
(Table 4.8), we concluded that our classifier perform better when classifying positive texts, showing an
accuracy of 84.51% and f-measure score of 91.61%, than when classifying negative texts, which scored
an accuracy of 26.82% and f-measure of 42.3%.
Table 4.8: Results of our classifier when compared with the Pang&Lee sentences dataset scores.Expected Result Precision Recall Accuracy F-MeasurePositive 100.0 84.52 84.51 91.61Negative 100.0 26.82 26.82 42.3
4.7 Discussion
After the evaluation of our classifier using different lexicons, we concluded that the experiments where we
used stems from the posts and lexicons was the one which offered best accuracy results. We estimate
that it was due to the data sparseness, and the fact that a term is written in different verbal forms and
not only in its root form, and thus it highly increase the presence of the terms when their suffixes are
removed (Figure 4.7).
Figure 4.7: Example of posts that were incorrectly classified due to the absence of stems.
Also, our classification showed best results when evaluating positive posts, which can be explained
45

in the negative posts, by the use of irony, sarcasm or other difficult expressions by the students when
addressing questions they do not understand or are not comfortable with, or due to their reluctance in ex-
pressing themselves using negative sentiment words. In the Figure 4.8, the expressions “by God!", have
a very high positivity in the lexicon, but in the context of this post it transmit a sentiment of intolerance
by the author.
Figure 4.8: Example of posts that were incorrectly classified due to the presence of expressions ofdifficult assessment.
Other explanation for the low results in the evaluation of negative posts can be the fact that our
classifier does not consider POS tagging (Figure 4.9).
Figure 4.9: Example of posts that were incorrectly classified due to the absence of POS tagging.
The test does not contain only posts with direct problems and doubts from the students but also
situations where they explain something they do not agree and why, or mention negative facts to prove
their point (Figure 4.10), and thus are annotated has positive although some of its terms have negative
sentiments, stronger than the positive ones.
Figure 4.10: Example of posts that were incorrectly classified due to the presence of expressions wherestudents do not explicit their sentiment.
Other reason for this results, was the fact that still exist some posts written in different languages than
English, and that in some of these posts the use of foreign words or other terms, such as commands or
code that are generally written in English could cause the classifier to detect them (Figure 4.11).
Figure 4.11: Example of posts that were annotated as neutral but contain foreign words.
These results showed consistency with the values obtained when classifying our dataset using the
SentiStrength. In this case, the positive results evaluation also showed better scores than when eval-
uating the negative results, but unlike our classifier the SentiStrength algorithm showed higher scores
when employed without stopwords.
46

The same situation happened when comparing the results of our classification with the values ob-
tained by the Spedial project and the Pang&Lee sentences dataset when evaluating their texts.
47

Chapter 5
Most common expressions used in
MOOCs
The kfNgrams 1 is a free-software for linguistic research that through a text file given as input determines
the most frequent n-grams.
In Table 5.1 we present the expressions regarding the kfNgrams results, which allowed us to assess
which expressions were used with higher frequency by both students and instructors, being identified by
their author type. For this study, we used the complete pre-processed dataset containing all posts from
all courses, and divided it in two parts, one containing only the posts from students and other only with
instructors’ posts.
For this study, we used 5-grams to find the most common expressions due to the presence of stop-
words in these sentences, which although does not directly provide any utility, when used as connectors
can interfere with the construction of different expressions, and their absence could interfere with the in-
tention of some expressions, on the other hand the use of less n-grams could not be enough to capture
relevant expressions.
Table 5.1: The most common expressions belonging to instructors and students when searching with5-grams.
Instructors
“you should be able"“at the end of the"“take a look at the"“you will be able to"“at the top of the"“let us know if you"“thank you for your feedback"
Students
“at the end of the"“this is my first course(coursera)"“hello(hi) everyone my name is"“it seems to me that"“thank you very (so) much for"“there are a lot of"“nice to meet you all"
1http://kwicfinder.com/kfNgram/kfNgramHelp.html
48

The analysis of the results allowed to conclude that most of the expressions used by instructors are
those which they give indications about something that was asked (“at the end of the", “at the top of the",
“take a look at the"), showing their ability to answer students’ questions and doubts. Also, expressions of
encouragement (“you should be able to") and promotion of participation (“let us know if you") were found,
suggesting their active presence in the forums and their will to address any students doubts, as well as
sentences expressing gratitude about something that was suggested or criticized in order to improve it
(“thank you for your feedback").
Regarding the students posts, we found that the most common used expressions consisted in posts
where students present themselves or state their inexperience taking online courses, at least in Cours-
era, (“hello(hi) everyone my name is", “nice to meet you all", “this is my first course(coursera)"), in
expressions where they are grateful for the assistance provided (“thank you very(so) much for"), and
expressions where they give their personal opinion about an occurrence (“it seems to me that"). Other
expressions were often found, suggesting their aptitude for helping other students, giving them indica-
tions as those given by the instructors (“at the end of the", “there are a lot of").
Other highly used expressions were found, but due to their presence in only a short sequence of
posts, showing that these expressions were largely used in just one specific course, such as “brought
out the best in" which are presented in a course of leadership or the sentence “use this thread to ask
help and clarification about Question X, for your convenience here’s the text of the question:" which is a
pre-made sentence made by the instructors of the course “useful genetics".
These expressions, led us to study and discover the vocabulary used in the courses to determine
the most common and specific terms for each available course in our dataset. Unlike the features used
in the previous table where we made our search using 5-grams to find expressions, for this experience
we will only use unigrams due to the fact that we only want the most common and specific terms and
we will also exclude stopwords and words that we find transversal to all courses. An excerpt of these
results are shown in Table 5.2, the complete results are presented in Appendix A.
49
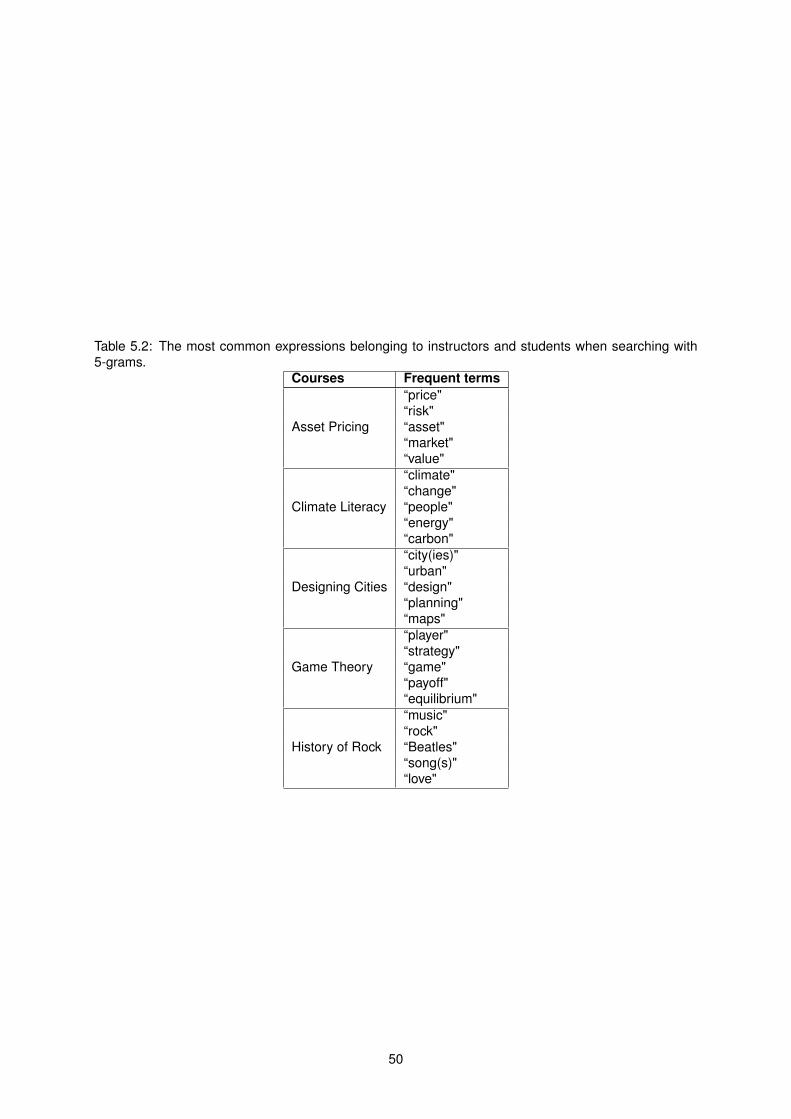
Table 5.2: The most common expressions belonging to instructors and students when searching with5-grams.
Courses Frequent terms
Asset Pricing
“price"“risk"“asset"“market"“value"
Climate Literacy
“climate"“change"“people"“energy"“carbon"
Designing Cities
“city(ies)"“urban"“design"“planning"“maps"
Game Theory
“player"“strategy"“game"“payoff"“equilibrium"
History of Rock
“music"“rock"“Beatles"“song(s)"“love"
50

Chapter 6
Conclusions and Future Work
MOOCs are a recent and currently in expansion learning tool that allow individuals to enroll in online
courses and receive proper education about several and different study domains. Due to its growth,
the forums of these courses usually have thousands of posts making it difficult for instructors to assess
students and evaluate them consistently.
To answer the large quantity of posts these courses usually have, this thesis proposed a model
of classification and a sentiment polarity classifier in order to give instructors in future works useful
information regarding the posts. A study was also made, to determine the most frequent and common
expressions in students’ and instructors’ posts, and in specific areas of learning.
The model of classification aimed at the automatic identification of the authors of the posts of the
forums courses. For this task, we used the classifier developed in TalKit alongside a set of features to
classify each post of our dataset. For this classification process the features used were the ngrams,
namely unigrams, bigrams, trigrams and combinations between them. Also, these features were ex-
tracted from different experiments that were made to the dataset, one where the stopwords of each post
were removed, and other where a stemmer was employed so it would only contain stem words. After
this task was evaluated, we concluded that to obtain the best results at identifying the authors of the
posts, the features that should be used are unigrams or combinations of them with other type of ngrams.
Also, the reduction of all words to stems from the dataset slightly improved the classifier results, due to
the normalization of all words to stems, increasing their occurrence in expressions, but at the same time
with the cost of losing information that could be important.
A sentiment detection classifier was also implemented that alongside with available lexicons, allows
to estimate the sentiment strength of the posts written by students in our dataset and how its results
would be influenced by the removal of stopwords and the use of stems. In this classifier, we determine
the polarity and valence of the students posts according to their sentiment terms present in the lexicon.
Also, this classifier was evaluated using different lexicons, and sets of data out of the context of
MOOCs (Spedial and the Pang&Lee dataset) and its results compared with other sentiment detection
algorithm, the SentiStrength.
With this task, we concluded that our classifier showed better results when evaluating positive posts,
51

and with the use of stems, which can be explained by the increase of equal terms and expressions
after employing a stemmer, for example "particular" and "particularly" are transformed to the same term,
"particular", which although it offer better results in classification can also mean that some information
is lost, and that the negative sentiments written by the students are usually expressed through expres-
sions difficult to capture in automatic classification, such as irony or sarcasm or other difficult of capture
expressions.
6.1 Future Work
To improve the results of our methodologies, future work can be conducted in order to improve our
classifier estimating the valence and polarity of the posts. One of these tasks could be the adoption
of POS tagging to allow the introductions of other type of lexicons, namely the SentiWordNet (Section
2.1.8) which differentiates the polarity strengths of the terms according its POS.
Other future work that can be done is an extensive process of annotation, that would allow to capture
difficult expressions to answer in an automatic form, such as sarcasm, irony, or even frustration and
boredom. These expressions are frequently used when expressing negative emotions and a method to
identify them would greatly improve this task.
Also, punctuation marks can be useful when classifying students’ posts. The use of exclamation
mark can be used to increment the strength of a sentence as the interrogation mark used to discover
questions from students.
Regarding the method used to calculate the sentiment polarity of a post, other measures such as the
consideration of the dominant emotions of the posts should be taken into account.
52

Bibliography
[1] H. Binali, C. Wu, and V. Potdar. A new significant area: Emotion detection in e-learning using
opinion mining techniques. In Digital Ecosystems and Technologies, 2009. DEST ’09. 3rd IEEE
International Conference on, pages 259–264, June 2009. doi: 10.1109/DEST.2009.5276726.
[2] M. M. Bradley and P. J. Lang. Measuring emotion: The self-assessment manikin and the
semantic differential. Journal of Behavior Therapy and Experimental Psychiatry, 25(1):49–59,
1994. ISSN 0005-7916. doi: http://dx.doi.org/10.1016/0005-7916(94)90063-9. URL http:
//www.sciencedirect.com/science/article/pii/0005791694900639.
[3] L. Breiman. Random forests. Mach. Learn., 45(1):5–32, Oct. 2001. ISSN 0885-6125. doi: 10.1023/
A:1010933404324. URL http://dx.doi.org/10.1023/A:1010933404324.
[4] E. Cambria, R. Speer, C. Havasi, and A. Hussain. Senticnet: A publicly available semantic resource
for opinion mining, 2010. URL https://www.aaai.org/ocs/index.php/FSS/FSS10/paper/view/
2216.
[5] J. Cohen. A Coefficient of Agreement for Nominal Scales. Educational and Psychological Measure-
ment, 20(1):37–46, Apr. 1960. doi: 10.1177/001316446002000104. URL http://dx.doi.org/10.
1177/001316446002000104.
[6] C. Cortes and V. Vapnik. Support-vector networks. In Machine Learning, pages 273–297, 1995.
[7] A. Denis, S. Cruz-Lara, and N. Bellalem. General purpose textual sentiment analysis and emotion
detection tools. CoRR, abs/1309.2853, 2013. URL http://arxiv.org/abs/1309.2853.
[8] K. N. Devi and V. M. Bhaskaran. Sentiment analysis for online forums hotspot detection.
[9] C. Dias. Talkit - desenvolvimento de um sistema de diálogo para português, 2015.
[10] A. Esuli and F. Sebastiani. Sentiwordnet: A publicly available lexical resource for opinion mining.
In In Proceedings of the 5th Conference on Language Resources and Evaluation (LREC’06, pages
417–422, 2006.
[11] R. M. Fano. Transmission of information a statistical theory of communications, 1961. URL http:
//opac.inria.fr/record=b1108490.
53

[12] M. Hall, E. Frank, G. Holmes, B. Pfahringer, P. Reutemann, and I. H. Witten. The weka data mining
software: An update. SIGKDD Explor. Newsl., 11(1):10–18, Nov. 2009. ISSN 1931-0145. doi:
10.1145/1656274.1656278. URL http://doi.acm.org/10.1145/1656274.1656278.
[13] J. Harris and H. Stöcker. Handbook of Mathematics and Computational Science. Environmental In-
telligence Unit. Springer, 1998. ISBN 9780387947464. URL http://books.google.co.in/books?
id=DnKLkOb_YfIC.
[14] M. Hu and B. Liu. Mining and summarizing customer reviews. In Proceedings of the Tenth ACM
SIGKDD International Conference on Knowledge Discovery and Data Mining, KDD ’04, pages 168–
177, New York, NY, USA, 2004. ACM. ISBN 1-58113-888-1. doi: 10.1145/1014052.1014073. URL
http://doi.acm.org/10.1145/1014052.1014073.
[15] R. J. B. James W. Pennebaker and M. E. Francis. Linguistic inquiry and word count liwc, n.d. URL
http://www.liwc.net/.
[16] C. jen Lin. Projected gradient methods for non-negative matrix factorization. Technical report,
Neural Computation, 2007.
[17] N. Kaji and M. Kitsuregawa. Automatic construction of polarity-tagged corpus from html documents.
In Proceedings of the COLING/ACL on Main Conference Poster Sessions, COLING-ACL ’06, pages
452–459, Stroudsburg, PA, USA, 2006. Association for Computational Linguistics. URL http:
//dl.acm.org/citation.cfm?id=1273073.1273132.
[18] T. Kanungo, D. M. Mount, N. S. Netanyahu, C. D. Piatko, R. Silverman, A. Y. Wu, S. Member,
and S. Member. An efficient k-means clustering algorithm: Analysis and implementation. IEEE
Transactions on Pattern Analysis and Machine Intelligence, 24:881–892, 2002.
[19] J. Kim, E. Shaw, S. Wyner, T. Kim, and J. Li. Discerning affect in student discussions.
[20] S. M. Kim and R. A. Calvo. Sentiment analysis in student experiences of learning.
In R. S. J. de Baker, A. Merceron, and P. I. P. Jr., editors, EDM, pages 111–120.
www.educationaldatamining.org, 2010. ISBN 978-0-615-37529-8. URL http://dblp.uni-trier.
de/db/conf/edm/edm2010.html.
[21] D. Kleinbaum. Survival analysis, a self-learning text. Biometrical Journal, 40(1):107–108, 1998.
ISSN 1521-4036. doi: 10.1002/(SICI)1521-4036(199804)40:1<107::AID-BIMJ107>3.0.CO;2-9.
URL http://dx.doi.org/10.1002/(SICI)1521-4036(199804)40:1<107::AID-BIMJ107>3.0.CO;
2-9.
[22] D. Knoke and P. J. Burke. Log-linear models. Sage University papers. Sage publications, Bev-
erly Hills, London, New Delhi, 1980. ISBN 0-8039-1492-X. URL http://opac.inria.fr/record=
b1078905.
[23] R. Kohavi. A study of cross-validation and bootstrap for accuracy estimation and model selec-
tion. In Proceedings of the 14th International Joint Conference on Artificial Intelligence - Volume
54

2, IJCAI’95, pages 1137–1143, San Francisco, CA, USA, 1995. Morgan Kaufmann Publishers Inc.
ISBN 1-55860-363-8. URL http://dl.acm.org/citation.cfm?id=1643031.1643047.
[24] T. Landauer, P. Foltz, and D. Laham. An introduction to latent semantic analysis. Discourse pro-
cesses, 25:259–284, 1998.
[25] R. Lowen. Fuzzy set theory - basic concepts, techniques and bibliography. Kluwer, 1996. ISBN
978-0-7923-4057-7.
[26] D. J. C. MacKay. Information Theory, Inference & Learning Algorithms. Cambridge University Press,
New York, NY, USA, 2002. ISBN 0521642981.
[27] C. D. Manning, P. Raghavan, and H. Schütze. Introduction to Information Retrieval. Cambridge
University Press, New York, NY, USA, 2008. ISBN 0521865719, 9780521865715.
[28] H. W. Marsh. Students’ evaluations of university teaching: Research findings, methodological is-
sues, and directions for future research. International journal of educational research, 11(3):253–
388, 1987.
[29] G. A. Miller. Wordnet: A lexical database for english. Commun. ACM, 38(11):39–41, Nov. 1995.
ISSN 0001-0782. doi: 10.1145/219717.219748. URL http://doi.acm.org/10.1145/219717.
219748.
[30] S. M. Mohammad and P. D. Turney. Emotions evoked by common words and phrases: Using
mechanical turk to create an emotion lexicon. In Proceedings of the NAACL HLT 2010 Workshop
on Computational Approaches to Analysis and Generation of Emotion in Text, CAAGET ’10, pages
26–34, Stroudsburg, PA, USA, 2010. Association for Computational Linguistics. URL http://dl.
acm.org/citation.cfm?id=1860631.1860635.
[31] S. M. Mohammad and T. W. Yang. Tracking sentiment in mail: How genders differ on emotional
axes. In Proceedings of the 2Nd Workshop on Computational Approaches to Subjectivity and Sen-
timent Analysis, WASSA ’11, pages 70–79, Stroudsburg, PA, USA, 2011. Association for Computa-
tional Linguistics. ISBN 9781937284060. URL http://dl.acm.org/citation.cfm?id=2107653.
2107662.
[32] S. M. Mohammad, S. Kiritchenko, and X. Zhu. Nrc-canada: Building the state-of-the-art in sentiment
analysis of tweets. CoRR, abs/1308.6242, 2013. URL http://dblp.uni-trier.de/db/journals/
corr/corr1308.html.
[33] K. Mouthami, K. Devi, and V. Bhaskaran. Sentiment analysis and classification based on textual
reviews. In Information Communication and Embedded Systems (ICICES), 2013 International Con-
ference on, pages 271–276, Feb 2013. doi: 10.1109/ICICES.2013.6508366.
[34] T. Nakagawa, T. Kawada, K. Inui, and S. Kurohashi. Extracting subjective and objective evaluative
expressions from the web. In Universal Communication, 2008. ISUC ’08. Second International
Symposium on, pages 251–258, Dec 2008. doi: 10.1109/ISUC.2008.17.
55

[35] T. Nakagawa, K. Inui, and S. Kurohashi. Dependency tree-based sentiment classification using
crfs with hidden variables. In Human Language Technologies: The 2010 Annual Conference of the
North American Chapter of the Association for Computational Linguistics, HLT ’10, pages 786–794,
Stroudsburg, PA, USA, 2010. Association for Computational Linguistics. ISBN 1-932432-65-5. URL
http://dl.acm.org/citation.cfm?id=1857999.1858119.
[36] A. Neviarouskaya, H. Prendinger, and M. Ishizuka. Sentiful: A lexicon for sentiment analysis.
Affective Computing, IEEE Transactions on, 2(1):22–36, Jan 2011. ISSN 1949-3045. doi: 10.1109/
T-AFFC.2011.1.
[37] F. Å. Nielsen. Afinn, mar 2011. URL http://www2.imm.dtu.dk/pubdb/p.php?6010.
[38] B. Pang and L. Lee. Seeing stars: Exploiting class relationships for sentiment categorization with
respect to rating scales. In Proceedings of the ACL, 2005.
[39] T. Pedersen and S. Patwardhan. Wordnet::similarity - measuring the relatedness of concepts.
pages 1024–1025, 2004.
[40] S. Poria, A. Gelbukh, E. Cambria, P. Yang, A. Hussain, and T. Durrani. Merging senticnet and
wordnet-affect emotion lists for sentiment analysis. In Signal Processing (ICSP), 2012 IEEE 11th
International Conference on, volume 2, pages 1251–1255, Oct 2012. doi: 10.1109/ICoSP.2012.
6491803.
[41] Y. V. Prohorov, I. A. Rozanov, K. Krickeberg, and H. Urmitzer. Probability theory : Basic concepts,
limit theorems, random processes, 1969. URL http://opac.inria.fr/record=b1080968. Traduc-
tion de : Teorija verojatnostej.
[42] J. R. Quinlan. Induction of decision trees. Mach. Learn., 1(1):81–106, Mar. 1986. ISSN 0885-6125.
doi: 10.1023/A:1022643204877. URL http://dx.doi.org/10.1023/A:1022643204877.
[43] A. Ratnaparkhi. A maximum entropy model for part-of-speech tagging, 1996.
[44] C. J. V. Rijsbergen. Information Retrieval. Butterworth-Heinemann, Newton, MA, USA, 2nd edition,
1979. ISBN 0408709294.
[45] L. A. Rossi and O. Gnawali. Language Independent Analysis and Classification of Discussion
Threads in Coursera MOOC Forums. In Proceedings of the IEEE International Conference on
Information Reuse and Integration (IRI2014), Aug. 2014.
[46] D. E. Rumelhart, G. E. Hinton, and R. J. Williams. Neurocomputing: Foundations of research.
chapter Learning Internal Representations by Error Propagation, pages 673–695. MIT Press,
Cambridge, MA, USA, 1988. ISBN 0-262-01097-6. URL http://dl.acm.org/citation.cfm?id=
65669.104449.
[47] G. Salton, A. Wong, and C. S. Yang. A vector space model for automatic indexing. Commun.
ACM, 18(11):613–620, Nov. 1975. ISSN 0001-0782. doi: 10.1145/361219.361220. URL http:
//doi.acm.org/10.1145/361219.361220.
56
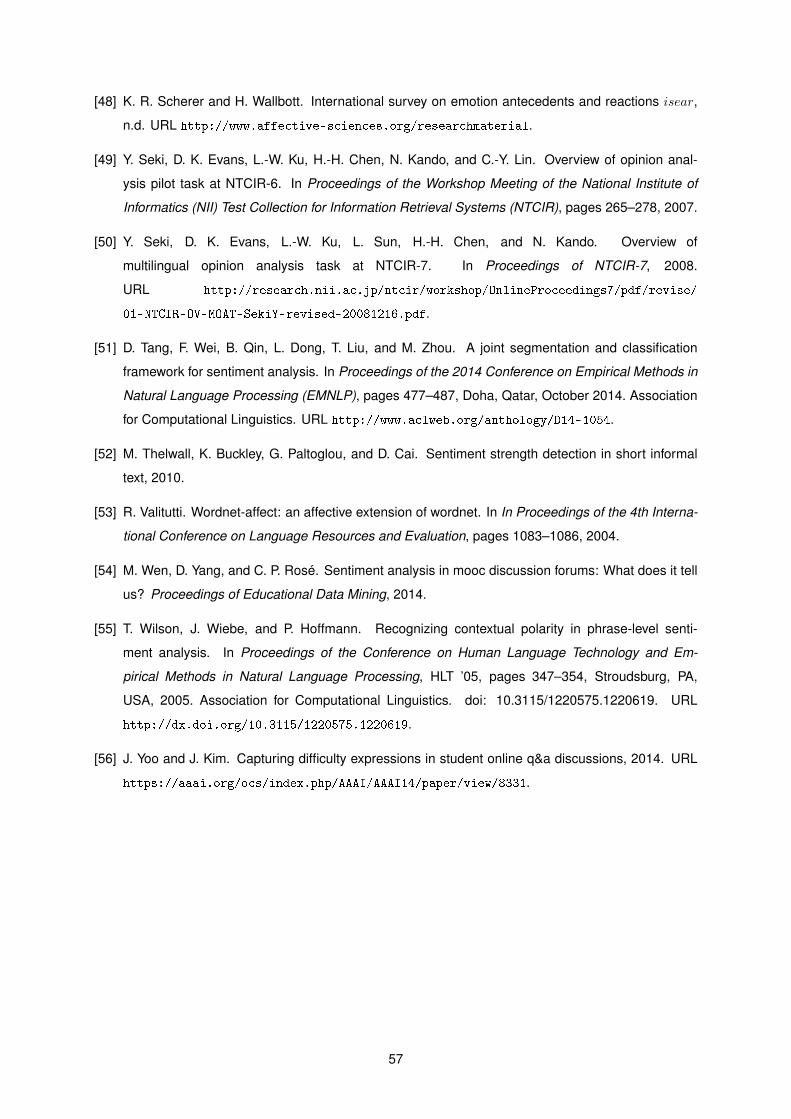
[48] K. R. Scherer and H. Wallbott. International survey on emotion antecedents and reactions isear,
n.d. URL http://www.affective-sciences.org/researchmaterial.
[49] Y. Seki, D. K. Evans, L.-W. Ku, H.-H. Chen, N. Kando, and C.-Y. Lin. Overview of opinion anal-
ysis pilot task at NTCIR-6. In Proceedings of the Workshop Meeting of the National Institute of
Informatics (NII) Test Collection for Information Retrieval Systems (NTCIR), pages 265–278, 2007.
[50] Y. Seki, D. K. Evans, L.-W. Ku, L. Sun, H.-H. Chen, and N. Kando. Overview of
multilingual opinion analysis task at NTCIR-7. In Proceedings of NTCIR-7, 2008.
URL http://research.nii.ac.jp/ntcir/workshop/OnlineProceedings7/pdf/revise/
01-NTCIR-OV-MOAT-SekiY-revised-20081216.pdf.
[51] D. Tang, F. Wei, B. Qin, L. Dong, T. Liu, and M. Zhou. A joint segmentation and classification
framework for sentiment analysis. In Proceedings of the 2014 Conference on Empirical Methods in
Natural Language Processing (EMNLP), pages 477–487, Doha, Qatar, October 2014. Association
for Computational Linguistics. URL http://www.aclweb.org/anthology/D14-1054.
[52] M. Thelwall, K. Buckley, G. Paltoglou, and D. Cai. Sentiment strength detection in short informal
text, 2010.
[53] R. Valitutti. Wordnet-affect: an affective extension of wordnet. In In Proceedings of the 4th Interna-
tional Conference on Language Resources and Evaluation, pages 1083–1086, 2004.
[54] M. Wen, D. Yang, and C. P. Rosé. Sentiment analysis in mooc discussion forums: What does it tell
us? Proceedings of Educational Data Mining, 2014.
[55] T. Wilson, J. Wiebe, and P. Hoffmann. Recognizing contextual polarity in phrase-level senti-
ment analysis. In Proceedings of the Conference on Human Language Technology and Em-
pirical Methods in Natural Language Processing, HLT ’05, pages 347–354, Stroudsburg, PA,
USA, 2005. Association for Computational Linguistics. doi: 10.3115/1220575.1220619. URL
http://dx.doi.org/10.3115/1220575.1220619.
[56] J. Yoo and J. Kim. Capturing difficulty expressions in student online q&a discussions, 2014. URL
https://aaai.org/ocs/index.php/AAAI/AAAI14/paper/view/8331.
57

58

Appendix A
Courses’ most frequent terms
Courses Frequent terms
Asset Pricing
"price"
"risk"
"asset"
"market"
"value"
Automata
"state"
"language"
"regular"
"string"
"final"
Big Data
"data"
"model"
"number"
"RapidMiner"
"column"
Bio Informatics
"score"
"code"
"string"
"algorithm"
"list"
Blended Learning
"learning"
"blended"
"student"
"teacher"
Continued on next page
59

Table A.1 – continued from previous page
Courses Frequent terms
"school"
Blue Brain
"brain"
"neurons"
"people"
"free"
"cell"
Climate Literacy
"climate"
"change"
"people"
"energy"
"carbon"
Compilers
"error"
"code"
"string"
"lexer"
"parser"
Computational Methods
"time"
"frequency"
"domain"
"signal"
"MatLab"
Cryptography
"key"
"time"
"message"
"programming"
"code"
Data Analysis
"data"
"analysis"
"variables"
"model"
"test"
Data Science
"data"
"file"
"code"
"tweet"
Continued on next page
60

Table A.1 – continued from previous page
Courses Frequent terms
"error"
Design
"design"
"gap"
"link"
"project"
"prototype"
Designing Cities
"city(ies)"
"urban"
"design"
"planning"
"maps"
Digital Media
"code"
"processing"
"android"
"void"
"sketch"
Digital Signal Processing
"signal"
"frequency"
"basis"
"example"
"vectors"
E-learning and Digital Cultures
"technology"
"people"
"learning"
"education"
"human"
Einstein
"time"
"light"
"speed"
"moving"
"frame"
Finance
"rate"
"year"
"value"
"nominal"
Continued on next page
61

Table A.1 – continued from previous page
Courses Frequent terms
"cost"
Networks: Friends, Money and Bytes
"time"
"materials"
"receiver"
"transmitter"
"videos"
Game Theory
"player"
"strategy"
"game"
"payoff"
"equilibrium"
Gamification
"gamification"
"games"
"people"
"play"
"fun"
Genome Science
"sequence"
"genome"
"research"
"biology"
"data"
Global Warming
"climate"
"change"
"temperature"
"time"
"energy"
Human Computer Interaction
"people"
"design"
"peer"
"prototype"
"feedback"
History of Rock
"music"
"rock"
"Beatles"
"song(s)"
Continued on next page
62

Table A.1 – continued from previous page
Courses Frequent terms
"love"
Humankind
"people"
"human"
"world"
"years"
"species"
Intro to EU Law
"law"
"european"
"people"
"country(ies)"
"union"
Intro to Psychology
"people"
"psychology"
"learning"
"life"
"brain"
Intro to Statistics
"data"
"mean"
"statistics"
"value"
"number"
Emotional Intelligence - Inspiring Leadership
"people"
"leader"
"work"
"feel"
"life"
Linear Programming
"problem"
"function"
"dictionary"
"programming"
"variable"
Mathematical Methods
"function"
"finance"
"math"
"time"
Continued on next page
63
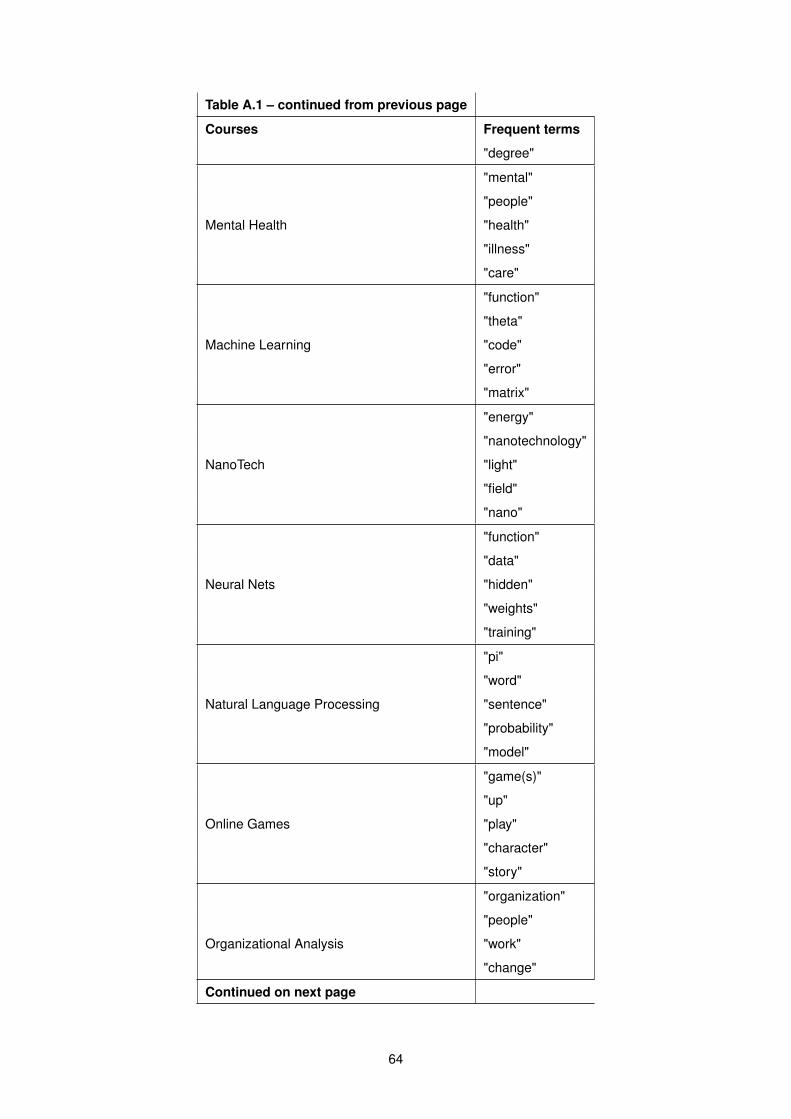
Table A.1 – continued from previous page
Courses Frequent terms
"degree"
Mental Health
"mental"
"people"
"health"
"illness"
"care"
Machine Learning
"function"
"theta"
"code"
"error"
"matrix"
NanoTech
"energy"
"nanotechnology"
"light"
"field"
"nano"
Neural Nets
"function"
"data"
"hidden"
"weights"
"training"
Natural Language Processing
"pi"
"word"
"sentence"
"probability"
"model"
Online Games
"game(s)"
"up"
"play"
"character"
"story"
Organizational Analysis
"organization"
"people"
"work"
"change"
Continued on next page
64

Table A.1 – continued from previous page
Courses Frequent terms
"culture"
Probabilistic Graphical Models
"function"
"model"
"code"
"test"
"factors"
Peking University - BioInformatics
"normal"
"bioinformatics"
"slides"
"sequence"
"start"
Functional Programming
"function"
"code"
"scala"
"list"
"test"
Programming
"function"
"code"
"return"
"file"
"Python"
Programming 2
"code"
"function"
"method"
"maze"
"rat"
Relationships
"love"
"read"
"relationship"
"life"
"story"
Scientific Writing
"writing"
"paper"
"english"
"improve"
Continued on next page
65

Table A.1 – continued from previous page
Courses Frequent terms
"editing"
Startup
"work"
"instance"
"command"
"idea"
"node"
Statistics
"data"
"mean"
"error"
"variable"
"example"
Useful Genetics
"gene"
"mutation"
"cells"
"allele(s)"
"Redfield"
Videogames Learning
"game(s)"
"play"
"level"
"words"
"player"
Virology
"virus(es)"
"cell"
"viral"
"host"
"genome"
Table A.1: The 5 most used specific terms found in each course
using unigrams as search feature ordered by their occurrence fre-
quency.
66