Conifers in cold environments synchronize maximum growth rate of tree-ring formation with day length
10
www.newphytologist.org 301 Research Blackwell Publishing Ltd Conifers in cold environments synchronize maximum growth rate of tree-ring formation with day length Sergio Rossi 1 , Annie Deslauriers 1,2 , Tommaso Anfodillo 1 , Hubert Morin 2 , Antonio Saracino 3 , Renzo Motta 4 and Marco Borghetti 5 1 Treeline Ecology Research Unit, Department TeSAF, University of Padova, viale dell’Università 16, 35020 Legnaro (PD), Italy; 2 Department of Fundamental Sciences, Quebec University in Chicoutimi, 55 University Boul, Québec, Canada; 3 Department of Arboriculture, Botany and Plant Pathology, University of Napoli ‘Federico II’, via Università 100, 80055 Portici (NA), Italy; 4 Department AGROSELVITER, University of Torino, via Leonardo da Vinci 44, 10095 Gruglisasco (TO), Italy; 5 Department of Crop Systems, Forestry and Environmental Sciences, University of Bailicata, via dell’Ateneo Lucano 10, 85100 Potenza, Italy Summary • Intra-annual radial growth rates and durations in trees are reported to differ greatly in relation to species, site and environmental conditions. However, very similar dynamics of cambial activity and wood formation are observed in temperate and boreal zones. • Here, we compared weekly xylem cell production and variation in stem circum- ference in the main northern hemisphere conifer species (genera Picea , Pinus , Abies and Larix ) from 1996 to 2003. Dynamics of radial growth were modeled with a Gompertz function, defining the upper asymptote ( A ), x -axis placement ( β ) and rate of change ( κ ). • A strong linear relationship was found between the constants β and κ for both types of analysis. The slope of the linear regression, which corresponds to the time at which maximum growth rate occurred, appeared to converge towards the summer solstice. • The maximum growth rate occurred around the time of maximum day length, and not during the warmest period of the year as previously suggested. The achieve- ments of photoperiod could act as a growth constraint or a limit after which the rate of tree-ring formation tends to decrease, thus allowing plants to safely complete secondary cell wall lignification before winter. Key words: conifers, intra-annual growth, photoperiod, temperature, wood, xylogenesis. New Phytologist (2006) 170 : 301–310 © The Authors (2006). Journal compilation © New Phytologist (2006) doi : 10.1111/j.1469-8137.2006.01660.x Author for correspondence: Sergio Rossi Tel: +39 049827 2745 Fax: +39 049827 2686 Email: [email protected] Received: 7 September 2005 Accepted: 26 November 2005 Introduction Annual tree-ring differentiation involves the production of cells through the phases of division, expansion, secondary wall thickening, lignification and programmed cell death (Savidge, 1996; Plomion et al., 2001). Wood formation is a highly dynamic process: the onset, rate and duration of cell differ- entiation change during the growing season as the tree ring develops, creating a complex time–space system of xylogenesis (Wodzicki, 1971; Uggla et al ., 2001; Deslauriers et al ., 2003a) precisely regulated by gene expression (Hertzberg et al ., 2001; Schrader et al., 2004), hormonal signals (Uggla et al., 1998; Schrader et al., 2003) and environmental factors (Denne, 1971, 1976; Savidge, 1996; Antonova & Stasova, 1997; Deslauriers & Morin, 2005). In European and North American conifers of cold environ- ments, tracheid production mostly occurs from May to the beginning of August (Camarero et al., 1998; Horacek et al., 1999; Deslauriers et al., 2003a; Mäkinen et al., 2003; Rossi, 2003; Schmitt et al ., 2004). During the growing season, a
Transcript of Conifers in cold environments synchronize maximum growth rate of tree-ring formation with day length

www.newphytologist.org
301
Research
Blackwell Publishing Ltd
Conifers in cold environments synchronize maximum
growth rate of tree-ring formation with day length
Sergio Rossi
1
, Annie Deslauriers
1,2
, Tommaso Anfodillo
1
, Hubert Morin
2
, Antonio Saracino
3
, Renzo Motta
4
and Marco Borghetti
5
1
Treeline Ecology Research Unit, Department TeSAF, University of Padova, viale dell’Università 16, 35020 Legnaro (PD), Italy;
2
Department of Fundamental
Sciences, Quebec University in Chicoutimi, 55 University Boul, Québec, Canada;
3
Department of Arboriculture, Botany and Plant Pathology, University
of Napoli ‘Federico II’, via Università 100, 80055 Portici (NA), Italy;
4
Department AGROSELVITER, University of Torino, via Leonardo da Vinci 44,
10095 Gruglisasco (TO), Italy;
5
Department of Crop Systems, Forestry and Environmental Sciences, University of Bailicata, via dell’Ateneo Lucano 10,
85100 Potenza, Italy
Summary
•
Intra-annual radial growth rates and durations in trees are reported to differ greatlyin relation to species, site and environmental conditions. However, very similar dynamicsof cambial activity and wood formation are observed in temperate and boreal zones.• Here, we compared weekly xylem cell production and variation in stem circum-ference in the main northern hemisphere conifer species (genera
Picea
,
Pinus
,
Abies
and
Larix
) from 1996 to 2003. Dynamics of radial growth were modeled with aGompertz function, defining the upper asymptote (
A
),
x
-axis placement (
β
) and rateof change (
κ
).• A strong linear relationship was found between the constants
β
and
κ
for bothtypes of analysis. The slope of the linear regression, which corresponds to the timeat which maximum growth rate occurred, appeared to converge towards thesummer solstice.• The maximum growth rate occurred around the time of maximum day length, andnot during the warmest period of the year as previously suggested. The achieve-ments of photoperiod could act as a growth constraint or a limit after which the rateof tree-ring formation tends to decrease, thus allowing plants to safely completesecondary cell wall lignification before winter.
Key words:
conifers, intra-annual growth, photoperiod, temperature, wood,xylogenesis.
New Phytologist
(2006)
170
: 301–310
© The Authors (2006). Journal compilation ©
New Phytologist
(2006)
doi
: 10.1111/j.1469-8137.2006.01660.x
Author for correspondence:
Sergio Rossi Tel: +39 049827 2745 Fax: +39 049827 2686 Email: [email protected]
Received:
7 September 2005
Accepted:
26 November 2005
Introduction
Annual tree-ring differentiation involves the production ofcells through the phases of division, expansion, secondary wallthickening, lignification and programmed cell death (Savidge,1996; Plomion
et al
., 2001). Wood formation is a highlydynamic process: the onset, rate and duration of cell differ-entiation change during the growing season as the tree ringdevelops, creating a complex time–space system of xylogenesis(Wodzicki, 1971; Uggla
et al
., 2001; Deslauriers
et al
., 2003a)
precisely regulated by gene expression (Hertzberg
et al
., 2001;Schrader
et al
., 2004), hormonal signals (Uggla
et al
., 1998;Schrader
et al
., 2003) and environmental factors (Denne,1971, 1976; Savidge, 1996; Antonova & Stasova, 1997;Deslauriers & Morin, 2005).
In European and North American conifers of cold environ-ments, tracheid production mostly occurs from May to thebeginning of August (Camarero
et al
., 1998; Horacek
et al
.,1999; Deslauriers
et al
., 2003a; Mäkinen
et al
., 2003; Rossi,2003; Schmitt
et al
., 2004). During the growing season, a
New Phytologist
(2006)
170
: 301–310
www.newphytologist.org
© The Authors (2006). Journal compilation ©
New Phytologist
(2006)
Research302
certain variability exists in the onset and rate of growth causedby different intra-annual weather conditions. At the same site,the onset of cambium activity can vary considerably, fromthe beginning of May to June (Deslauriers
et al
., 2003a; Rossi,2003), depending on the timing of snow melt and the rise ofair and soil temperature (Vaganov
et al
., 1999). In a borealforest of North America, it was found that equivalent num-bers of cells were produced with a faster growth rate over ashorter period and with a slower growth rate over a longerperiod (Gregory & Wilson, 1968; Deslauriers & Morin,2005).
Despite this variability and the wide diversity that existsamongst geographical locations and species, the annual stemgrowth trends observed in temperate and cold areas of thenorthern hemisphere are very similar: a positive exponentialgrowing phase is followed by a phase in which growth ratedecreases, resulting in an S-shaped pattern (Ford
et al
., 1978;Horacek
et al
., 1999; Deslauriers
et al
., 2003b; Schmitt
et al
.,2004). This trend is typical of all biological limiting growthprocesses and is fixed in ontogeny (Klingenberg, 1998). Fromthe annual growth pattern, three important phenologicaltraits can be determined: the onset of growth, the time ofmaximum growth corresponding to the moment of transitionfrom growth acceleration to growth deceleration (analyticallydefined as the inflection point), and the period of growth rest.The activation of plants in spring and their entry into dor-mancy have been widely studied and related to temperatureand photoperiod (Heide, 1993; Partanen
et al
., 1998; Chuine& Cour, 1999; Kramer
et al
., 2000; Partanen
et al
., 2001),but no study has been specifically dedicated to understandingthe timing and possible variability of maximum growth rate.
The assessment of this phenological trait is important forunderstanding the impact of delays or early onsets on the tim-ing and duration of both exponential phases of the sigmoidpattern. A variation of the annual maximum growth ratealong the time axis, because of early or late onset, would reflectthe ability of the species to exploit favourable climatic condi-tions, for example high temperatures, during the growingseason. Recently, Mäkinen
et al
. (2003) proposed that the annualmaximum growth rate of
Picea abies
Karst L. in Finland wasregulated by temperature, as xylem formation occurred mostrapidly in the first 10 d of July, corresponding to the highesttemperatures observed during the year. Several authors alsoobserved higher wood formation rates around June to July(Deslauriers
et al
., 2003a; McCarroll
et al
., 2003; Schmitt
et al
., 2004). However, independently of variation in theonset of wood formation, after the end of cell division andenlargement, all tracheids must also complete the depositionof secondary wall polysaccharides and lignification by lateautumn (Gindl
et al
., 2000; Gri
c
ar
et al.
, 2005). Therefore, thetemporal variability in the signals positioning the culminationof cell division should be low and this culmination shouldoccur early enough in the growing season to leave a safe timemargin for latewood lignification.
This paper presents the first study of the timing of maxi-mum growth rate in wood formation in the main Europeanand North American conifers. We tested the hypothesis thatmaximum growth rate is invariant in time for all species andlatitudes considered, by modelling annual tree growth withthe Gompertz equation. This invariance is predicted becausetiming of maximum growth rate should be within tight limits,ensuring both optimal temperature conditions and full cellmaturation. To verify this hypothesis, a very large data set wascollected, unique to the type of measurement used, the periodof analysis and the variety of species included. In order tocross-validate the results for annual growth patterns, bothxylem cell analysis (XCA), evaluating cambium activity in termsof weekly total tracheid production (Deslauriers
et al
., 2003a),and automatic dendrometer measurement (ADM), assessingvariation in stem size (Deslauriers
et al
., 2003b), were used.
Materials and Methods
Study areas
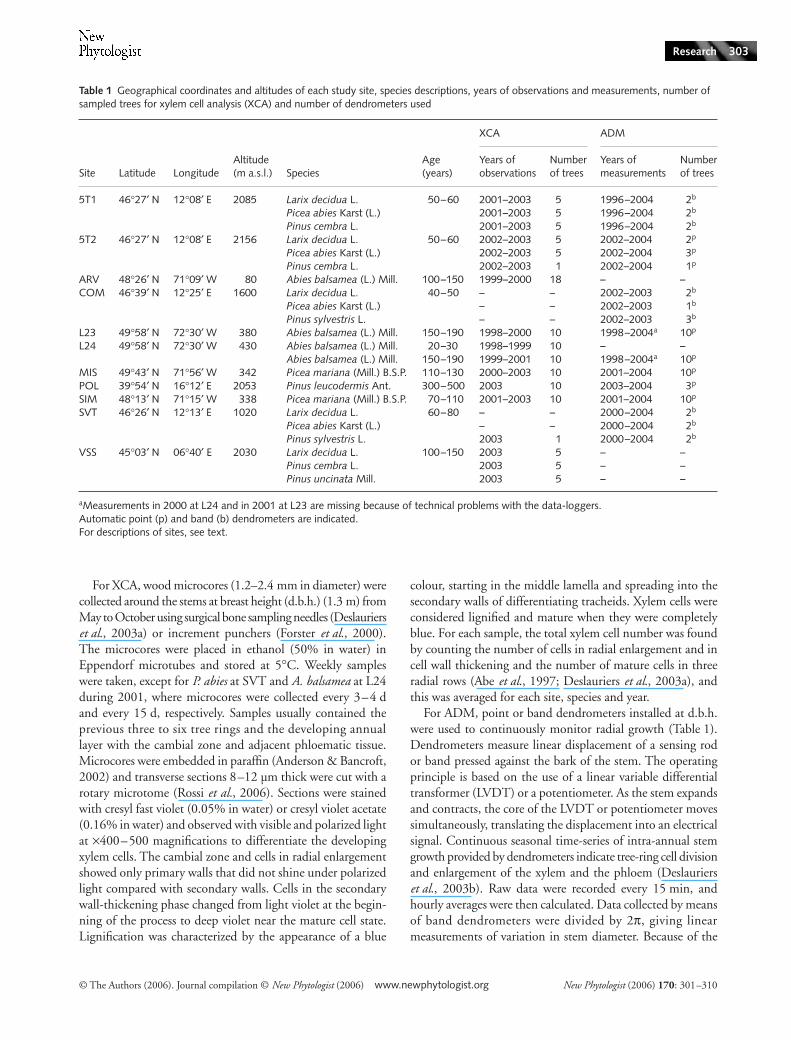
Data were collected from several conifer species (see Table 1for the species used) from high-altitude environments in Italy[5 Torri 1 (abbreviated as 5T1), 5 Torri 2 (5T2), Comelico(COM), San Vito (SVT), Pollino (POL) and Val di Susa(VSS)] and from the Canadian boreal forest [Arvida (ARV),Liberal 23 (L23), Liberal 24 (L24), Simoncouche (SIM) andMistassibi (MIS)] (Table 1). In Italy, the sites were locatedbetween 39
°
and 46
°
N and from 1000 to 2200 m above sealevel (a.s.l.). Sites 5T1, 5T2, COM and SVT were locatedin the eastern Italian Alps. 5T1 and 5T2 were areas locatedclose together in the timberline ecotone with southern andnorthern exposure, respectively, and had a mixed openstructure. Sites COM and SVT were both mixed forest stands.VSS was located at a subalpine level near the upper timberlinein the western Italian Alps. POL was located in a treeline areaof southern Italy and contained isolated trees growing oncliffs. In Canada, the sites were located in the province ofQuébec between 48
°
and 50
°
N. ARV was an urban forest onthe upper border of the Saguenay River (Ville de Saguenay)included in Saucier’s (1999) forest zone 4e. SIM and MISwere permanent plots of black spruce in the area of Saguenay-Lake Saint-Jean, included in ecological regions 5d and 6h(Saucier, 1999), respectively. L23 and L24 were located
c
. 100 km north of Lake Saint-Jean and consisted of twopermanent plots of
Abies balsamea
included in Saucier’s(1999) ecological regions 6e and 6h, respectively.
Data collection
The intra-annual dynamics of tree-ring formation werestudied by XCA and ADM in several species during the1996–2003 growing seasons, assessing xylem cell productionand radial growth in the stem, respectively (Table 1).
© The Authors (2006). Journal compilation ©
New Phytologist
(2006)
www.newphytologist.org
New Phytologist
(2006)
170
: 301–310
Research 303
For XCA, wood microcores (1.2–2.4 mm in diameter) werecollected around the stems at breast height (d.b.h.) (1.3 m) fromMay to October using surgical bone sampling needles (Deslauriers
et al
., 2003a) or increment punchers (Forster
et al
., 2000).The microcores were placed in ethanol (50% in water) inEppendorf microtubes and stored at 5
°
C. Weekly sampleswere taken, except for
P. abies
at SVT and
A. balsamea
at L24during 2001, where microcores were collected every 3–4 dand every 15 d, respectively. Samples usually contained theprevious three to six tree rings and the developing annuallayer with the cambial zone and adjacent phloematic tissue.Microcores were embedded in paraffin (Anderson & Bancroft,2002) and transverse sections 8–12 µm thick were cut with arotary microtome (Rossi
et al.
, 2006). Sections were stainedwith cresyl fast violet (0.05% in water) or cresyl violet acetate(0.16% in water) and observed with visible and polarized lightat
×
400–500 magnifications to differentiate the developingxylem cells. The cambial zone and cells in radial enlargementshowed only primary walls that did not shine under polarizedlight compared with secondary walls. Cells in the secondarywall-thickening phase changed from light violet at the begin-ning of the process to deep violet near the mature cell state.Lignification was characterized by the appearance of a blue
colour, starting in the middle lamella and spreading into thesecondary walls of differentiating tracheids. Xylem cells wereconsidered lignified and mature when they were completelyblue. For each sample, the total xylem cell number was foundby counting the number of cells in radial enlargement and incell wall thickening and the number of mature cells in threeradial rows (Abe
et al
., 1997; Deslauriers
et al
., 2003a), andthis was averaged for each site, species and year.
For ADM, point or band dendrometers installed at d.b.h.were used to continuously monitor radial growth (Table 1).Dendrometers measure linear displacement of a sensing rodor band pressed against the bark of the stem. The operatingprinciple is based on the use of a linear variable differentialtransformer (LVDT) or a potentiometer. As the stem expandsand contracts, the core of the LVDT or potentiometer movessimultaneously, translating the displacement into an electricalsignal. Continuous seasonal time-series of intra-annual stemgrowth provided by dendrometers indicate tree-ring cell divisionand enlargement of the xylem and the phloem (Deslauriers
et al
., 2003b). Raw data were recorded every 15 min, andhourly averages were then calculated. Data collected by meansof band dendrometers were divided by 2
π
, giving linearmeasurements of variation in stem diameter. Because of the
Table 1 Geographical coordinates and altitudes of each study site, species descriptions, years of observations and measurements, number of sampled trees for xylem cell analysis (XCA) and number of dendrometers used
Site Latitude LongitudeAltitude (m a.s.l.) Species
Age (years)
XCA ADM
Years of observations
Number of trees
Years of measurements
Number of trees
5T1 46°27′ N 12°08′ E 2085 Larix decidua L. 50–60 2001–2003 5 1996–2004 2b
Picea abies Karst (L.) 2001–2003 5 1996–2004 2b Pinus cembra L. 2001–2003 5 1996–2004 2b
5T2 46°27′ N 12°08′ E 2156 Larix decidua L. 50–60 2002–2003 5 2002–2004 2p
Picea abies Karst (L.) 2002–2003 5 2002–2004 3p Pinus cembra L. 2002–2003 1 2002–2004 1p
ARV 48°26′ N 71°09′ W 80 Abies balsamea (L.) Mill. 100–150 1999–2000 18 – –COM 46°39′ N 12°25′ E 1600 Larix decidua L. 40–50 – – 2002–2003 2b
Picea abies Karst (L.) – – 2002–2003 1b Pinus sylvestris L. – – 2002–2003 3b
L23 49°58′ N 72°30′ W 380 Abies balsamea (L.) Mill. 150–190 1998–2000 10 1998–2004a 10p
L24 49°58′ N 72°30′ W 430 Abies balsamea (L.) Mill. 20–30 1998–1999 10 – –Abies balsamea (L.) Mill. 150–190 1999–2001 10 1998–2004a 10p
MIS 49°43′ N 71°56′ W 342 Picea mariana (Mill.) B.S.P. 110–130 2000–2003 10 2001–2004 10p
POL 39°54′ N 16°12′ E 2053 Pinus leucodermis Ant. 300–500 2003 10 2003–2004 3p
SIM 48°13′ N 71°15′ W 338 Picea mariana (Mill.) B.S.P. 70–110 2001–2003 10 2001–2004 10p
SVT 46°26′ N 12°13′ E 1020 Larix decidua L. 60–80 – – 2000–2004 2b
Picea abies Karst (L.) – – 2000–2004 2b Pinus sylvestris L. 2003 1 2000–2004 2b
VSS 45°03′ N 06°40′ E 2030 Larix decidua L. 100–150 2003 5 – –Pinus cembra L. 2003 5 – –Pinus uncinata Mill. 2003 5 – –
aMeasurements in 2000 at L24 and in 2001 at L23 are missing because of technical problems with the data-loggers.Automatic point (p) and band (b) dendrometers are indicated.For descriptions of sites, see text.
New Phytologist (2006) 170: 301–310 www.newphytologist.org © The Authors (2006). Journal compilation © New Phytologist (2006)
Research304
unequal data collection intervals, growth curves obtained byXCA and ADM included different numbers of measurements.For dendrometer measurements, weekly averages were used toharmonize the two data sets.
Fitting of growth curves
Both XCA and ADM growth data were modelled with aGompertz function using the nonlinear regression (NLIN)procedure with the Marquardt iterative method in the SASstatistical package (SAS Institute, Cary, NC, USA) (Motulsky& Ransnas, 1987). Of the various sigmoid models available todescribe limiting growth processes, the Gompertz equation isthe most appropriate because of its flexibility and asymmetricalshape (Zeide, 1993). It was therefore used to fit growth datato assess the overall dynamics of radial growth (Camareroet al., 1998; Deslauriers et al., 2003a; Mäkinen et al., 2003;Rossi et al., 2003).
The Gompertz function was defined as:
Eqn 1
[y, weekly cumulative sum of cells (XCA) or stem increment(ADM); t, time (expressed as day of the year); A, upperasymptote (maximum growth expressed as cell number ortree-ring width); β, x-axis placement parameter; κ, rate ofchange of shape (Rossi et al., 2003).]
The residuals were regressed on the model partial deriva-tives with respect to the Gompertz parameters until theestimates converged. Several possible starting values werespecified for each parameter, so that the NLIN procedureevaluated each combination of initial values using the inter-actions producing the smallest residual sums of squares. Toevaluate the general goodness-of-fit of each regression, theproportion of variation accounted for (R2), the standard errorsand linearity of each parameter and the distribution ofthe residuals were calculated (Motulsky & Ransnas, 1987;Ratkowsky, 1990; Draper & Smith, 1998).
Timing and variability of maximum growth rates
In the Gompertz function, the inflection point correspondsto the culmination of growth rate and the maximum valueachieved by the first derivative, defined as:
Eqn 2
The placement of the inflection point on the horizontal axis(tp) occurs where the second derivative is equal to 0, that is:
Eqn 3
and then when tp = β/κ. According to the hypothesis thatmaximum growth rate is invariant in time, the inflection
points should occur in the same period of the year and theβ/κ ratio should be equal to a constant, called Tp, and so
β = κ Tp Eqn 4
Within-species variability of specific tp values (Tables 2 and 3)was assessed by Student’s t-test for mean location.
Results
Evaluation of the fitting
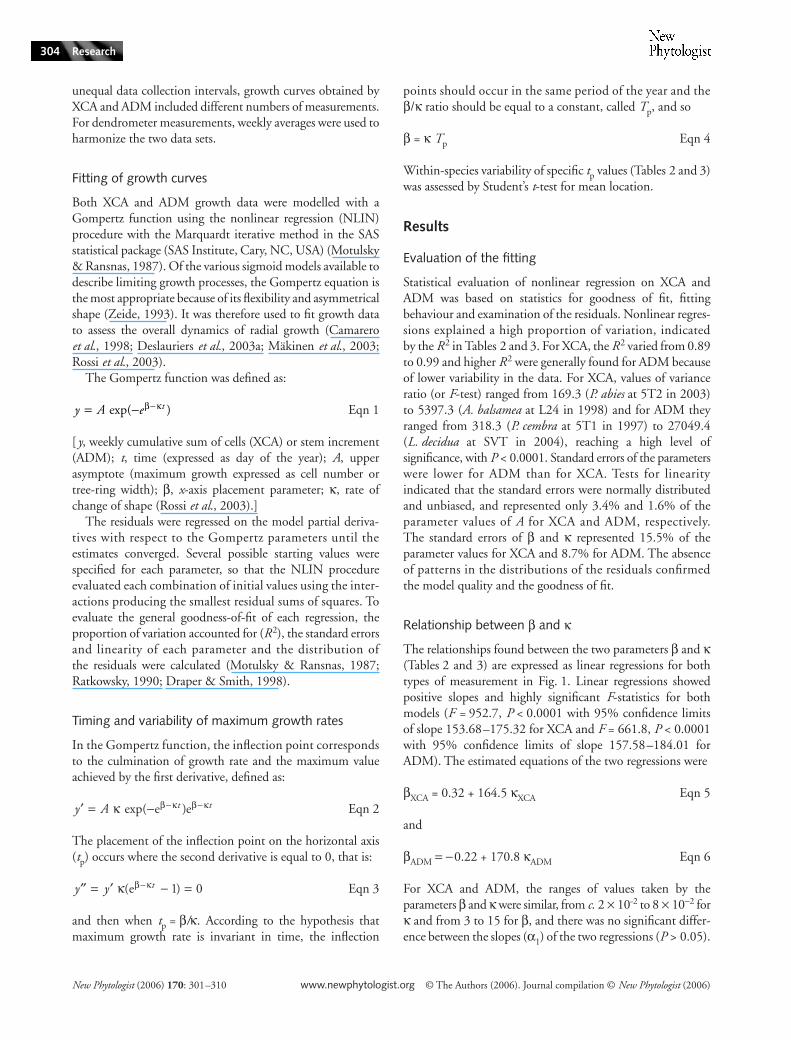
Statistical evaluation of nonlinear regression on XCA andADM was based on statistics for goodness of fit, fittingbehaviour and examination of the residuals. Nonlinear regres-sions explained a high proportion of variation, indicatedby the R2 in Tables 2 and 3. For XCA, the R2 varied from 0.89to 0.99 and higher R2 were generally found for ADM becauseof lower variability in the data. For XCA, values of varianceratio (or F-test) ranged from 169.3 (P. abies at 5T2 in 2003)to 5397.3 (A. balsamea at L24 in 1998) and for ADM theyranged from 318.3 (P. cembra at 5T1 in 1997) to 27049.4(L. decidua at SVT in 2004), reaching a high level ofsignificance, with P < 0.0001. Standard errors of the parameterswere lower for ADM than for XCA. Tests for linearityindicated that the standard errors were normally distributedand unbiased, and represented only 3.4% and 1.6% of theparameter values of A for XCA and ADM, respectively.The standard errors of β and κ represented 15.5% of theparameter values for XCA and 8.7% for ADM. The absenceof patterns in the distributions of the residuals confirmedthe model quality and the goodness of fit.
Relationship between β and κ
The relationships found between the two parameters β and κ(Tables 2 and 3) are expressed as linear regressions for bothtypes of measurement in Fig. 1. Linear regressions showedpositive slopes and highly significant F-statistics for bothmodels (F = 952.7, P < 0.0001 with 95% confidence limitsof slope 153.68–175.32 for XCA and F = 661.8, P < 0.0001with 95% confidence limits of slope 157.58–184.01 forADM). The estimated equations of the two regressions were
βXCA = 0.32 + 164.5 κXCA Eqn 5
and
βADM = −0.22 + 170.8 κADM Eqn 6
For XCA and ADM, the ranges of values taken by theparameters β and κ were similar, from c. 2 × 10⁻² to 8 × 10⁻² forκ and from 3 to 15 for β, and there was no significant differ-ence between the slopes (α1) of the two regressions (P > 0.05).
y A e t exp( )= − −β κ
′ = − − −y A t t exp( )κ β κ β κe e
′′ = ′ − =−y y t ( ) κ β κe 1 0
© The Authors (2006). Journal compilation © New Phytologist (2006) www.newphytologist.org New Phytologist (2006) 170: 301–310
Research 305
Timing and variability of maximum growth rate
In Eqns 5 and 6, the intercepts (α0) have a minimal influenceon the variables βXCA and βADM as the weight of α0 on the β-values is lower than 10%. In addition, the 95% confidencelimits of the intercepts (α0) ranged between −0.25 and 0.89for XCA and between −0.84 and 0.39 for ADM. α0 was notsignificantly different from 0 (P > 0.05), with F-values of 1.28and 0.53 for XCA and ADM, respectively. Therefore, Eqns 5and 6 can be approximated as β ~ α1 κ and, consequently,Tp = β/κ ~ α1 corresponding to the slope of the regressions,
the placement of the inflection point on the horizontalaxis and the time at which growth culmination occurs.The maximum growth rate for all the Gompertz equationsmodelled for XCA and ADM (Tables 2 and 3) thereforeoccurred in the same period of the year. Maximum growthrate occurred at 164.5 d for XCA and at 170.8 d for ADM,corresponding to 13–14 and 19–20 June, respectively. Theannual growth rates for different species and years measuredwith both techniques are illustrated in Fig. 2(a,b). When thecurves were represented as their first derivative, growth rateculmination occurred within a limited period (grey bands in
Table 2 Parameters of the Gompertz function and R2 for all models fitted by nonlinear regressions for xylem cell analysis (XCA) and tp values corresponding to the times of the inflection point
Site Species Year
Parameter
R2 tpA β κ (10−2)
5T1 Larix decidua 2001 44.98 (2.74) 5.43 (0.87) 3.06 (0.51) 0.95 177.62002 36.36 (0.85) 8.72 (0.94) 4.93 (0.53) 0.98 176.92003 50.89 (1.68) 10.51 (1.75) 6.10 (1.01) 0.96 172.4
Picea abies 2001 75.36 (1.91) 7.82 (0.76) 4.42 (0.43) 0.98 177.02002 60.82 (1.41) 8.54 (0.9) 4.85 (0.51) 0.97 176.12003 70.57 (1.77) 10.27 (1.38) 6.18 (0.82) 0.97 166.1
Pinus cembra 2001 56.50 (2.43) 5.78 (0.93) 3.57 (0.58) 0.93 162.02002 49.11 (1.82) 7.01 (1.06) 4.10 (0.62) 0.95 171.12003 59.71 (2.19) 9.71 (2.01) 6.13 (1.26) 0.94 158.5
5T2 Larix decidua 2002 31.52 (0.69) 13.02 (1.81) 7.39 (1.02) 0.97 176.12003 38.50 (1.43) 11.52 (2.42) 6.84 (1.43) 0.94 168.4
Picea abies 2002 45.42 (2.12) 10.17 (2.44) 5.71 (1.37) 0.91 178.12003 56.06 (3.07) 13.11 (4.43) 7.80 (2.62) 0.89 168.0
Pinus cembra 2002 40.57 (1.39) 9.42 (1.75) 5.62 (1.04) 0.93 167.72003 49.82 (1.93) 7.97 (1.50) 5.03 (0.94) 0.94 158.6
ARV Abies balsamea 1999 38.73 (0.74) 8.58 (1.09) 5.47 (0.67) 0.95 157.02000 44.38 (1.25) 7.28 (0.80) 4.17 (0.46) 0.97 174.6
L23 Abies balsamea 1998 37.08 (0.75) 10.92 (1.25) 6.54 (0.74) 0.97 167.01999 37.01 (1.15) 9.06 (1.37) 5.42 (0.81) 0.96 167.22000 38.73 (1.99) 9.93 (2.19) 5.51 (1.22) 0.93 180.2
L24 Abies balsamea 1998a 51.21 (0.56) 8.95 (0.50) 5.49 (0.30) 0.99 162.91999a 51.22 (0.90) 6.82 (0.44) 4.04 (0.26) 0.99 169.01999 42.02 (0.62) 9.49 (0.68) 5.57 (0.40) 0.99 170.52000 46.13 (2.00) 9.41 (1.55) 5.09 (0.84) 0.96 184.92001 45.49 (2.24) 8.90 (1.96) 5.20 (1.14) 0.96 171.2
MIS Picea mariana 2000 15.22 (0.55) 12.11 (1.99) 6.55 (1.08) 0.96 185.12001 19.66 (0.93) 8.95 (1.86) 5.20 (1.09) 0.90 172.12002 21.81 (0.70) 5.50 (0.42) 2.92 (0.23) 0.98 188.52003 20.55 (0.61) 6.19 (0.57) 3.46 (0.33) 0.98 179.2
POL Pinus leucodermis 2003 26.53 (1.72) 6.16 (1.33) 3.53 (0.78) 0.91 174.3SIM Picea mariana 2001 38.87 (0.87) 5.11 (0.28) 2.85 (0.16) 0.99 179.7
2002 36.58 (0.99) 6.35 (0.53) 3.46 (0.30) 0.98 183.82003 29.38 (1.03) 7.89 (1.20) 4.56 (0.69) 0.96 173.0
SVT Picea abies 2003 91.10 (4.14) 6.61 (1.41) 4.17 (0.89) 0.89 158.5VSS Larix decidua 2003 21.84 (1.05) 14.27 (4.64) 8.3 (2.67) 0.89 171.9
Pinus cembra 2003 39.72 (1.04) 10.00 (1.64) 6.45 (1.05) 0.95 155.2Pinus uncinata 2003 32.32 (0.70) 8.15 (0.92) 5.16 (0.57) 0.97 158.1
Values in parentheses represent the standard error of the estimated parameters.For site descriptions, see text.A, the upper asymptote; β, x-axis placement; κ, rate of change.aYoung trees.
New Phytologist (2006) 170: 301–310 www.newphytologist.org © The Authors (2006). Journal compilation © New Phytologist (2006)
Research306
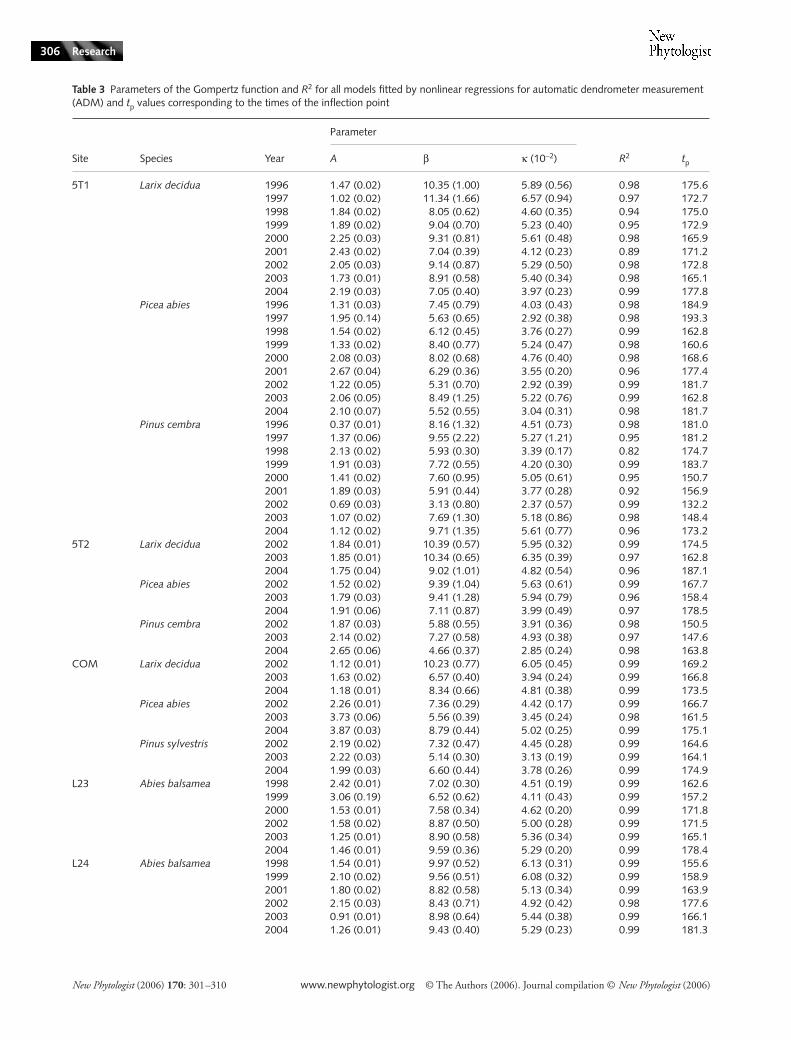
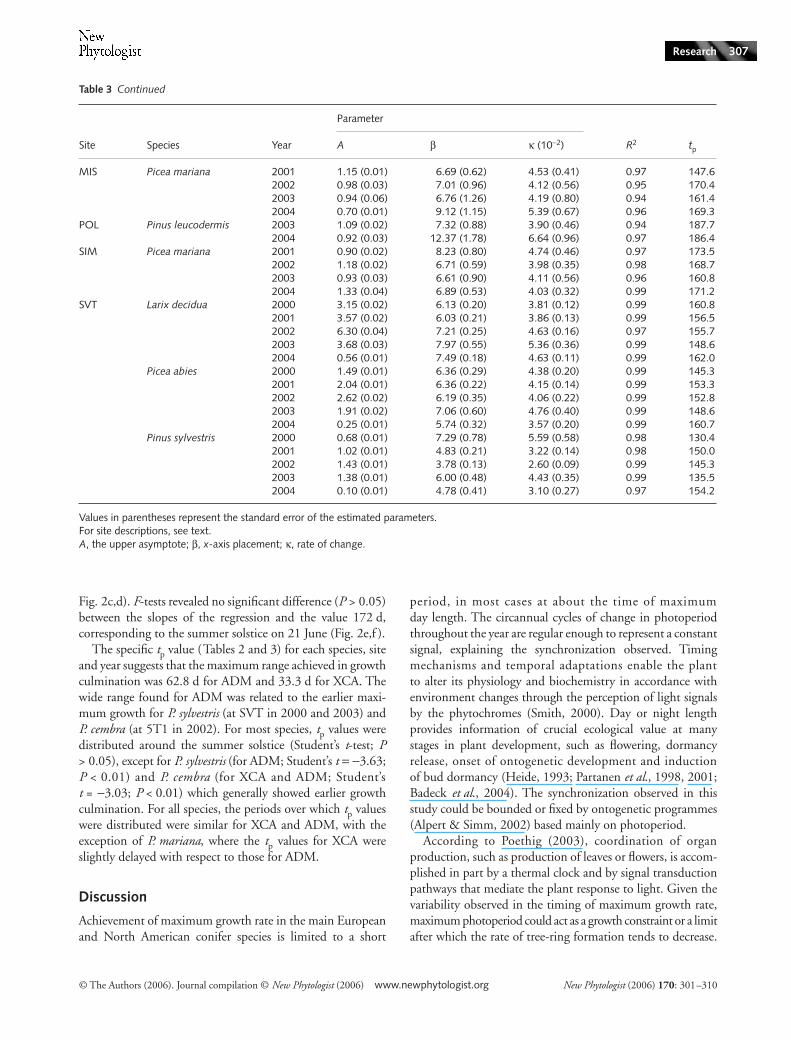
Table 3 Parameters of the Gompertz function and R2 for all models fitted by nonlinear regressions for automatic dendrometer measurement (ADM) and tp values corresponding to the times of the inflection point
Site Species Year
Parameter
R2 tpA β κ (10−2)
5T1 Larix decidua 1996 1.47 (0.02) 10.35 (1.00) 5.89 (0.56) 0.98 175.61997 1.02 (0.02) 11.34 (1.66) 6.57 (0.94) 0.97 172.71998 1.84 (0.02) 8.05 (0.62) 4.60 (0.35) 0.94 175.01999 1.89 (0.02) 9.04 (0.70) 5.23 (0.40) 0.95 172.92000 2.25 (0.03) 9.31 (0.81) 5.61 (0.48) 0.98 165.92001 2.43 (0.02) 7.04 (0.39) 4.12 (0.23) 0.89 171.22002 2.05 (0.03) 9.14 (0.87) 5.29 (0.50) 0.98 172.82003 1.73 (0.01) 8.91 (0.58) 5.40 (0.34) 0.98 165.12004 2.19 (0.03) 7.05 (0.40) 3.97 (0.23) 0.99 177.8
Picea abies 1996 1.31 (0.03) 7.45 (0.79) 4.03 (0.43) 0.98 184.91997 1.95 (0.14) 5.63 (0.65) 2.92 (0.38) 0.98 193.31998 1.54 (0.02) 6.12 (0.45) 3.76 (0.27) 0.99 162.81999 1.33 (0.02) 8.40 (0.77) 5.24 (0.47) 0.98 160.62000 2.08 (0.03) 8.02 (0.68) 4.76 (0.40) 0.98 168.62001 2.67 (0.04) 6.29 (0.36) 3.55 (0.20) 0.96 177.42002 1.22 (0.05) 5.31 (0.70) 2.92 (0.39) 0.99 181.72003 2.06 (0.05) 8.49 (1.25) 5.22 (0.76) 0.99 162.82004 2.10 (0.07) 5.52 (0.55) 3.04 (0.31) 0.98 181.7
Pinus cembra 1996 0.37 (0.01) 8.16 (1.32) 4.51 (0.73) 0.98 181.01997 1.37 (0.06) 9.55 (2.22) 5.27 (1.21) 0.95 181.21998 2.13 (0.02) 5.93 (0.30) 3.39 (0.17) 0.82 174.71999 1.91 (0.03) 7.72 (0.55) 4.20 (0.30) 0.99 183.72000 1.41 (0.02) 7.60 (0.95) 5.05 (0.61) 0.95 150.72001 1.89 (0.03) 5.91 (0.44) 3.77 (0.28) 0.92 156.92002 0.69 (0.03) 3.13 (0.80) 2.37 (0.57) 0.99 132.22003 1.07 (0.02) 7.69 (1.30) 5.18 (0.86) 0.98 148.42004 1.12 (0.02) 9.71 (1.35) 5.61 (0.77) 0.96 173.2
5T2 Larix decidua 2002 1.84 (0.01) 10.39 (0.57) 5.95 (0.32) 0.99 174.52003 1.85 (0.01) 10.34 (0.65) 6.35 (0.39) 0.97 162.82004 1.75 (0.04) 9.02 (1.01) 4.82 (0.54) 0.96 187.1
Picea abies 2002 1.52 (0.02) 9.39 (1.04) 5.63 (0.61) 0.99 167.72003 1.79 (0.03) 9.41 (1.28) 5.94 (0.79) 0.96 158.42004 1.91 (0.06) 7.11 (0.87) 3.99 (0.49) 0.97 178.5
Pinus cembra 2002 1.87 (0.03) 5.88 (0.55) 3.91 (0.36) 0.98 150.52003 2.14 (0.02) 7.27 (0.58) 4.93 (0.38) 0.97 147.62004 2.65 (0.06) 4.66 (0.37) 2.85 (0.24) 0.98 163.8
COM Larix decidua 2002 1.12 (0.01) 10.23 (0.77) 6.05 (0.45) 0.99 169.22003 1.63 (0.02) 6.57 (0.40) 3.94 (0.24) 0.99 166.82004 1.18 (0.01) 8.34 (0.66) 4.81 (0.38) 0.99 173.5
Picea abies 2002 2.26 (0.01) 7.36 (0.29) 4.42 (0.17) 0.99 166.72003 3.73 (0.06) 5.56 (0.39) 3.45 (0.24) 0.98 161.52004 3.87 (0.03) 8.79 (0.44) 5.02 (0.25) 0.99 175.1
Pinus sylvestris 2002 2.19 (0.02) 7.32 (0.47) 4.45 (0.28) 0.99 164.62003 2.22 (0.03) 5.14 (0.30) 3.13 (0.19) 0.99 164.12004 1.99 (0.03) 6.60 (0.44) 3.78 (0.26) 0.99 174.9
L23 Abies balsamea 1998 2.42 (0.01) 7.02 (0.30) 4.51 (0.19) 0.99 162.61999 3.06 (0.19) 6.52 (0.62) 4.11 (0.43) 0.99 157.22000 1.53 (0.01) 7.58 (0.34) 4.62 (0.20) 0.99 171.82002 1.58 (0.02) 8.87 (0.50) 5.00 (0.28) 0.99 171.52003 1.25 (0.01) 8.90 (0.58) 5.36 (0.34) 0.99 165.12004 1.46 (0.01) 9.59 (0.36) 5.29 (0.20) 0.99 178.4
L24 Abies balsamea 1998 1.54 (0.01) 9.97 (0.52) 6.13 (0.31) 0.99 155.61999 2.10 (0.02) 9.56 (0.51) 6.08 (0.32) 0.99 158.92001 1.80 (0.02) 8.82 (0.58) 5.13 (0.34) 0.99 163.92002 2.15 (0.03) 8.43 (0.71) 4.92 (0.42) 0.98 177.62003 0.91 (0.01) 8.98 (0.64) 5.44 (0.38) 0.99 166.12004 1.26 (0.01) 9.43 (0.40) 5.29 (0.23) 0.99 181.3
© The Authors (2006). Journal compilation © New Phytologist (2006) www.newphytologist.org New Phytologist (2006) 170: 301–310
Research 307
MIS Picea mariana 2001 1.15 (0.01) 6.69 (0.62) 4.53 (0.41) 0.97 147.62002 0.98 (0.03) 7.01 (0.96) 4.12 (0.56) 0.95 170.42003 0.94 (0.06) 6.76 (1.26) 4.19 (0.80) 0.94 161.42004 0.70 (0.01) 9.12 (1.15) 5.39 (0.67) 0.96 169.3
POL Pinus leucodermis 2003 1.09 (0.02) 7.32 (0.88) 3.90 (0.46) 0.94 187.72004 0.92 (0.03) 12.37 (1.78) 6.64 (0.96) 0.97 186.4
SIM Picea mariana 2001 0.90 (0.02) 8.23 (0.80) 4.74 (0.46) 0.97 173.52002 1.18 (0.02) 6.71 (0.59) 3.98 (0.35) 0.98 168.72003 0.93 (0.03) 6.61 (0.90) 4.11 (0.56) 0.96 160.82004 1.33 (0.04) 6.89 (0.53) 4.03 (0.32) 0.99 171.2
SVT Larix decidua 2000 3.15 (0.02) 6.13 (0.20) 3.81 (0.12) 0.99 160.82001 3.57 (0.02) 6.03 (0.21) 3.86 (0.13) 0.99 156.52002 6.30 (0.04) 7.21 (0.25) 4.63 (0.16) 0.97 155.72003 3.68 (0.03) 7.97 (0.55) 5.36 (0.36) 0.99 148.62004 0.56 (0.01) 7.49 (0.18) 4.63 (0.11) 0.99 162.0
Picea abies 2000 1.49 (0.01) 6.36 (0.29) 4.38 (0.20) 0.99 145.32001 2.04 (0.01) 6.36 (0.22) 4.15 (0.14) 0.99 153.32002 2.62 (0.02) 6.19 (0.35) 4.06 (0.22) 0.99 152.82003 1.91 (0.02) 7.06 (0.60) 4.76 (0.40) 0.99 148.62004 0.25 (0.01) 5.74 (0.32) 3.57 (0.20) 0.99 160.7
Pinus sylvestris 2000 0.68 (0.01) 7.29 (0.78) 5.59 (0.58) 0.98 130.42001 1.02 (0.01) 4.83 (0.21) 3.22 (0.14) 0.98 150.02002 1.43 (0.01) 3.78 (0.13) 2.60 (0.09) 0.99 145.32003 1.38 (0.01) 6.00 (0.48) 4.43 (0.35) 0.99 135.52004 0.10 (0.01) 4.78 (0.41) 3.10 (0.27) 0.97 154.2
Values in parentheses represent the standard error of the estimated parameters.For site descriptions, see text.A, the upper asymptote; β, x-axis placement; κ, rate of change.
Site Species Year
Parameter
R2 tpA β κ (10−2)
Table 3 Continued
Fig. 2c,d). F-tests revealed no significant difference (P > 0.05)between the slopes of the regression and the value 172 d,corresponding to the summer solstice on 21 June (Fig. 2e,f ).
The specific tp value (Tables 2 and 3) for each species, siteand year suggests that the maximum range achieved in growthculmination was 62.8 d for ADM and 33.3 d for XCA. Thewide range found for ADM was related to the earlier maxi-mum growth for P. sylvestris (at SVT in 2000 and 2003) andP. cembra (at 5T1 in 2002). For most species, tp values weredistributed around the summer solstice (Student’s t-test; P> 0.05), except for P. sylvestris (for ADM; Student’s t = −3.63;P < 0.01) and P. cembra (for XCA and ADM; Student’st = −3.03; P < 0.01) which generally showed earlier growthculmination. For all species, the periods over which tp valueswere distributed were similar for XCA and ADM, with theexception of P. mariana, where the tp values for XCA wereslightly delayed with respect to those for ADM.
Discussion
Achievement of maximum growth rate in the main Europeanand North American conifer species is limited to a short
period, in most cases at about the time of maximumday length. The circannual cycles of change in photoperiodthroughout the year are regular enough to represent a constantsignal, explaining the synchronization observed. Timingmechanisms and temporal adaptations enable the plantto alter its physiology and biochemistry in accordance withenvironment changes through the perception of light signalsby the phytochromes (Smith, 2000). Day or night lengthprovides information of crucial ecological value at manystages in plant development, such as flowering, dormancyrelease, onset of ontogenetic development and inductionof bud dormancy (Heide, 1993; Partanen et al., 1998, 2001;Badeck et al., 2004). The synchronization observed in thisstudy could be bounded or fixed by ontogenetic programmes(Alpert & Simm, 2002) based mainly on photoperiod.
According to Poethig (2003), coordination of organproduction, such as production of leaves or flowers, is accom-plished in part by a thermal clock and by signal transductionpathways that mediate the plant response to light. Given thevariability observed in the timing of maximum growth rate,maximum photoperiod could act as a growth constraint or a limitafter which the rate of tree-ring formation tends to decrease.
New Phytologist (2006) 170: 301–310 www.newphytologist.org © The Authors (2006). Journal compilation © New Phytologist (2006)
Research308
By regression, the inflection point was placed slightly beforethe maximum photoperiod, and only nine tp values out of 119(7%) were at the beginning of July. Maximum growth rateoccurred more frequently before than after the maximumphotoperiod. Effects of other environmental factors, such astemperature, on the variation observed in the maximumgrowth response are not excluded and remain to be preciselyevaluated for specific sites and species.
The findings of this study indicate that XCA and ADMprovide similar results for the timing of the inflection point ofannual stem growth, demonstrating that stem shrinking andswelling caused by water storage variation (Zweifel & Häsler,2001) have a minimal influence. If water stress occurs inlate spring or early summer, high stem radius variation couldlead to major differences between XCA and ADM. However,water stress conditions were not detected during the periodof highest cell production (June). Mäkinen et al. (2003)obtained different results with different methods for measur-ing the timing of growth rate culmination in a study of P. abiesin Finland: maximum growth rate measured by dendrometeroccurred in mid-June, and that measured by counting tra-cheid production occurred in the first two weeks of July. Thepaper reported that microcores were split longitudinally andthe tracheids were counted with a stereo-microscope. Whenperforming this type of analysis, all the tracheids from post-cambial enlarging cells to the mature cells have to be countedto ensure a precise assessment of tracheid production (Wodzicki,1971). However, in order to observe cambium and enlargingcells, suitable microscope sections and magnifications have tobe used (Rossi et al., 2006), otherwise introduced errors will
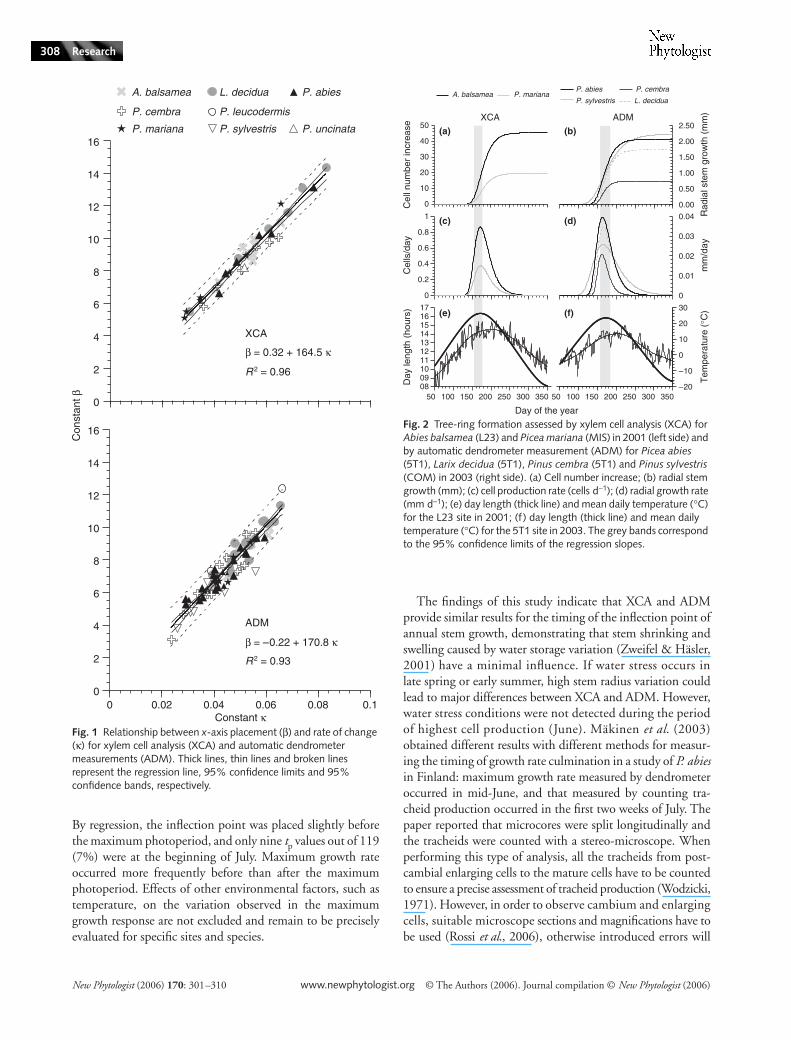
Fig. 1 Relationship between x-axis placement (β) and rate of change (κ) for xylem cell analysis (XCA) and automatic dendrometer measurements (ADM). Thick lines, thin lines and broken lines represent the regression line, 95% confidence limits and 95% confidence bands, respectively.
Fig. 2 Tree-ring formation assessed by xylem cell analysis (XCA) for Abies balsamea (L23) and Picea mariana (MIS) in 2001 (left side) and by automatic dendrometer measurement (ADM) for Picea abies (5T1), Larix decidua (5T1), Pinus cembra (5T1) and Pinus sylvestris (COM) in 2003 (right side). (a) Cell number increase; (b) radial stem growth (mm); (c) cell production rate (cells d−1); (d) radial growth rate (mm d−1); (e) day length (thick line) and mean daily temperature (°C) for the L23 site in 2001; (f) day length (thick line) and mean daily temperature (°C) for the 5T1 site in 2003. The grey bands correspond to the 95% confidence limits of the regression slopes.
© The Authors (2006). Journal compilation © New Phytologist (2006) www.newphytologist.org New Phytologist (2006) 170: 301–310
Research 309
lead to delays and misinterpretations of the timing of woodproduction.
The growth constraint connected with maximum photo-period could be an adaptation to prevent a shift of tracheidproduction along the time axis, leaving enough time to com-plete cell wall formation and lignification before winter. At ourstudy sites, xylogenesis lasted from May–June to September–October, including all processes such as cell production,enlargement, wall thickening and lignification (Deslaurierset al., 2003a; Rossi et al., 2003; Rossi, 2003). As a result,growth rate culmination, occurring around the summersolstice, arrives particularly early in the growing season. If, in acold environment, tracheid production were influenced onlyby temperature, the persistence of warm periods in August–September could lead plants to maintain high rates of celldivision in late summer. At the end of the growing period, thecambium becomes dormant, although the recently producedtracheids continue differentiating for some time (Donaldson,1991, 2001; Gindl et al., 2000; Gricar et al., 2005). A late-wood tracheid of P. abies produced in mid-August at the 5T1site remained in the differentiation stage for 40 d, not reach-ing the mature stage until the end of September (Rossi, 2003).In the boreal forest also, 30–40 d are necessary to completesecondary wall formation of latewood in A. balsamea(Deslauriers et al., 2003a). Moreover, lignification of latewoodtracheids may be considerably delayed when compared withdeposition of secondary wall polysaccharides (Gindl et al.,2000; Gricar et al., 2005). The incorporation of lignin in cellwalls is the process that completes the formation of a tracheid.At lower altitude in Slovenia, lignification of Abies albaMill. persists until November (Gricar et al., 2005). In P. abies,lignin content in the secondary cell wall of the terminal late-wood tracheids is positively correlated with temperature fromSeptember to the end of October (Gindl et al., 2000). Unlikein temperate regions, where deposition of cell material cancontinue during winter or the next spring (Nix & Villiers,1985; Donaldson, 1991, 2001), cell wall formation in coni-fers of colder environments was found to be finished beforewinter (Gricar et al., 2005), sometimes resulting in incom-plete development. As a consequence, delays in the timing ofmaximum growth rate in July, during the warmest period ofthe year, imply the maintenance of secondary wall synthesisand lignin deposition of latewood close to winter, whenclimatic conditions, especially temperature, might no longerbe favourable and affect lignin content. Therefore, cell produc-tion and enlargement occurring early in the growing season,and not during the warmest period (Wang et al., 2002; Mäkinenet al., 2003), represent a better adaptation allowing tracheiddifferentiation to be completed and avoiding inadequate cellwall lignification.
The phenology of cambium and wood formation is alsodriven by temperature, which was also proposed as themain factor affecting growth onset (Vaganov et al., 1999). Forboreal and high-altitude conifer species, short-term variations
of temperature were found to influence cell production(Antonova & Stasova, 1997; Rossi, 2003; Deslauriers &Morin, 2005) or stem radius increase (Downes et al., 2004).Photoperiod and temperature therefore represent two crucialfactors influencing xylogenesis but with different levels ofinteraction in growth–climate relationships. Temperatureallows metabolic activities to be maintained during cell pro-duction and differentiation, while photoperiod acts as a signalregulating the timing of maximum growth rate and synchro-nizing radial growth at the annual level (Fig. 2). As a result ofthis annual growth pattern, environmental factors influencingxylogenesis can have different effects in different periods ofthe growing season, according to the part of the growth curvesin which they occur. As growth rate tends to decrease after thesummer solstice, the temperature in the first increasing part ofthe growth curve is expected to have a major impact on tree-ring formation and wood production.
Acknowledgements
This work was funded by MIUR-PRIN 2002 (2002075152),MAXY 2004 (CPDA045152), Consortium de Recherchesur la Forêt Boréale Commerciale, Canada Foundation forInnovation, Natural Sciences and Engineering ResearchCouncil of Canada, and Fonds Québécois de la Recherche surla Nature et les Technologies. The authors wish to thank C.Urbinati, L. Marini, M. Mazzaro, I. Crivellaro, L. Tedoldi, F.Fontanella, R. Menardi, V. Carraro, S. De Stefano, E. Lingua,L. Caffo, B. Dufour, Y-I. Park, F. Gionest and G. Savard fortechnical support.
References
Abe H, Funada R, Ohtani J, Fukazawa K. 1997. Changes in the arrangement of cellulose microfibrils associated with the cessation of cell expansion in tracheids. Trees 11: 328–332.
Alpert P, Simm EL. 2002. The relative advantages of plasticity and fixity in different environments: when is it good for a plant to adjust? Evolutionary Ecology 16: 285–297.
Anderson G, Bancroft J. 2002. Tissue processing and microtomy including frozen. In: Bancroft JD, Gamble M, eds. Theory and practice of histological techniques. London, UK: Churchill Livingstone, 85–107.
Antonova GF, Stasova VV. 1997. Effects of environmental factors on wood formation in larch (Larix sibirica Ldb.) stems. Trees 11: 462–468.
Badeck FW, Bondeau ABK, Doktor D, Lucht W, Schaber J, Sitch S. 2004. Response of spring phenology to climate change. New Phytologist 162: 295–309.
Camarero JJ, Guerrero-Campo J, Gutiérrez E. 1998. Tree-ring growth and structure of Pinus uncinata and Pinus sylvestris in the Central Spanish Pyrenees. Arctic and Alpine Research 30: 1–10.
Chuine I, Cour P. 1999. Climatic determinants of budburst seasonality in four temperate-zone tree species. New Phytologist 143: 339–349.
Denne MP. 1971. Temperature and tracheid development in Pinus sylvestris seedlings. Journal of Experimental Botany 22: 362–370.
Denne MP. 1976. Effects of environmental change on wood production and wood structure in Picea sitchensis seedlings. Annals of Botany 40: 1017–1028.
New Phytologist (2006) 170: 301–310 www.newphytologist.org © The Authors (2006). Journal compilation © New Phytologist (2006)
Research310
Deslauriers A, Morin H. 2005. Intra-annual tracheid production in balsam fir stems and the effect of meteorological variables. Trees 19: 402–408.
Deslauriers A, Morin H, Bégin Y. 2003a. Cellular phenology of annual ring formation of Abies balsamea in the Québec boreal forest (Canada). Canadian Journal of Forest Research 33: 190–200.
Deslauriers A, Morin H, Urbinati C, Carrer M. 2003b. Daily weather response of balsam fir (Abies balsamea (L.) Mill.) stem radius increment from dendrometer analysis in the boreal forests of Québec (Canada). Trees 17: 477–484.
Donaldson LA. 1991. Seasonal changes in lignin distribution during tracheid development in Pinus radiata. Wood Science and Technology 25: 15–24.
Donaldson LA. 2001. Lignification and lignin topochemistry – an ultrastructural view. Phytochemistry 57: 859–873.
Downes G, Wimmer R, Evans R. 2004. Interpreting sub-annual wood and fibre property variation in terms of stem growth. In: Schmitt U, Ander P, Barnett JR, Emons AMC, Jeronimidis G, Saranpää P, Tschegg S, eds. Wood fibre cell walls: methods to study their formation, structure and properties. Uppsala, Sweden: Swedish University of Agricultural Sciences, 265–281.
Draper NR, Smith H. 1998. Applied regression analysis. New York, NY, USA: John Wiley & Sons.
Ford ED, Robards AW, Piney MD. 1978. Influence of environmental factors on cell production and differentiation in the earlywood of Picea sitchensis. Annals of Botany 42: 683–692.
Forster T, Schweingruber FH, Denneler B. 2000. Increment puncher: a tool for extracting small cores of wood and bark from living trees. IAWA Journal 21: 169–180.
Gindl W, Grabner M, Wimmer R. 2000. The influence of temperature on latewood lignin content in treeline Norway spruce compared with maximum density and ring width. Trees 14: 409–414.
Gregory RA, Wilson BF. 1968. A comparison of cambial activity of white spruce in Alaska and New England. Canadian Journal of Botany 46: 733–734.
Gricar J, Cufar K, Oven P, Schmitt U. 2005. Differentiation of terminal latewood tracheids in Silver fir trees during autumn. Annals of Botany 95: 959–965.
Heide OM. 1993. Daylength and thermal time responses of budburst during dormancy release in some northern deciduous trees. Physiologia Plantarum 88: 531–540.
Hertzberg M, Aspeborg H, Schrader J, Andersson A, Erlandsson R, Blomqvist K, Bhalerao R, Uhlén M, Teeri TT, Lundeberg J, Sundberg B, Nilsson P, Sandberg G. 2001. A transcriptional roadmap to wood formation. Proceedings of the National Academy of Sciences, USA 98: 14732–14737.
Horacek P, Slezingerova J, Gandelova L. 1999. Effects of environment on the xylogenesis of Norway spruce (Picea abies (L.) Karst.). In: Wimmer R, Vetter R, eds. Tree-ring analysis: biology, methodological and environmental aspects. Wallingford, UK: CAB International, 33–53.
Klingenberg CP. 1998. Heterochrony and allometry: the analysis of evolutionary change in ontogeny. Biology Review 73: 73–123.
Kramer K, Leinonen I, Loustau D. 2000. The importance of phenology for the evaluation of impact of climate change on growth of boreal, temperate and Mediterranean forest ecosystems: an overview. International Journal of Biometeorology 44: 67–75.
McCarroll D, Jalkanen R, Hicks S, Tuovinen M, Gagen M, Pawellek F, Eckstein D, Schmitt U, Autio J, Heikkinen O. 2003. Multiproxy dendroclimatology: a pilot study in northern Finland. Holocene 13: 831–841.
Mäkinen H, Nöjd P, Saranpää P. 2003. Seasonal changes in stem radius and production of new tracheids in Norway spruce. Tree Physiology 23: 959–968.
Motulsky HJ, Ransnas LA. 1987. Fitting curves to data using nonlinear regression: a practical and nonmathematical review. FASEB Journal 1: 365–374.
Nix LE, Villiers K. 1985. Tracheid differentiation in southern pines during the dormant season. Wood and Fibre Science 17: 397–403.
Partanen J, Koski V, Hänninen H. 1998. Effect of photoperiod and temperature on the timing of bud burst in Norway spruce (Picea abies). Tree Physiology 18: 811–816.
Partanen J, Leinonen I, Repo T. 2001. Effect of accumulated duration of the light period on bud burst in Norway spruce (Picea abies) of varying ages. Silva Fennica 35: 111–117.
Plomion C, Leprovost G, Stokes A. 2001. Wood formation in trees. Plant Physiology 127: 1513–1523.
Poethig S. 2003. Phase change and the regulation of developmental timing in plants. Science 301: 334–336.
Ratkowsky D. 1990. Handbook of nonlinear regression models. New York: Marcel Dekker.
Rossi S. 2003. Intra-annual dynamics of tree-ring formation and effects of the environmental factors at the timberline in the Eastern Alps. PhD thesis, University of Padova, Padova, Italy.
Rossi S, Anfodillo T, Menardi R. 2006. Trephor: a new tool for sampling microcores from tree stems. IAWA Journal 27: 89–97.
Rossi S, Deslauriers A, Morin H. 2003. Application of the Gompertz equation for the study of xylem cell development. Dendrochronologia 21: 33–39.
Saucier JP. 1999. Les régions écologiques du Québec méridionale, 3rd edn. Québec, Canada: Ministère des Ressources Naturelles.
Savidge RA. 1996. Xylogenesis, genetic and environmental regulation, a review. IAWA Journal 17: 269–310.
Schmitt U, Jalkanen R, Eckstein D. 2004. Cambium dynamics of Pinus sylvestris and Betula spp. in the northern boreal forest in Finland. Silva Fennica 38: 167–178.
Schrader J, Baba K, May ST, Palme K, Bennett M, Bhalerao RP, Sandberg G. 2003. Polar auxin transport in the wood-forming tissues of hybrid aspen is under simultaneous control of developmental and environmental signals. Proceedings of the National Academy of Sciences, USA 100: 10096–10101.
Schrader J, Nilsson J, Mellerowicz E, Berglund A, Nilsson P, Hertzberg M, Sandberg G. 2004. A high-resolution transcript profile across the wood-forming meristem of poplar identifies potential regulators of cambial stem cell identity. Plant Cell 16: 2278–2292.
Smith H. 2000. Phytochromes and light signal perception by plants – an emerging synthesis. Nature 407: 585–591.
Uggla C, Magel E, Moritz T, Sundberg B. 2001. Function and dynamics of auxin and carbohydrates during earlywood/latewood transition in Scots pine. Plant Physiology 125: 2029–2039.
Uggla C, Mellerowicz EJ, Sundberg B. 1998. Indole-3-acetic acid controls cambial growth in Scots pine by positional signalling. Plant Physiology 117: 113–121.
Vaganov EA, Hughes MK, Kirdyanov AV, Schweingruber FH, Silkin PP. 1999. Influence of snowfall and melt timing on tree growth in subarctic Eurasia. Nature 400: 149–151.
Wang L, Payette S, Bégin Y. 2002. Relationship between anatomical and densitometric characteristics of black spruce and summer temperature at tree line in northern Québec. Canadian Journal of Forest Research 32: 477–486.
Wodzicki TJ. 1971. Mechanism of xylem differentiation in Pinus sylvestris L. Journal of Experimental Botany 22: 670–687.
Zeide B. 1993. Analysis of growth equations. Forest Science 39: 594–616.Zweifel R, Häsler R. 2001. Dynamics of water storage in mature subalpine
Picea abies: temporal and spatial patterns of change in stem radius. Tree Physiology 21: 561–569.