Build a Programmable Gain Transimpedance Amplifiers Using ...
Upload
independentCategory
view
0download
0
Canopy Carbon Gain and Water Use:Analysis of Old-growth Conifers in
the Pacific Northwest
William E. Winner,1* Sean C. Thomas,2 Joseph A. Berry,3 Barbara J. Bond,4
Clifton E. Cooper,1 Thomas M. Hinckley,5 James R. Ehleringer,6
Julianna E. Fessenden,6 Brian Lamb,7 Sarah McCarthy,5
Nate G. McDowell,4 Nathan Phillips,4 and Mathew Williams8
1Department of Botany and Plant Pathology, Oregon State University, Corvallis, Oregon 97331, USA; 2Faculty of Forestry,
University of Toronto, Toronto, Canada; 3Department of Plant Biology, Carnegie Institute of Plant Biology, Stanford, California 94305,
USA; 4Forest Science Department, Oregon State University, Corvallis, Oregon 97331, USA; 5College of Forest Resources,
University of Washington, Seattle, Washington 98915, USA; 6Biology Department, University of Utah, Salt Lake City, Utah 84112,USA; 7Department of Civil and Environmental Engineering, Washington State University, Pullman, Washington 99164, USA;
8The Ecosystems Center, Marine Biological Laboratory, Woods Hole, Massachusetts 02543, USA
ABSTRACT
This report summarizes our current knowledge of
leaf-level physiological processes that regulate
carbon gain and water loss of the dominant tree
species in an old-growth forest at the Wind River
Canopy Crane Research Facility. Analysis includes
measurements of photosynthesis, respiration, sto-
matal conductance, water potential, stable carbon
isotope values, and biogenic hydrocarbon emis-
sions from Douglas-fir1 (Pseudotsuga menziesii),
western hemlock (Tsuga heterophylla), and western
red cedar (Thuja plicata). Leaf-level information is
used to scale fluxes up to the canopy to estimate
gross primary production using a physiology-
based process model. Both light-saturated and in
situ photosynthesis exhibit pronounced vertical
gradients through the canopy, but are consistently
highest in Douglas-fir, intermediate in western
hemlock, and lowest in western red cedar. Net
photosynthesis and stomatal conductance are
strongly dependent on vapor-pressure deficit in
Douglas-fir, and decline through the course of a
seasonal drought. Foliar respiration is similar for
Douglas-fir and western hemlock, and lowest for
western red cedar. Water-use efficiency varied
with species and tree height, as indexed using
stable carbon isotopes values for foliage. Leaf
water potential is most negative for Douglas-fir
and similar for western hemlock and western red
cedar. Terpene fluxes from foliage equal approx-
imately 1% of the net carbon loss from the forest.
Modeled estimates based on physiological meas-
urements show gross primary productivity (GPP)
to be about 22 Mg C m)2 y)1. Physiological
studies will be necessary to further refine esti-
mates of stand-level carbon balance and to make
long-term predictions of changes in carbon bal-
ance due to changes in forest structure, species
composition, and climate.
Key words: biogenic carbon emissions; canopy
processes; forest carbon budget; forest gas ex-
change; old-growth canopy.
INTRODUCTION
The impetus to understand and predict the storage
of carbon in forest ecosystems worldwide has
grown dramatically over the last decade in response
Received 15 February 2002; accepted 28 March 2003; published online
19 May 2004.
*Corresponding author; e-mail: [email protected]
Ecosystems (2004) 7: 482–497DOI: 10.1007/s10021-004-0139-2
482
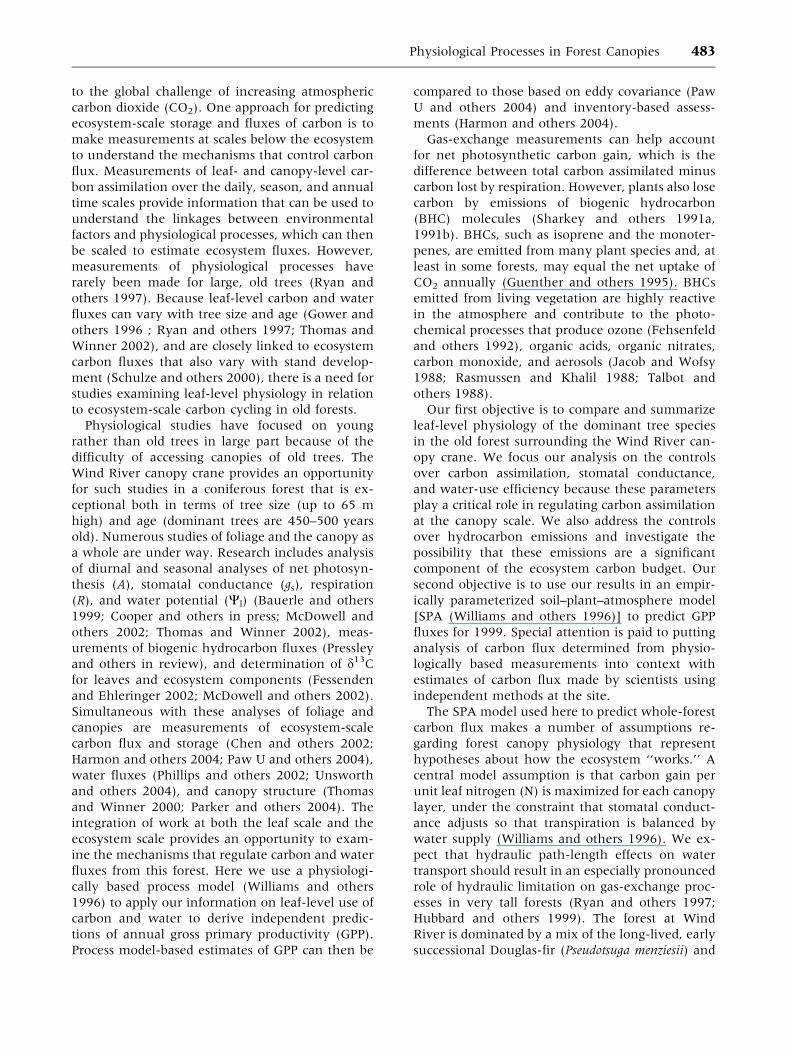
to the global challenge of increasing atmospheric
carbon dioxide (CO2). One approach for predicting
ecosystem-scale storage and fluxes of carbon is to
make measurements at scales below the ecosystem
to understand the mechanisms that control carbon
flux. Measurements of leaf- and canopy-level car-
bon assimilation over the daily, season, and annual
time scales2 provide information that can be used to
understand the linkages between environmental
factors and physiological processes, which can then
be scaled to estimate ecosystem fluxes. However,
measurements of physiological processes have
rarely been made for large, old trees (Ryan and
others 19973 ). Because leaf-level carbon and water
fluxes can vary with tree size and age (Gower and
others 19964 ; Ryan and others 19974,5 ; Thomas and
Winner 2002), and are closely linked to ecosystem
carbon fluxes that also vary with stand develop-
ment (Schulze and others 20006 ), there is a need for
studies examining leaf-level physiology in relation
to ecosystem-scale carbon cycling in old forests.
Physiological studies have focused on young
rather than old trees in large part because of the
difficulty of accessing canopies of old trees. The
Wind River canopy crane provides an opportunity
for such studies in a coniferous forest that is ex-
ceptional both in terms of tree size (up to 65 m
high) and age (dominant trees are 450–500 years
old). Numerous studies of foliage and the canopy as
a whole are under way. Research includes analysis
of diurnal and seasonal analyses of net photosyn-
thesis (A), stomatal conductance (gs), respiration
(R), and water potential (Wl) (Bauerle and others
1999; Cooper and others in press7-9 ; McDowell and
others 2002; Thomas and Winner 2002), meas-
urements of biogenic hydrocarbon fluxes (Pressley
and others in review10 ), and determination of d13C
for leaves and ecosystem components (Fessenden
and Ehleringer 2002; McDowell and others 2002).
Simultaneous with these analyses of foliage and
canopies are measurements of ecosystem-scale
carbon flux and storage (Chen and others 2002;
Harmon and others 2004; Paw U and others 200411 ),
water fluxes (Phillips and others 2002; Unsworth
and others 200412 ), and canopy structure (Thomas
and Winner 2000; Parker and others 200413 ). The
integration of work at both the leaf scale and the15
ecosystem scale provides an opportunity to exam-
ine14 the mechanisms that regulate carbon and water
fluxes from this forest. Here we use a physiologi-
cally based process model (Williams and others
1996) to apply our information on leaf-level use of
carbon and water to derive independent predic-
tions of annual gross primary productivity (GPP).
Process model-based estimates of GPP can then be
compared to those based on eddy covariance (Paw
U and others 2004) and inventory-based assess-
ments (Harmon and others 2004).
Gas-exchange measurements can help account
for net photosynthetic carbon gain, which is the
difference between total carbon assimilated minus
carbon lost by respiration. However, plants also lose
carbon by emissions of biogenic hydrocarbon
(BHC)16 molecules (Sharkey and others 1991a,
1991b). BHCs, such as isoprene and the monoter-
penes, are emitted from many plant species and, at
least in some forests, may equal the net uptake of
CO2 annually (Guenther and others 1995). BHCs
emitted from living vegetation are highly reactive
in the atmosphere and contribute to the photo-
chemical processes that produce ozone (Fehsenfeld
and others 1992), organic acids, organic nitrates,
carbon monoxide, and aerosols (Jacob and Wofsy
1988; Rasmussen and Khalil 1988; Talbot and
others 1988).
Our first objective is to compare and summarize
leaf-level physiology of the dominant tree species
in the old forest surrounding the Wind River can-
opy crane. We focus our analysis on the controls
over carbon assimilation, stomatal conductance,
and water-use efficiency because these parameters
play a critical role in regulating carbon assimilation
at the canopy scale. We also address the controls
over hydrocarbon emissions and investigate the
possibility that these emissions are a significant
component of the ecosystem carbon budget. Our
second objective is to use our results in an empir-
ically parameterized soil–plant–atmosphere model
[SPA (Williams and others 1996)] to predict GPP
fluxes for 1999. Special attention is paid to putting
analysis of carbon flux determined from physio-
logically based measurements into context with
estimates of carbon flux made by scientists using
independent methods at the site.
The SPA model used here to predict whole-forest
carbon flux makes a number of assumptions re-
garding forest canopy physiology that represent
hypotheses about how the ecosystem ‘‘works.’’ A
central model assumption is that carbon gain per
unit leaf nitrogen (N) is maximized for each canopy
layer, under the constraint that stomatal conduct-
ance adjusts so that transpiration is balanced by
water supply (Williams and others 1996). We ex-
pect that hydraulic path-length effects on water
transport should result in an especially pronounced
role of hydraulic limitation on gas-exchange proc-
esses in very tall forests (Ryan and others 199717 ;
Hubbard and others 199918 ). The forest at Wind
River is dominated by a mix of the long-lived, early
successional Douglas-fir (Pseudotsuga menziesii) and
Physiological Processes in Forest Canopies 483

the late successional species western hemlock
(Tsuga heterophylla) and western red cedar (Thuja
plicata). Although the SPA model assumes that all
canopy leaves at a given vertical position behave
similarly, we expect that species may show strong
physiological differences related to successional
status. Finally, because the net carbon balance in
any old-growth ecosystem is likely closer to
zero than in regenerating ecosystems, we hypoth-
esized that volatile organic hydrocarbons would
be a relatively large component of net carbon
exchange in the old-growth forest ecosystem at
Wind River.
METHODS
Gas-exchange Measurements
Measurements of A and gs were made using a Li-
Cor 6400 portable photosynthesis system (Li-Cor,
Lincoln, NE, USA). Seasonal surveys (conducted in
March, June, September, and December of each
year) of A and gs were made on the youngest, fully
expanded needle cohort. The seasonal surveys
commenced in September 1996. Measurements
included both in situ gas exchange, with photo-
synthetically active radiation (PAR) levels matched
to ambient conditions (using a Li-190 quantum
sensor), and photosynthetic capacity measured
under saturating PAR levels of 1200–1500 lmol
quanta m)2 s)1, in19 that order. Gas-exchange
measurements were performed upon 2–3 trees per
species, with three branchlets measured per sam-
pling period for each tree, at both upper-canopy
and lower-canopy positions.
Photosynthetic capacity measurements were
made prior to midday or late-day stomatal closure.
PAR levels were manipulated using a Li-6400-02
red light-emitting diode20 light source. After a change
in the PAR level, foliage was allowed to achieve full
light induction prior to recording measurements.
Relationships between photosynthesis and internal
CO2 (termed A/ci curves) were also measured with
a Li-Cor 6400 with the light source set to PAR
values of 1400 lmol quanta m)2 ground area s)1.
Dark-acclimated foliar respiration measurements at
ambient temperature were made on a subset of
samples, using a Li-Cor 6400, subsequent to
photosynthesis measurements. Respiration meas-
urements commenced in September 1997. Tem-
perature coefficient (Q10)21 values were estimated
using nonlinear regression of respiration (R22 ) on leaf
temperature, using the function R = x ezT2425 (where x23
and z are fitted constants) with Q10 calculated24 as
e10z.
Water-potential Measurements
Bulk tissue water potential (Wl) was measured
concurrent with gas-exchange measurements us-
ing Scholander-type pressure chambers (PMS,
Corvallis, OR, USA). Samples for water-potential
measurements were collected from branches 1 m
or less in distance from the branches used for gas-
exchange studies and were assumed to be physi-
ologically similar to those measured for photo-
synthesis and respiration rates. Measurements
were made on twigs approximately 3 mm in di-
ameter sampled from at least three clipped
branches at each location in the canopy. Samples
were stored in plastic bags until analysis within
30 min of collection.
Stable-isotope Analysis
Stable carbon isotopes of plant material (d13Cp)
provide an assimilation-weighted, or time-inte-
grated, measure of both gs and A, and are therefore
a powerful tool to determine water-use efficiency
(WUE) during the period of leaf growth and for
comparison of WUE between species. When ci26
(intercellular CO2 concentration) is low, WUE is
high, and the leaf assimilates more 13CO2 relative
to 12CO2 than when ci is high. In addition, d13Cp
analyses may be used to estimate long-term ratios
of the intercellular to ambient CO2 values (ci/ca) if
the carbon isotope ratio of atmospheric CO2 (d13Ca)
is known (Farquhar and others 1989; Ehleringer
and others 1993). To learn about ci and WUE values
for foliage of trees at the Wind River site, foliar
samples were collected from the three dominant
tree species within the stand—Douglas-fir, western
hemlock, and western red cedar—and from the
representative understory species: Pacific silver fir
(Abies amabilis), vine maple (Acer circinatum), Ore-
gon grape (Berberis nervosa), and feather moss
(Plagiothesium undulatum). Foliar samples were
collected from three separate trees, herbaceous
plants, and moss patches for each species type. For
understory measurements, about 0.5 g of current-
year leaves were sampled from Oregon grape and
feather moss growing in shaded regions. For can-
opy measurements, about 0.5 g of current-year
needles were collected from south-facing branches
located at 53 m and at 24 m for each of the nine
trees sampled. Each branch was resampled once per
month from March 1999 to October 1999. Data
presented originated from foliar samples and can-
opy CO2 samples taken in May 1999. Foliar samples
taken in September 1999 were matched to in situ
gas-exchange measurements. All foliar materials
484 W. E. Winner and others

were oven dried on site for 48 h and then ground
with mortar and pestle and analyzed on a Finnigan
Delta S mass spectrometer (Isotech Laboratories,
Champaign, IL, USA)27 located within the laboratory.
The precision was ± 0.02& for d13C in ambient
CO2, and ± 0.05& for d13C in foliar samples.
Biogenic Hydrocarbon Emissions
Emissions of BHCs were measured for Douglas-fir,
western hemlock, western red cedar, and Pacific
silver fir. Measurements were restricted to monot-
erpenes collected using a 4-L branch chamber de-
signed for the purpose. At the onset of the sampling
program, monoterpene emission samples were
collected from each tree species to identify the
major and minor components of the hydrocarbon
emissions. Sampled branches were healthy and
representative, and included shoot apices and foli-
ated internodes representing the most recent 2–
3 years of growth. First-year foliage represented
approximately 50% of enclosed biomass. A total of
106 emission samples were collected from eight
Douglas-fir branches (one tree), and 89 samples
from eight western hemlock branches (one tree)
over both measurement seasons. Sampling was re-
stricted to one tree of each species to preserve the
long-term integrity of the site. Our samples were
thus pseudo-replicated, and although the trees were
chosen to be as representative of the stand as pos-
sible, biases may result if the available amounts of
water or nutrients were unusually high or low.
Samples for qualitative analysis were collected on
site and returned to Washington State University
for analyses using gas chromatography–mass
spectrometry. Monoterpene emissions were quan-
tified using gas chromatography–flame ionization
detection (Westberg and28 Zimmerman 1993) during
the summer of 1997. Details of these measurements
are provided by Pressley and colleagues (in press29 ).
Seasonal changes in BHC emissions may be the
result of temperature change and changes in
physiological processes (Croteau 1987). Monoter-
penes are produced and stored in resin ducts along
the subsurface of the needle. The emission rate is
controlled by the vapor pressure of the terpene
pool and by characteristics of the diffusion pathway
in the needle. We modeled terpene emissions as an
exponential function of leaf temperature, following
prior studies [for example, see Guenther and others
(1993)]. Emissions of BHCs can increase if needles
are broken by mechanical stress (Juuti and others
1990) or injured by herbivory. However, such in-
creases are thought to be temporary (Litvak 1997)
and were not evaluated in this study.
Modeling
The SPA canopy model is a multilayer simulator of
C3 vascular plant processes and uses physiological
measurements to simulate productivity in a variety
of ecosystems (Williams and others 1996, 1998;
Law and others 2000). The SPA model was applied
to the forest at the Wind River site using 10 canopy
layers and a 30-min time step (Williams and others
1998). The canopy structure is described by vertical
variations among canopy layers in light-absorbing
area [light-area index30 (LAI)], photosynthetic ca-
pacity (related to foliar N), and plant hydraulic
properties. The model has a detailed radiation-
transfer scheme that calculates sunlit and shaded
fractions of the foliage in each canopy layer. The
maximum rate of carboxylation (Vcmax31 ) and the
maximum rate of electron transport (Jmax) are de-
termined from A/ci curves derived from leaf-level
gas-exchange studies as already described. The
model adjusts gs to balance atmospheric demand for
water with rates of water uptake and supply from
soils. Stomatal conductance is varied to maintain
transpiration (E32 ) at the level that keeps Wl from
falling below a critical threshold value (Wlmin),
below which cavitation of the hydraulic system
may occur. Simulation of water uptake by roots
from soils requires input describing the gravita-
tional component of leaf water potential, the plant
hydraulic resistance of each canopy layer, the be-
lowground resistance to water uptake, the distri-
bution of roots below ground, and the soil water
conductance.
The simulations for the Wind River site assume a
60-m-tall canopy with foliage distributed from 15
to 60 m, with the 10 individual layers arranged at
5-m intervals. Total canopy LAI was set to 9.6 m2
m)2 and assumed to be constant throughout the
year; 10% percent of canopy LAI was allocated to
each layer. We parameterized a biochemical model
of photosynthesis (Farquhar and von Caemmerer
1982) using in situ measurements of A/ci curves
derived from sunlit foliage in the upper canopy of
Douglas-fir to estimate the maximum velocity
of ribulose bisphosphate33 (RuBP) carboxylation
(Vcmax) and light-saturated potential rate of elec-
tron transport (Jmax) for the upper-canopy layer.
The SPA model estimates Vcmax and Jmax for more
shaded canopy layers by assuming an exponential
decrease through the canopy (falling in the bot-
tommost canopy layer to 40% of values in the
topmost layer), corresponding to the gradient in
leaf N content. Soil moisture retention curves and
the relationships between soil hydraulic conduc-
tivity and soil moisture were estimated from soil
Physiological Processes in Forest Canopies 485
texture (Saxton and others 1986). Rooting depth
was assumed to be 1.5 m, with roots distributed in
the 15 soil layers, each 0.1 m thick. Total root
length was set to 3000 m m)2, with root biomass
declining exponentially with depth in the soil
profile. Root resistivity was set to equal 400 MPa s g
mmol)1, and plant hydraulic conductivity was set
to 20 mmol)1 m)1 s)1 MPa1.
RESULTS
Carbon Use and Water Use in Canopies
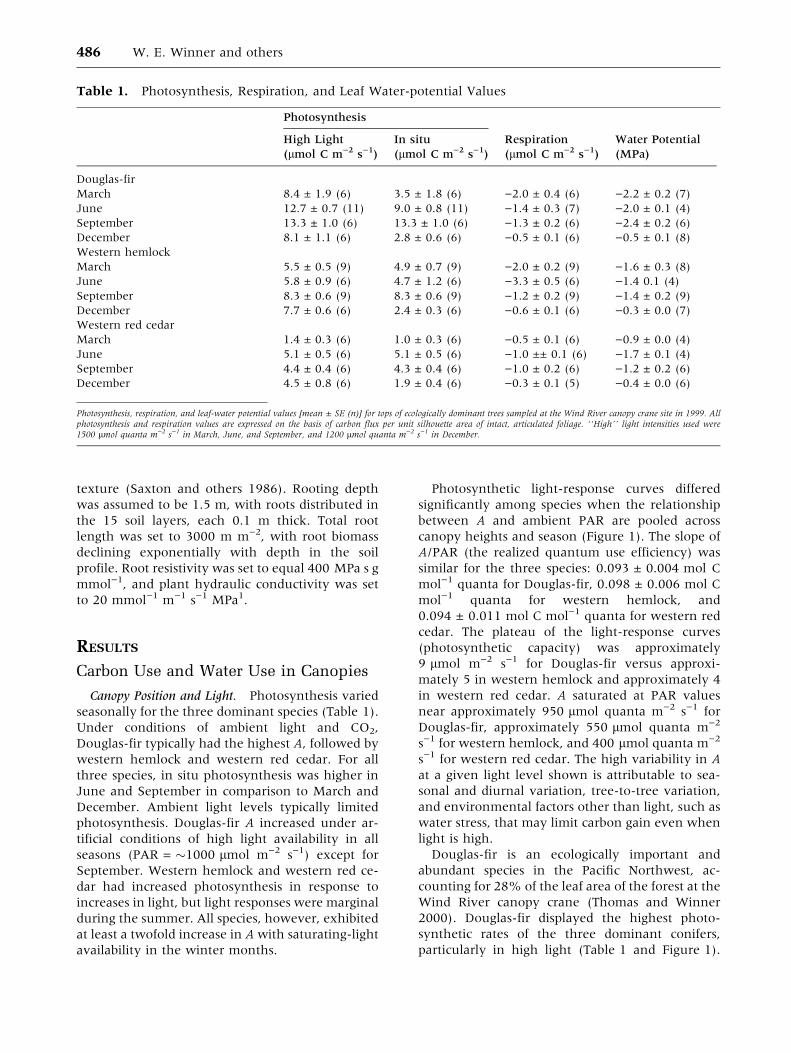
Canopy Position and Light. Photosynthesis varied
seasonally for the three dominant species (Table 1).
Under conditions of ambient light and CO2,
Douglas-fir typically had the highest A, followed by
western hemlock and western red cedar. For all
three species, in situ photosynthesis was higher in
June and September in comparison to March and
December. Ambient light levels typically limited
photosynthesis. Douglas-fir A increased under ar-
tificial conditions of high light availability in all
seasons (PAR = �1000 lmol m)2 s)1) except for
September. Western hemlock and western red ce-
dar had increased photosynthesis in response to
increases in light, but light responses were marginal
during the summer. All species, however, exhibited
at least a twofold increase in A with saturating-light
availability in the winter months.
Photosynthetic light-response curves differed
significantly among species when the relationship
between A and ambient PAR are pooled34 across
canopy heights and season (Figure 1). The slope of
A/PAR (the realized quantum use efficiency) was
similar for the three species: 0.093 ± 0.004 mol C
mol)1 quanta for Douglas-fir, 0.098 ± 0.006 mol C
mol)1 quanta for western hemlock, and
0.094 ± 0.011 mol C mol)1 quanta for western red
cedar. The plateau of the light-response curves
(photosynthetic capacity) was approximately
9 lmol m)2 s)1 for Douglas-fir versus approxi-
mately 5 in western hemlock and approximately 4
in western red cedar. A saturated at PAR values
near approximately 950 lmol quanta m)2 s)1 for
Douglas-fir, approximately 550 lmol quanta m)2
s)1 for western hemlock, and 400 lmol quanta m)2
s)1 for western red cedar. The high variability in A
at a given light level shown is attributable to sea-
sonal and diurnal variation, tree-to-tree variation,
and environmental factors other than light, such as
water stress, that may limit carbon gain even when
light is high.
Douglas-fir is an ecologically important and
abundant species in the Pacific Northwest, ac-
counting for 28% of the leaf area of the forest at the
Wind River canopy crane (Thomas and Winner
2000). Douglas-fir displayed the highest photo-
synthetic rates of the three dominant conifers,
particularly in high light (Table 1 and Figure 1).
Table 1. Photosynthesis, Respiration, and Leaf Water-potential Values
Photosynthesis
High Light In situ Respiration Water Potential
(lmol C m)2 s)1) (lmol C m)2 s)1) (lmol C m)2 s)1) (MPa)
Douglas-fir
March 8.4 ± 1.9 (6) 3.5 ± 1.8 (6) )2.0 ± 0.4 (6) )2.2 ± 0.2 (7)
June 12.7 ± 0.7 (11) 9.0 ± 0.8 (11) )1.4 ± 0.3 (7) )2.0 ± 0.1 (4)
September 13.3 ± 1.0 (6) 13.3 ± 1.0 (6) )1.3 ± 0.2 (6) )2.4 ± 0.2 (6)
December 8.1 ± 1.1 (6) 2.8 ± 0.6 (6) )0.5 ± 0.1 (6) )0.5 ± 0.1 (8)
Western hemlock
March 5.5 ± 0.5 (9) 4.9 ± 0.7 (9) )2.0 ± 0.2 (9) )1.6 ± 0.3 (8)
June 5.8 ± 0.9 (6) 4.7 ± 1.2 (6) )3.3 ± 0.5 (6) )1.4 0.1 (4)
September 8.3 ± 0.6 (9) 8.3 ± 0.6 (9) )1.2 ± 0.2 (9) )1.4 ± 0.2 (9)
December 7.7 ± 0.6 (6) 2.4 ± 0.3 (6) )0.6 ± 0.1 (6) )0.3 ± 0.0 (7)
Western red cedar
March 1.4 ± 0.3 (6) 1.0 ± 0.3 (6) )0.5 ± 0.1 (6) )0.9 ± 0.0 (4)
June 5.1 ± 0.5 (6) 5.1 ± 0.5 (6) )1.0 ±± 0.1 (6) )1.7 ± 0.1 (4)
September 4.4 ± 0.4 (6) 4.3 ± 0.4 (6) )1.0 ± 0.2 (6) )1.2 ± 0.2 (6)
December 4.5 ± 0.8 (6) 1.9 ± 0.4 (6) )0.3 ± 0.1 (5) )0.4 ± 0.0 (6)
Photosynthesis, respiration, and leaf-water potential values [mean ± SE (n)] for tops of ecologically dominant trees sampled at the Wind River canopy crane site in 1999. Allphotosynthesis and respiration values are expressed on the basis of carbon flux per unit silhouette area of intact, articulated foliage. ‘‘High’’ light intensities used were1500 lmol quanta m)2 s)1 in March, June, and September, and 1200 lmol quanta m)2 s)1 in December.
486 W. E. Winner and others

The crowns of Douglas-fir were also in the highest
light environment of all species in the forests, with
a midcrown average height of 35 m (Parker and
others 200435 ). Therefore, Douglas-fir is likely to
exert significant control over carbon uptake of this
forest. On the basis of A/ci curves, upper-canopy
foliage for Douglas-fir showed a maximum velocity
of RuBP carboxylation (Vcmax) of 39 lmol m)2 s)1
and a light-saturated potential rate of electron
transport (Jmax) of 129 lmol m)2 s)1.
Respiration. Foliar respiration rates measured at
ambient temperatures were similar for Douglas-fir
and western hemlock, except in June, when res-
piration in hemlock was higher. Respiration in
western red cedar was generally lower (Table 1).
Q10 values were computed using in situ foliar res-
piration measurements pooled across seasons. Q10
values estimated in this manner were less than 2 in
all cases, with values of 1.75 for Douglas-fir, 1.59
for western hemlock, and 1.77 for western red ce-
dar.
Diurnal Patterns. The diurnal course of A, gs, and
Wl was measured on five dominant Douglas-fir
trees during the summer of 1999 (Figure 2). These
measurements were made using current-year
needles within the top 10% of the crown height on
3 clear days: 15 July, 17 August, and 13 September.
From mid-July through mid-August, soil moisture
availability steadily decreased (Unsworth and oth-
ers 200436 ). Air-temperature and vapor-pressure
deficit (VPD) values just above the canopy were
higher on the August and September measurement
days than during the July measurement day. Air
temperatures just above the canopy ranged from
15�C in the morning to 28�C, or higher, in the af-
ternoon during August and September, but were
typically 5�C cooler throughout the day in July.
During the measurement day in July, VPD never
exceeded 1.5 kPa, whereas values of more than
3 kPa occurred later in the summer.
Maximum Douglas-fir photosynthesis rates dur-
ing the sample days in July and August were about
12.5 mol m)2 s)1 (Figure 2). The values obtained in
July and August are similar to other measurements
for this species, which37 are generally made with
seedlings and younger trees [see Bond and others
(1999) and McDowell and others in press38 , but see
also Thomas and Winner (2002)]. During the
September sample day, maximum photosynthetic
rates were about 35% lower than in the previous
months. Low September photosynthesis rates are
likely caused by the accumulating effects of low soil
water availability, lower morning humidity, or
both. Net photosynthesis declined through the day
on all three sampling dates.
Stomatal conductance ranged from 0.5 to
2.5 mmol m)2 s)1 (Figure 2). As with photosyn-
thesis, stomatal conductance was generally higher
during the July sample day than for sample days in
August and September. The diurnal pattern of
stomatal conductance declined throughout each of
the sample days, which roughly parallels changes
in photosynthesis.
Leaf Water Potential. Leaf water potential (Wl),
averaged over the entire sample day, was consist-
ently more negative for Douglas-fir than for west-
ern hemlock and western red cedar (Table 1). All
Figure 1. Photosynthetic carbon uptake for dominant
tree species at the Wind River canopy crane site, ex-
pressed on a displayed leaf-area basis, as a function of
ambient light levels. Data are for measurements made
through the annual cycle in 1996–97 under ambient light
conditions, pooling the lower, middle, and upper por-
tions of the crown for each species. PAR, photosynthet-
ically active radiation.
Physiological Processes in Forest Canopies 487

species showed less negative Wl during winter
months compared to summer months, and the
December gradient of Wl in each species nearly
matched the hydrostatic gradient of 0.01 MPa m)1.
Thus, complete rehydration may occur after the
summer drought.
Diurnal Wl was measured concurrent with gas-
exchange measurements for Douglas-fir (Figure 2).
The diurnal decline in both A and gs corresponded
to the decline in Wl ; however, seasonal changes in
gas exchange were not related to Wl. Midday Wl
remained constant throughout the summer, de-
spite the significant decline in soil moisture (Uns-
worth and others 200439 ). Wl typically reached
midday minimum values ranging from )2.5 to
)2.6 MPa. Woody species commonly have a spe-
cies-specific minimum water potential (Hinckley
and others 1978), so the observation for Douglas-fir
is not unique. Most investigations have reported
midday minimum Wl values that are 0.2–0.4 MPa
higher than we measured on the old-growth
Douglas-fir at Wind River (Running 1976; Bond
and40 Kavanagh 1999; McDowell and others in
press41 ). The midday minimum Wl could help main-
tain the water-potential gradient required to pull
water from roots to leaves in these trees, some of
which42 are nearly 65 m tall (McDowell and others in
press43 ). The gravitational potential is )0.65 MPa for
these tall trees, and hydraulic resistance of stems is
likely to increase with tree size (Ryan and Yoder
199744 ).
Vapor-pressure Deficit. Net photosynthesis is in-
versely associated with VPD (Figure 3) and is best
described by an exponential decay equation:
A ¼ a þ b � eð�c�VPDÞ ð1Þ
The equation explains about 66%, 35%, and
64% of the variation in net photosynthesis for July,
August, and September measurements, respec-
tively. The regression lines are similar for August
and September. During July, however, photosyn-
thesis was about 20% higher at any VPD than for
the later months.
Water-use Efficiency
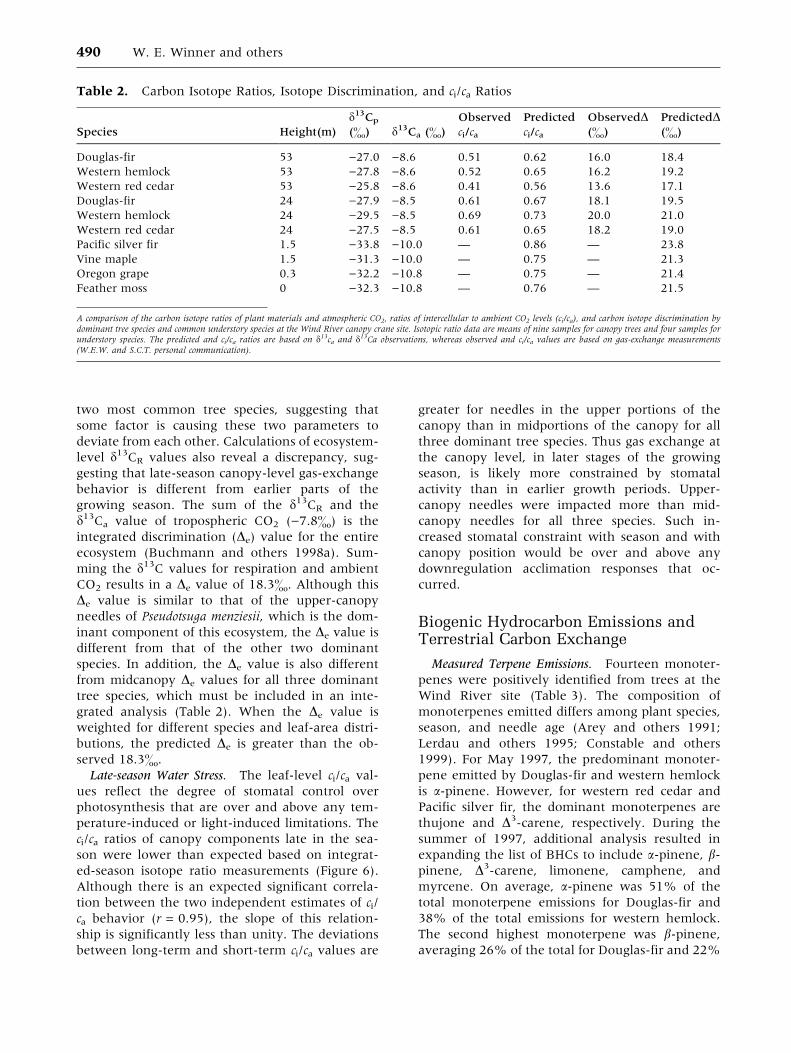
Stable Carbon Isotopes Show Stomatal Limitation of
Carbon Use. The instantaneous gas-exchange data
for 3 summer days show Douglas-fir needles both
close stomata and reduce photosynthesis over the
course of a day and as the summer progresses. Such
instantaneous measurements are useful to under-
stand the dynamic behavior of both gs and A.
However, the integration period of these meas-
urements is on the order of seconds to minutes.
Douglas-fir, western hemlock, and western red
cedar have different ci/ca ratios, suggesting that the
WUE differed among these tree species (Table 2).
Specifically , western hemlock had the highest ci/ca,
Douglas-fir was intermediate, and western red ce-
dar had the lowest ci/ca. Both short-term gas-ex-
change observations and the long-term carbon
isotope analyses indicate the same relative ran-
kings. The ci/ca ratios did not remain constant
throughout the canopy (Figure 4). Instead, ci/ca
ratios increased with depth into the canopy, which
is a pattern seen in many forest ecosystems (Ehle-
ringer and others 1993).
Figure 2. Diurnal values for branch water potential (a),
stomatal conductance (b), and net photosynthesis (c) for
a 450-year-old Douglas-fir taken on 3 sampling days.
488 W. E. Winner and others

Using equations from Farquhar and colleagues
(1989) and atmospheric observations (Figure 4),
the carbon isotope data were converted to expected
long-term ci values (Table 2). Although differences
in the ci values were less than 33 ppm within
canopy trees, the differences in ci between canopy
trees and understory vegetation approached
110 ppm. Large differences in ci between species
suggest biological controls over gas exchange range
widely with height and across species within this
forest.
The most likely scenario is that decreases in
photosynthesis and stomatal conductance observed
for foliage at the top of Douglas-fir during the day,
and the growing season, are typical, and that sto-
matal closure functionally limits carbon gain for
much of the life of these needles. Isotopic analysis
suggests that needles in upper portions of the
canopy are the ones for which gas exchange is most
limited by stomatal constraints (Table 2). Photo-
synthesis by leaves of vegetation in the understory
is least constrained by stomata, while stomata on
those needles in the middle of the canopy imposed
an intermediate constraint. These isotope ratios and
ci profiles with canopy height are similar to values
reported in another old-growth forest in the Pacific
Northwest (Buchmann and others 1998b), but are
larger than differences observed in developing co-
niferous canopies (Zhang and others 1993; Mar-
shall and Zhang 1994). Carbon isotope data not
shown indicate that needles and small stems falling
to the ground originate mainly from the upper
canopy.
Trends in Water Use with Canopy Height.. Foliage
was collected along complete height profiles of two
species—Douglas-fir and western hemlock—adja-
cent to the location of hemispheric photograph
measurements. The d13C value of foliage indicates
that WUE increased with increasing canopy height
for Douglas-fir (Figure 4) but not for western
hemlock (data not presented). WUE was a plastic
characteristic for Douglas-fir and increased with
increasing light availability, but was unable to
change for western hemlock.
Isotopic trends with change in elevation in the
canopy result from changes in the physiology of the
foliage, as well as changes in atmospheric CO2
concentration in the canopy. The variations in
d13Cp that occur with change in depth into the
canopy (Figure 4) probably reflect isotopic change
caused by increasing ca that occurs with decreasing
canopy height (Medina and Minchin 1980), yet the
changes in d13Cp were much larger than the ob-
served decreases in d13Ca. Therefore, the paired
d13Cp and d13Ca data suggested that relatively large
changes in carbon isotope discrimination occurs
throughout the canopy profile; that is, the response
of photosynthesis by vegetative components within
the canopy changed so that stomatal constraints
decreased with decreasing light levels. In this re-
spect, the long-term isotope ratio data are consist-
ent with short-term observations of gas exchange
(Thomas and Winner 2002, Table 145 ). However, leaf
N concentration also declined significantly with
tree height for Douglas-fir but not for western
hemlock (T.M.H. unpublished data). Leaf N exerts a
strong control over A (Field and Mooney 198646 ).
Therefore, the differences in the vertical profiles of
d13Cp may also reflect changes in photosynthetic
capacity for Douglas-fir but not for western hem-
lock.
The aggregated impact of changes in the ci/ca
ratio with different species and with different
height effects can be assessed using a Keeling-plot
approach (Buchmann and others 1997) (Figure 5).
By sampling the carbon isotope ratio of atmos-
pheric CO2 (d13Ca) within the canopy and relating
this with the absolute CO2 concentration measured
at the same time, it is possible to obtain an inte-
grated estimate of the carbon isotope ratio of CO2
respired by all elements of the ecosystem (d13CR).
Air repeatedly sampled within the Wind River
canopy crane primary forest has a d13C value of
)26.1&. If the d13CR value is approximately the
same as the d13Cp value, there is no isotopic
fractionation during respiration (Lin and Ehlerin-
ger 1997). However, at the Wind River site, the
d13CR is not similar to long-term d13Cp values of the
Figure 3. The response of photosynthesis (A) to vapor-
pressure deficit (VPD) for a 450-year-old Douglas-fir.
Samples were collected on 3 days representing early,
middle, and late drought (July, August, and September,
respectively).
Physiological Processes in Forest Canopies 489
two most common tree species, suggesting that
some factor is causing these two parameters to
deviate from each other. Calculations of ecosystem-
level d13CR values also reveal a discrepancy, sug-
gesting that late-season canopy-level gas-exchange
behavior is different from earlier parts of the
growing season. The sum of the d13CR and the
d13Ca value of tropospheric CO2 ()7.8&) is the
integrated discrimination (De) value for the entire
ecosystem (Buchmann and others 1998a). Sum-
ming the d13C values for respiration and ambient
CO2 results in a De value of 18.3&. Although this
De value is similar to that of the upper-canopy
needles of Pseudotsuga menziesii, which is the dom-
inant component of this ecosystem, the De value is
different from that of the other two dominant
species. In addition, the De value is also different
from midcanopy De values for all three dominant
tree species, which must be included in an inte-
grated analysis (Table 2). When the De value is
weighted for different species and leaf-area distri-
butions, the predicted De is greater than the ob-
served 18.3&.
Late-season Water Stress. The leaf-level ci/ca val-
ues reflect the degree of stomatal control over
photosynthesis that are over and above any tem-
perature-induced or light-induced limitations. The
ci/ca ratios of canopy components late in the sea-
son were lower than expected based on integrat-
ed-season isotope ratio measurements (Figure 6).
Although there is an expected significant correla-
tion between the two independent estimates of ci/
ca behavior (r = 0.95), the slope of this relation-
ship is significantly less than unity. The deviations
between long-term and short-term ci/ca values are
greater for needles in the upper portions of the
canopy than in midportions of the canopy for all
three dominant tree species. Thus gas exchange at
the canopy level, in later stages of the growing
season, is likely more constrained by stomatal
activity than in earlier growth periods. Upper-
canopy needles were impacted more than mid-
canopy needles for all three species. Such in-
creased stomatal constraint with season and with
canopy position would be over and above any
downregulation acclimation responses that oc-
curred.
Biogenic Hydrocarbon Emissions andTerrestrial Carbon Exchange
Measured Terpene Emissions. Fourteen monoter-
penes were positively identified from trees at the
Wind River site (Table 3). The composition of
monoterpenes emitted differs among plant species,
season, and needle age (Arey and others 1991;
Lerdau and others 1995; Constable and others
1999). For May 1997, the predominant monoter-
pene emitted by Douglas-fir and western hemlock
is a-pinene. However, for western red cedar and
Pacific silver fir, the dominant monoterpenes are
thujone and D3-carene, respectively. During the
summer of 1997, additional analysis resulted in
expanding the list of BHCs to include a-pinene, b-
pinene, D3-carene, limonene, camphene, and
myrcene. On average, a-pinene was 51% of the
total monoterpene emissions for Douglas-fir and
38% of the total emissions for western hemlock.
The second highest monoterpene was b-pinene,
averaging 26% of the total for Douglas-fir and 22%
Table 2. Carbon Isotope Ratios, Isotope Discrimination, and ci/ca Ratios
Species Height(m)
d13Cp
(&) d13Ca (&)
Observed
ci/ca
Predicted
ci/ca
ObservedD(&)
PredictedD(&)
Douglas-fir 53 )27.0 )8.6 0.51 0.62 16.0 18.4
Western hemlock 53 )27.8 )8.6 0.52 0.65 16.2 19.2
Western red cedar 53 )25.8 )8.6 0.41 0.56 13.6 17.1
Douglas-fir 24 )27.9 )8.5 0.61 0.67 18.1 19.5
Western hemlock 24 )29.5 )8.5 0.69 0.73 20.0 21.0
Western red cedar 24 )27.5 )8.5 0.61 0.65 18.2 19.0
Pacific silver fir 1.5 )33.8 )10.0 — 0.86 — 23.8
Vine maple 1.5 )31.3 )10.0 — 0.75 — 21.3
Oregon grape 0.3 )32.2 )10.8 — 0.75 — 21.4
Feather moss 0 )32.3 )10.8 — 0.76 — 21.5
A comparison of the carbon isotope ratios of plant materials and atmospheric CO2, ratios of intercellular to ambient CO2 levels (ci/ca), and carbon isotope discrimination bydominant tree species and common understory species at the Wind River canopy crane site. Isotopic ratio data are means of nine samples for canopy trees and four samples forunderstory species. The predicted and ci/ca ratios are based on d13ca and d13Ca observations, whereas observed and ci/ca values are based on gas-exchange measurements(W.E.W. and S.C.T. personal communication).
490 W. E. Winner and others

of the total for western hemlock. In all samples, a-
pinene, b-pinene, and limonene together com-
prised more that 64% of the emissions from all
trees.
Douglas-fir and western hemlock branches from
the Wind River site were used to measure BHC
emission rates. The total monoterpene emission
rates for Douglas-fir ranged from 0.009 lg C g)1
h)1 when ambient temperatures were near 14�C to
a maximum of 4.5 lg C g)1 h)1 measured at 40�C.
The total monoterpene emission rates for western
hemlock ranged from 0.07 lg C g)1 h)1 at 15�C to
6.3 lg C g)1 h)1 measured at 42�C (Pressley and
others in press47 ).
Branch enclosure data were used to deter-
mine standard emission rates (Es) and the corre-
sponding temperature coefficient (Figure 7).
The large scatter in the data reflects natural varia-
bility and measurement error. The measured values
for the temperature-dependent monoterpene
emissions for Douglas-fir are 0.15 K)1 with a
standard emission rate of 0.3 lg C g)1 h)1. These
parameters can be used to estimate accumulated
loss of carbon due to terpene emissions during 1998
and 1999.
Biogenic Hydrocarbon and Net Carbon Ex-
change. To place BHC emissions in the context of
the net carbon exchange of the whole forest, esti-
mates of net fluxes of C and BHC are needed. Net C
balance was determined using eddy-flux tech-
niques (Wofsy and others 1993; Hollinger and
others 1994; Black and others 1996; Valentini and
others 1996; Greco and Baldocchi48 1996). Terpene
emissions for the forest were estimated from the
Guenther emission algorithm and the site-specific
emission factors from Pressley (199949 ) incorporated
into a dynamic forest canopy model for each 30-
min period of the growing season.
The net carbon exchange, the terpene flux, and
the resulting percentage of terpene to CO2 changed
throughout 1998 (Figure 8). For the period from
midsummer through late winter, the accumulated
net carbon exchange increased to a maximum of
+7 mol C m)2 (positive indicates net flow to the
atmosphere) and then decreased. Terpene fluxes
averaged approximately 1% of the net carbon loss
during 1998 and also during the net carbon uptake
in 1999 (data not presented). The uncertainty in
the predicted terpene emissions is estimated at ap-
proximately a factor of 2 so that the estimated
Figure 4. Variations in [CO2] and carbon isotope ratios of canopy CO2 (13Ca), plant organic matter (13Cp ), and soil organic
matter (13 CSOM) at the90 Wind River canopy crane forest site. Symbols represent averages for d13Ca (n = 2), d13Cp (n = 9),
and d13CSOM (n = 5).9091 Needle samples were collected at the canopy top and midcanopy from sun-exposed south-facing
branches of Douglas-fir. Each symbol in Figures 4 and 6 represents the average of the three trees sampled per species; the
error within the measurements was smaller than the symbol; ppm, parts per million.
Physiological Processes in Forest Canopies 491

percentage of terpene to CO2 ranges between 0.5%
and 2%. At times when the net carbon exchange
approached zero, the fraction of terpenes increased50
rapidly. Therefore, carbon loss by volatile emissions
is a measurable portion of the net carbon exchange,
and when net carbon exchange is near zero, ter-
pene emissions can be an important component of
the carbon budget.
Scaling from Trees to Stands: Predictionsof Whole-ecosystem51 Latent Energy Fluxand Gross Primary Production52
We applied available meteorologic data from the
site to model the latent energy (LE) flux and gross
primary production (GPP) fluxes for 1998 and 1999
(Figure 9). Meteorologic data were available for
86% of days in 1998 and for 66% of the days in
1999. Modeled estimates of LE and GPP for days
51–360 in 1998 were 1248 MJ m)2 y)1 and 2303 g
C m)2 y)1, respectively, and for days 1–236 in 1999
were 1144 MJ m)2 y)1 and 1869 g C m)2 y)1. LE
flux is the sum of canopy transpiration and evap-
oration from the soil surface and wetted leaf sur-
faces. The predictions show that, for the first
2 months of the year, cloudy conditions and cool
temperatures kept LE flux at low levels. As insola-
tion and temperatures increased in March, both
water fluxes to the atmosphere and production rose
toward their peak values. The key controls on LE
demand, VPD53 and GPP (insolation) are tightly
correlated, so cycles of cloudy, humid days and
bright, dry days control patterns of evapotranspi-
ration and carbon assimilation until midsummer.
However, once soil moisture begins to decline after
day 200, water supply becomes limiting, stomatal
opening is constricted, and both LE flux and GPP
are reduced. The estimates of GPP are similar to
those of Harmon and colleagues (2004), but much
higher than those of Paw U and coworkers (2004)54 .
DISCUSSION
Predictive models of complex forest ecosystems
must make assumptions and simplifications, as is
the case for the physiological process modeling
approach we demonstrate here. Our purpose for
modeling is not only to better understand carbon
use in the study forest, but also to guide thinking to
improve the quality of the model and increase the
use of model parameters derived from on-site
measurements. In the present report, we present
simulation results that are based in part on stand-
specific parameter estimates, but also incorporate
many ‘‘generic’’ assumptions and parameters de-
rived from other forest communities (Williams and
others 1996). Many of the empirical results pre-
sented are consistent with our modeling assump-
tions. For example, the SPA model assumes that
stomatal conductance maintains leaf water poten-
tial above a critical threshold level, and this as-
sumption is broadly supported by the diurnal and
seasonal patterns of gas exchange reported here for
Figure 5. A Keeling plot showing the carbon isotope
ratios of canopy CO2 (13Ca) and the CO2 concentration
within the canopy. The intercept reflects d13CR, the in-
tegrated d13C ratio of CO2 respired from the ecosystem;
ppm, parts per million.Figure 6. The correlation between the observed and
predicted ci/ca ratios of needles from Douglas-fir, western
hemlock, and western red cedar. The short-term ci/ca
ratio is determined from in situ photosynthesis gas-ex-
change measurements (Thomas and Winner 2002, and
unpublished data), and the long-term estimate is based
on d13Cp measurements in Table 1. WRCC, Wind River
canopy crane. Each symbol in Figures 4 and 6 represents
the average of the three trees sampled per species; the
error within the measurements was smaller than the
symbol.
492 W. E. Winner and others

Douglas-fir. Strong diurnal declines in stomatal
conductance and photosynthesis that are more
pronounced during late-season drought conditions
are likewise consistent with model assumptions.
However, the SPA model incorporates neither
interspecific differences in gas-exchange parame-
ters nor seasonal changes in photosynthetic physi-
ology, and our results indicate that both of these
sources of variation are large (Table 1). In addition,
use of the most recent estimates for LAI and vertical
distribution (Thomas and Winner 2000; Parker and
others 200455 ), would be preferable to assuming a
uniform, vertical distribution of foliage through the
canopy.
Measurements of parameters that are not yet
assessed are needed to better simulate processes
linking physiology to forest growth and structure.
For example, measurements of carbon allocation
would be needed before we could reach a strong
conclusion about the timing and location of carbon
sinks and sources within this forest. Improved es-
timates of photosynthetic parameters [such as the
maximum velocity of RuBP carboxylation (Vcmax)
and light-saturated potential rate of electron
transport (Jmax)] for all species at multiple canopy
heights are also needed to test the assumption of a
single vertical gradient through the canopy. In
addition, we have only limited information on the
rooting depth and source of water acquisition in
this forest, and such data are also needed for model
parameterization. Much of the physiological proc-
ess work at the Wind River site has emphasized
measurements on canopy foliage. However, un-
derstanding the timing, size, and controls over net
ecosystem exchange also requires tissue-level
measurements of carbon fluxes from soil, stems,
and downed wood. Currently only limited data are
available on these components at the site (J. Klo-
patek unpublished data). Such measurement
would make possible independent estimates of ec-
osystem respiration and net primary production.
The large species-specific differences in physiol-
ogy shown here provide a compelling argument as
to why a modeling approach founded on both
physiological and ecological processes is ultimately
necessary to understanding and predicting forest
Table 3. Monoterpene-emission Composition of Dominant Species
Compound Douglas-fir Western Red Cedar Pacific Silver Fir Western Hemlock
a-Pinene D T D D
b-Pinene D T D D
Limonene D D D D
D3 -Carene D D D T
Sabinene T T T T
Camphene T T T
Myrcene T T T T
2-Carene T T T T
a-Phellandrene T T T
Tricyclene T T T
b-Phellandrene T
Thujene T
a-Terpinolene T T T T
Thujone D
Monoterpene-emission composition for four dominant species at the Wind River Canopy Crane Research Facility. Dominant (D) compounds are those with concentrationsgreater than 10% of the total versus trace (T) concentrations.
Figure 7. Monoterpene emissions (ln E) plotted against
temperature deviation from standard temperature where
data are block-averaged by91 2�C temperature intervals.
Error bars92 indicate standard deviation from the mean.
Physiological Processes in Forest Canopies 493

carbon flux. The dominant species at the Wind
River canopy crane site differ substantially in
physiological parameters central to understanding
carbon flux. The observed photosynthetic differ-
ences are consistent with long-standing generali-
zations [compare56 Bazzaz (1979) and Teskey and
Shestha (1985)57 ], in that Douglas-fir showed a
higher light-saturated photosynthetic rate, dark
respiration rate, and light-saturation point than did
the later successional western hemlock and west-
ern red cedar. Douglas-fir also showed a relatively
low emission rate for terpenes, consistent with re-
cent comparisons across trees and forests of differ-
ent successional status (Martin and Guenther 1995;
Klinger and others 1998). However, contrary to
some previous generalizations, the early-succes-
sional but long-lived Douglas-fir showed a con-
servative water-use strategy compared to the later
successional species [compare58 Bazzaz (1979)]. Our
results thus indicate that, as western hemlock
gradually replaces Douglas-fir in this stand, not
only will there be substantial changes in the
amount and vertical distribution of leaf area in the
canopy (Thomas and Winner 2000), gas-exchange
characteristics of canopy foliage will also change
dramatically. For example, while terpene fluxes
account for approximately 1% of net carbon loss
from the forest at present, this value is likely to
increase substantially as the stand becomes in-
creasingly dominated by western hemlock.
Based on the physiological process model pre-
sented here, we estimate current GPP (assuming an
LAI of 9.6) at 24.6 Mg C ha)1 y)1. Revision of this
estimate to take into account a recent measure-
ment of LAI of 8.6 (Thomas and Winner 2000)
gives a GPP of about 22 Mg C ha)1 y)1, a value that
is similar to that presented by Harmon and col-
leagues (59 2004). Using eddy-flux methods, Paw U
and coworkers (60 2004) estimate a net carbon uptake
of 2.1 Mg C ha)1 y)1 and a net respiration (at 3-m
height) of 9.2 Mg C ha)1 y)1, yielding a ‘‘gross’’
productivity above 3 m in height of 11.3 Mg C ha)1
y)1. However, this gross productivity figure neces-
sarily excludes respiration components above 3 m
(that is, foliar respiration, sapwood respiration, and
heart rot). Harmon and colleagues (61 2004) estimate
these components at about 6.5 Mg C ha)1 y)1. In
sum, all three estimates of GPP fall within about
4 Mg C ha)1 y)1. The three approaches for analysis
of carbon flux thus provide initial results that are
similar and will likely converge as more site-specific
information is gathered and as models improve.
The acquisition of information on physiological and
ecological processes will continue to play an es-
sential role in explaining forest ecosystem proc-
esses, in refining estimates of carbon balance
derived from biomass inventory analysis and eddy-
covariance measurements, and in resolving differ-
ence in carbon-flux rates determined by different
measurement techniques.
ACKNOWLEDGEMENTS
This research was supported by the Office of Sci-
ence, Biological and Environmental Research Pro-
gram (BER), US Department of Energy (DOE),
through the Western Regional Center (WESTGEC)
of the National Institute for Global Environmental
Figure 8. Wind River canopy crane eddy-flux data. Ac-
cumulated net carbon (C) exchange (as CO2) measured
with eddy-correlation methods at the Wind River canopy
crane site and the estimated accumulated terpene emis-
sions during 1998. Figure 9. Simulated total canopy latent energy (LE) flux
and gross primary productivity (GPP) in 1999 for the old-
growth Wind River forest in 1999, based on locally pa-
rameterized soil–plant–atmosphere model.
494 W. E. Winner and others

Change (NIGEC) under Cooperative Agreement
DE-FC03-90ER61010. Authors who are investiga-
tors with WESTGEC funds to work at the site in-
clude W. E. Winner, J. Berry, B. J. Bond, T.
Hinckley, J. Ehleringer, B. Lamb, and S. C. Thomas.
Dr. Thomas Suchanek, WESTGEC Director, along
with Dr. Susan Ustin and the WESTGEC staff, have
helped create the focused interest in analysis of
carbon balance at this site. We also greatly appre-
ciate the efforts of Dr. David Shaw, Director of the
Wind River canopy crane site, who has provided
assistance in organizing research and providing
logistical support at the site. We are particularly
indebted to Mr. Mark Creighton, and those who
‘‘bell’’ the crane, for safely moving us through the
forest canopy with the precision and care necessary
to gather physiological data in the forest canopy
without damaging trees.
REFERENCES
Aber JD, Federer C. 199262 . A generalized, lumped-parameter
model of photosynthesis, evaporation and net primary pro-
duction in temperate and boreal forest ecosystems. Oecologia
(Berl) 92:463–74.
Aber JD, Reich PB, Goulden ML. 199663 . Extrapolating leaf CO2
exchange to the canopy: a generalized model of forest pho-
tosynthesis compared with measurements by eddy correla-
tion. Oecologia (Berl) 106:257–65.
Arey J, Winer AM, Atkinson R, Aschmann SM, Long WD,
Morrison CL, Olszyk DM. 1991. Terpenes emitted from agri-
cultural species found in California’s central valley. J Geophys
Res 96:9329–36.
Bazzaz FA. 1979. The physiological ecology of plant succession.
Annu Rev Ecol Syst 10:351–71.
Black TA, Den Hartog G, Neumann HH, Blanken PD, Yang PC,
Russell C, Nesic Z, Lee X, Chen SG, Staebler R, Novak MD.
1996. Annual cycles of water vapour and carbon dioxide
fluxes in and above a boreal aspen forest. Global Change Biol
2:219–29.
Bond BJ, Farnsworth BT, Coulombe RA, Winner WE. 1999.
Foliage physiology and biochemistry in response to light gra-
dients in conifers with varying shade tolerance. Oecologia
(Berl) 120:183–92.
Bond BJ, Kavanagh KL. 1999. Stomatal behavior of four woody
species in relation to leaf-specific hydraulic conductance and
threshold water potential. Tree Physiol 19:503–10.
Buchmann N, Brooks JR, Flanagan LB, Ehleringer JR. 1998a.
Carbon isotope discrimination of terrestrial ecosystems. In:
Griffiths H, editor. Stable isotopes:64 integration of biological,
ecological, and geochemical processes. Oxford: BIOS Scien-
tific. p 203–21.
Buchmann N, Hinckley TM, Ehleringer JR. 1998b. Carbon iso-
tope dynamics in Abies amabilis stands in the Cascades. Can J
For Res 28:808–19.
Buchmann N, Kao W, Ehleringer JR. 1997. Influence of stand
structure on carbon-13 of vegetation, soils, and canopy air
within deciduous and evergreen forests of Utah, United States.
Oecologia (Berl) 110:109–19.
Chen JQ, Falk M, Euskirchen E, Paw U KT, Suchanek TH, Ustin
SL, Bond BJ, Brosofske KD, Phillips N, Bi RC. 2002. Bio-
physical controls of carbon flows in three successional Doug-
las-fir stands based on eddy-covariance measurements. Tree
Physiol 22:169–77.
Constable JVH, Litvak ME, Greenberg JP, Monson RK. 1999.
Monoterpene emission from coniferous trees in response to
elevated CO2 concentration and climate warming. Global
Change Biol 5:255–67.
Croteau R. 1987. Biosynthesis and catabolism of monoterpe-
noids. Chem Rev 87:929–54.
In: Ehleringer JR, Hall A, Farquhar GD editors. 1993. Stable
isotopes and plant carbon/water relations. San Diego: Aca-
demic,.
Farquhar GD, Ehleringer JR, Hubick KT. 1989. Carbon isotope
discrimination and photosynthesis. Annu Rev Plant Physiol
Mol Biol 40:503–37.
Farquhar GD, Von Caemmerer S. 1982. Modelling of photo-
synthetic response to the environment. Encycl Plant Physiol
[B] 12:549–87.
Fehsenfeld F, Calvert J, Fall R, Goldan P, Guenther A, Hewitt
CN, Lamb B, Liu S, Trainer M, Westberg H, Zimmerman P.
1992. Emissions of volatile organic compounds from vegeta-
tion and the implications for atmospheric chemistry. Global
Biogeochem Cycles 6:389–430.
Fessenden JE, Ehleringer JR. 2002. Age-related variations in
delta C-13 of ecosystem respiration across a coniferous forest
chronosequence in the Pacific Northwest. Tree Physiol
22:159–67.
Flanagan LB, Brooks JR, Varney GT, Berry65 SC, Ehleringer JR.
1996. Carbon isotope discrimination during photosynthesis
and the isotope ratio of respired CO2 in boreal ecosystems.
Global Biogeochem Cycles 10:629–40.
Greco S, Baldocchi DD. 1996. Seasonal variations of CO2 and
water vapour exchange rates over a temperate deciduous
forest. Global Change Biol 2:183–97.
Guenther A, Geron C, Pierce T, Lamb B, Harley P, Fall66 R. 1999.
Natural emissions of non-methane volatile organic com-
pounds, carbon monoxide, and oxides of nitrogen from North
America.67 Atmos Environ.
Guenther A, Hewitt CN, Erickson D, Fall R, Geron C, Graedel T,
Harley P, Klinger L, Lerdau M, McKay WA, others . 1995. A
global model of natural volatile organic compound emissions.
J Geophys Res 14:183–97.
Guenther A, Zimmerman P, Harley P, Monson R, Fall R. 1993.
Isoprene and monoterpene emission rate variability: model
evaluations and sensitivity analyses. J Geophys Res 12:609–
12.
Harmon ME, Bible K, Ryan MG, Shaw DC, Chen H, Klopatek J,
Li X. 2004. Production, respiration, and overall carbon balance
in an old-growth Pseudotsuga– Tsuga forest ecosystem. Eco-
systems68 7:498–512.
Hinckley TM, Lassoie JP, Running SW. 1978. Temporal and
spatial variations in the water status of forest trees. For Sci
Monogr 20:1–72.
Hollinger DY, Kelliher FM, Byers JN, Hunt JE, McSeveny TM,
Weir PL. 1994. Carbon dioxide exchange between an undis-
turbed old-growth temperate forest and the atmosphere.
Ecology 75:134–50.
Physiological Processes in Forest Canopies 495
Hunt JE, McSeveny TM, Weir PL. 1994. Carbon dioxide ex-
change between an undisturbed old-growth temperate forest
and the atmosphere. Ecology 75:134–50.
Jacob DJ, Wofsy SC. 1988. Photochemistry of biogenic emissions
over the Amazon forest. J Geophys Res 93:1477–86.
Jarvis PG. 1993. Prospects for bottom–up models In: Ehleringer
JR, Field CB editors. Scaling physiological processes: leaf to
globe69 San Diego: Academic.
Juuti S, Arey J, Atkinson R. 1990. Monoterpene emission rate
measurements from a Monterey pine. J Geophys Res
95:7515–9.
Klinger LF, Greenberg J, Guenther A, Tyndall G, Zimmerman P,
M‘Bangi M, Moutsambota J-M, Kenfack D. 1998. Patterns
in volatile organic compound emissions along a savanna–
rainforest gradient in central Africa. J Geophys Res 103:1443–
54.
Law B, Williams M, Anthoni PM, Baldocchi DD, Unsworth MH.
2000. Measuring and modeling seasonal variation of car-
bon dioxide and water vapor exchange of a Pinus ponderosa
forest subject to soil water deficit. Global Change Biol 6:613–
30.
Lerdau M, Matson P, Fall R, Monson R. 1995. Ecological controls
over monoterpene emissions from Douglas-fir (Pseudotsuga
Menziesii). Ecology 76:2640–7.
Lewis JD, McKane RB, Tingey DT, Beedlow PA. 200070 . Vertical
gradients in photosynthetic light response within an old-
growth Douglas-fir and western hemlock canopy. Tree Physiol
20:447–56.
Lin G, Ehleringer JR. 1997. Carbon isotopic fractionation does
not occur during dark respiration in C3 and C4 plants. Plant
Physiol 114:391–4.
Litvak M. 1997. Environmental71 and biotic controls over the
production and emission of nonmethane hydrocarbons from
trees [PhD thesis]. Boulder: University of Colorado72 .
Marshall JD, Zhang J. 1994. Carbon isotope discrimination and
water-use efficiency in native plants of the north-central
Rockies. Ecology 75:1887–95.
Martin PH, Guenther AB. 1995. Insights into the dynamics of
forest succession and non-methane hydrocarbon trace gas
emissions. J Biogeogr 22:493–9.
McDowell NG, Phillips N, Lunch C, Bond BJ, Ryan MG. 2002.
An investigation of hydraulic limitation and compensation in
large, old Douglas-fir trees. Tree Physiol 22:763–74.
Medina E, Minchin P. 1980. Stratification of d13C values of
leaves in Amazonian rainforests. Oecologia (Berl) 45:355–
78.
Ogren E, Evans JR. 199373 . Photosynthetic light-response curves.
I. The influence of CO2 partial pressure and leaf inversion.
Planta (Berl) 189:182–90.
Parker GG, Harmon ME, Lefsky MA, Chen J, Van Pelt R, Weiss
SB, Thomas SC, Winner WE, Shaw DC, Franklin JF. 2004.
Three-dimensional structure of an old-growth Pseudotsuga–
74 Tsuga canopy and its implications for radiation balance,
microclimate, and atmospheric gas exchange.75 Ecosystems
7:440–53.
Paulson SE, Flagan RC, Seinfeld JH. 199276 . Atmospheric photo-
oxidation of isoprene. Part l: The reactions of isoprene with
hydroxyl radical and ground state atomic oxygen. Int J Chem
Kinet 24:79–101.
Paw U KT, Falk M, Suchanek TH, Ustin SL, Chen J, Park Y-S,
Winner WE, Thomas SC, Hsiao TC, Shaw RH and others.
2004. Carbon dioxide exchange77 between an old-growth forest
and the78 atmosphere. Ecosystems 7:513–24.
Phillips N, Bond BJ, McDowell NG, Ryan MG. 2002. Canopy and
hydraulic conductance in young, mature and old Douglas-fir
trees. Tree Physiol 22:205–11.
Pressley S, Lamb B, Westberg H, Claiborn C. In review. Mon-
oterpene80 emissions from a Pacific Northwest old growth forest.
In:79 American Geophysical Union Fall Meeting, EOS, Trans-
actions.
Pressley S, Lamb B, Westberg H, Guenther A. Monoterpene
emissions from a Pacific Northwest old growth forest.81 Tree
Physiol. In press.
Rasmussen RA, Khalil MAK. 1988. Isoprene over the Amazon
basin. J Geophys Res 93:1417–21.
Running SW. 1976. Environmental control of leaf water con-
ductance in conifers. Can J For Res 6:104–12.
Running SW, Coughlan JC. 198882 . A general model of forest
ecosystem processes of regional applications. I. Hydrologic
balance, canopy gas exchange and primary production proc-
esses. Ecol Modell 42:125–54.
Running SW, Gower ST. 199183 . A general model of forest eco-
system processes for regional applications. II. Nitrogen budgets
and carbon partitioning. Tree Physiol 9:147–60.
Ryan MJ, Yoder BJ. 1997. Hydraulic limits to tree height and
tree growth. Bioscience84 47:235–42.
Saxton KE, Rawls WJ, Romberger JS, Papendick RI. 1986. Es-
timating generalized soil-water characteristics from texture. J
Soil Sci Soc Am 90:1031–6.
Sharkey TD, Loreto F, Delwiche DF. 1991a. The biochemistry of
isoprene emission from leaves during photosynthesis. In:
Sharkey TD, Holland EA, Mooney HA editors. Trace gas
emissions from plants San Diego: Academic.
Sharkey TD, Loreto F, Delwiche DF. 1991b. High carbon dioxide
and sunshade effects on isoprene emissions from oak and
aspen tree leaves. Plant Cell Environ 14:333–8.
Talbot RW, Beecher KM, Harriss RC, Cofer WR. 1988. Atmos-
pheric geochemistry of formic and acetic acids at a mid-lati-
tude temperate site. J Geophys Res 93:1638–52.
Thomas SC, Winner WE. 2000. Leaf area index of an old-growth
Douglas-fir forest estimated from direct structural measure-
ments in the canopy. Can J For Res 30:1922–30.
Thomas SC, Winner WE. 2002. Photosynthetic differences be-
tween saplings and adult trees: an integration of field results
via meta-analysis. Tree Physiol 22:117–27.
Unsworth MH, Phillips N, Link T, Bond BJ, Falk M, Harmon ME,
Hinckley TM, Marks D, Paw U KT. 2004. Components and
controls of water flux in an85 old-growth Douglas-fir–western
hemlock ecosystem. Ecosystems86 7:468–81.
Valentini R, De Angelis P, Matteucci G, Monaco R, Dore S,
Scarascia Mugnozza GE. 1996. Seasonal net carbon dioxide
exchange of a beech forest with the atmosphere. Global
Change Biol 2:199–207.
Westberg H, Zimmerman P. 1993. Analytical methods used to
identify nonmethane organic compounds in ambient atmos-
pheres. In: Newman L editor. Measurement challenges in at-
mospheric chemistry Washington (DC): American Chemical
Society.[Advances in Chemistry Series 232].
Williams M, Eugster W, Rastetter EB, McFadden JP, Chapin FS.
2000. The controls on net ecosystem productivity along an
arctic transect:87 a model comparison with flux measurements.
88 Global Change Biol 6:(Suppl 1)116–26.
496 W. E. Winner and others

Williams M, Malhi Y, Nobre A, Rastetter EB, Grace J, Pereira
MGP. 1998. Seasonal variation in net carbon exchange and
evapotranspiration in a Brazilian rain forest: a modelling
analysis. Plant Cell Environ 21:953–68.
Williams M, Rastetter EB, Fernandes DN, Goulden ML,
Wofsy SC, Shaver GR, Melillo JM, Munger JW, Fan S-M,
Nadelhoffer KJ. 1996. Modelling the soil–plant–atmosphere
continuum in a Quercus–Acer stand at Harvard Forest:
the regulation of stomatal conductance by light, nitrogen
and soil/plant hydraulic properties. Plant Cell Environ 19:
911–27.
Wofsy SC, Goulden ML, Munger JW, Fan SM, Bakwin PS, Da-
ube BC, Bassow SL, Bazzaz FA. 1993. Net exchange of CO2 in
a mid-latitude forest. Science 260:1314–7.
Zhang JW, Marshall JD, Jaquish BC. 1993. Genetic differentia-
tion in carbon isotope discrimination and gas exchange in
Pseudotsuga menziesii: a common-garden experiment. Oecolo-
gia (Berl) 93:80–7.
Physiological Processes in Forest Canopies 497
Copyright © 2022 FDOKUMEN