
Maximum Utilization of Dynamic Rating Operated Distribution ...
21
energies Article Maximum Utilization of Dynamic Rating Operated Distribution Transformer (DRoDT) with Battery Energy Storage System: Analysis on Impact from Battery Electric Vehicles Charging Saifal Talpur 1, * , Tek Tjing Lie 1 , Ramon Zamora 1 and Bhaba Priyo Das 2 1 School of Engineering, Computer and Mathematical Sciences, Auckland University of Technology, Auckland 1010, New Zealand; [email protected] (T.T.L.); [email protected] (R.Z.) 2 ABB PGTR Hub (Asia), ABB Ltd., Singapore 139935, Singapore; [email protected] * Correspondence: [email protected] Received: 1 June 2020; Accepted: 30 June 2020; Published: 2 July 2020 Abstract: This paper investigates thermal overloading, voltage dips and insulation failure across a distribution transformer (DT), under residential and battery electric vehicle (BEV) loadings. The objective of this paper is to discuss the charging impact of BEVs on voltage across consumer-service points, as well as across the life of paper insulation under varying ambient temperatures (during winter and summer), with and without a centralized battery energy storage system (BESS). This study contributes in two ways. The first part of this study deals with coordinated and uncoordinated BEV charging scenarios. The second part of this study deals with maximum utilization of a test DT rated under dynamic thermal rating (DRoDT). The DRoDT integration with BESS is carried out to flatten the load spikes, to obtain maximum DT utilization, to achieve active power and voltage supports in addition to an enhanced DT lifespan. The obtained results indicate that, when test DT operates under the proposed hybrid technique (combining both dynamic transformer ratings and a centralized BESS), it attains maximum utilization, lower hot-spot temperature, enhanced lifespan, less degraded paper insulation and an improved voltage across each consumer service point. The proposed technique is furthermore found effective in maintaining the loading across the distribution transformer within the nominal limits. However, under excess loading during peak hours, the proposed technique provides relief to the DT to a certain extent. To achieve an optimal DT operation and an enhanced BESS lifespan, the BESS is operated under nominal charging and discharging cyclic limits. Under the proposed DRoDT integration with BESS, DT attains 25.9% more life when loaded with coordinated BEV charging, in comparison to no BESS integration under the same loading scenario. The worst loading due to uncoordinated BEV charging also brings 51% increase in DT life when loaded under the proposed technique. Keywords: battery energy storage system; coordinated versus uncoordinated battery electric vehicles charging; distribution transformer; dynamic transformer rating; paper insulation 1. Introduction A rising demand in battery electric vehicles (BEVs) is becoming the major cause of both the underutilization and overutilization of distribution transformers (DTs) in low-voltage (LV) distribution networks. The BEV fleet has got the potential to underutilize DTs (loaded below the design rating) or overutilize DTs (loaded above the design rating), based on their charging and demand profiles. An uncoordinated BEV charging load integration with the base load will significantly raise the hot-spot temperature inside the windings, becoming an ultimate cause of insulation degradation through Energies 2020, 13, 3411; doi:10.3390/en13133411 www.mdpi.com/journal/energies
-
Upload
khangminh22 -
Category
Documents
-
view
1 -
download
0
Transcript of Maximum Utilization of Dynamic Rating Operated Distribution ...

energies
Article
Maximum Utilization of Dynamic Rating OperatedDistribution Transformer (DRoDT) with BatteryEnergy Storage System: Analysis on Impact fromBattery Electric Vehicles Charging
Saifal Talpur 1,* , Tek Tjing Lie 1 , Ramon Zamora 1 and Bhaba Priyo Das 2
1 School of Engineering, Computer and Mathematical Sciences, Auckland University of Technology,Auckland 1010, New Zealand; [email protected] (T.T.L.); [email protected] (R.Z.)
2 ABB PGTR Hub (Asia), ABB Ltd., Singapore 139935, Singapore; [email protected]* Correspondence: [email protected]
Received: 1 June 2020; Accepted: 30 June 2020; Published: 2 July 2020
Abstract: This paper investigates thermal overloading, voltage dips and insulation failure acrossa distribution transformer (DT), under residential and battery electric vehicle (BEV) loadings.The objective of this paper is to discuss the charging impact of BEVs on voltage across consumer-servicepoints, as well as across the life of paper insulation under varying ambient temperatures (duringwinter and summer), with and without a centralized battery energy storage system (BESS). This studycontributes in two ways. The first part of this study deals with coordinated and uncoordinated BEVcharging scenarios. The second part of this study deals with maximum utilization of a test DT ratedunder dynamic thermal rating (DRoDT). The DRoDT integration with BESS is carried out to flattenthe load spikes, to obtain maximum DT utilization, to achieve active power and voltage supports inaddition to an enhanced DT lifespan. The obtained results indicate that, when test DT operates underthe proposed hybrid technique (combining both dynamic transformer ratings and a centralized BESS),it attains maximum utilization, lower hot-spot temperature, enhanced lifespan, less degraded paperinsulation and an improved voltage across each consumer service point. The proposed technique isfurthermore found effective in maintaining the loading across the distribution transformer withinthe nominal limits. However, under excess loading during peak hours, the proposed techniqueprovides relief to the DT to a certain extent. To achieve an optimal DT operation and an enhancedBESS lifespan, the BESS is operated under nominal charging and discharging cyclic limits. Under theproposed DRoDT integration with BESS, DT attains 25.9% more life when loaded with coordinatedBEV charging, in comparison to no BESS integration under the same loading scenario. The worstloading due to uncoordinated BEV charging also brings 51% increase in DT life when loaded underthe proposed technique.
Keywords: battery energy storage system; coordinated versus uncoordinated battery electric vehiclescharging; distribution transformer; dynamic transformer rating; paper insulation
1. Introduction
A rising demand in battery electric vehicles (BEVs) is becoming the major cause of both theunderutilization and overutilization of distribution transformers (DTs) in low-voltage (LV) distributionnetworks. The BEV fleet has got the potential to underutilize DTs (loaded below the design rating) oroverutilize DTs (loaded above the design rating), based on their charging and demand profiles. Anuncoordinated BEV charging load integration with the base load will significantly raise the hot-spottemperature inside the windings, becoming an ultimate cause of insulation degradation through
Energies 2020, 13, 3411; doi:10.3390/en13133411 www.mdpi.com/journal/energies
Energies 2020, 13, 3411 2 of 21
pyrolysis [1]. Additionally, due to aggregated BEV charging, distribution network operators (DNOs) areseen facing added complexity in securing and managing a reliable electricity flow in their networks [2,3].Hence, if left unaddressed, the problem can lead to cause congestion in the distribution networks as wellas can bring a non-optimal asset loading across assets like cables, feeders and distribution transformers.
BEV charging can take place under both fast and slow charging modes. Slow BEV charging canbe further classified in coordinated and uncoordinated charging. An uncoordinated BEV chargingis the type of charging which not only affects DT insulation but also causes phase and line voltagedrops in addition to increasing the system load factor [4]. Similarly, authors in Reference [4] have alsodemonstrated that uncoordinated BEV charging can significantly increase peak loading in a distributionnetwork regardless of uncontrolled or non-resilient charging patterns. Despite causing insecurity andcongestion in the network, the uncoordinated BEV charging is still widely adopted in contrast to smartBEV charging, mainly due to lack of communication infrastructures to enable demand response-basedBEV charging [3]. Under uncoordinated BEV charging, a vehicle is allowed to be charged whenplugged. This type of charging causes load spikes which can cause DT overloading. A DT operatingunder maximum utilization can address uncoordinated-BEV-charging-associated problems, providedit can handle the rising hot-spot temperature under no voltage violations, particularly at the end-mostresidential loads. As shown in Reference [5], uncoordinated BEV charging causes severe voltageviolations and DT overloading, leading to the likelihood of N-1 state.
The coordinated BEV charging method can reduce and/or eliminate congestion in the LV network,besides delaying the costly asset upgrades. Hence, by providing technical and economic benefits toDNOs, coordinated BEV charging is thus considered a better option over uncoordinated BEV charging.BEVs under coordinated BEV charging are not allowed to be charged at the plug-in time; instead,they are charged at the time defined by DNOs, usually the off-peak time. The benefits associatedwith delayed BEV charging are illustrated in References [4,6,7]; the authors in Reference [4] haveclaimed that coordinated-BEV-charging-based implementation will be able to improve asset efficiency,power quality and voltage regulation in the LV network. The coordinated BEV charging enablescoordination between local and centralized control systems leading towards effective congestionmanagement and participation in the electricity trading [6].
To obtain a reliable electricity flow and an efficient and/or optimal DT loading, increased BEVpenetration trend needs to be addressed through efficient charging techniques useful for both usersand the utilities. As an immediate asset to facilitate BEV charging, the DT efficiency and lifespan areheavily influenced by available battery capacity, current drawn, charger efficiency and the powerlimit of BEV chargers. The recent research work as published in References [8–11] has suggestedvarious viable techniques capable of addressing the LV network issues resulting from inefficientBEV charging. For instance, an optimized BEV charging schedule enables shifting the charging loadand simultaneously contributes towards shaved peak load spikes [8]. Similarly, as suggested inReference [9], an integrated technique combining the day-ahead load planning with optimized smartcharging can be effective toward minimizing the network congestion. In Reference [10], a fuzzy logiccontrol system was implemented to bring real-time communication between LV distribution systemand BEVs, to control the battery state of charge (SoC) based on electricity pricing. The implementationof incentive-based regulation, as suggested in Reference [11] will allow peak load shifting to minimizenetwork congestion.
The BEV penetration across distribution transformers is mainly seen as an unbalanced load,causing harmonics [12], increased loss of life and reduced DT lifespan [13]. The techniques likedemand response [14], demand response with dynamic rating [15], demand response in an intelligentgrid [16] and the usage of battery storage in the LV network to provide active and reactive powerbalancing [17,18] are considered as potential means towards relieving the loading stress acrossdistribution transformers in addition to an enhanced DT lifespan. However, when DTs are loaded,particularly under uncoordinated BEV charging, the challenges like voltage regulation and peakshaving amid improved DT life and costly asset upgrade deferral become major concerns for DNOs.
Energies 2020, 13, 3411 3 of 21
To counteract these problems, the hybrid approach is thus proposed in this study with an aim to solveDNO issues and bring maximum DT-utilization-based loading operation.
The remainder of this paper is organized as follows. Section 2 describes the motivation behindthe research work. Section 3 illustrates the methodology of the proposed work. Section 4 describes thetest system. Section 5 presents the results and highlights the discussion. Section 6 summarizes thefindings and presents the future work.
2. Motivation
Residential load aggregation with BEV charging load is carried out to obtain maximum DTutilization, which is beneficial for users, as well as for DNOs, in terms of reducing both losses and theasset upgrading costs. This work is inspired by References [13,15]. In Reference [13], the algorithm isdesigned to provide the maximum DT utilization under short-term emergency overloading. Similarly,the algorithm in Reference [15] is designed to make sure THST remains under 110 C, based on demandresponse and dynamic thermal rating techniques. Regardless of optimal DT design, loading theDTs above their normal cyclic loading will likely cause the temporary weakening in the dielectricstrength of insulation paper and oil, due to presence of gas bubbles when the temperature reaches140 C or above [13]. The model can moreover be feasible under loss of supply to make sure thatthe DT loading duration is within the nominal DT limits [19]. Besides, the voltage regulation inReference [13] was investigated without considering the voltage drop due to impedance of the servicecable. Similarly, the study considered phase voltage regulation without analyzing the voltage dropacross each household and/or the amount of voltage drop between the households nearest and farthestto the DT. Another drawback of the proposed algorithms in References [13,15] is their load profileconsideration for a single day instead of the entire seasonal-based loading.
The seasonal-load profile can provide better estimates regarding maximum peak demand andits impact on thermal loading, as well as the total loss of life (LoL) of the DT, as demonstrated inReference [20]. Furthermore, the algorithm in Reference [15] proposes maximum DT utilizationwithout considering the BEV charging load. Therefore, utilizing such an approach in presence of BEVcharging load will cause DT utilization above the maximum limits, leading to thermal overloads fora longer duration, particularly in case of slow BEV charging. Slow BEV charging moreover causesincreased thermal overload time across the DTs. References [7,13] have considered loading the DTabove the nominal thermal limits. The studies, however, lack in examining the impact of DT’S thermaloverloading on voltage drop across each household, i.e., the thermal load causing voltage beyondminimum nominal limits, hence compromising the network reliability.
The work presented in References [21,22] has demonstrated the BESS application in the LVnetwork. The loading impact of BEV charging on the DT is reduced through the stored energy [21],further useful to increase hosting capacity and reduce congestion in the LV network [22]. A centralizedBESS approach in Reference [21,22] is found useful to reduce congestion in the LV network and increasethe hosting capacity. The work, however, did not address the BESS charging/discharging impacton DT insulation and LoL. The voltage across each load point was also ignored under DT–BESSoperation. The proposed approach in this paper is therefore designed as a proof of concept to overcomeshortcomings of above studies by offering following objectives:
• Minimizing the BEV-charging impact on DT life.• BESS charging and discharging during low-price and high-price hours, respectively.• Flattening the load factor towards obtaining the DT operation within the nominal thermal limits.• Maintaining the voltage drop within nominal limits across each household.• Maximizing the paper insulation life of the distribution transformer.
The hybrid DRoDT–BESS technique is therefore proposed in this paper, to achieve the saidobjectives. The proposed technique is designed to not exceed the test DT’s temperature beyond 120 C(design nominal [19]) during winter with base load demand comparatively higher than during summer.
Energies 2020, 13, 3411 4 of 21
In this study, the weather-dependent DT thermal loading associated with electro-thermal coordination(ETC) between electrical and thermal parameters is carried out, where electrical parameter wasconsidered in the form of load factor as a ratio between actual and base loads and thermal parameterin the form of ambient temperature across the test DT. The relationship based on coordination betweenelectrical and thermal parameters is moreover found as effectively determining the maximum DTcapacity towards reliable transfer of excess electricity. For instance, a higher load factor under increasedambient temperature will limit the DT’s hosting and thermal capacities and will thus cause a rise involtage dip across consumer load points. Contrary to that, a reduced load-factor coupled with lowambient temperature will increase the DT’s hosting and thermal capacities, in addition to voltage surgeacross the load-points. In order to ensure an optimum DT operation to avoid these extreme conditions,this study therefore introduces the hybrid technique capable of achieving the core objectives.
The constraints like insulation degradation and excessive voltage dips in result of increased DTloading can be considered as bottlenecks to optimal power flow through distribution feeders and theDTs, resulting in overutilization of DTs, higher LoL, power flow limitations, increased congestionand costly asset upgrading. Contrary to that, load-factor decrement can lead to underutilizationof DTs and voltage surges. The DRoDT–BESS combination can bring DT loading within the limitsby providing an optimal load sharing between DT and the BESS, DT capacity enhancement and animproved power flow. The proposed technique can also be beneficial under the circumstances whenDT goes out for maintenance and the stored energy in the centralized BESS can be used to improvevoltage across each phase (a centralized BESS advantage over the decentralized BESS). BESS as agrid-booster, together with DRoDT can mitigate voltage violations at each consumer service point.As mentioned in Reference [14], voltage imbalance must be monitored at each consumer service point,not just across primary distribution levels. This study addresses this very issue by monitoring thevoltage across each consumer service point before and after BESS implementation, to analyze voltagedeviation from the allowable range and the required voltage improvement.
Regarding BESS feasibility, a centralized 100 kW BESS across the test LV distribution networkwas used in this study. The BESS was installed at the secondary side of the test DT, to provideload sharing with test DT, to obtain peak shaving and/or contribute towards valley filling. In thisstudy, BESS provided the optimal DT loading within the maximum limits. To get a better idea aboutfeasibility of the BESS, it is important to know the challenges and/or drawbacks that a BESS may bring,in addition to offering such benefits. The benefits associated with BESS, as per claimed in this study,may overweigh the drawbacks associated with BESS. It is because, the importance of installing BESS inthe LV network, particularly in this study is substantial towards as helping the test DT in fulfilling theload demand, mainly arising from BEVs. To make a fair judgment, following points will serve as bothbenefits and drawbacks, associated with integration of a centralized BESS:
• Reduced electricity cost by 16.7% per house/day after centralized BESS installation [23].• Substantial peak-load reduction in the MV/LV substation due to utility owned BESS over distributed
ownership of PV-battery system [24].• Reinforcement deferral of a 10 kV cable in the distribution network.• Leading to high investment costs but enabling the reduced loading across the DT while offering
the voltage support [25].• BESS as a possible solution to cope with drawbacks associated to DGs, such as voltage fluctuations,
reverse power flows and high capital costs [26].• Reduced life of lead-acid batteries when operating under high temperature and reduced efficiency
while operating under low temperature [27].
3. Methodology
In this study, an LV network with 40 households under base and BEV charging loads is designed.The loads are supplied electricity through a test DT and a centralized BESS. The BESS at the time of

Energies 2020, 13, 3411 5 of 21
charging through the test DT works as a load, while under discharging mode, it works as a source.DT–BESS integration is considered to fulfil the active power and voltage demands such that the DTattains maximum utilization within the maximum allowable loading while BESS operates withinthe optimal charging and discharging range (10–90%). The BESS size selection is based on attainingthe maximum DT utilization during off-peak and peak loading periods. This hybrid combination isimplemented to maximize the test DT’s utilization and bring an improvement in DT’s life, in addition toobtaining the within-limits voltage across each household under BEV charging scenarios. To make thispossible, the stored energy from the BESS is used at times of need. Additionally, the BESS charging anddischarging range is selected carefully, to avoid any undercharging and/or overcharging situation(s).
The test model is simulated under two BEV charging scenarios (coordinated and uncoordinated)to obtain respective load factor across each phase of the DT. The resulting phase load factors are usedin Algorihm-1 to obtain the resultant load-factor, top-oil temperature (in C) and winding hot-spottemperature (in C), degree of polymerization (DP) and the life of paper insulation during winterand summer months, in the year 2018. The working principle of Algorithm-1 is moreover shownin Figure 1. The purpose of the designed Algorithm-1 is twofold, i.e., to load the test DT in such away that it operates and attains maximum loading throughout the entire loading operation. The loadfactor across each phase of the test DT is calculated through the phase current ratios, as shown inEquation (1), indicating non-identical load factors across all three phases of the test DT under varyingnon-cyclic load currents flowing through each phase of the test DT. The phase load factors are thenused to find the unbalance load factor, representing the uneven load distribution through each phaseof the test DT, as shown in Equation (2) [13]. THST as shown in Equation (5) is calculated under theexponential equations method, as provided in Reference [19] by using TToT from Equations (3) and (4).An increment in TToT (TToTrise) is seen under increasing kunb and rising Ta as shown in Equation (3).Similarly, a decrement in TToT (TToTfall) is seen under decreasing kunb and falling Ta as shown inEquation (4). Both rising and falling TToT are then used with increasing and decreasing hot-spot totop-oil gradients to find THST from Equation (5).
ka =Iactual,a
Ibase, kb =
Iactual,b
Ibase, kc =
Iactual,c
Ibase(1)
kunb =
√(ka2 + kb
2 + kc2)
3(2)
TToTrise = (Ta + ∆Toi) +
∆Tor ×
[1 + R× kunb
2
1 + R
]x
− ∆Toi
×
(1− e
(−t)(k11∗τ0)
)(3)
TToT f all = (Ta + ∆Tor) ×[
1+R × kunb2
1 + R
]x
+∆Toi − ∆Tor ×
[1+R × kunb
2
1 + R
]x×
(e
(−t)(k11∗τ0)
) (4)
THST =(TToTrise/ f all +
(∆THrise − ∆TH f all
))(5)
Here, I is current in Amperes; ka, kb, kc represent phase load factors in p.u.; ∆Toi and ∆Tor aretop-oil temperature rise during start and steady states in degree K, respectively; k11 is thermal modelconstant; t is time variable in min; τ0 is oil-time constant; and R is ratio of load losses at rated currentto losses at no-load current. Equation (6) (Arrhenius formula) in Reference [19] is used to find thechange in degree of polymerization (DP) from initial DPstart = 1000 (at the start of the DT loading) tothe final DPtend (at time tend) as shown in Equation (6) [19].
1DPtend
=
(A× tend × exp
(EA
R× THST
))+
1DPstart
(6)
Energies 2020, 13, 3411 6 of 21
Here, DPtend is found at THST,end. The other parameters considered are the environmental factorA = 1.6× 10⁴ in h−1, gas constant R = 8.314 in J·K−1
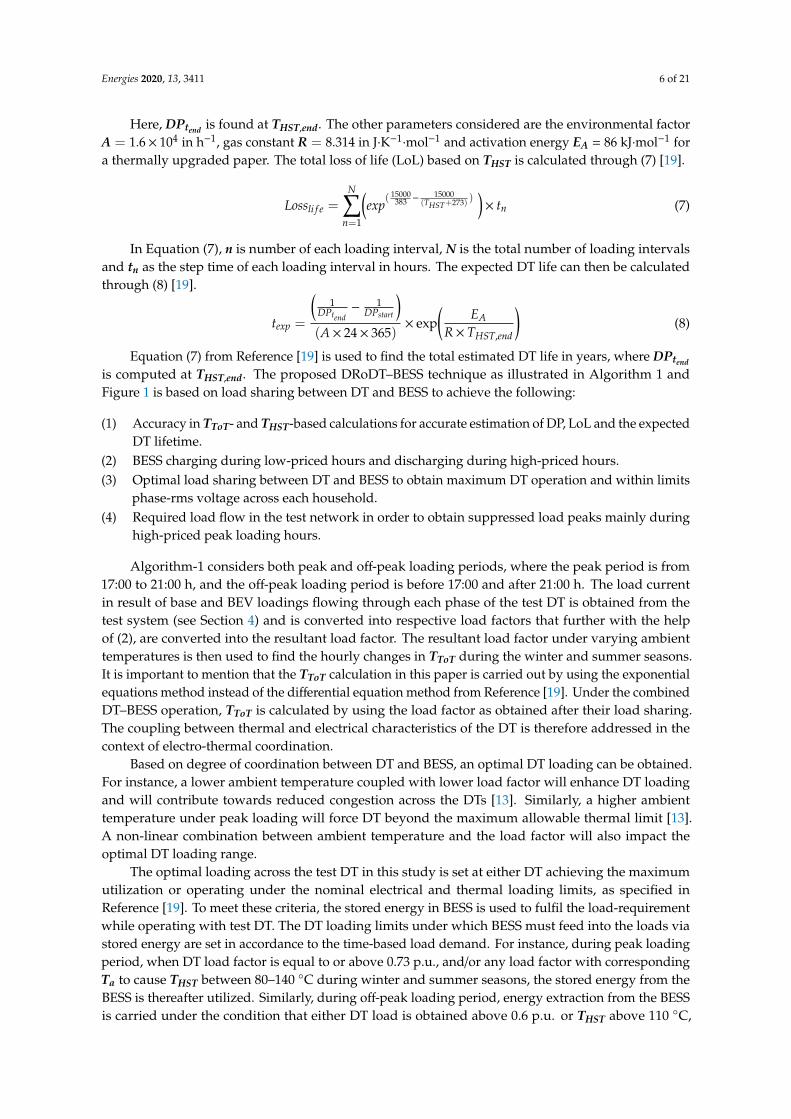
·mol−1 and activation energy EA = 86 kJ·mol−1 fora thermally upgraded paper. The total loss of life (LoL) based on THST is calculated through (7) [19].
Lossli f e =N∑
n=1
(exp
( 15000383 −
15000(THST+273) )
)× tn (7)
In Equation (7), n is number of each loading interval, N is the total number of loading intervalsand tn as the step time of each loading interval in hours. The expected DT life can then be calculatedthrough (8) [19].
texp =
(1
DPtend−
1DPstart
)(A× 24× 365)
× exp(
EAR× THST,end
)(8)
Equation (7) from Reference [19] is used to find the total estimated DT life in years, where DPtend
is computed at THST,end. The proposed DRoDT–BESS technique as illustrated in Algorithm 1 andFigure 1 is based on load sharing between DT and BESS to achieve the following:
(1) Accuracy in TToT- and THST-based calculations for accurate estimation of DP, LoL and the expectedDT lifetime.
(2) BESS charging during low-priced hours and discharging during high-priced hours.(3) Optimal load sharing between DT and BESS to obtain maximum DT operation and within limits
phase-rms voltage across each household.(4) Required load flow in the test network in order to obtain suppressed load peaks mainly during
high-priced peak loading hours.
Algorithm-1 considers both peak and off-peak loading periods, where the peak period is from17:00 to 21:00 h, and the off-peak loading period is before 17:00 and after 21:00 h. The load currentin result of base and BEV loadings flowing through each phase of the test DT is obtained from thetest system (see Section 4) and is converted into respective load factors that further with the helpof (2), are converted into the resultant load factor. The resultant load factor under varying ambienttemperatures is then used to find the hourly changes in TToT during the winter and summer seasons.It is important to mention that the TToT calculation in this paper is carried out by using the exponentialequations method instead of the differential equation method from Reference [19]. Under the combinedDT–BESS operation, TToT is calculated by using the load factor as obtained after their load sharing.The coupling between thermal and electrical characteristics of the DT is therefore addressed in thecontext of electro-thermal coordination.
Based on degree of coordination between DT and BESS, an optimal DT loading can be obtained.For instance, a lower ambient temperature coupled with lower load factor will enhance DT loadingand will contribute towards reduced congestion across the DTs [13]. Similarly, a higher ambienttemperature under peak loading will force DT beyond the maximum allowable thermal limit [13].A non-linear combination between ambient temperature and the load factor will also impact theoptimal DT loading range.
The optimal loading across the test DT in this study is set at either DT achieving the maximumutilization or operating under the nominal electrical and thermal loading limits, as specified inReference [19]. To meet these criteria, the stored energy in BESS is used to fulfil the load-requirementwhile operating with test DT. The DT loading limits under which BESS must feed into the loads viastored energy are set in accordance to the time-based load demand. For instance, during peak loadingperiod, when DT load factor is equal to or above 0.73 p.u., and/or any load factor with correspondingTa to cause THST between 80–140 C during winter and summer seasons, the stored energy from theBESS is thereafter utilized. Similarly, during off-peak loading period, energy extraction from the BESSis carried under the condition that either DT load is obtained above 0.6 p.u. or THST above 110 C,
Energies 2020, 13, 3411 7 of 21
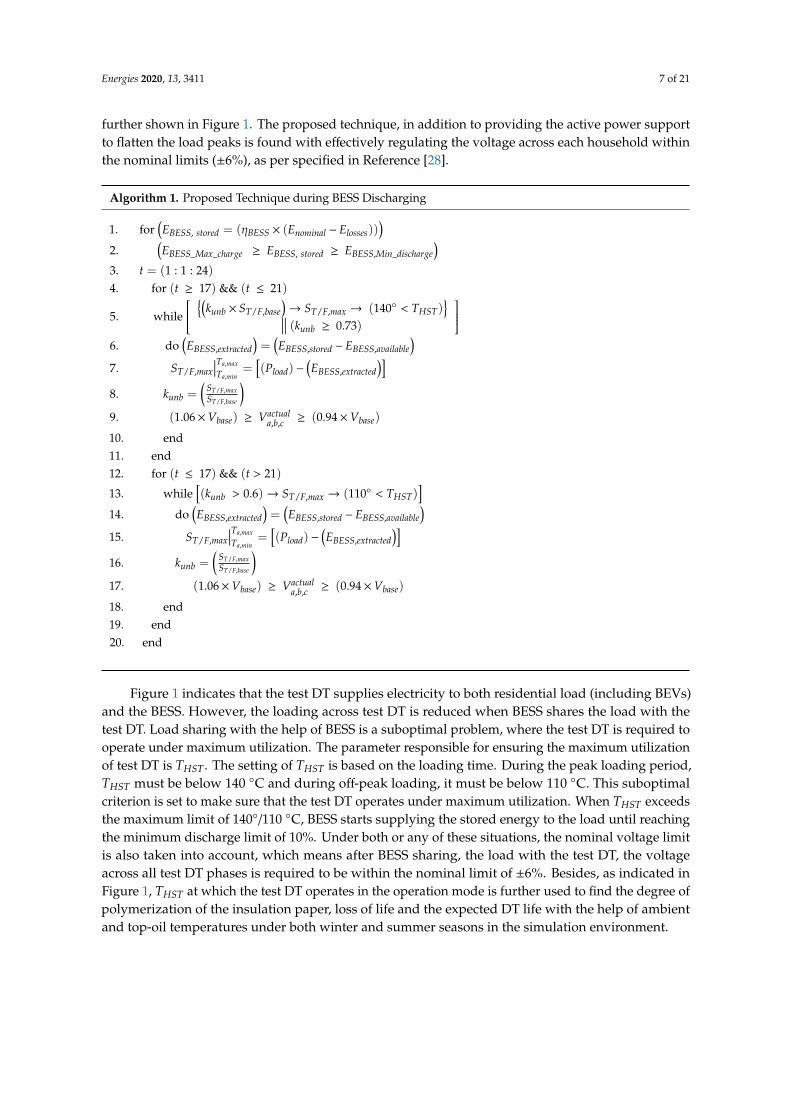
further shown in Figure 1. The proposed technique, in addition to providing the active power supportto flatten the load peaks is found with effectively regulating the voltage across each household withinthe nominal limits (±6%), as per specified in Reference [28].
Algorithm 1. Proposed Technique during BESS Discharging
1. for(EBESS, stored = (ηBESS × (Enominal − Elosses))
)2.
(EBESS_Max_charge ≥ EBESS, stored ≥ EBESS,Min_discharge
)3. t = (1 : 1 : 24)4. for (t ≥ 17) && (t ≤ 21)
5. while
(
kunb × ST/F,base)→ ST/F,max → (140 < THST)
∣∣∣∣∣∣ (kunb ≥ 0.73)
6. do
(EBESS,extracted
)=
(EBESS,stored − EBESS,available
)7. ST/F,max
∣∣∣Ta,max
Ta,min=
[(Pload) −
(EBESS,extracted
)]8. kunb =
(ST/F,maxST/F,base
)9. (1.06×Vbase) ≥ Vactual
a,b,c ≥ (0.94×Vbase)
10. end11. end12. for (t ≤ 17) && (t > 21)
13. while[(kunb > 0.6)→ ST/F,max → (110 < THST)
]14. do
(EBESS,extracted
)=
(EBESS,stored − EBESS,available
)15. ST/F,max
∣∣∣Ta,max
Ta,min=
[(Pload) −
(EBESS,extracted
)]16. kunb =
(ST/F,maxST/F,base
)17. (1.06×Vbase) ≥ Vactual
a,b,c ≥ (0.94×Vbase)
18. end19. end20. end
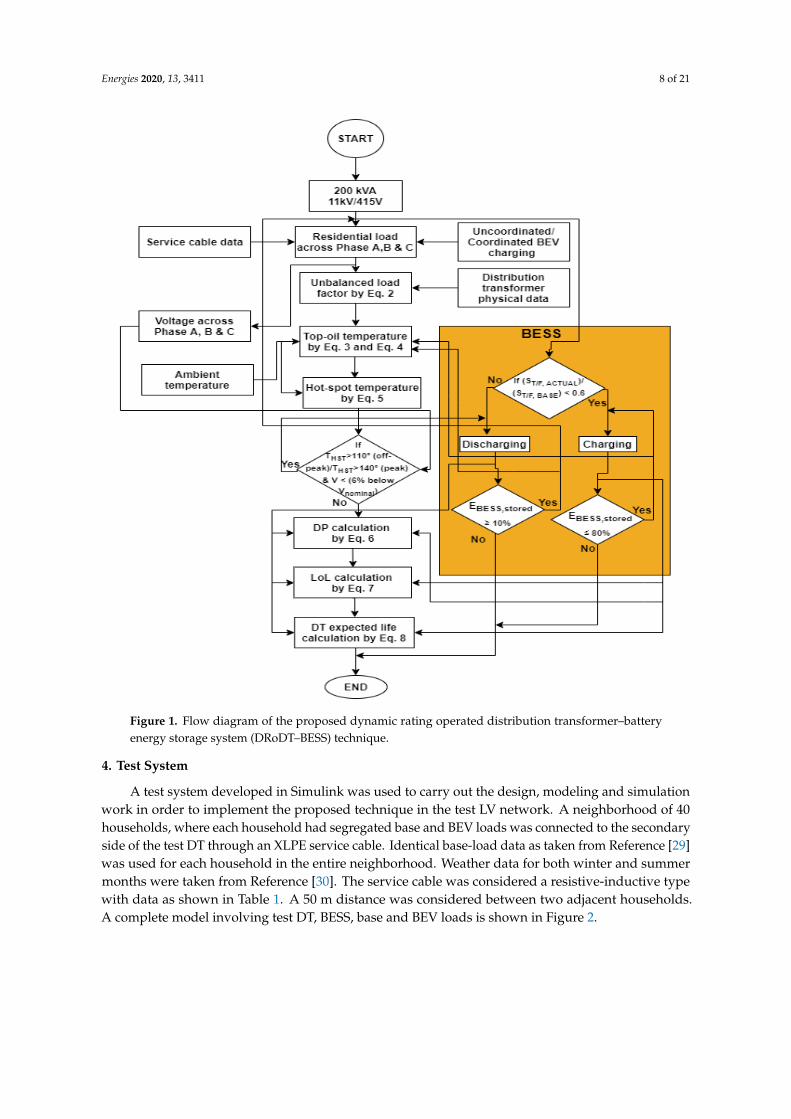
Figure 1 indicates that the test DT supplies electricity to both residential load (including BEVs)and the BESS. However, the loading across test DT is reduced when BESS shares the load with thetest DT. Load sharing with the help of BESS is a suboptimal problem, where the test DT is required tooperate under maximum utilization. The parameter responsible for ensuring the maximum utilizationof test DT is THST. The setting of THST is based on the loading time. During the peak loading period,THST must be below 140 C and during off-peak loading, it must be below 110 C. This suboptimalcriterion is set to make sure that the test DT operates under maximum utilization. When THST exceedsthe maximum limit of 140/110 C, BESS starts supplying the stored energy to the load until reachingthe minimum discharge limit of 10%. Under both or any of these situations, the nominal voltage limitis also taken into account, which means after BESS sharing, the load with the test DT, the voltageacross all test DT phases is required to be within the nominal limit of ±6%. Besides, as indicated inFigure 1, THST at which the test DT operates in the operation mode is further used to find the degree ofpolymerization of the insulation paper, loss of life and the expected DT life with the help of ambientand top-oil temperatures under both winter and summer seasons in the simulation environment.
Energies 2020, 13, 3411 8 of 21
Energies 2020, 13, x FOR PEER REVIEW 8 of 23
Type XLPE Insulated/Single Core/Copper Area 281 mm2
Resistance (mΩ) 0.081 (at H-1), 52.71 (at H-14) Reactance (mΩ) 0.082 (at H-1), 53.04 (at H-14)
Figure 1. Flow diagram of the proposed dynamic rating operated distribution transformer–battery
energy storage system (DRoDT–BESS) technique.
BEVs used in the test system were 24 kWh Nissan Leaf, charged through 6.6 kW single-phase Level 2 AC chargers at 240 Vrms and 32 A rated charging current with additional parameters, as shown in Table 2 under two charging scenarios, (1) coordinated and (2) uncoordinated. Under coordinated charging (controlled charging) scenario, all BEVs were charged during off-peak time, whereas under uncoordinated charging (uncontrolled charging) scenario, all BEVs were simultaneously charged during peak loading time (plug-in time). BEVs under uncoordinated charging scenario were allowed charging at the time of plugged-in, thus leading to cause voltage dips across each household, further increasing with cable length, hence higher voltage-drop across the farthest household than the household nearest to test DT. BEV state of the charge as shown in Table
Figure 1. Flow diagram of the proposed dynamic rating operated distribution transformer–batteryenergy storage system (DRoDT–BESS) technique.
4. Test System
A test system developed in Simulink was used to carry out the design, modeling and simulationwork in order to implement the proposed technique in the test LV network. A neighborhood of 40households, where each household had segregated base and BEV loads was connected to the secondaryside of the test DT through an XLPE service cable. Identical base-load data as taken from Reference [29]was used for each household in the entire neighborhood. Weather data for both winter and summermonths were taken from Reference [30]. The service cable was considered a resistive-inductive typewith data as shown in Table 1. A 50 m distance was considered between two adjacent households.A complete model involving test DT, BESS, base and BEV loads is shown in Figure 2.

Energies 2020, 13, 3411 9 of 21
Table 1. Service cable parameters.
Type XLPE Insulated/Single Core/Copper
Area 281 mm2
Resistance (mΩ) 0.081 (at H-1), 52.71 (at H-14)Reactance (mΩ) 0.082 (at H-1), 53.04 (at H-14)
Energies 2020, 13, x FOR PEER REVIEW 10 of 23
residential house nearest to and farthest from the test DT. A continuous hourly loading across the test DT for the whole month of July 2018 is seen to cause paper DP to fall from 1000 to 233.5, slightly above the end-of-life threshold of 200.
Figure 2. Single line diagram of the modeled 40-house network.
b. With BESS
Load sharing through BESS is obtained to relieve congestion across the test DT in addition to reducing the voltage dips across each household nearest to and farthest from the test DT, as shown in Figure 4. After BESS installation in the modeled LV network, 31.25% improvement in DP is obtained in comparison to the non-BESS installation under the same scenario. Similarly, 54.92% decrement in DT’s LoL is obtained in BESS presence under same weather and loading conditions.
5.1.2. Scenario 2: Uncoordinated BEV Charging during Summer
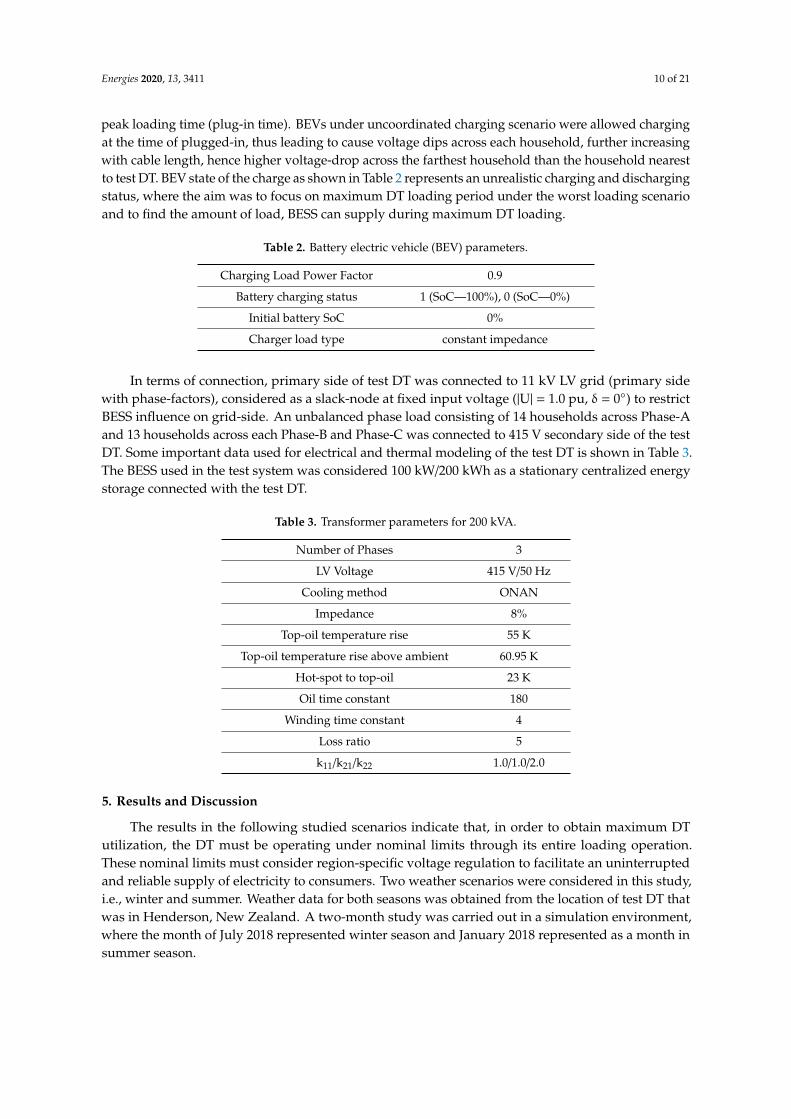
Figure 2. Single line diagram of the modeled 40-house network.
BEVs used in the test system were 24 kWh Nissan Leaf, charged through 6.6 kW single-phaseLevel 2 AC chargers at 240 Vrms and 32 A rated charging current with additional parameters, as shownin Table 2 under two charging scenarios, (1) coordinated and (2) uncoordinated. Under coordinatedcharging (controlled charging) scenario, all BEVs were charged during off-peak time, whereas underuncoordinated charging (uncontrolled charging) scenario, all BEVs were simultaneously charged during
Energies 2020, 13, 3411 10 of 21
peak loading time (plug-in time). BEVs under uncoordinated charging scenario were allowed chargingat the time of plugged-in, thus leading to cause voltage dips across each household, further increasingwith cable length, hence higher voltage-drop across the farthest household than the household nearestto test DT. BEV state of the charge as shown in Table 2 represents an unrealistic charging and dischargingstatus, where the aim was to focus on maximum DT loading period under the worst loading scenarioand to find the amount of load, BESS can supply during maximum DT loading.
Table 2. Battery electric vehicle (BEV) parameters.
Charging Load Power Factor 0.9
Battery charging status 1 (SoC—100%), 0 (SoC—0%)
Initial battery SoC 0%
Charger load type constant impedance
In terms of connection, primary side of test DT was connected to 11 kV LV grid (primary sidewith phase-factors), considered as a slack-node at fixed input voltage (|U| = 1.0 pu, δ = 0) to restrictBESS influence on grid-side. An unbalanced phase load consisting of 14 households across Phase-Aand 13 households across each Phase-B and Phase-C was connected to 415 V secondary side of the testDT. Some important data used for electrical and thermal modeling of the test DT is shown in Table 3.The BESS used in the test system was considered 100 kW/200 kWh as a stationary centralized energystorage connected with the test DT.
Table 3. Transformer parameters for 200 kVA.
Number of Phases 3
LV Voltage 415 V/50 Hz
Cooling method ONAN
Impedance 8%
Top-oil temperature rise 55 K
Top-oil temperature rise above ambient 60.95 K
Hot-spot to top-oil 23 K
Oil time constant 180
Winding time constant 4
Loss ratio 5
k11/k21/k22 1.0/1.0/2.0
5. Results and Discussion
The results in the following studied scenarios indicate that, in order to obtain maximum DTutilization, the DT must be operating under nominal limits through its entire loading operation.These nominal limits must consider region-specific voltage regulation to facilitate an uninterruptedand reliable supply of electricity to consumers. Two weather scenarios were considered in this study,i.e., winter and summer. Weather data for both seasons was obtained from the location of test DT thatwas in Henderson, New Zealand. A two-month study was carried out in a simulation environment,where the month of July 2018 represented winter season and January 2018 represented as a month insummer season.
Energies 2020, 13, 3411 11 of 21
5.1. DT Simulation Scenarios
5.1.1. Scenario 1: Uncoordinated BEV Charging during Winter
a. Without BESS
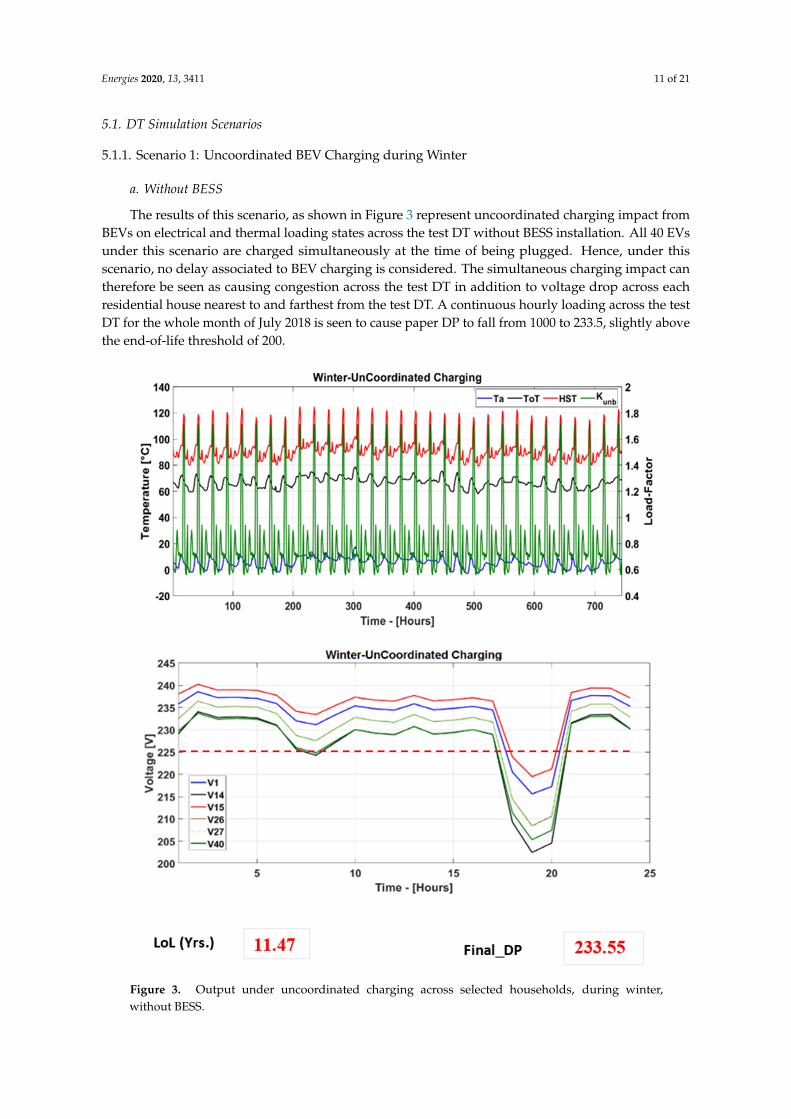
The results of this scenario, as shown in Figure 3 represent uncoordinated charging impact fromBEVs on electrical and thermal loading states across the test DT without BESS installation. All 40 EVsunder this scenario are charged simultaneously at the time of being plugged. Hence, under thisscenario, no delay associated to BEV charging is considered. The simultaneous charging impact cantherefore be seen as causing congestion across the test DT in addition to voltage drop across eachresidential house nearest to and farthest from the test DT. A continuous hourly loading across the testDT for the whole month of July 2018 is seen to cause paper DP to fall from 1000 to 233.5, slightly abovethe end-of-life threshold of 200.
Energies 2020, 13, x FOR PEER REVIEW 11 of 23
a. Without BESS
Under this scenario, besides BEV charging load, the ambient temperature is found to influence DT’s thermal loading. A significant rise in the ambient temperature is observed to increase 𝑻𝑯𝑺𝑻 by 11.56% and decrease DP by 10.85%, in comparison to the winter season under the identical residential and BEV charging load conditions, as shown in Figure 5.
Figure 3. Output under uncoordinated charging across selected households, during winter, without BESS.
Figure 3. Output under uncoordinated charging across selected households, during winter,without BESS.
Energies 2020, 13, 3411 12 of 21
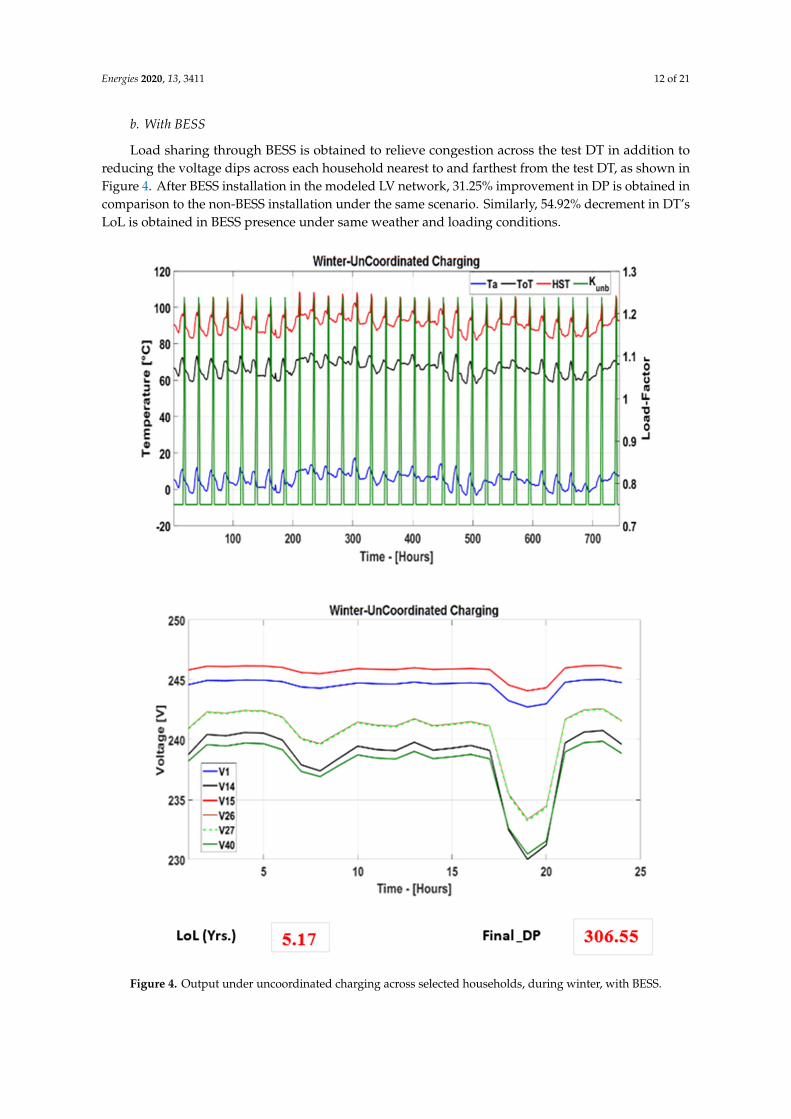
b. With BESS
Load sharing through BESS is obtained to relieve congestion across the test DT in addition toreducing the voltage dips across each household nearest to and farthest from the test DT, as shown inFigure 4. After BESS installation in the modeled LV network, 31.25% improvement in DP is obtained incomparison to the non-BESS installation under the same scenario. Similarly, 54.92% decrement in DT’sLoL is obtained in BESS presence under same weather and loading conditions.Energies 2020, 13, x FOR PEER REVIEW 12 of 23
Figure 4. Output under uncoordinated charging across selected households, during winter, with BESS. Figure 4. Output under uncoordinated charging across selected households, during winter, with BESS.
Energies 2020, 13, 3411 13 of 21
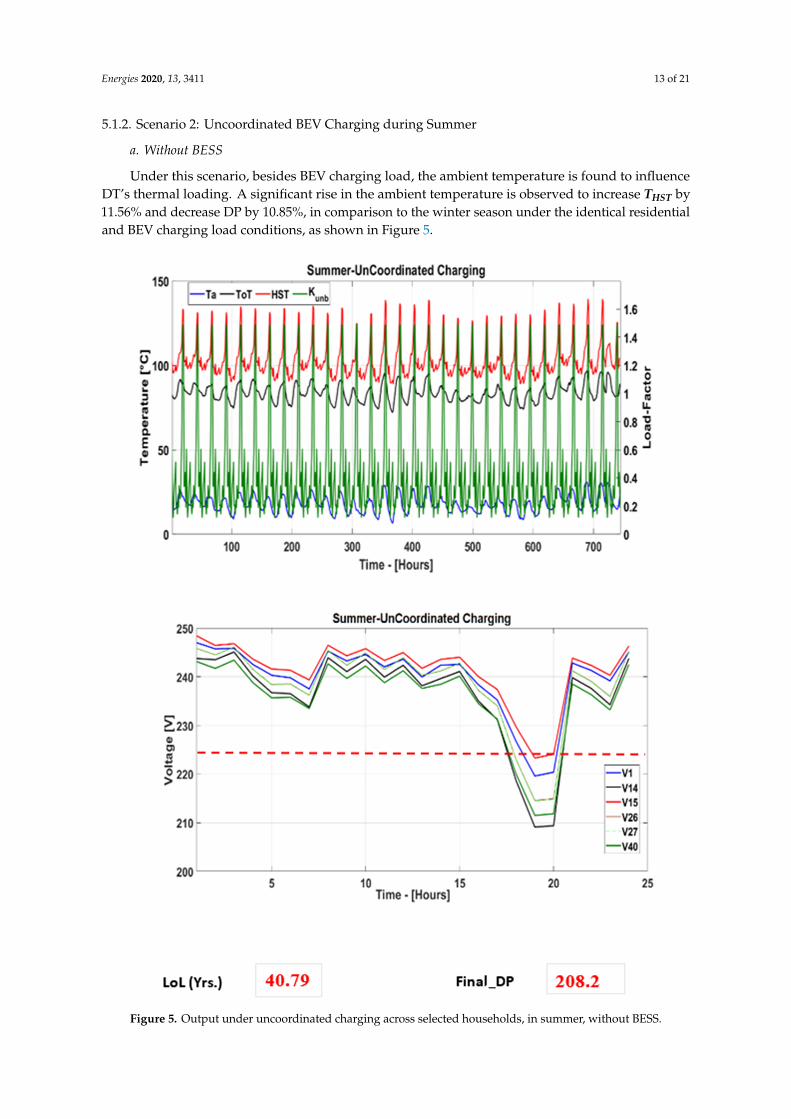
5.1.2. Scenario 2: Uncoordinated BEV Charging during Summer
a. Without BESS
Under this scenario, besides BEV charging load, the ambient temperature is found to influenceDT’s thermal loading. A significant rise in the ambient temperature is observed to increase THST by11.56% and decrease DP by 10.85%, in comparison to the winter season under the identical residentialand BEV charging load conditions, as shown in Figure 5.Energies 2020, 13, x FOR PEER REVIEW 13 of 23
Figure 5. Output under uncoordinated charging across selected households, in summer, without BESS.
b. With BESS
This scenario represents load sharing between BESS and test DT during the summer season. The results as shown in Figure 6 indicate that the presence of BESS can effectively mitigate DT thermal overloading in comparison to the scenario carried out under the absence of BESS. The results further indicate that the hybrid technique is capable of reducing the 𝑻𝑯𝑺𝑻 to a certain extent throughout the entire loading duration.
Figure 5. Output under uncoordinated charging across selected households, in summer, without BESS.
Energies 2020, 13, 3411 14 of 21
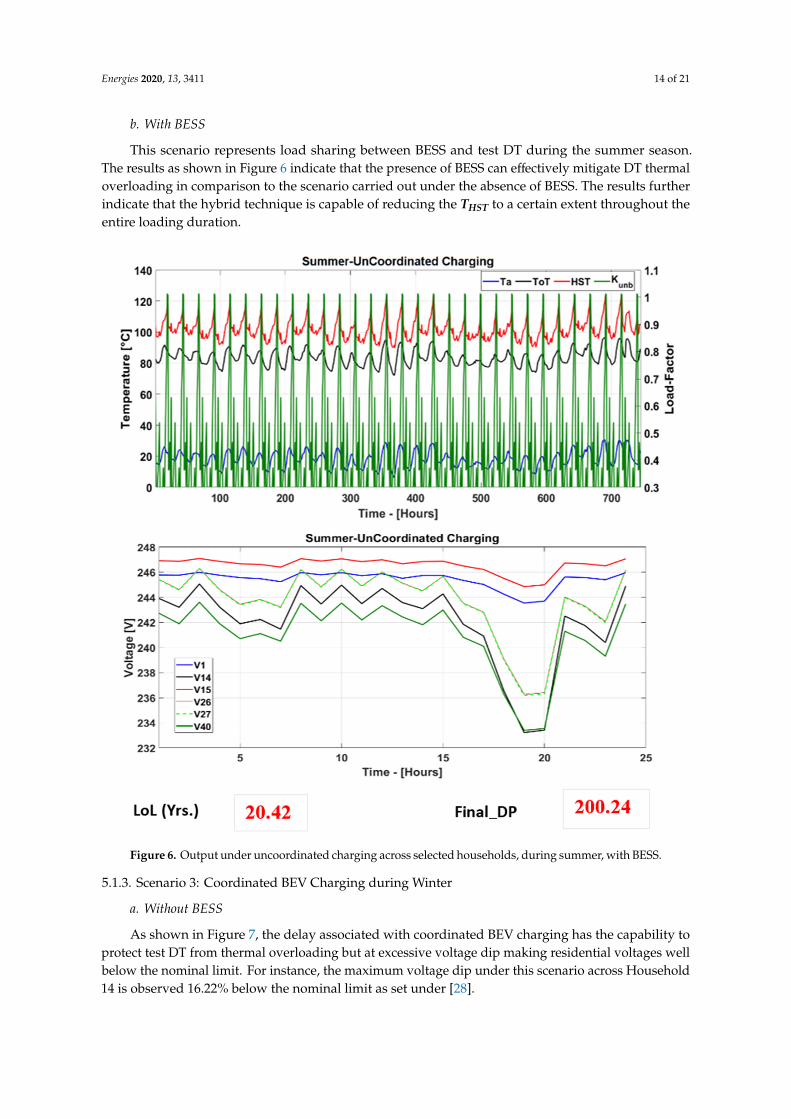
b. With BESS
This scenario represents load sharing between BESS and test DT during the summer season.The results as shown in Figure 6 indicate that the presence of BESS can effectively mitigate DT thermaloverloading in comparison to the scenario carried out under the absence of BESS. The results furtherindicate that the hybrid technique is capable of reducing the THST to a certain extent throughout theentire loading duration.
Energies 2020, 13, x FOR PEER REVIEW 14 of 23
Figure 6. Output under uncoordinated charging across selected households, during summer, with BESS.
5.1.3. Scenario 3: Coordinated BEV Charging during Winter
a. Without BESS
As shown in Figure 7, the delay associated with coordinated BEV charging has the capability to protect test DT from thermal overloading but at excessive voltage dip making residential voltages well below the nominal limit. For instance, the maximum voltage dip under this scenario across Household 14 is observed 16.22% below the nominal limit as set under [28].
b. With BESS
As shown in Figure 8, after BESS installation, not only load spikes are flattened but around 4.76% rise in voltage is also achieved across each residential load point during a 24 hour continuous DT operation in comparison to scenario with no BESS installation during the same season.
Figure 6. Output under uncoordinated charging across selected households, during summer, with BESS.
5.1.3. Scenario 3: Coordinated BEV Charging during Winter
a. Without BESS
As shown in Figure 7, the delay associated with coordinated BEV charging has the capability toprotect test DT from thermal overloading but at excessive voltage dip making residential voltages wellbelow the nominal limit. For instance, the maximum voltage dip under this scenario across Household14 is observed 16.22% below the nominal limit as set under [28].

Energies 2020, 13, 3411 15 of 21
Energies 2020, 13, x FOR PEER REVIEW 15 of 23
Figure 7. Output under coordinated charging across selected households, during winter, without BESS.
Figure 7. Output under coordinated charging across selected households, during winter, without BESS.
b. With BESS
As shown in Figure 8, after BESS installation, not only load spikes are flattened but around 4.76%rise in voltage is also achieved across each residential load point during a 24 h continuous DT operationin comparison to scenario with no BESS installation during the same season.
Energies 2020, 13, x FOR PEER REVIEW 16 of 23
Figure 8. Output under coordinated charging across selected households, during winter, with BESS.
5.1.4. Scenario 4: Coordinated BEV Charging during Summer
a. Without BESS
The results in Fig. 9 indicate that during summer, test DT is found with experiencing a comparatively high congestion, resulting in a significant rise in 𝑻𝑯𝑺𝑻 and in voltage drop across each household. Furthermore, LoL of the test DT without BESS is observed around 24.52% higher than DT LoL with BESS.
Figure 8. Output under coordinated charging across selected households, during winter, with BESS.
Energies 2020, 13, 3411 16 of 21
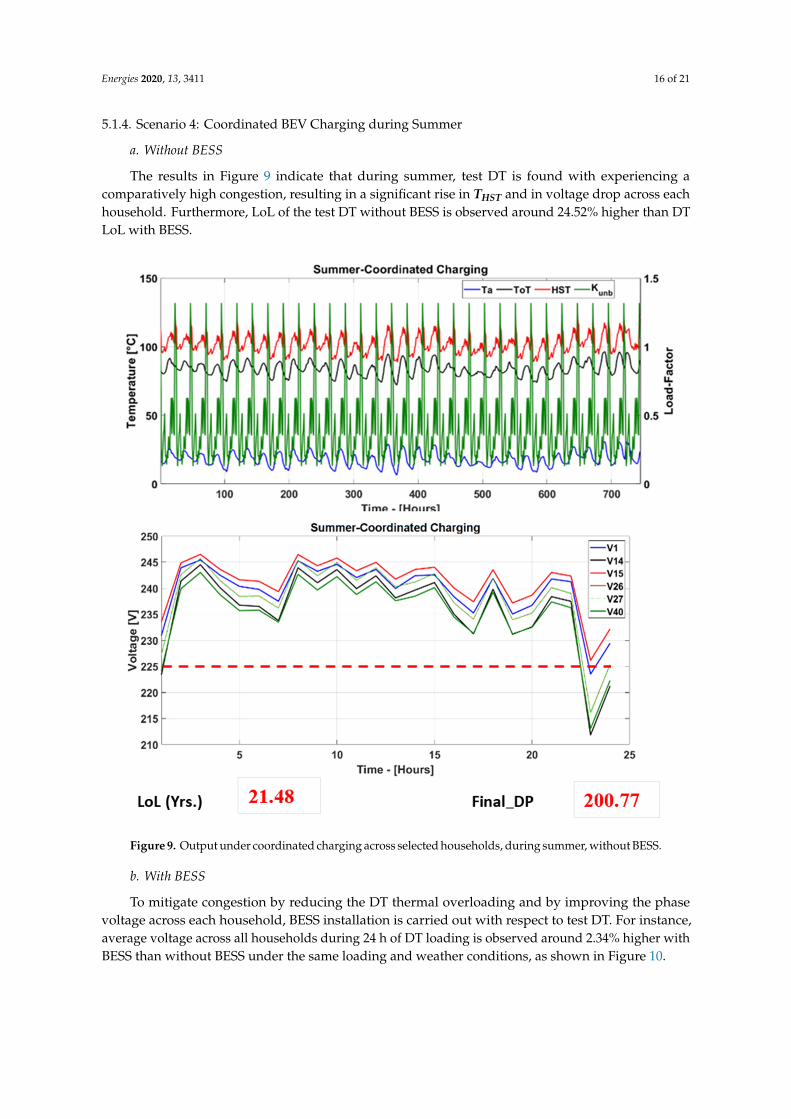
5.1.4. Scenario 4: Coordinated BEV Charging during Summer
a. Without BESS
The results in Figure 9 indicate that during summer, test DT is found with experiencing acomparatively high congestion, resulting in a significant rise in THST and in voltage drop across eachhousehold. Furthermore, LoL of the test DT without BESS is observed around 24.52% higher than DTLoL with BESS.Energies 2020, 13, x FOR PEER REVIEW 17 of 23
Figure 9. Output under coordinated charging across selected households, during summer, without BESS.
b. With BESS
To mitigate congestion by reducing the DT thermal overloading and by improving the phase voltage across each household, BESS installation is carried out with respect to test DT. For instance, average voltage across all households during 24 hour of DT loading is observed around 2.34% higher with BESS than without BESS under the same loading and weather conditions, as shown in Figure 10.
Figure 9. Output under coordinated charging across selected households, during summer, without BESS.
b. With BESS
To mitigate congestion by reducing the DT thermal overloading and by improving the phasevoltage across each household, BESS installation is carried out with respect to test DT. For instance,average voltage across all households during 24 h of DT loading is observed around 2.34% higher withBESS than without BESS under the same loading and weather conditions, as shown in Figure 10.

Energies 2020, 13, 3411 17 of 21
Energies 2020, 13, x FOR PEER REVIEW 18 of 23
Figure 10. Output under coordinated charging across selected households, during summer, with BESS.
5.2. Centralized BESS Integration
The integration of a centralized BESS with test DT is carried out to fulfil the load demand mainly in result of BEVs. BESS charging and discharging can be seen under nominal optimal range during all studied scenarios, as shown in Figure 11. The figure further indicates that BESS SoC remains between 10%-80% of the charging range. BESS integration during peak-loading period (under uncoordinated BEV charging) in winter resulted in optimal DT loading equivalent to 1.24 p.u. (i.e., well below the nominal cyclic loading [19] of the DT) with maximum 𝑻𝑯𝑺𝑻 obtained as 108.7 °C (below 120 °C). The same scenario in summer has resulted in optimal DT loading of 1.01 p.u. with maximum 𝑻𝑯𝑺𝑻 obtained around 124.7 °C (below maximum permissible limit of 140 °C [19]). During winter, the test system under uncoordinated BEV charging without BESS resulted in 30% higher DT loading in comparison to coordinated BEV charging. Similarly, test DT loading in result of uncoordinated BEV charging during winter season is found around 10% higher than under uncoordinated BEV charging. The results therefore indicate that BESS integration with a DT can
Figure 10. Output under coordinated charging across selected households, during summer, with BESS.
5.2. Centralized BESS Integration
The integration of a centralized BESS with test DT is carried out to fulfil the load demand mainlyin result of BEVs. BESS charging and discharging can be seen under nominal optimal range during allstudied scenarios, as shown in Figure 11. The figure further indicates that BESS SoC remains between10%-80% of the charging range. BESS integration during peak-loading period (under uncoordinatedBEV charging) in winter resulted in optimal DT loading equivalent to 1.24 p.u. (i.e., well below thenominal cyclic loading [19] of the DT) with maximum THST obtained as 108.7 C (below 120 C).The same scenario in summer has resulted in optimal DT loading of 1.01 p.u. with maximum THSTobtained around 124.7 C (below maximum permissible limit of 140 C [19]). During winter, the testsystem under uncoordinated BEV charging without BESS resulted in 30% higher DT loading incomparison to coordinated BEV charging. Similarly, test DT loading in result of uncoordinated BEVcharging during winter season is found around 10% higher than under uncoordinated BEV charging.
Energies 2020, 13, 3411 18 of 21
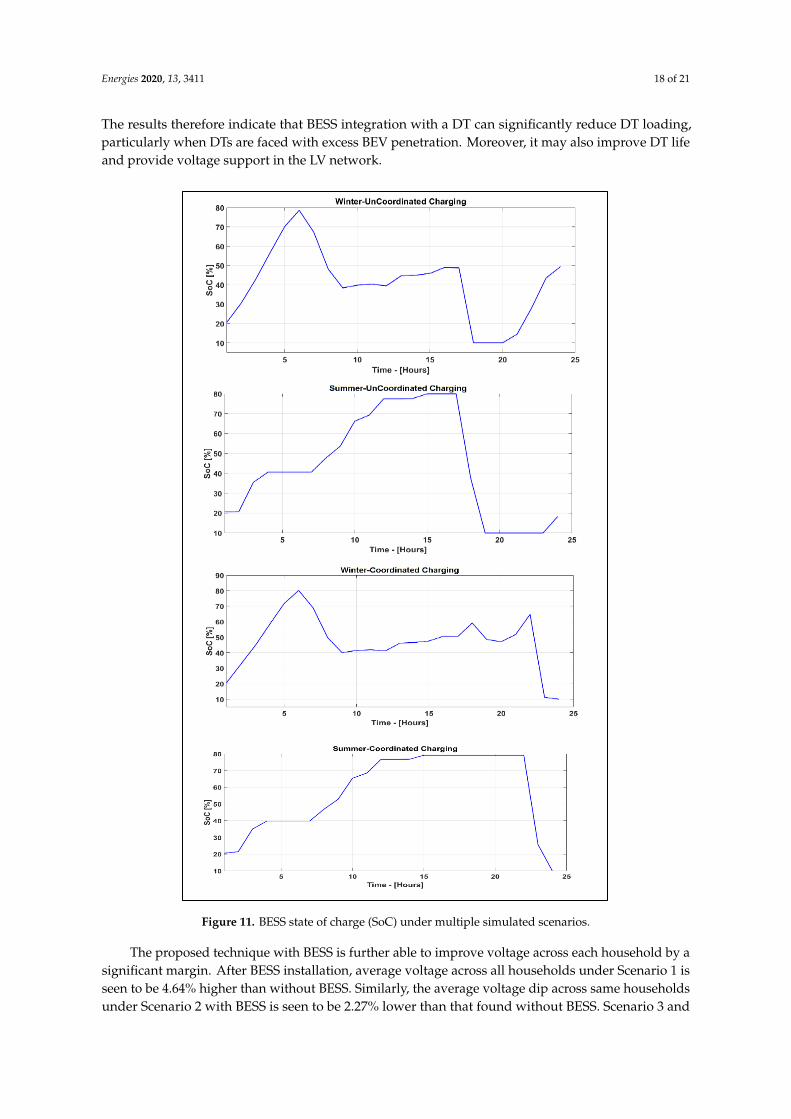
The results therefore indicate that BESS integration with a DT can significantly reduce DT loading,particularly when DTs are faced with excess BEV penetration. Moreover, it may also improve DT lifeand provide voltage support in the LV network.
Energies 2020, 13, x FOR PEER REVIEW 19 of 23
significantly reduce DT loading, particularly when DTs are faced with excess BEV penetration. Moreover, it may also improve DT life and provide voltage support in the LV network.
The proposed technique with BESS is further able to improve voltage across each household by a significant margin. After BESS installation, average voltage across all households under Scenario 1 is seen to be 4.64% higher than without BESS. Similarly, the average voltage dip across same households under Scenario 2 with BESS is seen to be 2.27% lower than that found without BESS. Scenario 3 and Scenario 4 are also observed with improved voltage across each household after BESS installation. For instance, before BESS installation, the average voltage drop during 24 hour of DT loading between Household 1 and Household 14 under Scenario 3 and Scenario 4 is obtained around 2.61% and 1.43%, respectively; that is then reduced to 2.45% and 1.37%, respectively after the BESS installation with test DT.
Figure 11. BESS state of charge (SoC) under multiple simulated scenarios. Figure 11. BESS state of charge (SoC) under multiple simulated scenarios.
The proposed technique with BESS is further able to improve voltage across each household by asignificant margin. After BESS installation, average voltage across all households under Scenario 1 isseen to be 4.64% higher than without BESS. Similarly, the average voltage dip across same householdsunder Scenario 2 with BESS is seen to be 2.27% lower than that found without BESS. Scenario 3 and
Energies 2020, 13, 3411 19 of 21
Scenario 4 are also observed with improved voltage across each household after BESS installation.For instance, before BESS installation, the average voltage drop during 24 h of DT loading betweenHousehold 1 and Household 14 under Scenario 3 and Scenario 4 is obtained around 2.61% and 1.43%,respectively; that is then reduced to 2.45% and 1.37%, respectively after the BESS installation withtest DT.
6. Conclusions and Future Work
In this paper, an integrated DRoDT–BESS technique is presented, which is unique in its “designingfor maximum utilization” concept. The obtained results indicate the capability of the proposedtechnique in reducing the congestion, DT thermal loading and voltage dips under studied BEVcharging scenarios and under different weather conditions. The objectives, such as optimal DT loading,optimum DT utilization under non-cyclic loading, accuracy regarding the TToT calculation, minimizedDT thermal loading, reduced congestion and voltage within the nominal limits, are achieved with thehelp of the proposed technique. Under the proposed technique, the minimized congestion and reducedthermal loading were obtained due to optimal timing factor associated with BESS charging/dischargingcycles. BESS charging was carried out during off-peak period, whereas the discharging took placeduring peak loading period and/or at the times of DT thermal loading going beyond the nominal thermaloverloading to benefit both end-consumers and the DNOs. For the end-consumers, the benefits like (1)reliable active power flow without any risk of load-shedding (through minimized DT overloading),(2) voltage within limits and (3) reduced electricity price were obtained. For the DNOs, the benefits like(1) longer DT life and (2) deferral of costly asset upgrading were obtained. Under ambient temperaturebased dynamic transformer rating and BESS integration, the proposed technique is found useful insignificantly reducing the test DT’s loss of life by 11.21% during winter when loaded under coordinatedBEV charging in comparison to loaded under uncoordinated BEV charging during the same season.Similarly, reduction in loss of life of the test DT during summer under coordinated BEV charging wasobserved around 15.52% lower than that observed under uncoordinated BEV charging.
As a future work, the technical and economic challenges associated with BESS are found asposing concerns on feasibility of the BESS. It is therefore important to take into account these issuesbefore operational usage of a BESS. Additionally, temperature variation, degradation and loss of life ofthe BESS are important parameters for a better evaluation of the BESS feasibility in the LV network.Their careful analysis and study will lead to decision making regarding the application of BESS in theLV network. These factors further lying out of the focus of the paper are therefore recommended as afuture work.
Author Contributions: S.T. proposed the approach, contributed in literature review, modelling, simulation,test study and in the manuscript write-up. T.T.L. proofread the manuscript. R.Z. contributed in critical review andin proofreading of the manuscript. B.P.D. contributed in providing the network information. All authors haveread and agreed to the published version of the manuscript.
Funding: This research received no external funding.
Conflicts of Interest: The authors declare no conflict of interest.
Nomenclature
Ia, Ib, Ic Phase load currentska, kb, kc Phase load factorsk11 Thermal model constantkunb unbalanced load factorST/F,base DT nominal kVAST/F,max DT maximum kVATToTrise Top-oil temperature riseTa Ambient temperatureTToT Top-oil temperature∆Toi Top-oil temperature rise at start

Energies 2020, 13, 3411 20 of 21
THST Winding hot-spot temperature∆THrise/ f all Hot-spot temperature rise/fall∆Toi Top-oil temperature rise at start∆Tor Top-oil temperature rise in steady stateτ0 Oil time constantR Ratio of load lossesDPstart DP at start of DT loadingDPtend DP at end of DT loading at time tA Environmental factorEA Activation energyn Number of loading intervalN Total number of loading intervalstn Step time of each loading intervaltexp Expected DT lifeEBESS, stored Stored energy in BESSηBESS BESS efficiencyEnominal BESS nominal energyElosses Losses in BESSEBESS_Max_charge BESS maximum chargingEBESS_Min_discharge BESS minimum dischargingEBESS,extracted Extracted energy from BESSEBESS,available Available energy in BESS
References
1. Hilshey, A.D.; Rezaei, P.; Hines, P.D.H.; Frolik, J. Electric Vehicle Charging: Transformer Impacts and Smart,Decentralized Solutions. In Proceedings of the IEEE Power and Energy Society General Meeting, San Diego,CA, USA, 22–26 July 2012; pp. 1–8. [CrossRef]
2. Muratori, M. Impact of uncoordinated plug-in electric vehicle charging on residential power demand.Nat. Energy 2018, 3. [CrossRef]
3. Jarvis, R.; Moses, P. Smart Grid Congestion Caused by Plug-in Electric Vehicle Charging. In Proceedings ofthe IEEE Texas Power and Energy Conference (TPEC), College Station, TX, USA, 7–8 February 2019; pp. 1–5.
4. Sortomme, E.; Hindi, M.M.; MacPherson, S.D.J.; Venkata, S.S. Coordinated Charging of Plug-In HybridElectric Vehicles to Minimize Distribution System Losses. IEEE Trans. Smart Grid 2011, 2, 198–205. [CrossRef]
5. Akhavan-Rezai, E.; Shaaban, M.F.; El-Saadany, E.F.; Zidan, A. Uncoordinated Charging Impacts of ElectricVehicles on Electric Distribution Grids: Normal and Fast Charging Comparison. In Proceedings of the 2012IEEE Power and Energy Society General Meeting, San Diego, CA, USA, 22–26 July 2012; pp. 1–7. [CrossRef]
6. Lopes, J.A.P.; Soares, F.J.; Almeida, P.M.R. Integration of Electric Vehicles in the Electric Power System.Proc. IEEE 2011, 99, 168–183. [CrossRef]
7. El-Bayeh, C.Z.; Mougharbel, I.; Asber, D.; Saad, M.; Chandra, A.; Lefebvre, S. Novel Approach for Optimizingthe Transformer’s Critical Power Limit. IEEE Access 2018, 6, 55870–55882. [CrossRef]
8. Wi, Y.; Lee, J.; Joo, S. Electric vehicle charging method for smart homes/buildings with a photovoltaic system.IEEE Trans. Consum. Electron. 2013, 59, 323–328. [CrossRef]
9. Paterakis, N.G.; Erdinç, O.; Bakirtzis, A.G.; Catalão, J.P.S. Optimal Household Appliances Scheduling UnderDay-Ahead Pricing and Load-Shaping Demand Response Strategies. IEEE Trans. Ind. Inform. 2015, 11,1509–1519. [CrossRef]
10. Salama, H.S.; Said, S.M.; Vokony, I.; Hartmann, B. Impact of Different Plug-in Electric Vehicle Categories onDistribution Systems. In Proceedings of the 2019 7th International Istanbul Smart Grids and Cities Congressand Fair (ICSG), Istanbul, Turkey, 25–26 April 2019; pp. 109–113. [CrossRef]
11. Veldman, E.; Verzijlbergh, R.A. Distribution Grid Impacts of Smart Electric Vehicle Charging From DifferentPerspectives. IEEE Trans. Smart Grid 2015, 6, 333–342. [CrossRef]
12. Das, B.; Jalal, T.S.; McFadden, F.J.S. Comparison and extension of IEC thermal models for dynamic ratingof distribution transformers. In Proceedings of the 2016 IEEE International Conference on Power SystemTechnology (POWERCON), Wollongong, NSW, Australia, 28 September–1 October 2016; pp. 1–8. [CrossRef]
Energies 2020, 13, 3411 21 of 21
13. Bunn, M.; Das, B.P.; Seet, B.; Baguley, C. Empirical Design Method for Distribution Transformer UtilizationOptimization. IEEE Trans. Power Deliv. 2019, 34, 1803–1813. [CrossRef]
14. Medina, J.; Muller, N.; Roytelman, I. Demand Response and Distribution Grid Operations: Opportunitiesand Challenges. IEEE Trans. Smart Grid 2010, 1, 193–198. [CrossRef]
15. Humayun, M.; Safdarian, A.; Degefa, M.Z.; Lehtonen, M. Demand Response for Operational Life Extensionand Efficient Capacity Utilization of Power Transformers During Contingencies. IEEE Trans. Power Syst.2015, 2015. 30, 2160–2169. [CrossRef]
16. Shao, S.; Pipattanasomporn, M.; Rahman, S. Demand Response as a Load Shaping Tool in an Intelligent GridWith Electric Vehicles. IEEE Trans. Smart Grid 2011, 4, 624–631. [CrossRef]
17. Gusev, Y.P.; Subbotin, V.P. Using Battery Energy Storage Systems for Load Balancing and Reactive PowerCompensation in Distribution Grids. In Proceedings of the 2019 International Conference on IndustrialEngineering, Applications and Manufacturing (ICIEAM), Sochi, Russia, 25–29 March 2019; pp. 1–5.
18. Viernstein, L.; Witzmann, R.; Przibylla, J. Grid voltage level spanning operational strategies for batteryenergy storage systems in distribution grids. In Proceedings of the 2016 IEEE Electrical Power and EnergyConference (EPEC), Ottawa, ON, USA, 12–14 October 2016; pp. 1–6.
19. IEC Standard 60076–7. Power Transformers—Part 7: Loading Guide for Mineral-Oil-Immersed PowerTransformers. 2018. Available online: https://webstore.iec.ch/publication/34351 (accessed on 1 July 2020).
20. Schneider, K.C.; Hoad, R.F. Initial transformer sizing for single-phase residential load. IEEE Trans. Power Deliv.1992, 7, 2074–2081. [CrossRef]
21. Kröger, D.; Rauma, K.; Spina, F.; Rehtanz, C. Scheduled Charging of Electric Vehicles and the Increase ofHosting Capacity by a Stationary Energy Storage. In Proceedings of the CIRED 2019 Conference, Madrid,Spain, 3–6 June 2019.
22. Specht, L.; Rauma, K.; Spina, A.; Rehtanz, C. Autonomous and Cost-Efficient Operation of a StationaryBattery Energy Storage in Low Voltage Networks. In Proceedings of the CIRED 2019 Conference, Madrid,Spain, 3–6 June 2019.
23. Qiao, Z.; Yang, J. Comparison of centralised and distributed battery energy storage systems in LV distributionnetworks on operational optimisation and financial benefits. J. Eng. 2017, 2017, 1671–1675. [CrossRef]
24. Degefa, M.Z.; Sæle, H.; Foosnaes, J.A.; Thorshaug, E. Seasonally variant deployment of electric batterystorage systems in active distribution networks. CIRED Open Access Proc. J. 2017, 2017, 1975–1979. [CrossRef]
25. Nykamp, S.; Rott, T.; Dettke, N.; Kueppers, S. The Project “ElChe” Wettringen: Storage as an Alternativeto Grid Reinforcements—Experiences, Benefits and Challenges from a DSO Point of View. In Proceedingsof the International ETG Congress 2015: Die Energiewende—Blueprints for the New Energy Age, Bonn,Germany, 17–18 November 2015; pp. 1–6.
26. Lorente, J.L.; Liu, X.A.; Best, R.; Morrow, D.J. Energy Storage Allocation in Power Networks—A State-of-the-ArtReview. In Proceedings of the 2018 53rd International Universities Power Engineering Conference (UPEC),Glasgow, Scotland, 4–7 September 2018; pp. 1–6. [CrossRef]
27. Divya, C.K.; Østergaard, J. Battery energy storage technology for power systems—An overview. Electr. PowerSyst. Res. 2009, 79, 511–520. [CrossRef]
28. AS/NZS 3000. Electrical Installations—Known as the Australian/New Zealand Wiring Rules. 2018. Availableonline: https://shop.standards.govt.nz/catalog/3000:2018(AS%7CNZS)/scope? (accessed on 1 July 2020).
29. BRANZ. Available online: https://www.branz.co.nz/cms_show_download.php?id=
9d566b918fccd025f0d7d979e9e6d5df71b1101b/ (accessed on 3 October 2019).30. National Institute of Water and Atmospheric Research (NIWA). Available online: https://cliflo.niwa.co.nz/
(accessed on 3 October 2019).
© 2020 by the authors. Licensee MDPI, Basel, Switzerland. This article is an open accessarticle distributed under the terms and conditions of the Creative Commons Attribution(CC BY) license (http://creativecommons.org/licenses/by/4.0/).