Computational fluid dynamics simulation and experimental ...
9
* Corresponding author. 1944-3994/1944-3986 © 2019 Desalination Publications. All rights reserved. Desalination and Water Treatment www.deswater.com doi: 10.5004/dwt.2019.24316 162 (2019) 70–78 September Computational fluid dynamics simulation and experimental verification of hydrodynamic performance of submerged membrane bioreactor equipped with micro-channel turbulence promoters at different transverse spacing Fang Xie, Hui Ge, Jinrong Liu*, Weiwei Chen School of Chemical Engineering, Inner Mongolia University of Technology, Hohhot, China, Tel. +864716576661; Fax: +864716503298; emails: [email protected] (J.R. Liu), [email protected] (F. Xie), [email protected] (H. Ge), [email protected] (W.W. Chen) Received 26 February 2018; Accepted 23 April 2019 abstract The purpose of the present work is to investigate the effect of micro-channel turbulence promoter (MCTP) installation on hydrodynamic performance of submerged membrane bioreactors (SMBRs). Computational fluid dynamics (CFD) for three-phase flows was used to simulate and analyze the hydrodynamics of submerged membrane bioreactors equipped with micro-channel turbulence promoters with different spacing (106, 80 and 64 mm) in the horizontal orientation. CFD simulation results indicated that the average liquid phase velocity, gas holdup, average gas phase velocity, turbulent kinetic energy and wall shear stress in SMBR with the spacing of 80 mm were higher than those of the spacing of 64 and 106 mm. The filtration performance showed that compared with that of the spacing of 64 and 106 mm, the critical flux in SMBR with the spacing distance of 80 mm increased by 19.32% and 27.76%, respectively and the total resistance reduces 4.47% and 10.90%, respectively. These results suggested that for SMBR equipped with MCTP with the appropriate spacing distance, it is possible to enhance the turbulent intensity, suppress the cake formation on the membrane surface so as to mitigate membrane fouling in SMBR. Keywords: Micro-channel turbulence promoter; Flat sheet membrane; Wastewater; Membrane fouling; CFD 1. Introduction The membrane bioreactor (MBR) has become an increas- ingly attractive technology in wastewater treatment and water reclamation in the past decades due to their outstanding advantages over the conventional activated sludge systems such as an excellent effluent, small footprint and less excess sludge. However, membrane fouling is still the major obstacle to the limitation of widespread application of MBRs [1,2]. Therefore, many studies have been focused on the alleviation of membrane fouling, in which hydrodynamic approaches are the promising technology for the control of membrane fouling in an MBR. Recently, the micro-channel turbulence promoter was presented to be equipped with an MBR as one of the hydrodynamic approaches to mitigate the membrane fouling [3]. Zhang et al. [4] used CFD to simulate and optimize the loading densities of flat membrane modules. The simula- tion results showed that the membrane elements which were in the middle of the reactor had the bigger wall shear stress than that near the wall of the reactor. According to simulation results of mixture flow and the probability of sludge settling at the membrane surface, the clear spacing which 4 mm performed worst, inferior to the clear spac- ing of 8 mm, and the 11 mm, so the clear spacing of 6 mm was the best. Cao et al. [5] employed CFD to investigate the enhanced membrane performance of spacer-filled chan- nels determined by the fluid flow patterns induced by the
-
Upload
khangminh22 -
Category
Documents
-
view
0 -
download
0
Transcript of Computational fluid dynamics simulation and experimental ...

* Corresponding author.
1944-3994/1944-3986 © 2019 Desalination Publications. All rights reserved.
Desalination and Water Treatment www.deswater.com
doi: 10.5004/dwt.2019.24316
162 (2019) 70–78September
Computational fluid dynamics simulation and experimental verification of hydrodynamic performance of submerged membrane bioreactor equipped with micro-channel turbulence promoters at different transverse spacing
Fang Xie, Hui Ge, Jinrong Liu*, Weiwei ChenSchool of Chemical Engineering, Inner Mongolia University of Technology, Hohhot, China, Tel. +864716576661; Fax: +864716503298; emails: [email protected] (J.R. Liu), [email protected] (F. Xie), [email protected] (H. Ge), [email protected] (W.W. Chen)
Received 26 February 2018; Accepted 23 April 2019
a b s t r a c tThe purpose of the present work is to investigate the effect of micro-channel turbulence promoter (MCTP) installation on hydrodynamic performance of submerged membrane bioreactors (SMBRs). Computational fluid dynamics (CFD) for three-phase flows was used to simulate and analyze the hydrodynamics of submerged membrane bioreactors equipped with micro-channel turbulence promoters with different spacing (106, 80 and 64 mm) in the horizontal orientation. CFD simulation results indicated that the average liquid phase velocity, gas holdup, average gas phase velocity, turbulent kinetic energy and wall shear stress in SMBR with the spacing of 80 mm were higher than those of the spacing of 64 and 106 mm. The filtration performance showed that compared with that of the spacing of 64 and 106 mm, the critical flux in SMBR with the spacing distance of 80 mm increased by 19.32% and 27.76%, respectively and the total resistance reduces 4.47% and 10.90%, respectively. These results suggested that for SMBR equipped with MCTP with the appropriate spacing distance, it is possible to enhance the turbulent intensity, suppress the cake formation on the membrane surface so as to mitigate membrane fouling in SMBR.
Keywords: Micro-channel turbulence promoter; Flat sheet membrane; Wastewater; Membrane fouling; CFD
1. Introduction
The membrane bioreactor (MBR) has become an increas-ingly attractive technology in wastewater treatment and water reclamation in the past decades due to their outstanding advantages over the conventional activated sludge systems such as an excellent effluent, small footprint and less excess sludge. However, membrane fouling is still the major obstacle to the limitation of widespread application of MBRs [1,2]. Therefore, many studies have been focused on the alleviation of membrane fouling, in which hydrodynamic approaches are the promising technology for the control of membrane fouling in an MBR. Recently, the micro-channel turbulence promoter was presented to be equipped with an MBR as one
of the hydrodynamic approaches to mitigate the membrane fouling [3].
Zhang et al. [4] used CFD to simulate and optimize the loading densities of flat membrane modules. The simula-tion results showed that the membrane elements which were in the middle of the reactor had the bigger wall shear stress than that near the wall of the reactor. According to simulation results of mixture flow and the probability of sludge settling at the membrane surface, the clear spacing which 4 mm performed worst, inferior to the clear spac-ing of 8 mm, and the 11 mm, so the clear spacing of 6 mm was the best. Cao et al. [5] employed CFD to investigate the enhanced membrane performance of spacer-filled chan-nels determined by the fluid flow patterns induced by the
71F. Xie et al. / Desalination and Water Treatment 162 (2019) 70–78
spacer filaments. The CFD simulation also suggested that reducing the transverse filament distance would reduce the distance between shear stress peaks and consequently intro-duce larger shear stress regions near the wall region and increased the number of eddies. Shakaib et al. [6] applied three-dimensional CFD to simulate spacer-obstructed feed channels of membrane elements. When filament spacing and flow attack angles were small, the average shear stress values were high. The shear stress distribution was more uniform in diamond spacers when the flow attack angle was high and in parallel spacers when transverse filament thickness was small. Jafarkhan et al. [7] put to used three- dimensional (3D) simulation based on CFD for the fluid flow in the membrane tubes inserted semi-circular baffles, it was found that the fluid average velocity, shear stress and mass transfer on the tube wall increased by exten-sion of the baffle angles from 90° to 180°. In addition, the filtration performance was significantly improved by the new arrangement. Liu et al. [8] studied the qualitative and quantitative properties of fluid dynamics in a baffle-filled channel by the CFD, which benefits to fully understand the effects of two types of baffles on flow pattern, behavior and feature. The simulation results showed that the pres-ence of baffles caused remarkable increases of the average velocity and shear stress on the tube wall, which could sig-nificantly improve the filtration performance. Wei et al. [9] found that bubbling and rational membrane spacing (8 mm) could effectively control membrane fouling by CFD. Xie et al. [10] adopted CFD simulations and filtration performance experiments to investigate the hydrodynamic and filtration performance of micro-channel turbulence promoter (MCTP) with micro-pores and without micro-pore in the submerged flat-sheet MBR. The CFD simulation results and the exper-imental results showed that MCTP with micro-pores in the submerged flat-sheet MBR could further increase average velocity 10.41%, turbulent kinetic energy 4.41% and wall shear stress 56.00% on the flat-sheet membrane surface, thereby enhancing membrane flux 21.64%, decrease total resistance 23.11% and save energy 28.76% compared with MCTP without micro-pore. Xie et al. [11] applied CFD simulation and particle image velocimetry (PIV) experi-ment to predict turbulent flow in a flat-sheet membrane channel equipped with MCTP-MPs. The CFD simulation results and PIV experiment results showed that the corru-gated MCTP of 300 μm micro-pores crosswise placed on the membrane surface could increase velocity and wall shear stress on the flat-sheet membrane surface, which improved the filtration flux, reduced concentration polarization and mitigated membrane fouling in the meantime. Yan et al. [12] used CFD to simulate the hydrodynamic filtration perfor-mance of the MBR in which the membrane was sandwiched between two baffles. The simulation results showed that the shear stress on membrane surface could be elevated by 74% compared with that without baffles. Wardeh and Morvan [13] researched fluid flow through rectangular channels filled with spacers CFD simulations. The simulation results showed that spacers could increase wall shear stress and reduce the buildup of suspended solids on the membrane surface.
It follows from the previous work that turbulence pro-moters can enhance membrane flux and reduce membrane
fouling and concentration polarization, and that CFD can predict the flow pattern. The purpose of the present work is to investigate the effect of micro-channel turbulence promoter installation on hydrodynamic performance of submerged membrane bioreactors (SMBRs). Computational fluid dynamics (CFD) for three-phase flows was used to simulate and analyze the hydrodynamics in the SMBRs equipped with micro-channel turbulence promoters with different spacing (106, 80 and 64 mm) in the horizontal orientation, then the filtration performance and membrane fouling resistance experiment of flat-sheet MBR are con-ducted to validate the enhancement effect of different transverse spacing of micro-channel turbulence promoters on SMBRs performance.
2. CFD model and numerical method
2.1. Model geometry and meshing
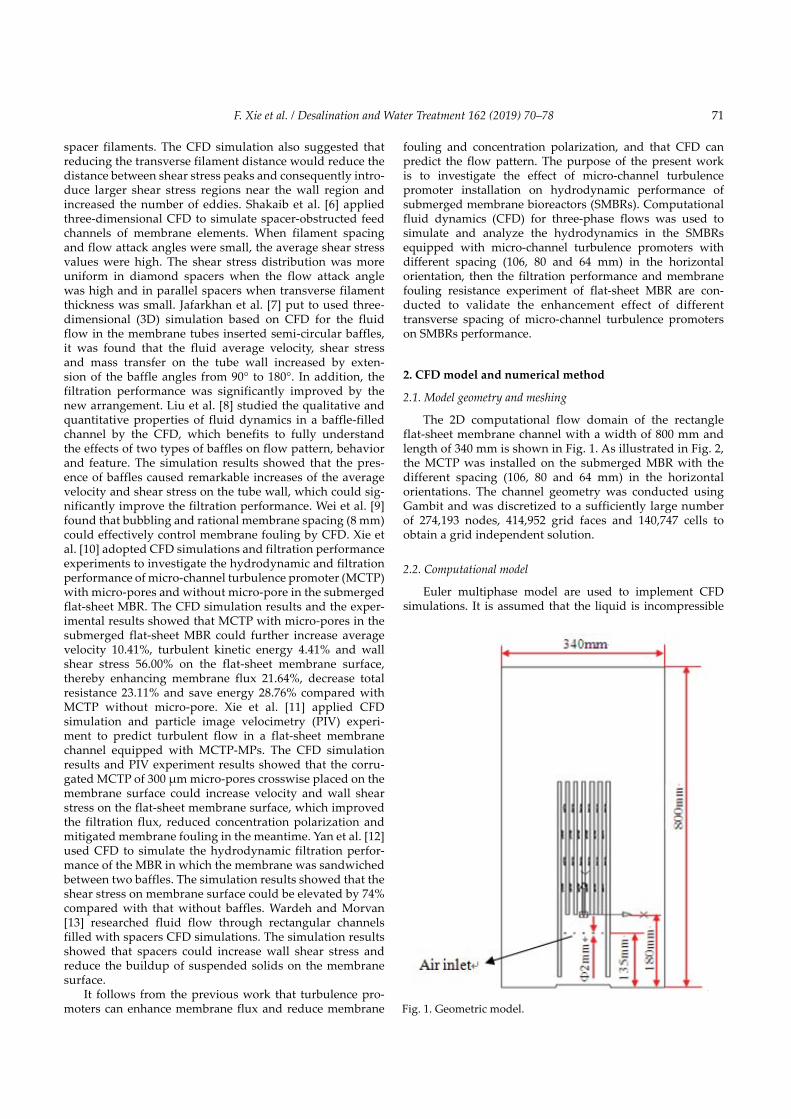
The 2D computational flow domain of the rectangle flat-sheet membrane channel with a width of 800 mm and length of 340 mm is shown in Fig. 1. As illustrated in Fig. 2, the MCTP was installed on the submerged MBR with the different spacing (106, 80 and 64 mm) in the horizontal orientations. The channel geometry was conducted using Gambit and was discretized to a sufficiently large number of 274,193 nodes, 414,952 grid faces and 140,747 cells to obtain a grid independent solution.
2.2. Computational model
Euler multiphase model are used to implement CFD simulations. It is assumed that the liquid is incompressible
Fig. 1. Geometric model.

F. Xie et al. / Desalination and Water Treatment 162 (2019) 70–7872
and continuous phase, the gas and solid are dispersed phase. The integral rate of each phase follows the following constraints:
α α αG L S+ + = 1 (1)
where αK is the volume fraction of phase K (%), K = G, L or S.
2.2.1. Continuity equation
∂( )∂
+ ∇( ) =ρ αρ αG GG G Gtu 0 (2)
∂( )∂
+ ∇( ) =ρ αρ αL LL L Ltu 0 (3)
∂( )∂
+ ∇( ) =ρ αρ αS SS S Stu 0 (4)
where rG, rL and rS are gas, liquid and solid densities (kg/m3), respectively, t is time (s), uG is gas velocity vector, uL is liquid velocity vector, uS is solid velocity vector.
2.2.2. Momentum equation
∂( )∂
+ ∇( ) =
− ∇ +∇ ∇ + ∇( )( )( ) +ρ α
ρ α
α α µ ρ α
G G GG G G G
G G G G G G G
uu u
tP u ueff
T
, gg MI G− , (5)
∂( )∂
+ ∇( ) =
− ∇ +∇ ∇ + ∇( )( )( ) +ρ α
ρ α
α α µ ρ α
L L LL L L L
L L L L L
T
L L
uu u
tP u ueff , gg MI L+ , (6)
∂( )∂
+ ∇( ) =
− ∇ −∇ +∇ ∇ + ∇( )( )( ) +ρ α
ρ α
α α µ
S S SS S S S
S S S S S S
T
uu u
tP P u ueff , ρρ αS S I Sg M− , (7)
where P is the pressure (Pa), μeff,G is the gas effective viscosity (Pa·s), μeff,L is the liquid effective viscosity (Pa·s), μeff,S is the solid effective viscosity (Pa·s), g is the gravitational acceleration (m/s2). The terms MI,G, MI,L, and MI,S in the above momentum equations represent the inter-phase force term for gas, liq-uid and solid phase, respectively (N/m3). PS is the additional solid pressure caused by collisions of solid particles (Pa).
The liquid phase turbulence used the RNG k-ε model. The effective viscosities of liquid, gas and solid phases are calculated using the same methods as Panneerselvam et al. [14].
2.3. Solution approach and boundary conditions
The CFD code (Fluent 14.0), which employs the finite volume method, was used to simulate the hydrodynamic characterization in the channel between micro-channel tur-bulence promoters and the flat-sheet membrane. The compu-tational domain was discretized by a second order upwind differencing scheme. The pressure–velocity coupling scheme was resolved with SIMPLE algorithm. The scaled residuals were monitored to a criterion of 10–4 for the continuity and momentum variables as well as k-ε to ensure the conver-gence of the numerical solution. The boundary conditions used here are identical for all cases of these simulations, with an inlet velocity of 1.0 m/s and the outlet set as outflow.
3. Experimental
3.1. Experimental setup
The filtration performance and membrane fouling resis-tance experiments were performed with a submerged flat-sheet MBR. In order to conduct comparison testing, the par-allel apparatus used to treat synthetic domestic waste water is presented in Fig. 3. A flat-sheet microfiltration with a pore size of 0.1 μm was submerged in an aerobic bioreactor with an effective volume of 68 L at the laboratory scale. Each flat-sheet membrane made of PVDF had a filtration area of 0.1 m2 with a total effective membrane area of 0.5 m2. Mixed liquid suspended solids concentration was about 6.5 g/L. The influ-ent pump was controlled by a water level sensor to maintain a constant water level in the bioreactor. The influent veloc-ity 1.0 m/s of wastewater was controlled by glass tube float flow-meter and the continuous effluent 10 h was achieved by a peristaltic pump. The influent characteristics are shown in Table 1. An air flow rate of approximately 0.6 m3/h was supplied to provide membrane shearing stress and oxygen through the air diffuser underneath the flat-sheet membrane module. The pressure drop along the membrane channel was measured with a membrane pressure gauge. The permeate fluxes of flat-sheet membrane were monitored during the entire experiment.
3.2. Experimental methods
The pressure drop of SMBRs was measured with a mem-brane pressure gauge. The permeate fluxes of submerged
(a) LH=106 mm (b) LH=80 mm (c) LH=64 mm
Fig. 2. Schematic diagram of micro-channel turbulence promotes in the horizontal orientation at three kinds of spacing distances.

73F. Xie et al. / Desalination and Water Treatment 162 (2019) 70–78
flat-sheet MBR were monitored during the whole experiment. The membrane fouling resistance was expressed as:
J pR
pR R Rt m b c
= =+ +( )
∆ ∆µ µ
(8)
R R Rc t= − 0 (9)
R R Rb = −0 1 (10)
where J is permeate flux of membrane (m3/m2 s), Rt is the total resistance (m–1), ∆P is the pressure drop along the mem-brane channel (Pa), μ is the dynamic viscosity (Pa s), Rm is the intrinsic resistance of new membrane (m–1), Rb is the pore blockage resistance (m–1), Rc is the cake layer resistance (m–1), R0 is the fouling resistance by mixed liquid (m–1) and R1 is the fouling resistance of the membrane surface cleaned by a sponge (m–1).
4. Results and discussion
4.1. Numerical results
4.1.1. Velocity
4.1.1.1. Liquid velocity
It can be seen from Fig. 4 that there is the peak values of velocity and eddy in the neighbor of MCTP. The high flow velocity and eddy formation can not only increase turbulence in the bulk fluid stream but also interrupt the buildup of the boundary layer on the membrane surface, thereby reducing membrane fouling and enhancing the membrane flux. As to SMBR-LH
= 106 mm, the highest liquid velocity is about 15.98 m/s and the average liquid velocity is about 14.76 m/s. For the SMBR-LH
= 80 mm, the highest liquid velocity is about
17.95 m/s and the average liquid velocity is about 16.93 m/s. As to SMBR-LH
= 64 mm, the highest liquid velocity is about 17.12 m/s and the average liquid velocity is about 16.03 m/s. The flow velocity of SMBR-LH
= 80 mm is higher than that of SMBR-LH
= 106 mm (12.81%) and SMBR-LH = 64 mm (5.32%).
The higher fluid flow velocity is, the harder contaminant to adhere to the membrane surface is, which can reduce the thickness of cake layer, improve the membrane flux and mitigate membrane fouling.
4.1.1.2. Gas velocity
The distributions of gas phase velocity along the flat-sheet membrane channel are depicted in Fig. 5. As to SMBR-LH
= 106 mm, the highest gas velocity is about 8.69 m/s and the average gas velocity is about 8.06 m/s. For the SMBR-LH
= 80 mm, the highest gas velocity is about 9.22 m/s and the average gas velocity is about 8.87 m/s. As to SMBR-LH
= 64 mm, the highest gas velocity is about 8.71 m/s and the average gas velocity is about 8.32 m/s. In contrast to SMBR-LH
= 106 mm and SMBR-LH = 64 mm, the average
gas velocity of SMBR-LH = 80 mm is above 9.13% and 6.20%,
respectively. The higher gas velocity is, the more easily contaminant on the membrane surface is brushed, which can effectively control cake layer buildup and reduce membrane fouling.
Table 1Synthetic domestic wastewater characteristics
COD (mg/L) 300–455NH3–N (mg/L) 17–25SS (mg/L) 65–85Turbidity (NTU) 15–75Temperature (°C) 15–25
Flow meter
Peristaltic pump
Pressure gauge Pressure gauge Influent pump
SMBR
SMBR
PLC
Air compressor
Effluent
Effluent Peristaltic pump
Flow meter
Air compressor
Fig. 3. Schematic flow diagram of SMBR.

F. Xie et al. / Desalination and Water Treatment 162 (2019) 70–7874
4.1.2. Turbulent kinetic energy and turbulent intensity
It can be observed from Fig. 6 that the turbulence kinetic energy of SMBR-LH
= 80 mm is higher than that of the others. The average turbulence kinetic energy of SMBR-LH
= 106 mm, SMBR-LH = 80 mm and SMBR-LH = 46 mm is 0.22, 0.37 and 0.27 m2/s2, respectively. Comparing with SMBR-LH = 106 mm and SMBR-LH = 64 mm, SMBR-LH = 80 mm can pro-duce higher turbulent kinetic energy (above 31.25% and 15.63%). The higher turbulence kinetic energy is, the higher turbulence intensity along the membrane channel is. The turbulence intensity, also often known as the tur-bulence level, is set as the ratio of square root mean of the turbulent velocity fluctuations to the average velocity. The distributions of turbulent intensity along the mem-brane channel are shown in Fig. 7. The average turbu-lence intensity of SMBR-LH = 106 mm, SMBR-LH = 80 mm and SMBR-LH = 46 mm is 28.07%, 29.67% and 27.79%, respectively. In contrast to SMBR-LH = 106 mm and SMBR-LH = 64 mm, SMBR-LH = 80 mm can produce higher turbulent kinetic energy (above 5.61% and 6.55%), which implies its turbulent degree being stronger. The turbulence
intensity is proportional to the turbulence degree of fluid. The higher the turbulence intensity, the more helpful to main-tain the suspended state of sludge which is sufficiently contact with oxygen and scour large molecules sludge par-ticles deposited on the membrane surface. This means that the concentration boundary layer of SMBR-LH = 80 mm is more easily disrupted and the particle deposition upon the membrane surface is more easily decreased, there-fore, membrane fouling can be more effectively controlled.
4.1.3. Turbulent dissipation rate and static pressure
The turbulent dissipation rate refers to loss the turbu-lent kinetic energy of unit mass fluid in unit time. Energy consumption increases with increasing turbulent dissipa-tion rate. The distributions of turbulent dissipation rate along the membrane length are depicted in Fig. 8. The average turbulence dissipation rate of SMBR-LH = 106 mm, SMBR-LH = 80 mm and SMBR-LH = 64 mm is 0.87, 1.36 and 2.26 m2/s2, respectively. It can also be demonstrated that turbulence dissipation rate increases with increasing the
(a) LH=106 mm (b) LH=80 mm (c) LH=64 mm
Fig. 4. Contours of liquid phase velocity magnitude along the flat-sheet membrane channel.
(a) LH=106 mm (b) LH=80 mm (c) LH=64 mm
Fig. 5. Contours of gas phase velocity magnitude along the flat-sheet membrane channel.

75F. Xie et al. / Desalination and Water Treatment 162 (2019) 70–78
MCTP quantity and reducing the MCTP spacing. The value of pressure drop along the flat-sheet membrane channel can be obtained from the difference of static pressure between inlet (x = 0 m) and outlet (x = 320 mm). Static pressure distribution along the flat-sheet membrane length is illus-trated in Fig. 9. The pressure drop of SMBR-LH = 106 mm, SMBR-LH = 80 mm and SMBR -LH = 64 mm is 0.68, 0.94 and 1.25 kPa, respectively. The greater the pressure drop is, the higher the energy cost of the membrane module. The reasons for different pressure drops along the flat-sheet membrane channel with different spacing of the MCTP could be interpreted as follows. First, different spacing of MCTP in the flat-sheet membrane channel causes frequent changes of flow directions and intense velocity fluctua-tions in a different degree. Second, eddies formed also lead to the increase of energy loss because of turbulent energy dissipation. Spacing for 80 mm is beneficial to enhance counter-diffusion of the depositing particles and cake layer removal from the membrane surface, thereby decrease dis-sipation and pressure drop along the membrane channel and save energy.
4.1.4. Wall shear stress
Wall shear stress fluctuates with the fluctuation of velocity. The wall shear stress distribution on the flat-sheet membrane surface is depicted in Fig. 10. For the SMBR-LH = 106 mm, the peak and trough values of wall shear stress are about 2.93 Pa and 1.70 Pa, respectively, and the average value is 1.86 Pa. As to SMBR-LH = 80 mm, the peak and trough values of wall shear stress are about 3.42 and 1.73 Pa, respectively, and the average value is more than 2.68 Pa. For the SMBR-LH = 64 mm, the peak and trough values of wall shear stress are about 3.13 and 0.26 Pa, respectively, and the average value is more than 1.97 Pa. The higher wall shear stress is, the easier molecules diffu-sion is, which inhibits the buildup of the cake layer on the membrane surface and reduces membrane fouling.
Fig. 6. Profile of turbulent kinetic energy distribution along the membrane channel.
Fig. 7. Profile of turbulent intensity along the membrane channel.
Fig. 8. Profile of turbulent dissipation rate distribution along the membrane channel.
Fig. 9. Profile of static pressure distribution along the membrane channel.

F. Xie et al. / Desalination and Water Treatment 162 (2019) 70–7876
4.1.5. Gas holdup
It can be seen from Fig. 11 that the highest gas holdup is near the MCTP. As to SMBR-LH = 106 mm, the highest gas holdup is about 53.02% and the average gas holdup is about 50.36%. For the SMBR-LH = 80 mm, the highest gas holdup is about 63.37% and the average gas holdup is about 57.87%. As to SMBR-LH = 64 mm, the highest gas holdup is about 55.85% and the average gas holdup is about 52.64%. The gas holdup of SMBR-LH = 80 mm is higher than that of SMBR-LH = 106 mm (12.98%) and SMBR-LH = 64 mm (9.04%). The bubbles are in the state of coalescence and the gas holdup is small. Bubbles are in the state of gas stirring flow, many small bubbles are produced while bub-bles are coalescing, which increases the residence time of bubbles in liquid and thus leads to the increase of gas holdup [15]. When the fluid velocity is not high enough and the micro-channel turbulence promoter hinders bubble coalescence and collision, the gas holdup decreases.
4.2. Experimental results
4.2.1. Variation of critical flux
The concept of critical flux is proposed by Field et al. [16] for controlling membrane fouling of the microfiltration systems. In the process of treating wastewater in SMBR, the cake layer and pore blockage are gradually formed when the flux is above the critical flux [17], membrane fouling resistance constantly increases with increasing the operation time. The membrane flux always increases with increasing transmembrane pressure (TMP), however, the membrane flux cannot increase with increasing TMP and shows a downward trend. It can be seen from Fig. 12 that the critical flux of SMBR-LH = 106 mm, SMBR-LH = 106 mm and SMBR-LH = 64 mm is 35.90, 49.70 and 40.10 L/m2 h, respectively. The critical flux of SMBR-LH = 80 mm is obvi-ously higher than that of SMBR-LH = 106 mm (27.76%) and SMBR-LH = 64 mm (19.32%).
4.2.2. Variation of flux and trans-membrane pressure
Fig. 13 shows that the flux with increasing operation time decreased because of the cake buildup and membrane pore blockage. However, the flux of the SMBR-LH = 80 mm is slowly reduced. The buildup rate of TMP is an important factor in evaluating membrane filterability in SMBR systems because it is directly related to membrane fouling [3,18]. In the short processing of SMBR, TMP always increases. At the beginning of the experiments, TMP of three kinds of SMBR slowly increases. With increasing operation time, the TMP of the SMBR-LH = 106 mm and SMBR-LH = 64 mm rapidly increases, however, the TMP of the SMBR-LH = 80 mm slowly increases, the reasons are as follows: rational instal-lation position not only can increase the effective area and intensify turbulent intensity but also stir the fluid to enhance suspension mixing around the membrane sur-face and decrease the particle deposition on the membrane surface, thereby mitigate cake layer buildup and membrane fouling.
Fig. 10. Profile of wall shear stress distribution along the mem-brane channel.
Fig. 11. Profile of gas holdup along the membrane channel.
Fig. 12. Critical flux profile for SMBRs equipped with micro- channel turbulence promoters at different spacing.

77F. Xie et al. / Desalination and Water Treatment 162 (2019) 70–78
4.2.3. Analysis of membrane resistance
The filtration resistance was measured in the SMBRs equipped with micro-channel turbulence promoters with different spacing (106, 80 and 64 mm) in the horizontal orientation in the same operation time (6 h). It can be seen from Table 2 that membrane pore blockage resistance of SMBR-LH = 106 mm, SMBR-LH = 80 mm and SMBR-LH = 64 mm is 4.61 × 10¹⁰ m–1, 3.38 × 10¹⁰ m–1 and 4.47 × 10¹⁰ m–1, and accounted for 57.34%, 51.29% and 51.86% of total resistance, respectively. Cake layer resistance of SMBR-LH = 106 mm, SMBR-LH = 80 mm and SMBR-LH = 64 mm is 2.18 × 10¹⁰ m–1, 1.96 × 10¹⁰ m–1 and 2.90 × 10¹⁰ m–1, and accounted for 27.11%, 29.74% and 33.64% of total resistance, respectively. It can be seen that Rp and Rc have great influence on Rt. In partic-ular, the SMBR equipped with MCTP with LH = 80 mm in the horizontal orientation can more effectively control Rp and Rc. The reasons could be explained as follows: first, the particle movement can be regarded as isotropic and easily produces flocculation, which results in the increased par-ticle size and reduced Rp. Second, MCTP changes the flow pattern in the membrane channel and scour the membrane surface augment, which reduces the particle deposition on the membrane surface and inhibits formation of the cake layer. Third, SMBR equipped with micro-channel turbulence promoters with the appropriate spacing can easily generate a velocity gradient, which can cause the relative movement of particles in suspension and result in particle collisions. Thus, linear macromolecular compounds bridging between deposited biopolymers and inorganic compounds causes homodromous particle flocculation, which increases the
particle size and enhances accumulation and pushing, causing many particles to be unable to enter the membrane pore or become stuck in the pore, thereby reducing mem-brane pore clogging [3]. Thus, membrane fouling resistance was controlled.
5. Conclusions
CFD for three-phase flows was used to simulate and ana-lyze the hydrodynamics in the submerged MBRs equipped with micro-channel turbulence promoters with different spacing (106, 80 and 64 mm) in the horizontal orientation. CFD simulation results indicated that the average liquid phase velocity, gas holdup, average gas phase velocity, turbulent kinetic energy and wall shear stress in SMBR with the spacing distance of 80 mm were higher than those of the spacing distances of 64 and 106 mm. The filtration perfor-mance showed that compared with that of the spacing dis-tance of 64 and 106 mm, the critical flux in SMBR with the spacing distance of 80 mm increased by 19.32% and 27.76%, respectively and the total resistance reduces 4.47% and 10.90%, respectively. These results suggested that for SMBR equipped with micro-channel turbulence promoters with the appropriate spacing, it is possible not only to enhance the turbulent intensity, generate a velocity gradient, increase particle collisions and the particle size causing many par-ticles to be unable to enter the membrane pore or become stuck in the pore, thereby reducing membrane pore clog-ging and but also to make the suspension particles deposit on the membrane surface to form better compressive and higher porous cake layers, which are easily removed by sus-pension scouring on the membrane surface so as to mitigate membrane fouling in SMBR.
Acknowledgments
This subject is supported by foundation of Research program of science and technology at universities of Inner Mongolia Autonomous Region (Project No: NJZY16097) and the Natural Science Foundation of Inner Mongolian (Project No: 2017MS (LH) 0201).
References[1] Z.W. Wang, Z.C. Wu, S.H. Mai, C.F. Yang, X.H. Wang, Y. An,
Z. Zhou, Research and applications of membrane bioreactors in China: progress and prospect, Sep. Purif. Technol., 62 (2008) 249–263.
[2] F.G. Meng, S.-R. Chae, A. Drews, M. Kraume, H.-S. Shin, F.L. Yang, Recent advances in membrane bioreactors (MBRs): membrane fouling and membrane material, Water Res., 43 (2009) 1489–1512.
Fig. 13. Variations of flux and TMP with increasing time.
Table 2Distribution of membrane fouling resistances in SMBR with different spacing distances
Resistance distribution (1010 m–1)
Rm Rb Rc Rt
SMBR-LH = 106 mm 1.25 (15.55%) 4.61 (57.34%) 2.18 (27.11%) 8.04SMBR-LH = 80 mm 1.25 (18.97%) 3.38 (51.29%) 1.96 (29.74%) 6.59SMBR-LH = 64 mm 1.25 (14.50%) 4.47 (51.86%) 2.90 (33.64%) 8.62
F. Xie et al. / Desalination and Water Treatment 162 (2019) 70–7878
[3] F. Xie, W.W. Chen, J.M. Wang, J.R. Liu, Fouling characteristics and enhancement mechanisms in a submerged flat-sheet membrane bioreactor equipped with micro-channel turbulence promoters with micro-pores, J. Membr. Sci., 495 (2015) 361–371.
[4] Y. Zhang, Z.C. Wu, L.L. Zang, H.C. Li, Zhiwei Wang, Research in design and operation optimization of flat membrane BR using CFD, Chin. J. Environ. Eng., 6 (2016) 735–741.
[5] Z. Cao, D.E. Wiley, A.G. Fane, CFD simulations of net-type turbulence promoters in a narrow channel, J. Membr. Sci., 185 (2001) 157–176.
[6] M. Shakaib, S.M.F. Hasani, M. Mahmood, Study on the effects of spacer geometry in membrane feed channels using three-dimensional computational flow modeling, J. Membr. Sci., 297 (2007) 74–89.
[7] M. Jafarkhani, M.K. Moraveji, R. Davarnejad, F. Moztarzadeh, M. Mozafari, Three-dimensional simulation of turbulent flow in a membrane tube filled with semi-circular baffles, Desalination, 294 (2012) 8–16.
[8] Y.F. Liu, G.H. He, X.D. Liu, CFD simulations of turbulent flow in baffle-filled membrane tubes, Sep. Purif. Technol., 67 (2009) 14–20.
[9] P. Wei, K.S. Zhang, W.M. Gao, CFD modeling of hydrodynamic characteristics of slug bubble flow in a flat sheet membrane bioreactor, J. Membr. Sci., 445 (2013) 15–24.
[10] F. Xie, W.W. Chen, J.R. Liu, J.M. Wang, CFD and experimental studies on the hydrodynamic performance of submerged flat-sheet membrane bioreactor equipped with micro-channel turbulence promoters, Chem. Eng. Process. Process Intensif., 99 (2016) 72–79.
[11] F. Xie, J.R. Liu, W.W. Chen, J.M. Wang, Computational fluid dynamics simulation and particle image velocimetry experimentation of hydrodynamic performance of flat-sheet membrane bioreactor equipped with micro-channel turbulence promoters with micro-pores, Korean J. Chem. Eng., 33 (2016) 2169–2178.
[12] X.X. Yan, Q. Wu, J.Y. Sun, P. Liang, X.Y. Zhang, X. Kang, X. Huang, Hydrodynamic optimization of membrane bioreactor by horizontal geometry modification using computational fluid dynamics, Bioresour. Technol., 200 (2016) 328–334.
[13] S. Wardeh, H.P. Morvan, CFD simulations of flow and concentration polarization in spacer-filled channels for appli-cation to water desalination, Chem. Eng. Res. Des., 86 (2008) 1107–1116.
[14] R. Panneerselvam, S. Savithri, G.D. Surender, CFD simulation of hydrodynamics of gas–liquid–solid fluidised bed reactor, Chem. Eng. Sci., 64 (2009) 1119–1135.
[15] Y. Wibisono, E.R. Cornelissen, A.J.B. Kemperman, W.G.J. van der Meer, K. Nijmeijer, Two-phase flow in membrane processes: a technology with a future, J. Membr. Sci., 453 (2014) 566–602.
[16] R.W. Field, D. Wu, J.A. Howell, B.B. Gupta, Critical flux concept for microfiltration fouling, J. Membr. Sci., 100 (1992) 259–272.
[17] D.D. Yuan, Y.B. Fan, G.L. Xu, W.J. Yang, Y. Yu, G.X. Wu, Research in critical flux theories of membrane bioreactor, Membr. Sci. Technol., 30 (2014) 77–104.
[18] S. Ahmed, M.T. Seraji, J. Jahedia, M.A. Hashibb, Application of CFD for simulation of a baffled tubular membrane, Chem. Eng. Res. Des., 90 (2012) 600–608.