An estimation of the wire-duct electrostatic precipitator efficiency

ww.sciencedirect.com
b i o s y s t em s e ng i n e e r i n g 1 1 2 ( 2 0 1 2 ) 2 9 3e3 0 3
Available online at w
journal homepage: www.elsev ier .com/locate/ issn/15375110
Research Paper
Computational fluid dynamics simulation of air temperaturedistribution inside broiler building fitted with duct ventilationsystem
Ehab Mostafa a,b,*, In-Bok Lee b,**, Sang-Hyeon Song b, Kyeong-Seok Kwon b, Il-Hwan Seo b,Se-Woon Hong b, Hyun-Seob Hwang b, Jessie Pascual Bitog b,c, Hwa-Taek Han d
aAgricultural Engineering Department, Faculty of Agriculture, Cairo University, El-Gammaa Street, 12613 Giza, EgyptbDepartment of Rural Systems Engineering and Research Institute for Agriculture and Life Sciences, College of Agricultural and Life Sciences,
Seoul National University, 599 Gwanangno, Gwanakgu, Seoul 151-742, South KoreacDepartment of Agricultural Engineering, Nueva Vizcaya State University, 3700 Bayombong, Nueva Vizcaya, PhilippinesdDepartment of Mechanical Engineering, Kookmin University, South Korea
a r t i c l e i n f o
Article history:
Received 14 December 2011
Received in revised form
25 March 2012
Accepted 3 May 2012
Published online 12 June 2012
* Corresponding author. Tel.: þ202 35738929;** Corresponding author. Tel.: þ82 2 880 4586
E-mail addresses: ehababdelmoniem@ho1537-5110/$ e see front matter ª 2012 IAgrEdoi:10.1016/j.biosystemseng.2012.05.001
An investigation was conducted to develop ventilation systems to prevent cold air drafts
during the winter season and create a suitable atmosphere inside the broiler rearing
building. In the cold weather, ventilation ducts and low ventilation rates are used to
maintain the required air temperature. Perforated ducts are preferred for heating spaces
because they provide efficient and uniform distribution of the entire air volume. Four
ventilation systems were designed in order to establish a comfortable zone for the broilers
during winter season. To investigate these different systems under realistic conditions,
computational fluid dynamic simulation was used. Field experiments were conducted to
validate the designed cases. From the validation results, very low errors were observed.
The improved designs were compared with the standard design in terms of ventilation
rate, air temperature distribution and indoor gas concentration reduction. Case four (C-4)
of the improved designs achieved the highest ventilation rate in the broiler zone. In C-4,
theinlet duct was installed in building side and the outlet duct in the opposite side. It
achieved about 54% of the ventilation in comparison to standard design. All improved
designs showed high uniformity ranging around 60e70% compared to the standard design.
For gas dilution in broiler zone, C-4 showed 15% ammonia reduction efficiency 3 min after
operating the ventilator.
ª 2012 IAgrE. Published by Elsevier Ltd. All rights reserved.
1. Introduction broiler chickens involved in commercial meat production was
Broiler chicken production is one of the most important live-
stock industries worldwide. In South Korea the number of
fax: þ202 35717255.; fax: þ82 2 873 2087.tmail.com (E. Mostafa), ib. Published by Elsevier Lt
estimated in September 2010 to be 71 million (SSLI, 2010).
Broilers can be placed at high stocking densities of 18 birdm�2
inside the building (Corria & Naas, 2001). However, producing
[email protected] (I.-B. Lee).d. All rights reserved.

Nomenclature
Abbreviations
CFD Computational fluid dynamics
RNG Renormalisation-group
RSM Reynolds stress model
TGD Trace gas decay method
Symbols
r Density, kg m�3
d Thickness of the turbulent boundary layer, m
ε Turbulent dissipation rate, m2 s�3
m Viscosity, m2 s
meff Effective viscosity (m ¼ mt), m2 s
mt Turbulent viscosity, m2 s
AER Air exchange rate, min�1
Ai, Ao Inlet and outlet vent opening areas, respectively,
m2
C Gas concentration, mass fraction
Cm Experimental constant
C0 Initial concentration, mass fraction
C1ε and C2ε Constants of value 1.42 and 1.68
C3ε tanh (u1/u2), u1 and u2 are components of the flow
velocities parallel and perpendicular, respectively,
to the gravitational vector
Ccfd Predicted values from CFD simulation
Ci Initial data
Cm Measured values
Com Average of the measured values
Cop Average of the predicated values
E Total energy, J
Ev Error between the predicted and measured values
as a percentage to the initial data
F External force vector, N m�3
g Gravitational acceleration, m s�2
Gb Generation of kinetic energy due to the buoyancy,
kg m�1 s�2
Gk Generation of turbulent kinetic energy due to the
mean velocity gradients, kg m�1 s�2
h Specific enthalpy, J kg�1
J Component of diffusion flux, kg m�2 s�1
K Turbulent kinetic energy, m2 s�2
keff Heat transmission coefficient
M Increasing weight, kg
NMSE Normalised mean square error
P Pressure, Pa
R Gas-law constant, 8.31447 � 103 J kg mol�1 K�1
Sh Total entropy, J K�1
Sm Mass source, kg m�3
T Air temperature for the livestock building, �Ct,t0 Time, s
THP Total heat production, W m�2
u, v, w Velocity, m s�1
V Internal volume of the broiler building, m3.
vi, vo Air velocities at the inlet and outlet, respectively,
m s�1
YM Contribution of the fluctuating dilatation in
compressible turbulence to the overall dissipation
rate, kg m�1 s�2
Zn Height from the ground, m
aε
Generation of kinetic energy due to buoyancy,
kg m�1 s�2
ak Generation of kinetic energy due to the mean
velocity gradients, kg m�1 s�2
s Stress tensor, Pa
b i o s y s t em s e n g i n e e r i n g 1 1 2 ( 2 0 1 2 ) 2 9 3e3 0 3294
a profitable broiler requires that certain animal welfare stan-
dards are met, some even before the chicks are placed on the
farm and during the grow-out period. Providing an acceptable
air quality to the bird space becomes very important particu-
larly with high density broiler production. The main factor
responsible for improving the broilers welfare is providing an
adequate the indoor climate, which is largely effected by
thermal environmental factors. These thermal factors,
involve heat exchange among the birds and the surrounding
environment as described by (Skomorucha & Herbut, 2005). A
flock of 25,000 four-pound chickens can give off 293 kWof heat
(Bucklin, Jacob, Mather, Leary, & Naas, 2009). The age of the
animal has a significant effect on heat flux (Cangar, Aerts,
Buyse, & Berckmans, 2008). The rectal temperatures of the
bantam chicks increase consistently. The ambient tempera-
ture requirements of broilers also change with age (Gates,
Overhults, & Zhang, 1996). The level of adult thermoregula-
tion is considered to be reached when the birds are able to
maintain a constant body temperature under changing
ambient temperatures. Recommended ambient temperatures
for all broilers decline progressively from 33 to 35 �C for one
day old chicks to 18e21 �C just before they are capture for
slaughter (Bayraktar, Artuko�glu, & Altan, 2004). Heat
production of broilers is affected by body weight, food intake
and quality, and activity level. Chicks show high mortality
during their first week and therefore suitable environmental
conditions during this critical period are very important (Lee
et al., 2009)
Ventilation system can be considered as a major factor
influencing thermoregulation. Ventilation in broiler facilities
is a process of controlling several environmental factors by
diluting inside air with fresh outside air. This process will
remove the heat and excess moisture, minimise dust and
odours, limit the build-up of harmful gases such as ammonia
and carbon dioxide, and provide oxygen for respiration
(Bucklin et al., 2009). Proper ventilated housing is essential for
ensuring thermal uniformity in the zone occupied by the
broilers. Sufficient air movement is also required to keep the
litter inside the building dry. When ambient temperatures are
below that in the bird zone air speed must be kept relatively
low to conserve bird body heat. The minimum ventilation is
characterised by the need for supplementary heat tomaintain
the desired building temperature (Gates et al., 1996). During
the winter ventilation ducts could be used where low air flow
conditions are required and the ventilation rate must mini-
mised to maintain the required air temperature. Inflatable

b i o s y s t em s e ng i n e e r i n g 1 1 2 ( 2 0 1 2 ) 2 9 3e3 0 3 295
low-pressure ducts provide a uniform rate of ventilation
throughout the building (Carpenter, 1972). Duct ventilation
systems have also been used to increase air temperature
distribution uniformity and to prevent cold incoming air to
directly reach directly the animal rearing zone. Perforated
ventilation ducts can provide better fresh air distribution than
free wall slotted inlets (Barrington & MacKinnon, 1990a). The
air distribution uniformity of perforated ducts is a complex
function of inter-related factors such as duct construction
materials, fan capacities and performances, perforation
geometries (sizes and spacing), duct length, and internal
cross-sectional area (El Moueddeb, Barrington, & Barthakur,
1997) and (Barrington & MacKinnon, 1990b). The critical
factor in the design of a perforated duct is the aperture ratio
(Carpenter, 1972). Outlet velocity becomes more uniform over
duct length with lower aperture ratios (Barrington &
MacKinnon, 1990a). Aperture ratios should lie between 1.5
and 2.0 (Carpenter, 1972).
Unstable weather in Korea, where the outside air temper-
ature varies from �20 to 40 �C over the year, makes it impor-
tant to adapt forced ventilation systems for broiler rearing
buildings. Improved ventilation systems must provide
internal air temperature distributions with high uniformity,
stability and suitability. The current designed of ventilation
systems used during the winter season need to be modified to
consider the energy recovery inside the building using heat
exchanger. Unstable outside weather also creates drawbacks
for temperature measurements. To overcome these
measurement limitations and get more rapid and accurate
results, aerodynamic simulations using computational fluid
dynamics (CFD) can be carried out (Lee, Sase, & Sung, 2007 and
Seo et al., 2009). The use of CFD techniques to solve complex
fluid problems has greatly increased in recent years (Blanes-
Vidal, Guijarro, Balasch, & Torres, 2008). CFD could also save
the cost, time, and effort associated with field experiments to
establish the optimum system (Lee et al., 2009) but is accuracy
needs to be assessed.
The main objective of this study was to design different
duct ventilation systems in order to establish the most suit-
able design for use during the coldwinter season. The selected
design must be able to provide a uniform and stable air
temperature distribution and decrease the indoor ammonia
concentration in the broiler zone during the winter season. It
was also an objective to use heat exchangers installation
inside the building to recover the energy.
Four duct ventilation systemswere designed for the winter
season. To test these different systems under realistic condi-
tions, a computational fluid dynamic simulation was used to
overcome the limitations of field experiments. However,
a field experiment was conducted to validate the designed
cases.
Fig. 1 e The examined broiler building in Nonsan, Korea.
2. Materials and methods
2.1. Description of broiler rearing facilities
Field experiments were conducted at a naturally ventilated
double-winch curtain broiler rearing building. The experi-
ment was conducted to examine the real conditions as well as
provide validation for CFD simulation. The measured data
were also used to provide CFD input values. The orientation of
the broiler rearing building located at Nonsan city, Chung-
cheong Province, South Korea was north-west.
The facility was stocked with 6800 broilers. As shown in
Fig. 1 the dimensions of this building were 9 m width, 42 m
length, 2.2 m eave height, and 3.7 m ridge height. Throughout
the building, double-winch curtains on each side were used to
control the air temperature by rolling it up and down. To
improve the ventilation efficiency, tunnel ventilation and pipe
inlet systems were fitted for hot and cold weather respec-
tively. For tunnel ventilation, fans (2 small with 630 mm
diameter and 2 large with 1300 mm diameter) and four inlet
slots in the back wall of the building were installed. These
inlet slots were rectangular in shape with dimensions of 1.8 m
width and 0.4 m height. Three of these slots are located at 1 m
height from the floor and one is located in the middle of the
wall at 2.5mheight. During thewinter season, pipe inlets with
100 mm internal diameter were used. These pipe inlets were
in 21 groups with 2 m spacing along each sidewall. Each group
consists of two pipes, a short pipe (0.5m) and a long pipe (3m).
Heaters are placed throughout the houses to maintain the
recommended air temperature at productive levels. Chain
feeding and tap watering stations supplied the broilers with
fodder and water but manure removal was done manually.
Litter of rice straw with 200 mm depth was distributed over
the whole building floor.
2.2. Description of the designs investigation
CFD simulations were used to analyse the air temperature
distribution and ventilation rates computed by the trace gas
decay method according to the configurations of the ventila-
tion system (Hong et al., 2008; Seo et al., 2009). The CFD
simulation were computed for four different improved venti-
lation models and compared to the standard design (tunnel
ventilation) as shown in Fig. 3. The comparison between the
four improved designs and the standard design was carried
out investigating the effectiveness the ventilation rate on the
broiler zone and maintaining uniformity, suitability, and the
stability of the internal air temperature.
During the winter low ventilation rates and perforated
ducts are recommended. To achieve uniform air distribution
from the ventilation duct, three of the design cases (C-2, C-3
and C-4) used the inlet perforated duct as shown in Fig. 2 but
a perforated outlet duct was used only with C-3 and C-4. The
inlet ducts in C-2 and C-3 were located in the middle of the
building but in C-4 the inlet duct was located close to the

Fig. 2 e Schematic diagrams for the different upgraded ventilation cases and the standard system.
b i o s y s t em s e n g i n e e r i n g 1 1 2 ( 2 0 1 2 ) 2 9 3e3 0 3296
sidewall. The outlet in C-2 operated without an outlet duct
where it connects directly with the heat exchanger in the
sidewall. The inlet and outlet in C-1 were directly connected
with the heat exchanger without using ducting. Small fans
were installed in the system.
The various input values of the boundary conditions for the
three-dimensional CFD simulation models are presented in
Tables 1 and 2.
2.3. Computational fluid dynamic techniques
Three-dimensional CFD grids were generated by GAMBIT
software (ver. 2.3, Fluent, Inc.,Lebanon, NH, USA). To improve
the accuracy of the CFD model, the computational domains
were constructed using fine and dense meshes. The CFD
solver, FLUENT (ver. 6.2, Fluent, Inc., Lebanon, NH, USA), was
used to perform the CFD calculations by solving the non-
linear partial differential equations from the conversation of
mass (Eq.(1)), momentum (Eq.(2)) and energy (Eq.(3)) equations
(Lee & Short, 2000).
4.2 8.4
X X
XX
XX
X Air temperature sensor Ammonia sensor
X
X
X
X
X
X
1.6
0.4
Front view
Fig. 3 e Sensor location for air temperature a
vr
vtþ Vðr v!Þ ¼ Sm (1)
v
vtðr v!Þ þ Vðr v!v!Þ ¼ �VPþ VðsÞ þ r g!þ F
!(2)
v
vtðrEÞ þ Vð v!ðrEþ PÞÞ ¼ V
0@keffVT�
Xj
hj Jj!þ ðs v!Þ
1Aþ Sh (3)
Where Sm is mass source, kg m�3; r is density, kg m�3; u, v, w
are velocity, m s�1; t is time, s; P is pressure, Pa; s is the stress
tensor, Pa; F is external force vector, N m�3; g is gravitational
acceleration, m s�2; E is total energy, J; keff is the heat trans-
mission coefficient; h is specific enthalpy, J kg�1; J is the
component of diffusion flux, kg m�2 s�1; Sh is total entropy,
J K�1; and T is air temperature for the livestock building, �C.
Many different types of turbulence models have been
developed to solve these non-linear equations, such as the
Standard k-ε, renormalisation-group (RNG) k-ε, Realisable k-ε,
Reynolds stress model (RSM). In comparison to other models,
X X X
X
X
X
X
X
X
8.4 8.4 8.4 4.2
1.5 1.5
3.0 3.0
Top view Dimension in m
nd ammonia inside the broiler building.

Table 1 e Data and variables used in the simulations.
Pre-processing Size (m) Length: 42
Width: 9
Ridge height: 3.7
Eaves height: 2.2
Mesh Type Hexahedron, Pave, Tetra
Number of mesh w3 million
Main Module Turbulence RNG k-ε turbulence model
Discretisation Second order upwind
Conditions Unsteady state
b i o s y s t em s e ng i n e e r i n g 1 1 2 ( 2 0 1 2 ) 2 9 3e3 0 3 297
RSM requires additional memory and calculating time
because of the increased number of the transport equations
for Reynolds stresses (Lee et al., 2007).
The Realisable k-ε model satisfies certain mathematical
constrains on the Reynolds stresses, and it is consistent with
the physics of turbulent flows (Lee et al., 2007). RNG k-ε
equations have similar form to the standard k-ε model equa-
tions except that the dissipation rate equation has an addi-
tional term related to the mean rate of strain and turbulence
quantities that allows it to include more physical phenom-
enon. Additionally, themodel constants are derived fromRNG
theory as opposed to being empirically based. The analytically
derived constants are very similar to the empirical constants
in the standard k-ε model. This study used the RNG k-ε model
because it followed the work by Lee et al. (2007) who investi-
gated the different turbulence numerical models for model-
ling naturaleventilated broiler buildings and concluded that
Table 2e Constant input values for the case file of the CFDmodels.
Parameter Value Unit
Incoming air temperature Standard
case
0 �C
Designed
cases
10 �C
Inside air temperature Standard
case
20 �C
Designed
cases
25 �C
Density of air 1.225 kg m�3
Viscosity of air 1.86E-05 kg m�1 s�1
Thermal conductivity
of air
0.02647 W m�1 K�1
Specific heat of air 1006.43 J kg�1 K�1
Mass diffusivity of air 2.262E-05 M2 s�1
Molecular weight of air 28.966 g mol�1
Gravitational
acceleration of air
9.81 m s�1
Atmospheric pressure 101.325 kPa
Outside CO2 concentration 0.00061
(400)
Mass
fraction (ppm)
Inside CO2 concentration 0.003
(2000)
Mass
fraction (ppm)
Generated NH3
concentration
1.77E-05
(30)
Mass
fraction (ppm)
Designed ventilation rate 0.089 Air
exchanger
min�1
The calculated heat flux in the bottom 115 W m�2
the RNG k-ε model was the most suitable. The RNG model is
less dissipative than the standard k-ε model as presented by
Analytis (2003). The renormalisation-group (RNG) k-ε turbu-
lence model is defined using Eqs. (4) and (5).
rdkdt
¼ v
vxi
�akmeff
vkvxi
�þ Gk þ Gb � rε� YM (4)
rdεdt
¼ v
vxi
�aεmeff
vε
vxi
�þ C1ε
ε
kðGk þ C3εGbÞ � C2εr
ε2
k� R (5)
Where K is turbulent kinetic energy, m2 s�2; meff is effective
viscosity (m ¼ mt), m2 s; m is viscosity, m2 s; mt is turbulent
viscosity,m2 s; ak is the generation of kinetic energy due to the
mean velocity gradients, kg m�1 s�2; aεis the generation of
kinetic energy due to buoyancy, kg m�1 s�2; Gk is the genera-
tion of turbulent kinetic energy due to the mean velocity
gradients, kg m�1 s�2; Gb is the generation of kinetic energy
due to the buoyancy, kgm�1 s�2; ε is turbulent dissipation rate,
m2 s�3; YM is the contribution of the fluctuating dilatation in
compressible turbulence to the overall dissipation rate,
kg m�1 s�2; C1ε and C2ε are constants of 1.42 and 1.68; C3ε is
tanh (u1/u2), u1 and u2 are components of the flow velocities
parallel and perpendicular, respectively, to the gravitational
vector, and R is the gas-law constant,
8.31447 � 103 J kg mol�1 K�1.
The turbulence kinetic energy (k) and turbulence dissipa-
tion rate (ε), which are important factors for inlet conditions,
were calculated using Eqs. (6) and (7) (Fluent, 2006).
k ¼ 12
�u2 þ v2 þw2
�(6)
ε ¼ C3=4m � k3=2
l; l ¼ minðk� zn; k� dÞ (7)
Where Cm is an experimental constant; Zn is height from the
ground, m and d is thickness of the turbulent boundary layer,
m.
The total heat production of the broilers was determined
using Eq. (8) presented by Xin, Berry, Tabler, and Costello
(2001) based on the assumption that the entire floor area
was fully occupied with the broilers.
THP ¼ 9:84�M0:75�4� 10�5ð20� TÞ3þ1
�(8)
Where THP is total heat production andWm�2;M is increasing
weight, kg.
2.4. Description of the experimental procedures
Meteorological data were collected at 15 s intervals using
weather station (Campbell Scientific Inc., Lagon, UT, USA).
The weather station was installed above the main building
roof (around 2.5 m height from the floor) after adjusting its
direction using a compass. Thirty calibrated hygrometers,
sampled at 1 s intervals, (H8 Hobo, Onset Inc., Pocasset, MA,
USA) were installed inside the broiler building as shown in
b i o s y s t em s e n g i n e e r i n g 1 1 2 ( 2 0 1 2 ) 2 9 3e3 0 3298
Fig. 3 to determine the internal air temperature distribution.
The air volume flow from the ventilators was measured using
an air flow traverse station (Flo-probes, Taehung, Korea).
Indoor ammonia concentration was measured by using
ammonia sensors (PAC III, Draeger, Germany). The four
ammonia sensors were distributed evenly at 1 m height above
the litter and the inlet perpendicular to the airflow in the
building as established by Redwine, Lacey, Mukhtar, and
Cary (2002).
2.5. Air ventilation rate computation
As presented by Hong et al., 2008; Seo et al., 2009, the designed
ventilation rate was computed considering the volumetric
flow rate of the operating fan using Eq. (9).
AER ¼P
viAi
V¼
PvoAo
V(9)
Where AER is the air exchange rate, min�1; vi, vo are air
velocities at the inlet and outlet, respectively, m s�1; Ai, Ao are
the inlet and outlet vent opening areas, respectively,m2; andV
is the internal volume of the broiler building, m3.
The designed AER, calculated using Eq. (9), was
0.0896 min�1. There are limitations calculating the local
ventilation rate using this method since problems such as air
circulation and stagnation effects could occur. The trace gas
decay method (TGD) method was used to overcome these
problems. A trace gas was initially injected uniformly into the
CFD models and its concentration, which decreased with
ventilation, monitored. The reduction of gas concentration
was calculated at different positions and the overall and local
ventilation rate computed from:
AER ¼ln
�C0
C
ðt� t0Þ � 60 min�1 (10)
Where C0 is the initial concentration, mass fraction; C is the
gas concentration, mass fraction; and t,t0 are time and initial
time, s
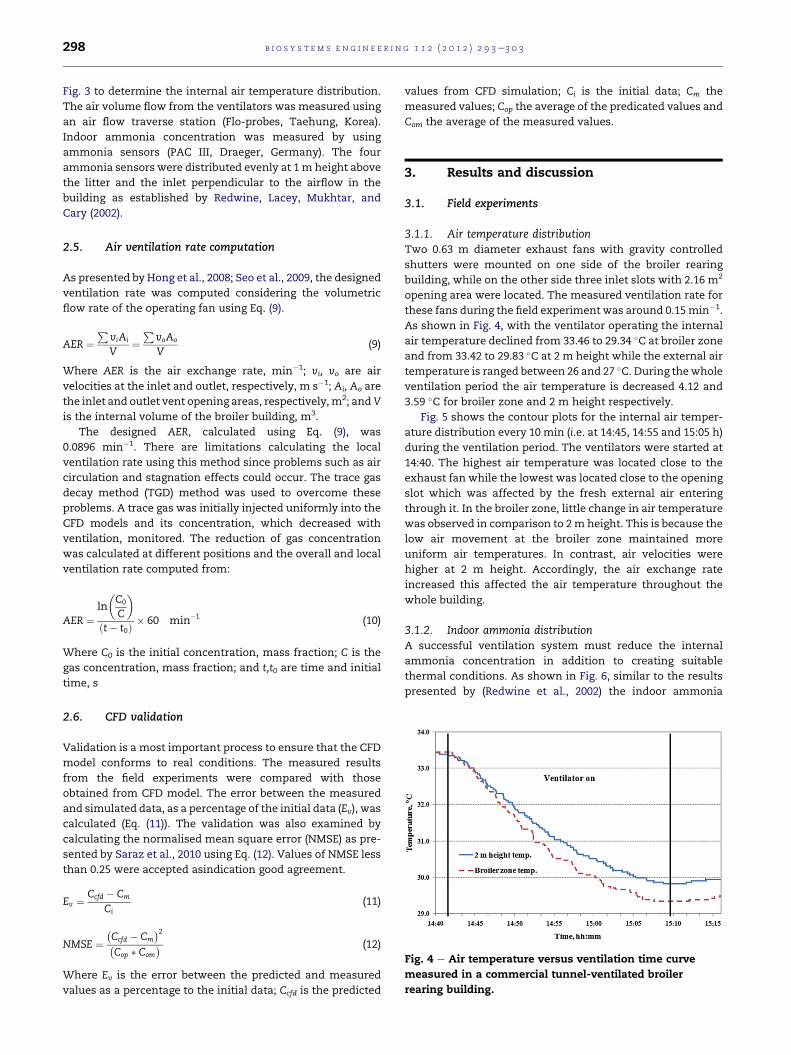
Fig. 4 e Air temperature versus ventilation time curve
measured in a commercial tunnel-ventilated broiler
rearing building.
2.6. CFD validation
Validation is a most important process to ensure that the CFD
model conforms to real conditions. The measured results
from the field experiments were compared with those
obtained from CFD model. The error between the measured
and simulated data, as a percentage of the initial data (Ev), was
calculated (Eq. (11)). The validation was also examined by
calculating the normalised mean square error (NMSE) as pre-
sented by Saraz et al., 2010 using Eq. (12). Values of NMSE less
than 0.25 were accepted asindication good agreement.
Ev ¼ Ccfd � Cm
Ci(11)
NMSE ¼�Ccfd � Cm
�2�Cop � Com
� (12)
Where Ev is the error between the predicted and measured
values as a percentage to the initial data; Ccfd is the predicted
values from CFD simulation; Ci is the initial data; Cm the
measured values; Cop the average of the predicated values and
Com the average of the measured values.
3. Results and discussion
3.1. Field experiments
3.1.1. Air temperature distributionTwo 0.63 m diameter exhaust fans with gravity controlled
shutters were mounted on one side of the broiler rearing
building, while on the other side three inlet slots with 2.16 m2
opening area were located. The measured ventilation rate for
these fans during the field experiment was around 0.15min�1.
As shown in Fig. 4, with the ventilator operating the internal
air temperature declined from 33.46 to 29.34 �C at broiler zone
and from 33.42 to 29.83 �C at 2 m height while the external air
temperature is ranged between 26 and 27 �C. During thewhole
ventilation period the air temperature is decreased 4.12 and
3.59 �C for broiler zone and 2 m height respectively.
Fig. 5 shows the contour plots for the internal air temper-
ature distribution every 10 min (i.e. at 14:45, 14:55 and 15:05 h)
during the ventilation period. The ventilators were started at
14:40. The highest air temperature was located close to the
exhaust fan while the lowest was located close to the opening
slot which was affected by the fresh external air entering
through it. In the broiler zone, little change in air temperature
was observed in comparison to 2m height. This is because the
low air movement at the broiler zone maintained more
uniform air temperatures. In contrast, air velocities were
higher at 2 m height. Accordingly, the air exchange rate
increased this affected the air temperature throughout the
whole building.
3.1.2. Indoor ammonia distributionA successful ventilation system must reduce the internal
ammonia concentration in addition to creating suitable
thermal conditions. As shown in Fig. 6, similar to the results
presented by (Redwine et al., 2002) the indoor ammonia
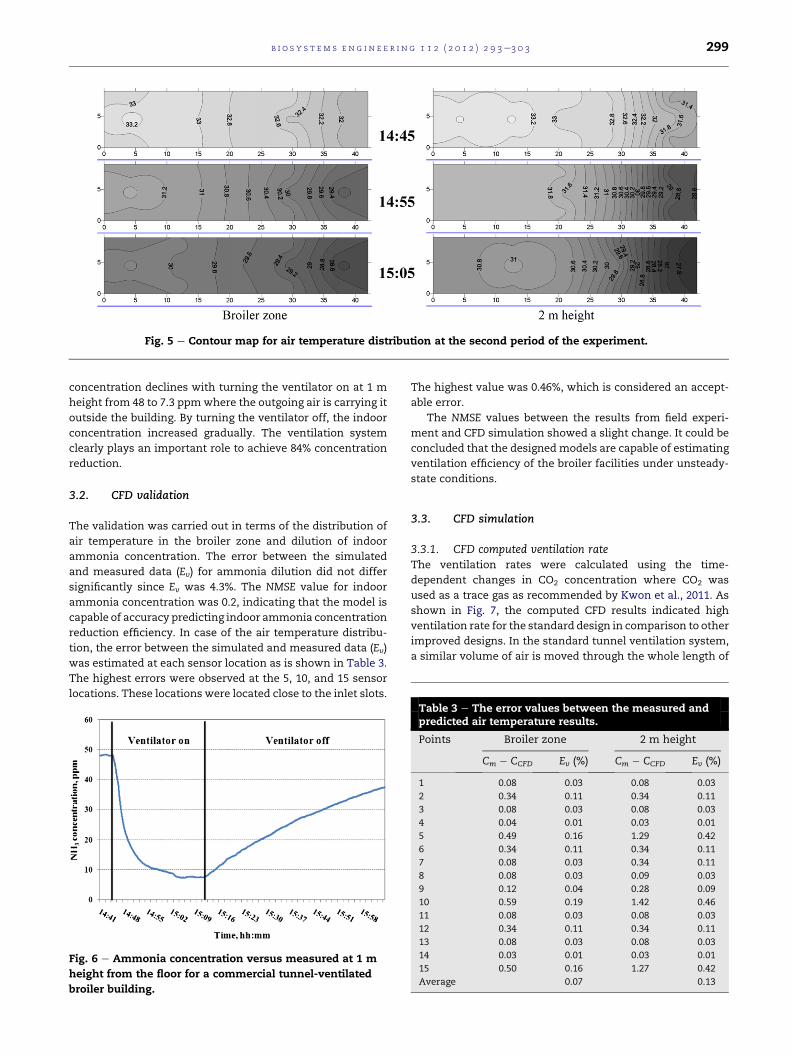
Fig. 5 e Contour map for air temperature distribution at the second period of the experiment.
b i o s y s t em s e ng i n e e r i n g 1 1 2 ( 2 0 1 2 ) 2 9 3e3 0 3 299
concentration declines with turning the ventilator on at 1 m
height from 48 to 7.3 ppmwhere the outgoing air is carrying it
outside the building. By turning the ventilator off, the indoor
concentration increased gradually. The ventilation system
clearly plays an important role to achieve 84% concentration
reduction.
3.2. CFD validation
The validation was carried out in terms of the distribution of
air temperature in the broiler zone and dilution of indoor
ammonia concentration. The error between the simulated
and measured data (Ev) for ammonia dilution did not differ
significantly since Ev was 4.3%. The NMSE value for indoor
ammonia concentration was 0.2, indicating that the model is
capable of accuracy predicting indoor ammonia concentration
reduction efficiency. In case of the air temperature distribu-
tion, the error between the simulated and measured data (Ev)
was estimated at each sensor location as is shown in Table 3.
The highest errors were observed at the 5, 10, and 15 sensor
locations. These locations were located close to the inlet slots.
Fig. 6 e Ammonia concentration versus measured at 1 m
height from the floor for a commercial tunnel-ventilated
broiler building.
The highest value was 0.46%, which is considered an accept-
able error.
The NMSE values between the results from field experi-
ment and CFD simulation showed a slight change. It could be
concluded that the designedmodels are capable of estimating
ventilation efficiency of the broiler facilities under unsteady-
state conditions.
3.3. CFD simulation
3.3.1. CFD computed ventilation rateThe ventilation rates were calculated using the time-
dependent changes in CO2 concentration where CO2 was
used as a trace gas as recommended by Kwon et al., 2011. As
shown in Fig. 7, the computed CFD results indicated high
ventilation rate for the standard design in comparison to other
improved designs. In the standard tunnel ventilation system,
a similar volume of air is moved through the whole length of
Table 3 e The error values between the measured andpredicted air temperature results.
Points Broiler zone 2 m height
Cm � CCFD Ev (%) Cm � CCFD Ev (%)
1 0.08 0.03 0.08 0.03
2 0.34 0.11 0.34 0.11
3 0.08 0.03 0.08 0.03
4 0.04 0.01 0.03 0.01
5 0.49 0.16 1.29 0.42
6 0.34 0.11 0.34 0.11
7 0.08 0.03 0.34 0.11
8 0.08 0.03 0.09 0.03
9 0.12 0.04 0.28 0.09
10 0.59 0.19 1.42 0.46
11 0.08 0.03 0.08 0.03
12 0.34 0.11 0.34 0.11
13 0.08 0.03 0.08 0.03
14 0.03 0.01 0.03 0.01
15 0.50 0.16 1.27 0.42
Average 0.07 0.13

Fig. 7 e The air ventilation rates.
b i o s y s t em s e n g i n e e r i n g 1 1 2 ( 2 0 1 2 ) 2 9 3e3 0 3300
the building from one end to the other. The position of inlet
slots and exhaust fans creates a high air movement inside the
building. The air velocity for standard design at broiler zone
was 0.525m s�1 while Donlad (2003) recommended that the air
velocity on the floor duringwintertime should be < 0.25m s�1.
Another study established by Liu, Wang, Beasley, and Oviedo
(2007) indicated that the mean air velocity at a 250 mm height
is 0.24 m s�1 with a standard division of 0.14 m s�1 in a stan-
dard cross-ventilated building. During winter season, this
high air velocity creates inconsistent conditions inside the
building. The cold air also reaches directly to the animal zone
where it rapidly decreases body temperature. Using the
ventilation system, it appears to be difficult to maintain the
desired indoor temperatures during cold weather. For energy
recovery inside the broiler building, heat exchangers should
be used. It is difficult to connect the heat exchanger with inlet
pipe ventilation systemswhere the heat exchanger needs only
two connecting points for inlet and outlet. For this reason,
four port ventilation systems have be designed. The predicted
air velocities in the broiler zone for the designed ventilation
systems were 0.44, 0.31, 0.3 and 0.29 for C-1, C-2, C-3 and C-4
respectively. This means C-4 could approach the target air
velocity in the broiler zone in unlike the other designed cases.
Table 4 describes the different ventilation rates across the
whole building and the broiler zones for the improved designs
compared to the standard design. In broiler zone, the venti-
lation rate wasmore than twice that of the whole zone in case
of standard tunnel ventilation. This high ventilation rate
could be acceptable only for summer conditions. Over the
whole zone, slight differences in the ventilation rates for all
designed cases were observedwhich ranged between 0.92 and
0.96 min�1 as shown in Table 4. In the broiler zone, compared
Table 4 e Average ventilation rate for 600 s: volume airchanges per minute, minL1.
Zones Designedvent. rate
Tunnel Case1
Case2
Case3
Case4
Broiler zone 0.089 0.249 0.102 0.110 0.107 0.134
Whole building 0.106 0.092 0.093 0.096 0.093
to the standard tunnel ventilation the highest ventilation rate
appeared with C-4 where it achieved about 54% compared to
the standard design as shown in Table 3. The other cases
achieved 43, 45, and 41% for C-2, C-3, and C-1 respectively.
3.3.2. Internal air temperature distributionIn terms of air temperature distribution in broiler zone, the
standard design was analysed and the improved designs
comparedwith that. As shown in Fig. 8 a, poor air temperature
distribution uniformity was observed in the standard design
where there was a clear discrepancy between the air
temperature close to the inlet opening slots and the outlet
exhaust fans.
The air temperature in standard design in the broiler zone
ranged between 2.63 and 34.12 �C with an average of 23.86 �C,
Fig. 8 e Air temperature distribution at 3 min after the
ventilation started.
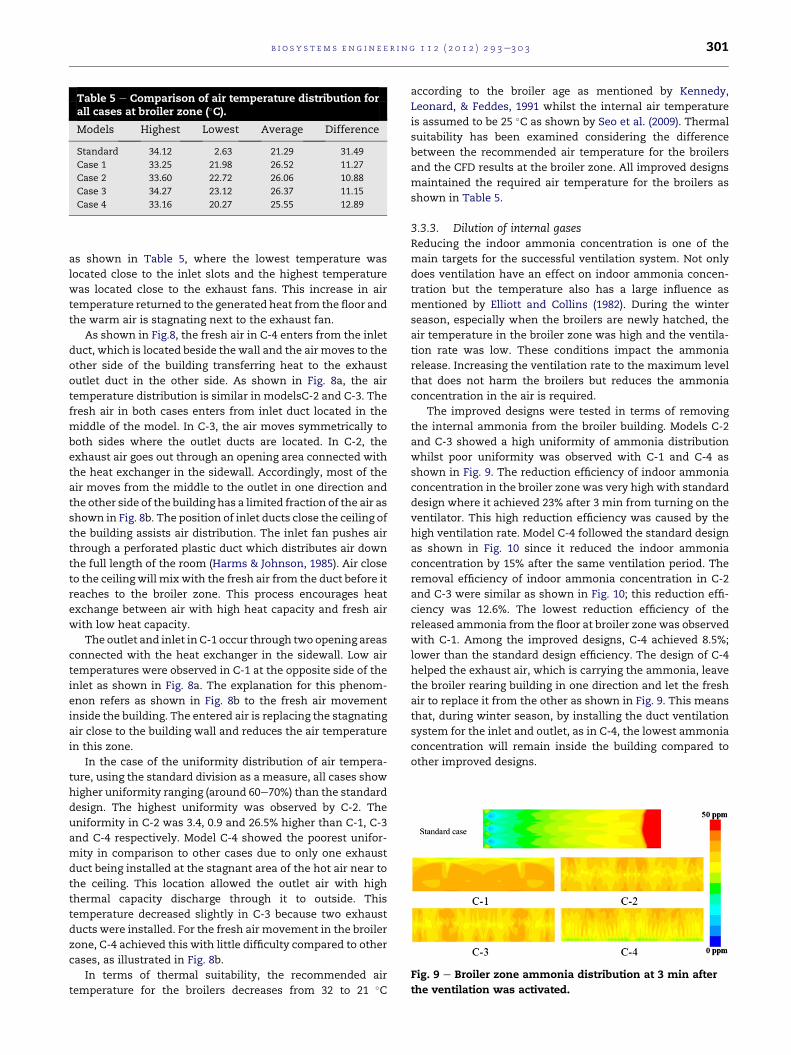
Table 5 e Comparison of air temperature distribution forall cases at broiler zone (�C).
Models Highest Lowest Average Difference
Standard 34.12 2.63 21.29 31.49
Case 1 33.25 21.98 26.52 11.27
Case 2 33.60 22.72 26.06 10.88
Case 3 34.27 23.12 26.37 11.15
Case 4 33.16 20.27 25.55 12.89
Fig. 9 e Broiler zone ammonia distribution at 3 min after
the ventilation was activated.
b i o s y s t em s e ng i n e e r i n g 1 1 2 ( 2 0 1 2 ) 2 9 3e3 0 3 301
as shown in Table 5, where the lowest temperature was
located close to the inlet slots and the highest temperature
was located close to the exhaust fans. This increase in air
temperature returned to the generated heat from the floor and
the warm air is stagnating next to the exhaust fan.
As shown in Fig.8, the fresh air in C-4 enters from the inlet
duct, which is located beside the wall and the air moves to the
other side of the building transferring heat to the exhaust
outlet duct in the other side. As shown in Fig. 8a, the air
temperature distribution is similar in modelsC-2 and C-3. The
fresh air in both cases enters from inlet duct located in the
middle of the model. In C-3, the air moves symmetrically to
both sides where the outlet ducts are located. In C-2, the
exhaust air goes out through an opening area connected with
the heat exchanger in the sidewall. Accordingly, most of the
air moves from the middle to the outlet in one direction and
the other side of the building has a limited fraction of the air as
shown in Fig. 8b. The position of inlet ducts close the ceiling of
the building assists air distribution. The inlet fan pushes air
through a perforated plastic duct which distributes air down
the full length of the room (Harms & Johnson, 1985). Air close
to the ceiling will mix with the fresh air from the duct before it
reaches to the broiler zone. This process encourages heat
exchange between air with high heat capacity and fresh air
with low heat capacity.
The outlet and inlet in C-1 occur through two opening areas
connected with the heat exchanger in the sidewall. Low air
temperatures were observed in C-1 at the opposite side of the
inlet as shown in Fig. 8a. The explanation for this phenom-
enon refers as shown in Fig. 8b to the fresh air movement
inside the building. The entered air is replacing the stagnating
air close to the building wall and reduces the air temperature
in this zone.
In the case of the uniformity distribution of air tempera-
ture, using the standard division as a measure, all cases show
higher uniformity ranging (around 60e70%) than the standard
design. The highest uniformity was observed by C-2. The
uniformity in C-2 was 3.4, 0.9 and 26.5% higher than C-1, C-3
and C-4 respectively. Model C-4 showed the poorest unifor-
mity in comparison to other cases due to only one exhaust
duct being installed at the stagnant area of the hot air near to
the ceiling. This location allowed the outlet air with high
thermal capacity discharge through it to outside. This
temperature decreased slightly in C-3 because two exhaust
ducts were installed. For the fresh air movement in the broiler
zone, C-4 achieved this with little difficulty compared to other
cases, as illustrated in Fig. 8b.
In terms of thermal suitability, the recommended air
temperature for the broilers decreases from 32 to 21 �C
according to the broiler age as mentioned by Kennedy,
Leonard, & Feddes, 1991 whilst the internal air temperature
is assumed to be 25 �C as shown by Seo et al. (2009). Thermal
suitability has been examined considering the difference
between the recommended air temperature for the broilers
and the CFD results at the broiler zone. All improved designs
maintained the required air temperature for the broilers as
shown in Table 5.
3.3.3. Dilution of internal gasesReducing the indoor ammonia concentration is one of the
main targets for the successful ventilation system. Not only
does ventilation have an effect on indoor ammonia concen-
tration but the temperature also has a large influence as
mentioned by Elliott and Collins (1982). During the winter
season, especially when the broilers are newly hatched, the
air temperature in the broiler zone was high and the ventila-
tion rate was low. These conditions impact the ammonia
release. Increasing the ventilation rate to the maximum level
that does not harm the broilers but reduces the ammonia
concentration in the air is required.
The improved designs were tested in terms of removing
the internal ammonia from the broiler building. Models C-2
and C-3 showed a high uniformity of ammonia distribution
whilst poor uniformity was observed with C-1 and C-4 as
shown in Fig. 9. The reduction efficiency of indoor ammonia
concentration in the broiler zone was very high with standard
design where it achieved 23% after 3 min from turning on the
ventilator. This high reduction efficiency was caused by the
high ventilation rate. Model C-4 followed the standard design
as shown in Fig. 10 since it reduced the indoor ammonia
concentration by 15% after the same ventilation period. The
removal efficiency of indoor ammonia concentration in C-2
and C-3 were similar as shown in Fig. 10; this reduction effi-
ciency was 12.6%. The lowest reduction efficiency of the
released ammonia from the floor at broiler zone was observed
with C-1. Among the improved designs, C-4 achieved 8.5%;
lower than the standard design efficiency. The design of C-4
helped the exhaust air, which is carrying the ammonia, leave
the broiler rearing building in one direction and let the fresh
air to replace it from the other as shown in Fig. 9. This means
that, during winter season, by installing the duct ventilation
system for the inlet and outlet, as in C-4, the lowest ammonia
concentration will remain inside the building compared to
other improved designs.

Fig. 10 e Indoor ammonia concentration in broiler zone for
the different improved designs.
b i o s y s t em s e n g i n e e r i n g 1 1 2 ( 2 0 1 2 ) 2 9 3e3 0 3302
4. Conclusion
Three concepts for improving ventilation were investigated
and assessment parameters determined (ventilation rate, air
temperature distribution, and ammonia dilution). These
concepts were tested by using CFD simulation for four
designed ventilation systems. Field experiments were con-
ducted to validate the designed cases where very low errors
were observed. In the broiler zone, the highest ventilation rate
after tunnel ventilation was in C-4 where it achieved about
54% in comparison to the standard design. All cases showed
higher uniformity ranging around 60e70% than the standard
design. The highest uniformity in air temperature distribution
was observed by C-2. All improved designs showed a thermal
suitability which maintains a required air temperature for the
broilers. The reduction in indoor ammonia concentration at
broiler zone was high with the standard design but satisfac-
tory reduction was achieved by C-4 where the reduction effi-
ciencywas 15% after 3min from turning the ventilator on. The
least satisfactory reduction efficiency appeared in C-1while C-
2 and C-3 were almost similar.
For further study, an investigation into the installation of
an aireair heat exchanger for energy recovering using C-4 is
recommended.
r e f e r e n c e s
Analytis, G. T. (2003). Implementation of the renormalizationgroup (RNG) keε turbulence model in GOTHIC/6.lb: solutionmethods and assessment. Annals of Nuclear Energy, 30,349e387.
Barrington, S. F., & MacKinnon, I. R. (1990a). Air distribution fromrectangular wooden ventilation ducts. American Society ofAgricultural Engineers, Transactions of the ASAE, 33(3), 944e948.
Barrington, S. F., & MacKinnon, I. R. (1990b). Mathematicalmodeling of ventilation duct performance. American Society ofAgricultural Engineers, Transactions of the ASAE, 33(4),1329e1335.
Bayraktar, H., Artuko�glu, M., & Altan, A. (2004). Evaluation of thepad cooling system effectiveness used in hot weatherconditions in broiler houses: Izmir case study. HayvansalUretim, 45(2), 1e9.
Blanes-Vidal, V., Guijarro, E., Balasch, S., & Torres, A. G. (2008).Application of computational fluid dynamics to the predictionof airflow in a mechanically ventilated commercial poultrybuilding. Biosystems Engineering, 100, 105e116.
Bucklin, R. A., Jacob, J. P., Mather, F. B., Leary, J. D., & Naas, I. A.(2009). Tunnel ventilation of broiler houses. This document isFACTSHEET PS-46, one of a series of the Animal ScienceDepartment, Florida Cooperative Extension Service, Instituteof Food and Agricultural Sciences. University of Florida. http://edis.ifas.ufl.edu.
Cangar, O., Aerts, J. M., Buyse, J., & Berckmans, D. (2008). Spatialdistribution of surface temperature and heat loss in broilerchickens. publication number 701P0408 Livestock environmentVIII conference (pp. 789e796). Iguassu Falls, Brazil: ASAEB.
Carpenter, G. H. (1972). The design of Permeable ducts and theirApplication to the ventilation of livestock buildings. Journal ofAgricultural Engineering Research, 17, 219e230.
Corria M. E., Naas I. A. Adapting A tunnel ventilation for highdensity broiler production - a case study. In Livestockenvironment VI: Proceedings of the 6th International Symposium(Louisville, Kentucky, USA), 2001, 461e467.
Donald, J. (2003). Principles of successful wintertime broiler houseventilation. Aviatech, 1(4).
El Moueddeb, K., Barrington, S., & Barthakur, N. (1997). Perforatedventilation ducts: part 1, a model for air flow distribution.Journal of Agricultural Engineering Research, 68, 21e27.
Elliott, H. A., & Collins, N. E. (1982). Factors affecting ammoniarelease in broiler houses. Transaction of ASAE, 25(2), 413e424.
Fluent manual. Fluent user guide2006, Version 6.2.2. Lebanon, NH,USA.
Gates, R. S., Overhults, D. G., & Zhang, S. H. (1996). Minimumventilation for modern broiler facilities. American Society ofAgricultural and Biological Engineers, 39(3), 1135e1144.
Harms, R. G., & Johnson, P. D. A. (1985). Ventilation handbook:Livestock and poultry. B.C. Canada: B.C. Ministry of Agricultureand Food Victoria, ISBN 0-7726-0372-3.
Hong, S., Lee I-, B., Hwang, H., Seo, I., Bitog, J. P., Yoo, J., et al.(2008). Numerical simulation of ventilation efficiencies ofnaturally ventilated multi-span greenhouses in Korea.American Society of Agricultural and Biological Engineers, 51(4),1417e1432.
Kennedy, D. A., Leonard, J. J., & Feddes, J. J. (1991). Field test ofa PVC plate heat exchanger for animal housing. AmericanSociety of Agricultural Engineers. Applied Engineering inAgriculture, 7(4), 457e460.
Kwon, K.-S., Lee, I.-B., Han, H.-T., Shin, C.-Y., Hwang, H.-S.,Hong, S.-W., et al. (2011). Analysing ventilation efficiency ina test chamber using age-of-air concept and CFD technology.Biosystems Engineering, 110, 421e433.
Lee, I.-B., Sase, S., & Sung, S. (2007). Evaluation of CFD accuracyfor the ventilation study of a naturally ventilated broilerhouse. Japan Agricultural Research Quarterly, 41(1), 53e64.
Lee, I.-B., Sase, S., Han, H., Hong, H., Sung, S., Hwang, H., et al.(2009). Ventilation design for a chick incubator usingcomputational fluid dynamics. Japan Agricultural ResearchQuarterly, 43(3), 227e237.
Lee, I.-B., & Short, T. H. (2000). Two-dimensional numericalsimulation of natural ventilation in a multi-span greenhouse.American Society of Agricultural and Biological Engineers, 43(3),745e753.
Liu, Z., Wang, L., Beasley, D., & Oviedo, E. (2007). Effect of moisturecontent on ammonia emissions from broiler litter:a laboratory study. Journal of Atmospheric Chemistry, 58, 41e53.
Redwine, J. S., Lacey, R. E., Mukhtar, S., & Cary, J. B. (2002).Concentration and emissions of ammonia and particulatematter in tunnel-ventilated broiler houses under summerconditions in Texas. American Society of Agricultural andBiological Engineers, 45(4), 1101e1109.

b i o s y s t em s e ng i n e e r i n g 1 1 2 ( 2 0 1 2 ) 2 9 3e3 0 3 303
Saraz, J. A. O., Damasceno, F. A., Gates, R. S., Rocha, K. S. O.,Tinoco, I. F., Marin, O. L. Z. 3D-CFD modeling of a TypicalUninsulated and internal Misting tunnel ventilated Brazilianpoultry house. In ASABE Annual International Meeting. David L.Lawrence Convention Center Pittsburgh, Pennsylvania, 2010.
Seo, I., Lee, I.-B.,Moon,O. K., Kim,H. T., Hwang, H. S., Hong, S., et al.(2009). Improvement of the ventilation system of a naturallyventilated broiler house in the cold seasonusing computationalsimulations. Biosystems Engineering, 104(1), 106e117.
Skomorucha, I., & Herbut, E. (2005). Effect of an earth tube heatexchanger on broiler house climate in the summer period, Vol. 2.Warsaw, Poland: ISAH.
SSLI. (2010). Statistical survey of livestock industry. South Korea:NAPQMS (National Agricultural Product Quality ManagementService).
Xin, H., Berry, I. L., Tabler, G. T., & Costello, T. A. (2001). Heat andmoisture production of poultry and their housing systems:broilers. Transactions of the ASAE, 44(6), 1851e1857.
Copyright © 2022 FDOKUMEN