
Computational fluid dynamics simulation and experimental ...

Ac
FP
a
ARRA
KCADH
1
saco
ig“ioaetttimtAthoT
1d
Separation and Purification Technology 63 (2008) 466–474
Contents lists available at ScienceDirect
Separation and Purification Technology
journa l homepage: www.e lsev ier .com/ locate /seppur
pplication of computational fluid dynamics to fixed bed adsorptionalculations: Effect of hydrodynamics at laboratory and industrial scale
. Augier ∗, C. Laroche, E. Brehonrocess Development and Engineering Division, Institut Francais du Pétrole, IFP-Lyon, BP 3, 69360 Solaize, France
r t i c l e i n f o
rticle history:eceived 18 January 2008
a b s t r a c t
A numerical model has been developed to simulate the adsorption of chemical species inside differentgeometries of columns filled with solid adsorbent particles. In this model hydrodynamics, mass transfer
eceived in revised form 28 May 2008ccepted 5 June 2008
eywords:FDdsorption
and adsorption equilibrium are accounted for. It has been applied at two different scales: at the laboratoryscale in order to estimate the impact of the near wall channelling effect inside small columns, and at theindustrial scale in order to calculate the equivalent axial dispersion induced by pipes or beams that canbe found inside very large adsorption towers. For both applications, hydrodynamics were found to have astrong impact on the adsorption efficiency. These examples demonstrate how the use of computational
e ver
ta
pdlbtdiattsoeTw
tac
esignydrodynamics
fluid dynamics proves to b
. Introduction
It is well known that the efficiency of adsorption processes istrongly impaired by hydrodynamics [1,2]. Plug flow is desirable,nd any deviation from this ideal case decreases the separation effi-iency. The causes of plug flow deviation are numerous and dependn the size of the considered columns.
Inside small laboratory columns such as those used to character-ze adsorbent performances, packing heterogeneities near the wallenerate by-pass flows within the bed of adsorbent. The so-callednear-wall channelling effect” decreases the plug flow behaviournside the column [3,4]. Analysis of this phenomenon can be carriedut using two different approaches. In a first approach, the flow isssumed to be essentially one-dimensional and the dispersion gen-rated by the flow along the wall is considered to be an increase ofhe overall axial dispersion. In this case, correlations are suggestedo predict the overall axial dispersion [5–8]. In the second approach,he flow is considered to be two-dimensional. In this case, the flows more accurately and locally described, but such a description is
ore complex to handle and the impact of the flow on adsorp-ion efficiency (or reaction efficiency) is more difficult to evaluate.xial and radial dispersion coefficients have to be known, as well as
he porosity profile within the bed of adsorbent. Numerical studiesave reported the role of by-pass flows near the wall inside reactorsr adsorbers using two-dimensional models [9–13]. In particular,obis and Vortmeyer [14] used a two-dimensional model to study
∗ Corresponding author. Tel.: +33 4 78 02 21 42; fax: +33 4 78 02 20 08.E-mail address: [email protected] (F. Augier).
Oaatt
ia
383-5866/$ – see front matter © 2008 Elsevier B.V. All rights reserved.oi:10.1016/j.seppur.2008.06.007
y relevant for process design and scale-up of adsorption columns.© 2008 Elsevier B.V. All rights reserved.
he near-wall channelling effect on an instantaneous isothermaldsorption.
Inside industrial columns, perturbation of the flow due to theresence of obstacles in the columns such as pipes, beams oristributor trays is the main cause of dispersion. This is particu-
arly true in the case of simulated moving bed (SMB) processesecause of the presence of a large number of distributor trays insidehe adsorbers. SMB process operation is complex and will not beescribed in this paper, see [2] for more details. SMB adsorbers used
n the petrochemical industry are often very large (3 < dT < 10 m)nd are divided into a large number of consecutive beds. The dis-ribution device of each bed is composed of a network of pipeshat inject or collect a quantity of fluid. As a consequence of theirignificant size, distributor trays are either supported by beamsr divided into self-supported panels with large frames. The pres-nce of obstacles (pipes, beams, frames of panels) disrupts the flow.his phenomenon generates dispersion and a velocity distribution,hich can deteriorate the efficiency of the process.
The general objective of this work is to develop a simulation toolhat enables to study the coupling between hydrodynamics anddsorption, at any scale from the laboratory to the industrial pro-ess, considering both linear or non-linear adsorption isotherms.nly isothermal adsorption is considered, since it is applied todsorption processes operating in the liquid phase, where thedsorbed species are replaced by a competitively adsorbed species,
he desorbent, with negligible heat of adsorption exchanged. Massransfer limitations within the adsorbent are taken into account.After a first part dedicated to the description of the model andts validation with two different experiments without adsorption,second part presents the application of the model to characterize
F. Augier et al. / Separation and Purificati
Nomenclature
A mass fraction of specie A in the inter-particle volumeAds (Ci) liquid–solid exchange term (mol/m3/s)bj Langmuir–Freundlich model parameters (m3/mol)Ci inter-particle liquid phase concentration of the
species i (mol/m3)Cmi average intra-particle liquid phase concentration of
the species i (mol/m3)C0 concentration at the inlet of the domain (mol/m3).dp particle diameter (m)dT column diameter (m)Dax axial mass dispersion coefficient (m2/s)Drad radial mass dispersion coefficient (m2/s)F liquid–solid friction force (N/m3)k1 fluid film mass transfer coefficient (s−1)k2 internal mass transfer coefficient (s−1)K permeability (m2)L height of the domain (m)Mi molar masses (g/mol)N number of speciesPeax Udp/Dax: axial Peclet numberPeax(1D) Udp/Dax(1D): axial Peclet number for 1D modelPerad Udp/Drad: radial Peclet numberqi average adsorbed phase concentration of i (mol/m3)qm Langmuir–Freundlich model parameter (mol/m3)t time (s)Rep �Usldp/�: particular Reynolds numberU interstitial velocity (m/s)Usl superficial velocity (m/s) (=εiU)
Greek charactersˇ non-Darcy coefficient (m−1)εi inter-particle porosityεp internal porosity of the adsorbent� j Langmuir–Freundlich model parameters� apparent liquid viscosity (Pa s)�0 first outlet concentration moment (HETP calcula-
tion)� liquid density (kg/m3)
tetea
hoc
1
chttctt
t
H
flftagitfutiaT“d
2
mceatptbhCmom
2
lfTshc[
∇f
f
F
fp
�p apparent adsorbent density (kg/m3)�2 outlet concentration second moment
he hydrodynamics inside adsorption laboratory columns of differ-nt sizes. A third part then focuses on the application of the modelo a specific industrial problem, i.e. the evaluation of the adsorptionfficiency losses induced by the presence of obstacles such as pipesnd beams inside industrial multi-staged adsorbers.
In this paper adsorption efficiencies are compared in terms ofeight equivalent to a theoretical plate (HETP), according to a the-ry commonly used to characterize mass transfer in adsorptionolumns [2].
.1. Diffusion in adsorption columns
According to this theory, a column can be regarded as a cas-ade of continuously stirred tank reactors (CSTR) having the sameeight. When the flow inside a column becomes more dispersive,
he corresponding HETP increases and the number of equivalentheoretical plates (NETP) decreases, as does the separation effi-iency. Following Van Deemter’s theory [1], the HETP is the sum ofhree contributions: (1) molecular diffusion, expressed as a func-ion of 1/U, (2) hydrodynamics diffusivity, and (3) the various masssl
K
on Technology 63 (2008) 466–474 467
ransfer resistances, proportional to the interstitial velocity U.
ETP = A1
U+ A2 + A3U (1)
In this expression, A1 and A3 are parameters depending on theuid–adsorbent system [2]. A1 is proportional to the molecular dif-
usivity, and is too small in liquid systems to contribute significantlyo axial dispersion. A3 is a coefficient depending on the variousdditive mass transfer resistances (internal and external). A2 is thelobal hydrodynamics contribution to the HETP induced by therregular flow patterns of the fluid, and is the sum of two terms:he diffusion induced by the flow around the particles and the dif-usion induced by large-scale non-uniformities of the flow, due toneven packing, non-ideal fluid distribution, or wall–fluid interac-ions. When plug flow is assumed and a linear adsorption isotherms considered, the “large-scale” contribution to the HETP is zero,nd A2 reduces to the value of the adsorbent particle diameter dp.his leads to an overall axial Peclet number Peax equal to 2. Thelarge-scale” dispersion contribution to the HETP induced by flowiscrepancies is specifically the object of this study.
. Theory/CFD model
The model describes the adsorption phenomena at an inter-ediate scale between the adsorbent particles and the adsorption
olumn. Each cell of the 2D (or 3D) calculation domain contains sev-ral solid adsorbent particles. The interactions between the flownd the solid phase are not described in the CFD model, but areaken into account as diffusive terms in the equations of trans-ort and momentum balance. Adsorption and mass transfer insidehe adsorbent are taken into account in the transport equations,ecause when adsorption isotherm is not linear, adsorption andydrodynamics are not supposed to be independent. The use of aFD model to describe hydrodynamics is particularly relevant whenass transfer limitations (internal plus external) do not mask any
ther dispersive effect. The less the mass transfer limitations, theore relevant is an accurate description of the hydrodynamics.
.1. Hydrodynamics
The model used for the hydrodynamics is a modification of theaminar Navier–Stokes equations in order to take into account theriction between the liquid and the fixed bed of adsorbent [15].his model, called “Brinkman–Forchheimer” model has been exten-ively used to simulate flows in porous media. Its validity domainas been discussed in the literature [16,17] and simulations areompared to experimental results by different authors (Benyahia18] and Chan et al. [19]). The equations to be solved are:
U = 0 (2)
or continuity (uncompressible flow),
∂εi�U
∂t+ ∇(εi�UU) = −εi∇P + εi�∇2U + εiF (3)
or momentum, and
= −�Usl
K− ˇ�U2
sl (4)
or the fluid–particle friction forces. K is the permeability of theorous media and ˇ is the non-Darcy term. In a fixed bed of narrow
ized spheres, it is convenient to calculate K and ˇ from the Ergun’saw [20]:= ε3id2
p
150(1 − εi)2
(5)
4 ificati
ˇ
ocetastmeR(rtpn
atpecgCfl
2
cbtilumctttp
ε
ebsinPps(fimc
(
l
ti
wifm
q
Ftr
2
Bowpsftt(
F5stivcfiti1doifi1vvimtnP
lfifisfi
68 F. Augier et al. / Separation and Pur
= 1.751 − εi
ε3idp
(6)
This law is an empirical expression originally developed forne-dimensional flows inside isotropic media, and its use foralculations of two-dimensional flows is not guaranteed. Nev-rtheless, when the first (viscous) term of Eq. (4) is dominant,he use of this friction term in the Navier–Stokes equation iscceptable [21]. But when the inertial effect increases, the modelometimes shows important deviations compared to experimen-al results. In that case the value of the non-Darcy coefficient
ay be adapted to improve the agreement between model andxperiments as reported in the literature. In the present study theeynolds number Re is low (Rep < 40) and the viscous term of Eq.4) is dominant; therefore, the model is assumed to give realisticesults. Moreover, Castillo and Lopez [22] have recently validatedhe Brinkman–Forchheimer model for flows inside fixed beds ofarticles with low tube-to particle diameter ratio, at high Reynoldsumbers.
The viscosity value in Eq. (3) is still under debate. Differentuthors suggest to calculate it as a turbulent viscosity depending onhe Particulate Reynolds number [23], but different functions areroposed. In case of low values of Rep (<50), the resulting appar-nt viscosity is close to the molecular viscosity for some authors orlose to twice the molecular viscosity for others. Because of the veryood agreement between simulations and experiments obtained byhan et al. [19] using the molecular viscosity in the case of laminarows, the same choice has been made in this study.
.2. Transport and adsorption of chemical species
Many commercial adsorbents consist of small microporousrystals formed into a macroporous particle or pellet. Such adsor-ents offer two distinct porosity levels: the microporosity withinhe crystals where adsorption takes place, and the macroporos-ty within the pellet. Chemical species are transported from theiquid between the particles (inter-particle liquid phase) to the liq-id in the macropores (intra-particle liquid phase) and from theacropores to the micropores (adsorbed phase). Therefore, for each
hemical species, three variables are used to describe the adsorp-ion phenomena: the inter-particle liquid phase concentration Ci,he intra-particle liquid phase concentration Cmi and the concen-ration of the adsorbed phase qi. Concerning the inter-particle liquidhase concentration, the transport equation is:
i∂Ci
∂t+ ∇(−εiD∇Ci + CiεiU) = −k1(Ci − Cmi) (7)
Porosity εi is the inter-particle porosity and is assumed to beither constant for simulations done on a very large-scale, or toe calculated if spatial variations are known, as in the case ofmall columns. D is the dispersion tensor. Dispersion phenomenan fixed beds are known to be anisotropic; therefore D is a diago-al tensor, where Dax and Drad are calculated from axial and radialeclet number expressions. Many correlations exist to estimate dis-ersion coefficients as reviewed by Delgado [24]. In the presenttudy, the mass transfer rate is modelled using a linear driving forceLDF) function. k1 is the overall mass transfer coefficient for fluidlm resistance (lumped parameter for external film resistance plusacropore diffusional resistance). The intra-particle liquid phase
oncentration is calculated using the following equation:
1 − εi)εp∂Cmi
∂t= k1(Ci − Cmi) − k2(q∗
i − qi) × 1000�p
εpMi(8)
The internal microporous diffusion is also modelled using ainear rate model, with a coefficient k2, fitted from experimen-
tpTap
on Technology 63 (2008) 466–474
al results. The instantaneous average adsorbed concentration qis described as:
∂qi
∂t= k2(q∗
i − qi) (9)
here q∗i
is the adsorbed concentration at equilibrium with thentra-particle liquid phase concentration Cmiq
∗i
can be calculatedrom various adsorption models, such as the Langmuir–Freundlich
odel:
∗i = qmbiC
�imi
1 +∑
j=1,NbjC�jmj
(10)
Calculations are performed with the CFD commercial softwareluent6.3. Wu et al. [25] have developed a similar model to describehe linear adsorption of three components inside liquid chromatog-aphy columns.
.3. Validation
Despite the large number of published validation studies on therinkman–Forchheimer model, a new validation has been carriedut to ensure that our implementation within the CFD softwareas correct. The first simulation represents the stationary state dis-ersion of a tracer inside a 5 cm inner diameter tube filled withpherical glass particles, under gas flow. This calculation is per-ormed to validate the dispersion tensor model. In a second step,he model is used to reproduce a more macroscopic experiment, i.e.he dynamic response to a tracer injection inside smaller columnsФ 1–2 cm) also filled with glass spheres, under liquid flow.
The first simulation is based on the gas flow experiments ofahien and Smith [26]. The experimental set-up is composed of a.08 cm inner diameter column, filled with 4 mm diameter glasspheres. The column length is 30.48 cm. Air is blown throughhe column at normal conditions. The superficial velocity of thenjected air is 0.051 m/s. A gas tracer (CO2) is injected with the sameelocity as the air inside the column at the inlet of the column by aapillary tube located in the centre of the cross-section. Radial pro-les of CO2 concentrations are measured at different distances fromhe injection point. Simulations are performed without adsorption,n a 2D axi-symmetrical domain. The mesh is Cartesian and contains0,000 cells. Peax is set to 2 and Perad is set to 11 as suggested byifferent authors [27] for gas flow. Normalized simulation profilesbtained with these values are compared to experimental resultsn Fig. 1. Agreement is good enough to validate the dispersion coef-cient expressions. Different values of Peax are tested in the range< Peax < 3, but no significant effect is seen. On the other hand, thealue of Perad has a strong influence on the results, but the initialalue of Perad = 11 gives the best fit between simulation and exper-ment. As suggested by some authors [12,26] a value of Perad = 11 to
odel the flow inside the column together with higher values inhe near wall region (r < dp typically) have been tested. As no sig-ificant effect is observed on simulation results, a constant value oferad across the section is kept for all simulations.
The second validation step is based on experiments done in ouraboratory under liquid flow. Two 1 m long columns are used: therst one of 1 cm and the second one of 2 cm inner diameter, bothlled with 600 �m spherical glass particles. A toluene flow at auperficial velocity of 6 mm/s, at ambient conditions, is used for therst column. At time t = 0 s the feed is switched from pure toluene
o toluene coloured with an organic dye (sudan red), in order toroduce a positive step of dye concentration at the column inlet.he dye concentration at the column outlet is then measured asfunction of time. Simulations modelling this new test case areerformed using a porosity profile correlation fitted on Giese exper-

F. Augier et al. / Separation and Purification Technology 63 (2008) 466–474 469
comp
i
ε
Wprid
eetfl
Fp
Fig. 1. Scheme of the Fahien and Smith Experiment (left) and
ments [4]:
= A + B × cos
(2�x
dp
)exp
(− x
Cdp
)+ D exp
(− x
Edp
)(11)
ith A = 0.32, B = 0.35, C = 1.061, D = 0.21, E = 1.88. For these liquidhase experiments, it is difficult to define the values of axial andadial dispersion coefficients (or Peclet numbers) to be used sincemportant deviations between gas and liquid have been observed byifferent authors [26], especially regarding radial dispersion. Nev-
vitat
ig. 2. Simulation of a tracer flow (in white) inside a Ф 1 cm column. Snapshot of the trrofiles inside the column (right).
arison between experimental results and simulations (right).
rtheless, the previous values are used (Peax = 2, Perad = 11) for thexperiments reported here which are in the range 5 < Rep < 40, sincehose Peclet values are considered to be asymptotic values for liquidows with Rep > 20 [24].
The CFD mesh is Cartesian and contains 200 × 5000 cells. A finite
olume method with a second order spatial discretization schemes used. Fig. 2 shows a snapshot of the concentration transporthrough the column (left side), and a plot reporting the porositynd superficial velocity profiles as a function of the distance fromhe wall normalized by the particle diameter (right side). The exper-acer concentration (left); velocity, experimental and calculated (Eq. (11)) porosity
470 F. Augier et al. / Separation and Purification Technology 63 (2008) 466–474
Fp
icn
raolamrPfl
(sBacts
�
�
H
mbah
-
Fo
-
3pa
3l
mcipoBTfi
patltsdalc(ac
odi
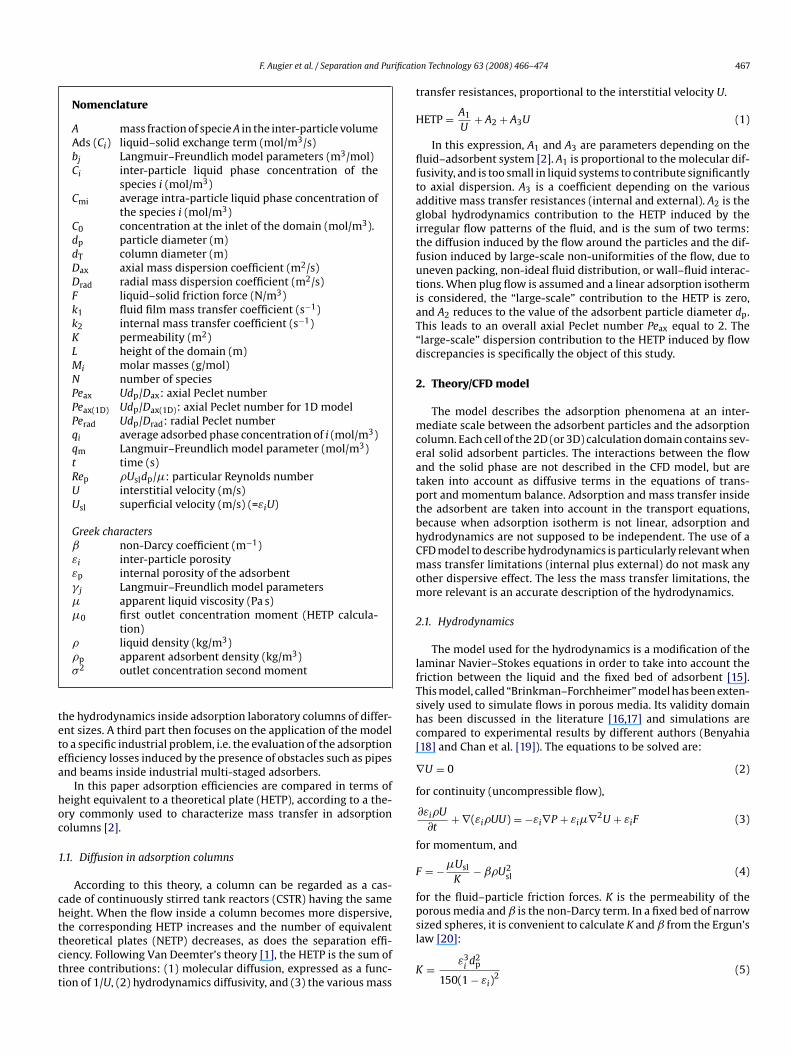
ig. 3. Tracer concentration at the outlet of the column: Experimental results com-ared with 1D and 2D simulations results (Ф 1 cm inner diameter, Usl = 0.6 cm/s).
mental porosity [4] and the porosity calculated from Eq. (11) areompared. The snapshot in Fig. 2 clearly illustrates the presence ofear-wall channelling effect.
Experimental results are compared in Fig. 3 with simulationesults obtained with two different models, i.e. the 2D CFD modelnd a classical 1D model including only axial dispersion. The shapef the time dependent concentration profile of the dye at the out-et of the column is reproduced by both models with a reasonablegreement. The value of the axial Peclet number used in the 1Dodel is fitted to Peax(1D) = 0.25 in order to yield the closest rep-
esentation of the experimental data. A curve corresponding toeax = 2 is also reported; so as to show the difference with an idealow without any wall effect.
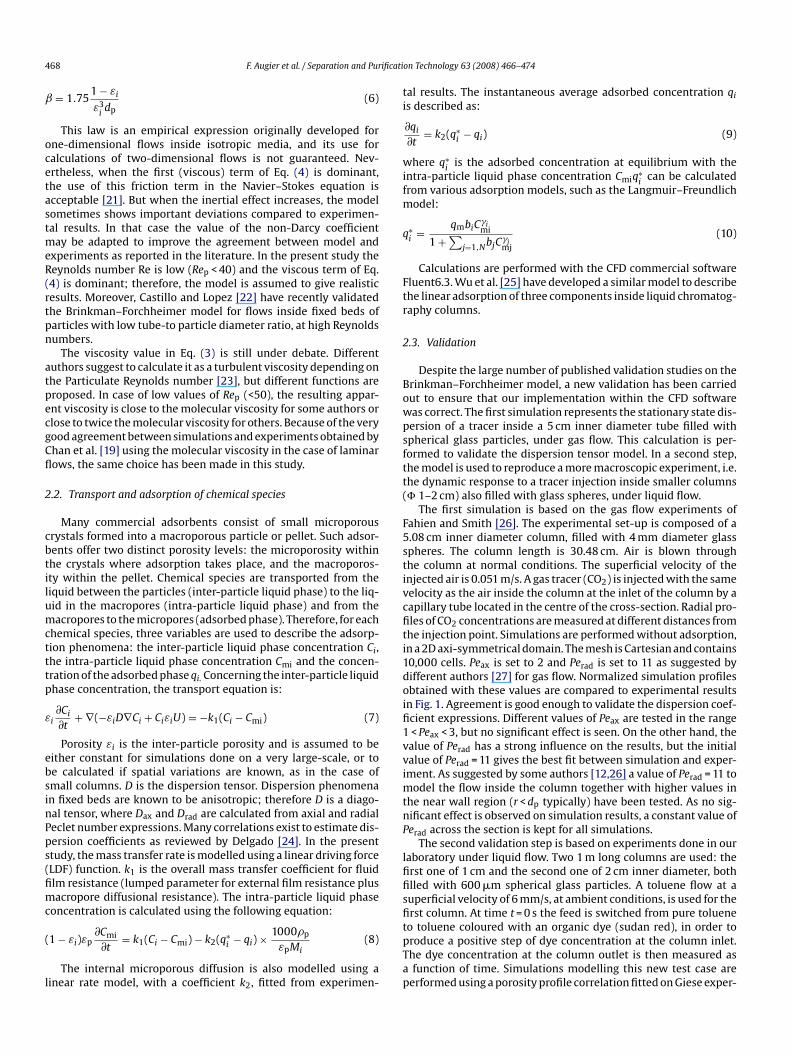
Similar experiments are performed with the second columnФ 2 cm inner diameter), varying the superficial velocity, and CFDimulations are run for all the tested experimental conditions.reakthrough curves are analysed by comparing the height equiv-lent to a theoretical plate (HETP) for each simulation. HETP arealculated using moment analysis. For a positive step of concen-ration Ci at the inlet of the column, the first moment �0 and theecond centred moment �2 respectively write:
0 =∫ ∞
0
(1 − Ci
C0
)dt (12)
2 = 2
∫ ∞
0
(1 − Ci
C0
)t dt − �2
0 (13)
The resulting HETP then follows:
ETP = �2
�20
L (14)
HETP are reported in Fig. 4, and show an acceptable agree-ent between experiments and simulations. The small deviation
etween simulations and experiments is perhaps due to the use ofpproximate values of Peax and Perad, but lacking accurate data, itas been preferred to not change these parameters.
These results suggest that:
The dispersion phenomena induced by the channelling effect canbe modelled with a 1D plug-dispersive approach with a goodagreement. The axial Peclet number used in the 1D model isvery small compared to the classical value observed in fixed bed
tmtos
ig. 4. Comparison of HETP measured and observed in both columns as a functionf the superficial velocity.
columns (Peax = 2), which indicates an important dispersion (×8in comparison with an ideal column).The two-dimensional CFD model allows a good description of thedispersion phenomena without fitting any parameters.
. Results: impact of the hydrodynamics on the adsorptionerformance of laboratory columns and industrialdsorbers
.1. Calculation of the adsorption efficiency inside smallaboratory columns
The previous CFD model is now modified in order to includeass transfer and adsorption phenomena. Two arbitrary chemi-
al species A and B are considered. Adsorption is assumed to besothermal and the form of the equilibrium relationship is sup-osed to be non-linear. Simulations are modelling a breakthroughf species A in a bed of adsorbent previously saturated with species, or reciprocally a breakthrough of B in A (reverse breakthrough).hese simulations are performed to illustrate the behaviour of bothavourable and unfavourable systems. The set of parameters useds reported in Table 1:
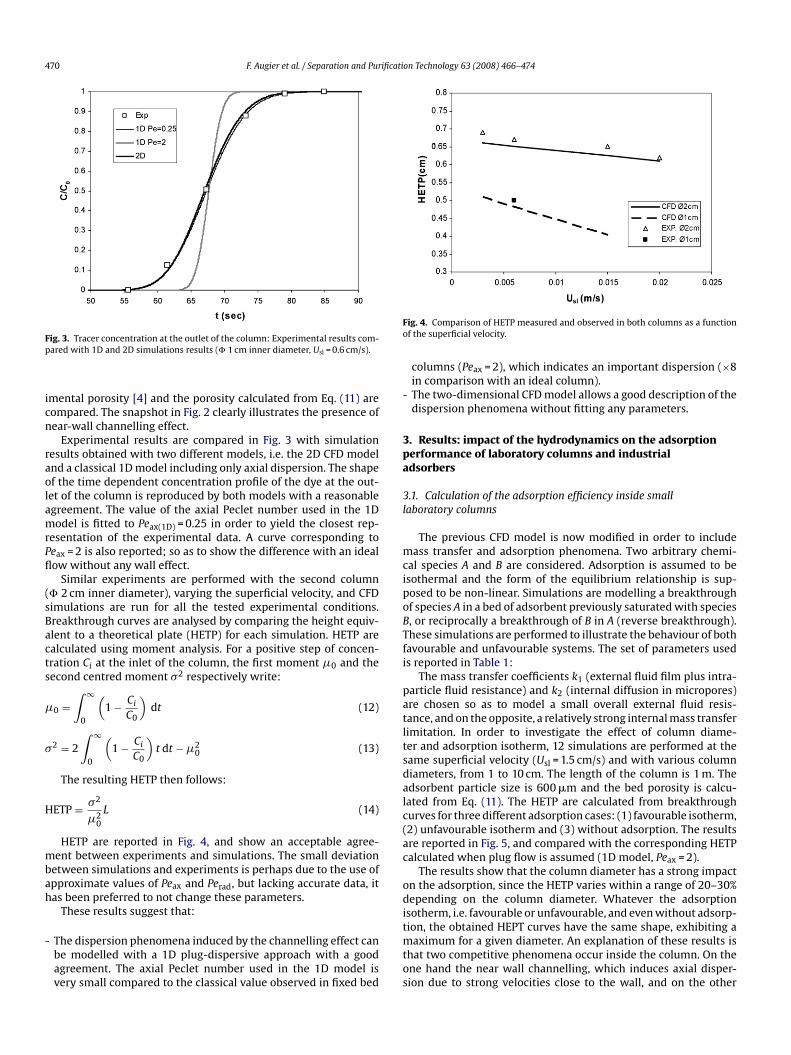
The mass transfer coefficients k1 (external fluid film plus intra-article fluid resistance) and k2 (internal diffusion in micropores)re chosen so as to model a small overall external fluid resis-ance, and on the opposite, a relatively strong internal mass transferimitation. In order to investigate the effect of column diame-er and adsorption isotherm, 12 simulations are performed at theame superficial velocity (Usl = 1.5 cm/s) and with various columniameters, from 1 to 10 cm. The length of the column is 1 m. Thedsorbent particle size is 600 �m and the bed porosity is calcu-ated from Eq. (11). The HETP are calculated from breakthroughurves for three different adsorption cases: (1) favourable isotherm,2) unfavourable isotherm and (3) without adsorption. The resultsre reported in Fig. 5, and compared with the corresponding HETPalculated when plug flow is assumed (1D model, Peax = 2).
The results show that the column diameter has a strong impactn the adsorption, since the HETP varies within a range of 20–30%epending on the column diameter. Whatever the adsorption
sotherm, i.e. favourable or unfavourable, and even without adsorp-
ion, the obtained HEPT curves have the same shape, exhibiting aaximum for a given diameter. An explanation of these results ishat two competitive phenomena occur inside the column. On thene hand the near wall channelling, which induces axial disper-ion due to strong velocities close to the wall, and on the other
F. Augier et al. / Separation and Purificati
Table 1Adsorption parameter set
Usl 0.15 m/sεi 0.32k1 5 s−1
k2 0.125 s−1
Peax 2Perad 11� 720 kg/m3
� 2.00E-04 Pa sqm 0.16 kg/kgba 2.95 m3/molbb 4.38 m3/mol�a 1.176�dMM
hcmntttndH
Fi
fTicIhdmdwthdnttsanibpscai
3d
isbcTabflDbfl
b 1.191p 6.00E-04 ma 106 g/molb 134 g/mol
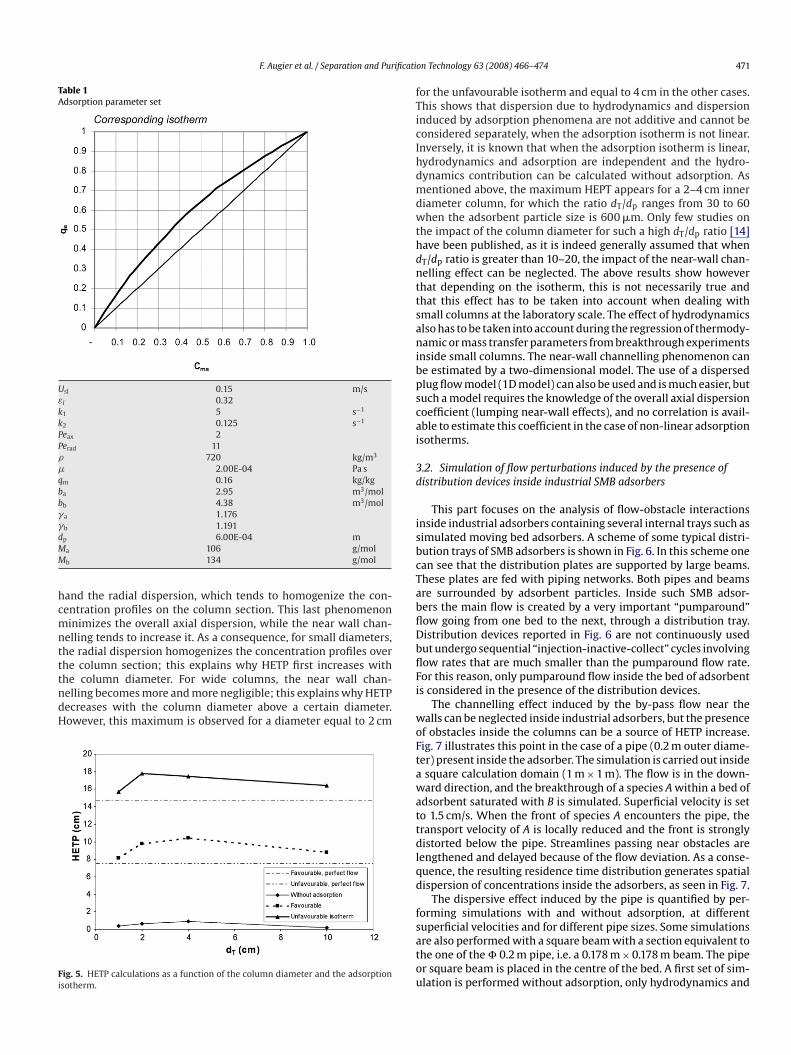
and the radial dispersion, which tends to homogenize the con-entration profiles on the column section. This last phenomenoninimizes the overall axial dispersion, while the near wall chan-
elling tends to increase it. As a consequence, for small diameters,he radial dispersion homogenizes the concentration profiles over
he column section; this explains why HETP first increases withhe column diameter. For wide columns, the near wall chan-elling becomes more and more negligible; this explains why HETPecreases with the column diameter above a certain diameter.owever, this maximum is observed for a diameter equal to 2 cmig. 5. HETP calculations as a function of the column diameter and the adsorptionsotherm.
Fi
woFtawattdlqd
fsatou
on Technology 63 (2008) 466–474 471
or the unfavourable isotherm and equal to 4 cm in the other cases.his shows that dispersion due to hydrodynamics and dispersionnduced by adsorption phenomena are not additive and cannot beonsidered separately, when the adsorption isotherm is not linear.nversely, it is known that when the adsorption isotherm is linear,ydrodynamics and adsorption are independent and the hydro-ynamics contribution can be calculated without adsorption. Asentioned above, the maximum HEPT appears for a 2–4 cm inner
iameter column, for which the ratio dT/dp ranges from 30 to 60hen the adsorbent particle size is 600 �m. Only few studies on
he impact of the column diameter for such a high dT/dp ratio [14]ave been published, as it is indeed generally assumed that whenT/dp ratio is greater than 10–20, the impact of the near-wall chan-elling effect can be neglected. The above results show howeverhat depending on the isotherm, this is not necessarily true andhat this effect has to be taken into account when dealing withmall columns at the laboratory scale. The effect of hydrodynamicslso has to be taken into account during the regression of thermody-amic or mass transfer parameters from breakthrough experiments
nside small columns. The near-wall channelling phenomenon cane estimated by a two-dimensional model. The use of a dispersedlug flow model (1D model) can also be used and is much easier, butuch a model requires the knowledge of the overall axial dispersionoefficient (lumping near-wall effects), and no correlation is avail-ble to estimate this coefficient in the case of non-linear adsorptionsotherms.
.2. Simulation of flow perturbations induced by the presence ofistribution devices inside industrial SMB adsorbers
This part focuses on the analysis of flow-obstacle interactionsnside industrial adsorbers containing several internal trays such asimulated moving bed adsorbers. A scheme of some typical distri-ution trays of SMB adsorbers is shown in Fig. 6. In this scheme onean see that the distribution plates are supported by large beams.hese plates are fed with piping networks. Both pipes and beamsre surrounded by adsorbent particles. Inside such SMB adsor-ers the main flow is created by a very important “pumparound”ow going from one bed to the next, through a distribution tray.istribution devices reported in Fig. 6 are not continuously usedut undergo sequential “injection-inactive-collect” cycles involvingow rates that are much smaller than the pumparound flow rate.or this reason, only pumparound flow inside the bed of adsorbents considered in the presence of the distribution devices.
The channelling effect induced by the by-pass flow near thealls can be neglected inside industrial adsorbers, but the presencef obstacles inside the columns can be a source of HETP increase.ig. 7 illustrates this point in the case of a pipe (0.2 m outer diame-er) present inside the adsorber. The simulation is carried out insidesquare calculation domain (1 m × 1 m). The flow is in the down-ard direction, and the breakthrough of a species A within a bed of
dsorbent saturated with B is simulated. Superficial velocity is seto 1.5 cm/s. When the front of species A encounters the pipe, theransport velocity of A is locally reduced and the front is stronglyistorted below the pipe. Streamlines passing near obstacles are
engthened and delayed because of the flow deviation. As a conse-uence, the resulting residence time distribution generates spatialispersion of concentrations inside the adsorbers, as seen in Fig. 7.
The dispersive effect induced by the pipe is quantified by per-orming simulations with and without adsorption, at different
uperficial velocities and for different pipe sizes. Some simulationsre also performed with a square beam with a section equivalent tohe one of the Ф 0.2 m pipe, i.e. a 0.178 m × 0.178 m beam. The piper square beam is placed in the centre of the bed. A first set of sim-lation is performed without adsorption, only hydrodynamics and
472 F. Augier et al. / Separation and Purification Technology 63 (2008) 466–474
Fig. 6. Scheme of typical SMB distribution plates (left). Detail of the piping network (right).
hroug
tavAtr0tri(
dsiuit
Fig. 7. Snapshots of an adsorption t
ransport of inter-particle liquid phase concentrations are solvednd exchange terms are null. Fig. 8 shows the effect of the obstacleolume fraction on the normalized breakthrough curves of a species(left) and on the HETP (right), without any adsorption and mass
ransfer limitation, at Usl = 0.015 m/s. In the HETP plot, additionalesults are also reported. The position of the largest obstacle (Ф
.35 m) inside the calculation domain has been modified varyinghe distance between the obstacle and the outlet of the bed in theange 0–0.65 m, and the effect is very weak. Another reported results the effect of the dimension of the domain. For a given pipe sizeФ 0.35 m), calculations are performed inside square domains ofcpaib
Fig. 8. Effect of the size and shape of an obstacle on the
h a fixed bed in presence of a pipe.
ifferent lengths (0.8–4 m). As a consequence each domain corre-ponds to a given obstacle volume fraction. It is found that the HETPnduced by the obstacle is perfectly proportional to the obstacle vol-me fraction when the latter is below 10%. The shape of the obstacle
s also important because square beams have a stronger impact onhe HETP than pipes with equivalent volumes. A three-dimensional
alculation is performed in the case of the complete piping networkresented in Fig. 6. This fictitious example is performed inside andsorption bed of 10 m inner diameter and 1 m height. The pip-ng network is designed with an overall volume fraction inside theed of 7%. The corresponding HETP is reported in Fig. 8. This resultbreakthrough curves and HETP (no adsorption).

F. Augier et al. / Separation and Purification Technology 63 (2008) 466–474 473
the in
iiv
adoakraastbbactsacw
tsncp
obwcldiibps
p
Fig. 9. Effect of the superficial velocity on the global HETP (left) and
s coherent with other calculations done with single pipes, as thenduced HETP is close to the one induced by pipes of the sameolume fraction.
A second set of simulation with favourable or unfavourabledsorption is then performed, in the presence of a 0.35 m inneriameter pipe, a 0.178 m × 0.178 m square beam, or without anybstacle. Adsorption parameters are those reported in Table 1,nd mass transfer is mainly controlled by internal diffusion with2 = 0.15 s−1. The HETP dependence on the superficial velocity iseported in Fig. 9. The plot on the left shows the total HETP as
function of superficial velocity for favourable or unfavourabledsorption isotherms. The curves are almost linear because of thetrong mass transfer limitation inside the adsorbent, i.e. the thirderm in Eq. (1) is important. The plot on the right shows the contri-ution induced by the obstacle: HETP, defined as the differenceetween the total HETP with and without obstacle in the same flownd adsorption conditions. They are compared with the HETP cal-ulated in the presence of obstacles without adsorption. It is clearhat the obstacle contribution to the HETP not only depends on the
ize and the shape of the obstacle but also on the velocity of the fluidnd the adsorption isotherm. An unfavourable isotherm systemati-ally amplifies the flow dispersion induced by the hydrodynamics,hile a favourable isotherm tends to reduce it, because calculatedHETP corresponding to favourable and unfavourable are respec-ebdpa
Fig. 10. Breakthrough curves corresponding to different pipe diameters
crease of HETP induced by the obstacles (right). (with adsorption).
ively below and above HETP calculated without adsorption. Theseimulations also illustrate that adsorption and hydrodynamics doot generate additive dispersions when a non-linear isotherm isonsidered, and that these contributions cannot be calculated inde-endently.
Breakthrough simulations done at Usl = 1.5 cm/s in the presencef different pipe sizes are compared in Fig. 10. A three-dimensionalreakthrough simulation in an adsorption bed with the piping net-ork as presented in Fig. 6 is also reported in Fig. 10. Simulations are
arried out in the case of favourable adsorption. The figure on theeft shows that the presence of pipes of different diameters inducesifferent breakthrough time, due to their different volume fraction
nside the calculation domain. Once the first moment of each signals subtracted from the x-axis, dispersion induced by the pipes cane compared independently of the residence time differences. Dis-ersion increases with the size of the pipe, which is coherent withimulations done without adsorption.
As shown, the increase of overall adsorption HETP due to theresence of various internals inside the adsorbers can be accurately
stimated by CFD calculations. If necessary, such calculations cane extended to the prediction of the HETP inside an entire three-imensional bed of an adsorber in the presence of distributors,ipes network and support beams. The increase of HETP leads toproportional loss of productivity, which is why it is of first impor-(left), and same curves centred on their first moment �0 (right).
4 ificati
tSa2fltSmc
4
l(b
inccnat2r
itduetEunaoti
tTif
R
[
[
[
[
[
[
[
[
[
[
[
[
[
[
[
[
matography, Chromatographia 55 (7/8) (2002) 439–445.
74 F. Augier et al. / Separation and Pur
ance to quantify this effect for the process scale-up. Concerning theMB adsorption processes, depending on the size of the columnsnd the technology used, the average increase of HETP is betweenand 10% or more of the minimal adsorption HEPT when ideal plugow is assumed. If not anticipated, the increase of HETP can leado an increase of the desorbent flow rate or a yield loss. OverallMB performances can be predicted by using a one-dimensionalodel of SMB adsorption including an accurate hydrodynamics
ontribution to the axial dispersion, calculated by CFD.
. Conclusions
A numerical model was implemented in a CFD software to simu-ate the transport and the adsorption of chemical species inside 2Dor 3D) geometries. Hydrodynamics calculated by the model haveeen validated on two different experimental test cases.
The model was used with an arbitrary isotherm (but relevant forndustrial applications) in order to characterize the impact of theear-wall channelling phenomenon in small laboratory adsorptionolumns. This study has shown that hydrodynamics inside sucholumns strongly impacts the efficiency of the adsorption. This phe-omenon has then to be taken into account when such columnsre used to characterize adsorbents and for the scale-up to indus-rial scale. When adsorption isotherm is non-linear, the use of aD model including hydrodynamics and adsorption phenomena isequired, the two contributions being no longer additive.
In order to predict the performances of industrial columns,mpact of internals on the adsorption efficiency has to be charac-erized. Typical SMB adsorber internals consist of support beams,istribution plates and networks of pipes. Their impact was studiednder different hydrodynamic conditions. The results show that theffect of obstacles on the HETP depends on the thermodynamics ofhe adsorption, and cannot be accurately estimated independently.ven when the obstacles occupy a few percent of the total bed vol-me, the global adsorption efficiency is significantly impaired. Theext step of our developments will be to compare flow simulationsround obstacles with dedicated experiments, in order to validater improve the friction coefficients in the momentum equation ofhe model. This development is especially pertinent if flows involv-ng higher liquid velocities have to be investigated by the model.
The examples reported in this paper show the possible applica-ion of CFD models to the field of adsorption process development.his powerful tool is of great importance for the design of internalsnside columns, and will certainly be extensively used in the futureor the development of industrial adsorbers.
eferences
[1] J.J. Van Deemter, F.Z. Zuiderweg, A. Klinkenberg, Longitudinal diffusion andresistance to mass transfer as causes of nonideality in chromatography, Chem.Eng. Sci. 6 (1956) 271–289.
[
[
on Technology 63 (2008) 466–474
[2] D.M. Ruthven, Principles of Adsorption and Adsorption Processes, Wiley-Interscience, New York, 1984.
[3] O. Bey, G. Eigenberger, Fluid flow through catalyst filled tubes, Chem. Eng. Sci.52 (8) (1997) 1365–1376.
[4] M. Giese, M. Rottschaffer, D. Vortmeyer, Measured and modelled superfi-cial flow profiles in packed beds with liquid flow, AIChE J. 44 (2) (1998)484–490.
[5] J.J. Carberry, R.H. Bretton, Axial dispersion of mass in flow through fixed beds,AIChE J. 4 (3) (1958) 367–375.
[6] M.D. LeVan, T. Vermeulen, Channeling and bed-diameter effects in fixed bedadsorber performance, AIChE Symp. Ser. 80 (233) (1984) 34–43.
[7] B.J. Ahn, A. Zoulalian, Axial dispersion in packed beds with large wall effect,AIChE J. 32 (1) (1986) 170–174.
[8] A. Leitao, P. Carlos, S. Santos, A. Rodrigues, Tracer experiments in fixed beds:effect of flow maldistribution on the estimation of transport kinetic parameters,Chem. Eng. J. 53 (1994) 193–199.
[9] D. Vortmeyer, R.P. Winter, Impact of porosity and velocity distribution on thetheoretical prediction of fixed bed chemical reactor performance, Chem. Reac.Eng. 5 (1982) 49–61.
10] D. Vortmeyer, J. Schuster, Evaluation of steady flow profiles and circu-lar packed beds by a variational method, Chem. Eng. Sci. 38 (10) (1983)1691–1699.
11] H. Delmas, G.F. Froment, A simulation model accounting for structuralradial non-uniformities in fixed bed reactors, Chem. Eng. Sci. 43 (8) (1988)2281–2287.
12] M. Winterberg, E. Tsotsas, A. Krischke, D. Vortmeyer, A simple and coherentset of coefficients for modelling of heat and mass transport with and with-out chemical reaction in tubes filled with spheres, Chem. Eng. Sci. 55 (2000)967–979.
13] W. Kwapinski, M. Winterberg, E. Tsotsas, D. Mewes, Modelling of thewall effect in packed bed adsorption, Chem. Eng. Technol. 27 (11) (2004)1179–1186.
14] J. Tobis, D. Vortmeyer, The near-wall channelling effect in isothermal constant-pattern adsorption, Chem. Eng. Sci. 43 (6) (1988) 1363–1369.
15] K. Vafai, C.L. Tien, Boundary and inertia effects on convective mass-transfer inporous media, Int. J. Heat Mass Transfer 25 (1982) 1183–1190.
16] D.A. Nield, The limitations of the Brinkman–Forchheimer equation in modellingflow in a saturated porous medium and at an interface, Int. J. Heat Fluid Flow12 (3) (1991) 269–272.
17] K. Vafai, S.J. Kim, On the limitation of the Brinkman–Forchheimer-extendedDarcy equation, Int. J. Heat Fluid Flow 16 (1995) 11–15.
18] F. Benyahia, On the modelling of flow in packed bed systems, Part. Sci. Tech. 22(2004) 367–378.
19] E.C. Chan, L.F. Sang, M.M. Yovanovich, Numerical study of forced flow in aback-step channel through porous layer, Proceedings of NHTC’00, 34th ASMENational Heat Transfer Conference, NHTC2000-12118 (2000).
20] S. Ergun, Fluid flow through packed columns, Chem. Eng. Prog. 48 (1952)89–94.
21] Z. Zeng, R. Grigg, A criterion for non-Darcy flow in porous media, Trans. PorousMedia 63 (2006) 57–69.
22] C.O. Castillo-Araiza, F. Lopez-Isunza, Hydrodynamic models for packed bedswith low tube-to-particle Diameter ratio, Int. J. Chem. React. Eng. 6 (A1) (2008)1–14.
23] B. Guo, A. Yu, B. Wright, P. Zulli, Simulation of turbulent flow in a packed bed,Chem. Eng. Tech. 29 (5) (2006) 596–603.
24] J.M.P.Q. Delgado, A critical review of dispersion in packed beds, Heat MassTransfer J. 42 (2006) 279–310.
25] Y.X. Wu, X. Wang, C.B. Ching, Computational fluid dynamics simulation of theadsorption separation of three components in high performance liquid chro-
26] R.W. Fahien, J.M. Smith, Mass transfer in packed beds, AIChE J. 1 (1) (1955)328–337.
27] E.A. Foumeny, M.A. Chowdhury, C. McGreavy, J.A.A. Castro, Estimation ofthe dispersion coefficients in packed beds, Chem. Eng. Technol. 15 (1992)168–181.
Copyright © 2022 FDOKUMEN