Problem Formulation of the Risk Evaluation for 1,4-Dioxane ...
Upload
khangminh22Category
view
2download
0
Computational and Experimental Studies ofRedox-Active 1,4-Dithiafulvene Derivatives
byc©Sepideh Mehrani
A Dissertation submitted to the School of Graduate Studies in partial fulfillment ofthe requirements for the degree of
Ph.D.
Department of Chemistry
Memorial University of NewfoundlandAugust 2017
St. John’s Newfoundland

Abstract
1,4-Dithiafulvene (DTF) is a π-conjugated organic molecule with excellent electron-
donating properties and redox activity, which can be widely used in the application of
molecular electronics and optoelectronics. The work described in this dissertation in-
vestigates on the fundamental properties of a series of novel DTF-based molecules and
macromolecules. The first part of this thesis is focused on the studies of a bis(DTF)-
end-capped oligo(phenylene ethynylene). Both experimental characterizations (e.g.,
cyclic voltammetry, UV-Vis absorption, and Raman spectroscopy) and theoretical
density functional theory (DFT) modeling have been conducted to gain insight into
the structural, electronic and redox properties of this oligomer in the neutral and
oxidized states. Further, the self-assembling behavior of the bis(DTF)-oligomer on
the surfaces of mica and highly oriented pyrolytic graphite (HOPG) was examined by
atomic force microscopy (AFM). It has been noted that the microscopic morphologies
of the self-assemblies of bis(DTF)-endcapped oligo(phenylene ethynylene) on surfaces
show redox state dependency. In the second part of this thesis, the adsorption behav-
ior of a carboxyl-substituted DTF molecule on the surface of gold was studied. DFT
calculations were performed with the Vienna Ab Initio Simulation Package (VASP)
under periodic boundary conditions with Perdew-Burke-Ernzerhof (PBE) correlation
and the generalized gradient approximation (GGA) exchange functional. The effect
of van der Waals interactions was taken into account by the vdW-DFT (optB88-vdW)
ii

method. The DTF molecule–gold surface interactions were investigated to understand
the process of monolayer formation and associated charge transfer properties. More-
over, calculations with and without dispersion correction were performed to examine
the role van der Waals interactions play at organic-metal interfaces. Raman spec-
troscopy and Kelvin probe force microscopy (KPFM) were employed to validate the
accuracy of computed work functions. The results demonstrate that the work func-
tion of Au (111) can be tuned by depositing a thin film of redox-active DTF molecules
with differing molecular dipole moments. Finally, the mechanisms for the reduction
of HAuCl4 with DTF derivatives were investigated by time-dependent UV-Vis analy-
sis. The experimental results show that stepwise temperature control is a key factor
dictating the formation of gold nanoparticles (AuNPs). Overall, this finding points
to a promising one-phase synthetic approach for AuNPs in aqueous media.
iii

Acknowledgements
“Do not judge me by my successes. Judge me by how many times I fell down and got
back up again.” Nelson Mandela
Firstly, I would like to express my appreciation to my supervisors Prof. Erika
Merschrod and Prof. Yuming Zhao for their support, patience, and motivation. It
would not be possible to conduct this project without their advice and support.
Besides my supervisors, I would like to thank Memorial University of Newfound-
land, School of Graduate Studies for a fellowship that provided me an opportunity to
join the Memorial University’s community. Compute Canada, ACENET, and West-
Grid provided infrastructure and support for computational studies. Funding from
NSERC and CFI provided a stipend, materials and equipment.
Last but not the least, I would like to thank my family: my parents, my brother
and my husband for their continuous support in life.
iv

Table of Contents
Abstract ii
Acknowledgments iv
List of Tables xii
List of Figures xxiii
List of Abbreviations and Symbols xxiv
1 Introduction 1
1.1 Dithiafulvenes and Tetrathiafulvalenes . . . . . . . . . . . . . . . . . 1
1.2 Tetrathiafulvalene Vinylogues: Synthesis and Applications . . . . . . 3
1.2.1 TTFV-based Molecular Tweezers as Chemosensors . . . . . . 4
1.2.2 TTFV-based Redox-active Ligands . . . . . . . . . . . . . . . 6
1.3 Organic Semiconductor/Metal Interfaces . . . . . . . . . . . . . . . . 7
1.4 Gold Nanoparticles: Synthesis and Properties . . . . . . . . . . . . . 10
1.4.1 Stabilization and Controlled Growth of AuNPs . . . . . . . . . 12
1.4.2 Mechanisms of AuNP Formation . . . . . . . . . . . . . . . . 14
1.4.3 Functionalization and Application of AuNPs . . . . . . . . . . 16
1.5 Motivation and Organization of This Thesis . . . . . . . . . . . . . . 18
v

Bibliography . . . . . . . . . . . . . . . . . . . . . . . . . . . . . . . . . . 19
Co-authorship Statement 30
2 Redox-dependent Properties of DTF-endcapped π-Pligomers 31
2.1 Introduction . . . . . . . . . . . . . . . . . . . . . . . . . . . . . . . . 31
2.2 Experimental Section . . . . . . . . . . . . . . . . . . . . . . . . . . . 34
2.2.1 Computational Methods . . . . . . . . . . . . . . . . . . . . . 34
2.2.2 Experimental Characterization . . . . . . . . . . . . . . . . . . 35
2.3 Results and Discussion . . . . . . . . . . . . . . . . . . . . . . . . . . 36
2.3.1 Structural and Electronic Properties in the Neutral and Oxi-
dized States . . . . . . . . . . . . . . . . . . . . . . . . . . . . 36
2.3.2 Frontier Molecular Orbitals and Redox Properties in Solution
Phase . . . . . . . . . . . . . . . . . . . . . . . . . . . . . . . 38
2.3.3 Electrochromic Properties in Solution and in the Solid State . 42
2.3.4 Raman Analysis . . . . . . . . . . . . . . . . . . . . . . . . . . 45
2.3.5 Surface Self-assembling Properties . . . . . . . . . . . . . . . . 49
2.4 Conclusions . . . . . . . . . . . . . . . . . . . . . . . . . . . . . . . . 51
Bibliography . . . . . . . . . . . . . . . . . . . . . . . . . . . . . . . . . . 52
3 Self-Assemblies of Dithiafulvene Derivatives on an Au (111) 60
3.1 Introduction . . . . . . . . . . . . . . . . . . . . . . . . . . . . . . . . 60
3.2 Computational Methodology . . . . . . . . . . . . . . . . . . . . . . . 62
3.2.1 Modeling the Gas-Phase Properties of DTF 3a . . . . . . . . 62
3.2.2 Modeling the Adsorption Behavior of DTF 3a on an Au (111)
Surface . . . . . . . . . . . . . . . . . . . . . . . . . . . . . . . 63
3.3 Experimental Details . . . . . . . . . . . . . . . . . . . . . . . . . . . 66
3.4 Sample Preparation . . . . . . . . . . . . . . . . . . . . . . . . . . . . 67
vi

3.5 Results and Discussion . . . . . . . . . . . . . . . . . . . . . . . . . . 68
3.5.1 Crystallographic and Topographic Properties . . . . . . . . . . 68
3.5.2 Geometric and Energetic Properties of DTF 3a on a Gold Surface 70
3.5.3 Raman Evidence for Geometrical Orientation . . . . . . . . . 72
3.5.4 Work Function Modification . . . . . . . . . . . . . . . . . . . 74
3.5.5 Charge Distribution . . . . . . . . . . . . . . . . . . . . . . . 75
3.5.6 Impact of Terminal Group on Electronic Properties . . . . . . 77
3.5.7 Substituent Effect on Charge Distribution . . . . . . . . . . . 79
3.6 Summary . . . . . . . . . . . . . . . . . . . . . . . . . . . . . . . . . 82
Bibliography . . . . . . . . . . . . . . . . . . . . . . . . . . . . . . . . . . 83
4 Reduction of Au (III) into Au(0) by Dithiafulvenes in Aqueous Me-
dia 88
4.1 Background . . . . . . . . . . . . . . . . . . . . . . . . . . . . . . . . 88
4.2 Computational Methods . . . . . . . . . . . . . . . . . . . . . . . . . 89
4.3 Experimental Details . . . . . . . . . . . . . . . . . . . . . . . . . . . 90
4.4 Functionalized AuNPs Nucleation and Growth . . . . . . . . . . . . . 91
4.4.1 UV-Vis Analysis of Functionalized AuNPs . . . . . . . . . . . 95
4.4.2 Raman Analysis of Functionalized AuNPs . . . . . . . . . . . 98
4.5 Time-dependent UV-Vis Spectral Analysis . . . . . . . . . . . . . . . 101
4.6 Effective Parameters on Reaction . . . . . . . . . . . . . . . . . . . . 106
4.6.1 Effects of Solvents Polarity . . . . . . . . . . . . . . . . . . . . 107
4.7 Computational Analysis of 4a-Aun Complex . . . . . . . . . . . . . . 108
4.8 Summary . . . . . . . . . . . . . . . . . . . . . . . . . . . . . . . . . 111
Bibliography . . . . . . . . . . . . . . . . . . . . . . . . . . . . . . . . . . 112
vii

5 Conclusions and Future Work 116
Bibliography . . . . . . . . . . . . . . . . . . . . . . . . . . . . . . . . . . 118
A Redox-dependent Properties of DTF-endcapped π-Oligomers 120
A.1 Electronic Transition and Molecular Orbital Properties . . . . . . . . 120
A.2 Descriptions of Raman-Active Vibrational Modes . . . . . . . . . . . 124
A.3 Raman Spectra of the Oxidized Film of 2a After Two Weeks . . . . . 128
A.4 Coordinates of Optimized Geometries and Energies . . . . . . . . . . 128
B Redox-dependent Properties of DTF-endcapped π-Oligomers 134
B.1 NLO Properties . . . . . . . . . . . . . . . . . . . . . . . . . . . . . . 134
B.2 Phenol Detection . . . . . . . . . . . . . . . . . . . . . . . . . . . . . 135
B.3 UV-Vis Spectra of DTF and HAuCl4 . . . . . . . . . . . . . . . . . . 137
C SAM formation of Dithiafulvene Derivatives on Au(111): Orienta-
tional Geometry, Binding Energies and Work Function 139
C.1 Geometry Optimization and Electronic Property Calculations . . . . 139
C.2 Molecular Work Function . . . . . . . . . . . . . . . . . . . . . . . . . 140
C.3 Polarizability . . . . . . . . . . . . . . . . . . . . . . . . . . . . . . . 142
C.4 Raman Spectra of Gold Substrate . . . . . . . . . . . . . . . . . . . . 142
D Vienna Ab-initio Simulation Package (VASP) 144
D.1 Introduction . . . . . . . . . . . . . . . . . . . . . . . . . . . . . . . . 144
D.2 Pseudopotentials and PAW . . . . . . . . . . . . . . . . . . . . . . . . 144
D.3 Periodic boundary condition . . . . . . . . . . . . . . . . . . . . . . . 145
D.4 Reciprocal space and k-points . . . . . . . . . . . . . . . . . . . . . . 146
Bibliography . . . . . . . . . . . . . . . . . . . . . . . . . . . . . . . . . . 146
viii

E One phase reduction mechanism of Au (III) by dithiafulvene building
blocks in aqueous media 149
E.1 Simulated and experimental IR spectra . . . . . . . . . . . . . . . . . 149
E.2 Raman spectra of 3a . . . . . . . . . . . . . . . . . . . . . . . . . . . 149
E.3 calculated oxidation potential of gold . . . . . . . . . . . . . . . . . . 150
E.4 UV-Vis investigations of redox reaction . . . . . . . . . . . . . . . . . 152
E.4.1 UV-Vis spectra of 4a before peak deconvolution . . . . . . . . 152
E.4.2 Time dependant UV-Vis measurements . . . . . . . . . . . . . 152
E.4.3 UV-Vis peaks assignments . . . . . . . . . . . . . . . . . . . . 153
E.5 Substituent effect on electronic levels . . . . . . . . . . . . . . . . . . 154
E.6 Substituent effect on structural properties . . . . . . . . . . . . . . . 157
ix

List of Tables
3.1 Adsorption energies (EB), work function of the Au (111) with deposited
DTF on top (ΦDT F−Au) and the magnitude of drop in the work func-
tion of the Au (111) by deposition of DTF (ΦAu − ΦDT F−Au) with six
different substituents (all values are reported in eV). The electric dipole
moments (µtot) of the single molecule in the gas phase are investigated
with B3LYP/6-31++G(d,p) level of theory. . . . . . . . . . . . . . . . 77
4.1 Calculated oxidation potential of 3a and 4a in different solvents with
B3PW91/6-31+G(D,P) level of theory and basis set (all values are
reported in Volts). . . . . . . . . . . . . . . . . . . . . . . . . . . . . 109
A.1 Assignments of electronic transitions of 2b in the neutral state. . . . 121
A.2 Assignments of electronic transitions of 2b in the radical cation state. 121
A.3 Assignments of electronic transitions of 2b in the dication triplet state. 122
A.4 Assignments of electronic transitions of 2b the dication singlet state. 122
A.5 Frontier molecular orbital energies of 2b in various oxidation states. . 122
A.6 Raman active vibrational modes for 2b in the neutral state. . . . . . 125
A.7 Raman active vibrational modes for 2b in the radical cation state. . . 125
A.8 Raman active vibrational modes for 2b in the dication triplet state. . 126
A.9 Raman active vibrational modes for 2b in the dication singlet state. . 127
x

B.1 The electric dipole moment (µ,D), polarizability (α), first hyperpolar-
izability (β), and second hyperpolarizability (γ) of investigated com-
pounds at B3LYP/6-31++G(d,p) level. . . . . . . . . . . . . . . . . . 136
C.1 Calculated binding energies (EB), Fermi energies (εF ) and work-function
(ϕ) of the DTF 3a at eighteen different orientations on the surface of
Au(111) with (without) dispersion correction. All values are reported
in eV. B stands for the benzene plane and "S" stands for the dithiol plane.141
C.2 Table shows the Au−S1 and Au−SC2 distances (d) in Å along with the
C4−C5 and C3−S1 dihedral angle change between plane of bonds (∆Φ)
by deposition on the A (111) . . . . . . . . . . . . . . . . . . . . . . . 141
C.3 Molecular work function ϕ of the DTF derivatives in the unit cell with
(without) dispersion correction. All values are reported in eV. . . . . 142
C.4 The electric dipole moment (µ,D), polarizability (α), first hyperpolariz-
ability (β), and second hyperpolarizability (γ) of DTF derivatives with
different substitutes at para position of benzene ring with B3PW91/6-
31+G(d,p) level of theory. . . . . . . . . . . . . . . . . . . . . . . . . 143
E.1 The calculated oxidation potential of gold(I) to gold(0) in different
solvents with b3pw91/6-31+g(d,p) level of theory and basis set (all
values are reported in Volts). . . . . . . . . . . . . . . . . . . . . . . . 151
E.2 Assignments of electronic transitions of 4a in the neutral state. . . . 153
E.3 Assignments of electronic transitions of 4a in the radical cation state. 154
E.4 The total energies in eV for the compound in Figure 4.1 with different
R substituents and at three positions of ortho, meta, and para on the
benzene ring. . . . . . . . . . . . . . . . . . . . . . . . . . . . . . . . 155
xi
E.5 Fermi energies in eV for the compound in Figure 4.1 with different R
substituents and at three positions of ortho, meta, and para on the
benzene ring. . . . . . . . . . . . . . . . . . . . . . . . . . . . . . . . 155
E.6 HOMO, LUMO, band gap energies of the ortho, meta, and para at
neutral state obtained with b3pw91/6-31+g(d,p) level of theory and
basis set. . . . . . . . . . . . . . . . . . . . . . . . . . . . . . . . . . . 156
E.7 HOMO, LUMO, band gap energies of the ortho, meta, and para at
neutral state obtained with b3pw91/6-31+g(d,p) level of theory and
basis set. . . . . . . . . . . . . . . . . . . . . . . . . . . . . . . . . . . 156
E.8 C1−C2−C3−S1 dihedral angles before and after oxidation for the com-
pound with different Substituents at three positions of ortho, meta,
and para. . . . . . . . . . . . . . . . . . . . . . . . . . . . . . . . . . 157
xii

List of Figures
1.1 Redox processes taking place on DTF and TTF. . . . . . . . . . . . . 2
1.2 Oxidative dimerization reaction of DTF. . . . . . . . . . . . . . . . . 4
1.3 Binding of TTFV-phenylboronic acid molecular tweezer 1 to a saccha-
ride molecule in water. . . . . . . . . . . . . . . . . . . . . . . . . . . 5
1.4 Redox-active Mo-TTFV complex 2 and Zn-TTFV complex 3. . . . . 7
1.5 Schematic illustration of an OFET. . . . . . . . . . . . . . . . . . . . 7
1.6 (a) The electrostatic stabilization of neighboring metal particles that
are approaching together until the surface to surface distance becomes
larger than the particle’s double layer. (b) The potential energy as a
function of the surface to surface distance is plotted, which exhibits
the dominance of repulsion forces before the maximum total potential.
The total potential tends to a stronger van der Waals force by further
decreasing the distance by agglomeration. The dashed green line rep-
resent the total potential as the sum of repulsive and attractive forces.
(c) Schematic of steric stabilization of nanoparticles by coating with
the layer of anchoring polymer. (d) The neighboring particles experi-
ence strong repulsive forces when particles are closer than the anchored
layer. . . . . . . . . . . . . . . . . . . . . . . . . . . . . . . . . . . . . 12
2.1 General redox reactivity of a DTF-substituted arene. . . . . . . . . . 32
xiii

2.2 Structures of bis(DTF)-endcapped oligo(phenylene ethynylene)s 2. . . 33
2.3 Optimized geometry of 2b at the B3LYP/6-31++G(d,p) level and
adopted labeling scheme in this study. . . . . . . . . . . . . . . . . . 36
2.4 (A) Comparison of averaged C=C and C≡C bond lengths of compound
2b in neutral (Neu), radical cation (RC), singlet dication (DC(S)), and
triplet dication (DC(T)) states. (B) A resonance scheme for the radical
cation of 2b. (C) Calculated spin density map for the radical cation
of 2b. (D) Calculated spin density map for the triplet dication of 2b.
The high and low unpaired electron density areas are highlighted by
blue and green colours respectively. . . . . . . . . . . . . . . . . . . . 37
2.5 Contour maps of frontier MOs for compound 2b (isovalue = 0.02 a.u.)
and their eigenvalues calculated at the B3LYP/6-31++G(d,p) level. . 39
2.6 Square scheme of stepwise oxidation of 2b to radical cation and dica-
tion. Gibbs free energies (∆G) are indicated in the unit of kJ mol−1. 40
2.7 (A) CV and (B) DPV profiles of 2a (1.33 ×10⁻³ M) measured in
CH2Cl2 at room temperature with Bu4NBF4 (0.1 M) as the support-
ing electrolyte, glassy carbon as the working electrode, Pt wire as the
counter electrode, Ag/AgCl as the reference electrode. CV conditions:
scan rate = 50 mV s−1. DPV conditions: scan rate = 20 mV s−1, pulse
width = 20 mV, pulse period = 200 ms, pulse amplitude = 50 mV, and
step = 4 mV. . . . . . . . . . . . . . . . . . . . . . . . . . . . . . . . 41
2.8 NPA charge distribution for compound 2b in the neutral (Neu), radical
cation (RC), and triplet dication (DC(T)) sates. The values indicated
are accumulated NPA charges for the atoms in each shaded area. . . . 42
xiv

2.9 (A) Normalized UV-Vis absorption spectrum of 2ameasured in CH2Cl2
at room temperature. (B) UV-Vis absorption spectrum of the thin film
of 2a cast on a quartz slide. (C) UV-Vis absorption spectrum of the
thin film of 2a measured after exposure to iodine vapour for 30 min.
(D) Calculated UV-Vis absorption spectrum (normalized) of 2b. (E)
Calculated UV-Vis absorption spectrum (normalized) of the radical
cation of 2b. (F) Calculated UV-Vis absorption spectra (normalized)
of the dications of 2b in the singlet and triplet states. . . . . . . . . . 44
2.10 Raman spectroscopic analysis monitoring the thin film of 2a upon ex-
posure to iodine vapour at various time periods. The baselines of the
spectra were corrected using the Fityk software (free version 0.9.8) [53]. 45
2.11 Raman spectra of compound 2b in different oxidation states calculated
at the B3LYP/6-31++G(d,p) level of theory. . . . . . . . . . . . . . . 46
2.12 Selected Raman-active vibrational eigenvectors for compound 2b at
different oxidation states calculated at the B3LYP/6-31++G(d,p) level. 47
2.13 Comparison of (A) the Raman spectrum for the thin film of 2a upon
exposure to iodine vapour for 10 min and (B) the simulated Raman
spectrum for a mixture of 2b in neutral, radical cation, and triplet
dication states at a 10:1:1 molar ratio. . . . . . . . . . . . . . . . . . 48
2.14 AFM images of compound 2b (A) on freshly cleaved mica surface, (B)
on mica after oxidation with iodine for 30 min, (C) on freshly cleaved
HOPG, and (D) on HOPG after oxidation with iodine for 30 min. . . 50
3.1 (A) Molecular structure of carboxylated DTF 3a, and (B)−(E) four
possible modes by which 3a can be bound to a metal surface. . . . . 63
xv

3.2 (A) and (B) Optimized structure of DTF 3a, which represents a dihe-
dral angle of 1.47 degrees between the planes of C4-C5 and C3-S1. (C)
Representation of the highest occupied and lowest unoccupied molec-
ular orbitals of DTF 3a . . . . . . . . . . . . . . . . . . . . . . . . . 64
3.3 Total and projected density of states of (left) the bulk (right) and the
Au (111). Total DOS of bulk closely matches the local DOS of the
third layer of the slab. The numbering of the layers in the slab starts
from the closest slab to the adsorbent. . . . . . . . . . . . . . . . . . 66
3.4 XRD patterns of the gold substrate prepared experimentally. . . . . . 68
3.5 AFM topography of (A) the bare gold substrate, (B) the gold substrate
with a thin film of DTF 3a deposited on top of it, and (C) the thin
film of DTF 3a deposited on a glass slide. . . . . . . . . . . . . . . . 69
3.6 Optimized structure of DTF 3a deposited on the surface of the Au
(111). (A) and (B) show the face-on orientation at two different side
views, (C) and (D) show two views of the edge-on orientation with a
42.8◦ angle between the plane of the benzene ring and the surface of
the slab. . . . . . . . . . . . . . . . . . . . . . . . . . . . . . . . . . . 71
3.7 (A) Simulated Raman spectraum of DTF 3a in the gas phase obtained
by B3PW91/6-31+G(d,p) level of theory. (B) Raman spectrum of the
pure compound in the solid state. (C−F) Raman spectrum of the
DTF 3a on the surface of 15 nm Au (111) at different concentrations,
starting from the lowest concentration on the bottom. . . . . . . . . . 73
3.8 Vibrational modes of calculated peaks at 498, 519, 1453 cm−1. . . . . 74
xvi

3.9 Iso-surfaces of difference charge distributions over adsorbent and sur-
face at the top and side view with and without considering vdW in-
teractions. The negative area (green) shows the gaining of electrons,
and the positive area (yellow) indicates the production of holes. The
plot of charge distribution versus distance in the z-axis can be seen on
the right side of each type of calculation which is aligned with the side
view of the iso-surfaces. . . . . . . . . . . . . . . . . . . . . . . . . . . 76
3.10 Iso-surfaces of difference charge distribution over adsorbent and surface
at top and side views with considering vdW interactions for (A) CHO
(B) CN (C) NH2 (D) NO2 (E) OCH3 substituents. The negative area
(green) associated with gaining electrons and the positive area (yellow)
indicates the production of holes. The plot of charge distribution versus
distance in the z-axis can be seen on the right side of each type of
calculations which is aligned with the side view of the iso-surfaces. . . 80
3.11 Iso-surfaces of difference charge distribution over adsorbent and surface
at top and side views without considering vdW interactions for (A)
CHO (B) CN (C) NH2 (D) NO2 (E) OCH3 substituents. Negative
area (green) shows the gaining of electrons and positive area (yellow)
indicate the production of holes. The plot of charge distribution versus
distance in the z-axis can be seen on the right side of each type of
calculations which is aligned with the side view of the iso-surfaces. . . 81
xvii

4.1 The structure of the DTF oligomer with R substituent at the para
position of the benzene ring (yellow color represents sulfur atom). Two
different substituents of carboxyl (DTF 3a) and carboxymethyl (DTF
4a) were used for future comparison studies. Dimerization occurs under
oxidative condition by losing hydrogen through a bridging carbon atom
between the five-membered ring and the benzene (Chapter 2 (Figure 2.1)). 91
4.2 Left) The solution of 4a in methanol before (vial number one with
yellow color) and after (vial number two with orange color) mixing
it with the HAuCl4 and sonication for an hour. Right) The UV-Vis
spectra of solution number one and two as labeled. AuNPs peak at
peak at 525 nm appeared after addition of the HAuCl4. . . . . . . . 92
4.3 SEM images of the AuNPs that are freshly prepared through redox
reaction of 3a and gold acid.The film of solution on the glass slide was
then coated with a layer of carbon for imaging. . . . . . . . . . . . . 93
4.4 AFM height image of the deposited AuNPs on freshly cleaved mica at
two scan areas. Left) the AFM image of the surface at 10×10 nm scan
area. Right) The focused AFM image of the flower shape feature in
5×5 nm scan area. . . . . . . . . . . . . . . . . . . . . . . . . . . . . 93
4.5 (A) The solution of 3a in acetone and a trace of water (yellow solution).
The color of the solution turns green by addition of preheated HAuCl4
to 40 ◦C and gradually turns orange by heating and stirring. (B) The
solution of 4a in acetone and a trace of water (yellow solution). The
color of the solution turns blue by addition of preheated HAuCl4 to 40◦C and gradually turns orange by heating and stirring. . . . . . . . . 95
xviii

4.6 (Top) UV-Vis spectrum of 4a; the peak at 420 nm refers to the max-
imum absorption of 4a in neutral form, which is shown in simulated
UV-Vis spectrum of 4a in neutral form (Figure 4.7 (A)). (Middle)
UV-Vis spectrum of 4a after half an hour addition of HAuCl4 and
sonication; the peak at 524 nm corresponds to the AuNPs absorbance.
(Bottom) UV-Vis spectrum of 4a after twenty four hours following ad-
dition of the HAuCl4; the AuNPs corresponding peak is shifted to the
higher wavelengths at 547 nm with relatively higher absorbance. . . . 96
4.7 (A) and (C) are simulated UV-Vis spectra of 4a in neutral and oxidized
forms, which are obtained with time-dependent B3PW91/6-311G(d,p)
level of theory and basis set and 40 number of states. Simulated UV-Vis
spectrum indicate that there is no band between 500−600 nm before,
and after oxidation of 4a. Therefore the band at 524 nm right after
addition of HAuCl4 refers to the AuNPs absorbance, which shifts for 23
nm to the higher wavelength after twenty-four hours (Figure 4.6). (B)
and (D) are simulated UV-Vis spectra of dimerized 4a in neutral and
oxidized forms, which are computed with time-dependent B3PW91/6-
31+G(D,P) level of theory and basis set and the number of states is
40. . . . . . . . . . . . . . . . . . . . . . . . . . . . . . . . . . . . . . 97
4.8 (A) and (D) The experimental Raman spectra of 3a in methanol be-
fore and after addition of HAuCl4, respectively. Red spectrum (D) is
taken from the solution of 3a after twenty-four hours of mixing it with
HAuCl4 in which the color was turned orange. (B) and (E) Simulated
Raman spectra of dimerized 3a in neutral and oxidized states, respec-
tively. (C) and (F) Simulated Raman spectra of 3a in neutral and
oxidized states, respectively. . . . . . . . . . . . . . . . . . . . . . . . 99
xix

4.9 (A) The experimental Raman spectrum of 4a in methanol. (B) Sim-
ulated Raman spectra of dimerized 4a in neutral form. (C) Simulated
Raman spectrum of 4a in neutral form at B3PW91/6-31+G(G,P) level
of theory and basis set. C=O bond stretching band appears in both
computed and experimental spectrum of 4a and dimerized 4a at 1800
and 1620 cm−1, respectively. All simulations performed at B3PW91/6-
31+G(D,P) level of theory and basis set. . . . . . . . . . . . . . . . . 100
4.10 Vibrational modes of three enhanced peaks at 1289 and 1612, 1726
cm−1 observed in the Raman spectra of 3a computed with B3PW91/6-
31+G(D,P) level of theory and basis set. . . . . . . . . . . . . . . . . 101
4.11 Left) Experimental time-dependent UV-Vis spectra of 4a in acetone
and a trace of water before and after addition of the pre-warmed
HAuCl4 at different time intervals. Red spectra are taken after warming
the solution that was left in the closed cap vial overnight. Right) Peak
intensity versus time are plotted for major peaks that are indicated in
UV-Vis spectra. . . . . . . . . . . . . . . . . . . . . . . . . . . . . . . 103
4.12 (Left) Experimental UV-Vis spectra of 3a in acetone and a trace of
water before and after addition of the pre-warmed HAuCl4 to 40 ◦C
throughout 32 hours. (Right) Peak intensity versus time is plotted for
the assigned peaks. . . . . . . . . . . . . . . . . . . . . . . . . . . . . 105
4.13 Optimized structure of 4a and a group of gold atoms (n= 1,3). . . . 110
4.14 Mülliken charge distribution over 4a-Au3 after oxidation. Red regions
represent a higher concentration of electron density while green shows
less electron density. . . . . . . . . . . . . . . . . . . . . . . . . . . . 111
A.1 Contours of frontier MOs for compound 2b in the radical cation state
and their eigenvalues calculated at the B3LYP/6-31++G (d,p) level. . 123
xx

A.2 Contours of frontier MOs for compound 2b in the triplet dication state
and their eigenvalues calculated at the B3LYP/6-31++G (d,p) level. . 123
A.3 Contours of frontier MOs for compound 2b in the singlet dication state
and their eigenvalues calculated at the B3LYP/6-31++G (d,p) level. . 124
A.4 Raman active vibrational vectors for compound 2b in the neutral state
calculated at the B3LYP/6-31++G(d,p) level. . . . . . . . . . . . . . 125
A.5 Raman active vibrational vectors for compound 2b in the radical cation
state calculated at the B3LYP/6-31++G(d,p) level. . . . . . . . . . . 126
A.6 Raman active vibrational vectors for compound 2b in the dication
triplet state calculated at the B3LYP/6-31++G(d,p) level. . . . . . . 127
A.7 Raman active vibrational vectors for compound 2b in the dication sin-
glet state calculated at the B3LYP/6-31++G(d,p) level. . . . . . . . 128
A.8 Raman spectra of the solid thin film of 2a on a glass substrate measured
(A) before exposure to iodine vapour, (B) after exposure to iodine
vapour for 65 min, and (C) after being left in open air for two weeks. 129
A.9 Cartesian coordinates of compound 2b in the neutral state (sum of
electronic and thermal Energies = −2746.293943 Hartree, zero-point
correction = 0.377252 Hartree) . . . . . . . . . . . . . . . . . . . . . 130
A.10 Cartesian coordinates of compound 2b in the radical cation state (Sum
of electronic and thermal Energies = −2746.077723 Hartree, zero-point
correction = 0.378033 Hartree) . . . . . . . . . . . . . . . . . . . . . 131
A.11 Cartesian coordinates of compound 2b in the dication singlet state
(sum of electronic and thermal Energies = −2745.773027 Hartree, zero-
point correction = 0.378722 Hartree) . . . . . . . . . . . . . . . . . . 132
xxi

A.12 Cartesian coordinates of compound 2b in the dication triplet state (sum
of electronic and thermal Energies = −2745.779398 Hartree, zero-point
correction = 0.378547 Hartree) . . . . . . . . . . . . . . . . . . . . . 133
B.1 UV-Vis spectra of (orange) glass slide that are coated with gold layer
(yellow) coated glass slide with gold that was then immersed in the
solution of DTF, that is dissolved in toluene, for two hours (blue) the
prepared surface that was immersed in the phenol solution with con-
centration of 500 ppm for two hours. . . . . . . . . . . . . . . . . . . 137
B.2 Raman spectra of (a) glass slide that is coated with gold layer and then
immersed in the solution of DTF, that is dissolved in toluene, for two
hours (b) glass slide that is coated with gold layer and then immersed in
the solution of DTF, that is dissolved in toluene, for twenty-two hours
(c) the prepared surface that was immersed in the phenol solution with
concentration of 500 ppm for two hours. . . . . . . . . . . . . . . . . 138
B.3 UV-Vis spectra of . . . . . . . . . . . . . . . . . . . . . . . . . . . . . 138
C.1 Energy variation by increasing the cell lengths in (x, y,z) directions
with (A) and without (B) dispersion correction. The numbers that are
shown on the x-axis stand for (15,8,8), (20,15,15), (24,17,17), (25,20,20),
(25,25,25) and (30,25,25) dimensions , respectively. All total energies
have been obtained by 5×5×1 number of k-points. . . . . . . . . . . . 140
C.2 Raman spectra of the prepared gold substrate. . . . . . . . . . . . . . 142
D.1 A sample INCAR file that was used for optimization and work-function
calculations in this work. . . . . . . . . . . . . . . . . . . . . . . . . . 147
xxii

E.1 IR spectra of (A) dimerized 3a powder, (B) residual particles of mixed
dimerized 3a and gold acid solutions.(C) and (D) Calculated IR spectra
of dimerized 3a in neutral and oxidized forms in order. . . . . . . . . 150
E.2 (A) Experimental Raman spectra of 4a in methanol. (B) Simulated
Raman spectra of dimerized 4a. (C) Simulated Raman spectra of 4a
in neutral states. . . . . . . . . . . . . . . . . . . . . . . . . . . . . . 151
E.3 UV-Vis spectra of 4a in acetone (yellow graph), after addition of
HAuCl4 for half an hour (Orange graph) and after twenty four hours
(red graph). . . . . . . . . . . . . . . . . . . . . . . . . . . . . . . . . 152
E.4 Time-dependent UV-Vis spectra of 3 samples of 3a in acetone and
trace of water at different concentrations. . . . . . . . . . . . . . . . . 153
E.5 The structure of dithiafulvenyl with R substituent at the para position
of the benzene ring. . . . . . . . . . . . . . . . . . . . . . . . . . . . . 157
xxiii
List of Abbreviations and Symbols
AFM Atomic Force Microscopy
AuNPs Gold NanoParticles
CPD Contact Potential Difference
CV Cyclic Voltmmetric
DFT Density Functional Theory
DOS Density of State
DTF Dithiafulvene
DLS Dynamic Light Scattering
E Energy
FCC Face-Centered Cubic
FET Field-Effect Transistors
GGA Generalized Gradient Approximation
HOPG Highly Ordered Pyrolytic Graphite
ITO Indium Tin Oxide
KPFM Kelvin Probe Force Microscopy
MOFs Metal Organic Frameworks
OFET Organic Field-Effect Transistors
OLED Organic Light-Emitting Diodes
PV Photovoltaic
xxiv

PAW Projected Augmented Wave
SAM Self Assembled Monolayer
SEM Scanning Electron Microscopy
SERS Surface Enhanced Raman Scattering
TEM Transmission Electron Microscopy
TTFV Tetrathiafulvalene Vinylogue
UV-Vis Ultra Violet-Visible spectroscopy
Evac Vacuum Potential
vdW Van der Waals Interactions
XPS X-ray Photoelectron
ρ Charge Density
µ Electric Dipole Moment
εF Fermi Energy
Φ Work Function
xxv

Chapter 1
Introduction
1.1 Dithiafulvenes and Tetrathiafulvalenes
The design of new organic electronic devices requires systematic investigations into
the relationships between π-conjugated organic molecular structures and solid-state
properties. In this context, an intriguing class of sulfur-containing heterocyclic com-
pounds, namely 1,4-dithiafulvene (DTF) and tetrathiafulvalene (TTF), have captured
considerable attention ever since the discovery of the first TTF-based organic conduc-
tor by Wudl and co-workers in 1972 [1]. DTF and TTF derivatives are excellent or-
ganic π-electron donors. As shown in Figure 1.1, each of the DTF and TTF molecules
contains five-membered 1,3-dithiole ring(s), which is non-aromatic according to the
Hückel’s rule. By oxidation, these molecules can be converted into relatively stable
radical cation and dication, in which the dithiole ring becomes an aromatic π-sextet
after releasing an electron [2]. The gaining of aromaticity thus leads to lowered oxida-
tion potential(s) for DTF and TTF molecules. Moreover, most of the redox reactions
taking place on DTF and TTF moieties are reversible. For these reasons, DTF and
TTF have been extensively used as functional molecular building blocks in a wide
1

range of advanced organic electronic materials.
Figure 1.1: Redox processes taking place on DTF and TTF.
Enormous research efforts have been dedicated to the synthesis and characteriza-
tion of DTF and TTF related molecules and macromolecules for several decades [2].
The unique reversible redox activities, switchable conformation and charge transfer
properties of DTF and TTF systems have attracted extensive research activities focus-
ing on the design and synthesis of the new DTF and TTF derivatives [3,4]. Recently,
DTF and TTF derivatives have found promising applications in electronic devices,
such as batteries, field effect transistors (FETs), and molecular junctions [5–7]. Fur-
thermore, TTFs can be used to prepare switchable self-assembled structures on the
surfaces of gold nanoparticles (AuNPs) with their optoelectronic properties well con-
trolled by external inputs [8].
It has been demonstrated that modifications of the structures of DTF and TTF
derivatives through advanced organic synthesis provide an effective approach for
bottom-up control over a wide range of molecular and supramolecular properties [9].
Some changes in the molecular structures of DTF and TTF derivatives, such as ex-
tending π-conjugation paths and adding electron-donating/accepting substituents,
2

can lead to dramatically altered electronic, photonic, electrochemical, and solid-state
packing properties. In this vein, the most commonly adopted strategy for tuning
the electronic and redox characteristics of DTF and TTF molecules is to link various
substitutes directly to their core π-structures [10,11].
In material and device applications, solid-state packing is a critically important
parameter in addition to the structural and electronic properties of discrete molecules.
In particular, the optoelectronic performances of organic π-conjugated materials in the
solid state are significantly affected by the degree of π-conjugation of the molecules as
well as their intermolecular interactions [12,13]. The stacking nature of organic semi-
conductors has been known to play a key role tuning their band gap energies [14,15].
Modifications of DTF and TTF structures to gain elongated π-conjugated molecular
backbones offer an effective way to enhance intermolecular π-stacking. In this respect,
π-extended DTF and TTF oligo-/polymers have been actively investigated and ap-
plied in novel optoelectronic devices, such as molecular sensors, semiconductors, and
nonlinear optics [10].
1.2 Tetrathiafulvalene Vinylogues: Synthesis and
Applications
An intriguing reactivity of DTF molecules is that they can undergo a facile oxida-
tive dimerization reaction to yield a class of π-extended TTF analogues, namely
tetrathiafulvalene vinylogues (TTFVs). Figure 1.2 illustrates the mechanistic details
of this dimerization reaction. Aryl-substituted DTF molecules are particularly reac-
tive through this pathway. TTFVs refer to the class of TTF analogues in which the
two dithiole rings are connected through conjugated vinyl bridges. Aryl-substituted
TTFVs have been extensively investigated by the Zhao group [2] and others over the
3

past ten years. This class of compounds has shown much better redox activity relative
to that of simple TTF due to increased π-conjugation in their structures. Moreover,
TTFV compounds can dramatically change their conformations at different redox
states, making them interesting redox-controlled molecular switches.
Figure 1.2: Oxidative dimerization reaction of DTF.
The advantageous redox and conformational properties of TTFVs have found ex-
tensive applications in optoelectronic devices recently. The most promising properties
are driven from their redox versatility and structural switchability, which have led to
the design of a large variety of redox-active molecules [16,17], chemical sensors [18–20],
supermolecular hosts for fullerenes and single-walled carbon nanotubes [21,22]. In ad-
dition, some challenging macromolecular structures, including shape-persistent macro-
cylces and π-conjugated polymers, have been successfully synthesized recently by the
Zhao group using TTFV as the essential building component [23, 24]. The following
section highlights some recent applications of TTFVs in materials chemistry.
1.2.1 TTFV-based Molecular Tweezers as Chemosensors
Aryl-substituted TTFVs usually take a tweezer-like conformation in the neutral state,
in which the two dithiole rings are in a pseudo-cis orientation. The unique molecular
conformations have allowed a series of molecular tweezers to be constructed using
TTFV as the central unit. The arene ends of these TTFV tweezers can be read-
4

ily functionalized with receptor groups for selectively binding with various chemical
species. The versatility of these molecular tweezers offers a useful platform for the
design of advanced chemical and biological sensors. For example, Figure 1.3 shows
a phenylboronic acid functionalized TTFV tweezer 1, which was synthesized by the
Zhao group in 2013. Phenylboronic acid is a well-known saccharide receptor, due
to its ability to selectively bind with diols and polyols in aqueous media. Herein,
the attachment of two boronic acid groups in compound 1 enables strong binding
with monosaccharides under physiological conditions (aqueous, pH 7.4). The binding
event changes the oxidation potential of the central TTFV unit, which can be easily
detected by electrochemical analysis (e.g., differential pulse voltammetry). As such,
compound 1 functions as a redox chemosensor for monosaccharides. Through the
same design concept, TTFV tweezers functionalized with other receptor groups have
also been prepared by the Zhao group to show sensing functions for fluoride ion, metal
cations, and fullerenes.
Figure 1.3: Binding of TTFV-phenylboronic acid molecular tweezer 1 to a saccharidemolecule in water. Reprinted with permission from Ref. [18]. Copyright [2017], withpermission from Elsevier.
5

1.2.2 TTFV-based Redox-active Ligands
Rigid π-conjugated systems with pyrdinyl and carboxyl groups exhibit strong ability
to coordinate with transition metal ions. Through such metal-ligand interactions, a
huge number of metal/organic hybrid materials have been developed. In recent years,
the assembly of micro/mesoporous metal organic frameworks (MOFs) has become
a hot research topic, owing to the remarkable structural and surface properties of
MOFs and their fascinating applications in energy storage, catalysis, and chemical
sensing [25].
Redox-active ligands for metal ions have been regarded as very useful building
blocks for the design and fabrication of novel organic-metal nanomaterials. In the lit-
erature, TTF-based ligands have been often used to complex with various metal ions,
bringing redox-activity to the metal-organic hybrid systems. The use of TTFVs in
this field has not yet been well developed. In 2010 Lorcy’s group reported the TTFV-
based redox-active metal-organic complex 2 (see Figure 1.4) [16]. In the structure
of 2, two TTF molecules with pyridyl substituents are coordinated with Mo(CO)6
to form a cyclic complex. Single crystal X-ray diffraction analysis reveals a square-
shaped cluster in which the TTFV moieties adopt a cis-like molecular shape. In a
sense, the TTFV unit presents a pre-organized building block facilitating the assem-
bly of cyclic complexes with Mo ions. Another TTFV-based redox-active ligand was
recently reported by Wang and Zhao (see compound 3 in Figure 1.4). The TTFV
molecule was designed with two carboxyl end groups, through which coordination
with Zn(II) ions was achieved, resulting in redox-active TTFV-Zn polymers.
6

Figure 1.4: Redox-active Mo-TTFV complex 2 and Zn-TTFV complex 3. Reprintedwith permission from Ref. [16,26]. Copyright [2017], with permission from AmericanChemical Society and Beilstein Journal of Organic Chemistry.
1.3 Organic Semiconductor/Metal Interfaces
The knowledge of the interactions between organic molecules and metal surfaces and
their electronic structures is of fundamental importance for the functions of organic
electronic devices. Depending on the functions, organic electronic devices can be of
different types, such as organic light-emitting diodes (OLEs), field-effect transistors
(FETs), and photovoltaic (PV) cells. Most of these devices are constructed in a typical
layout, where a thin film of an organic semiconductor is used as active material for
rectification and illumination (OLEDs), current modulation (OFETs), or solar energy
conversion (PV cells). Figure 1.5 illustrates the architecture of an OFET. Compared
to their inorganic counterparts, organic semiconductors show some advantages; for
example, they have very good processability in solution and their properties can be
easily tailored through rational chemical synthesis.
Figure 1.5: Schematic illustration of an OFET.
7

The self-organization of a single layer of organic molecules on the surface of a
well-ordered metal substrate can significantly alter surface properties. For instance,
strong charge transfer to the metal is caused by chemisorption of organic structures,
which are referred to as the self-assembled monolayers (SAMs). The electronic inter-
actions between the orbital of molecules and the substrate play a key role in tuning
the electronic properties at the interface. Simulations of single-molecule adsorption
on the metal surface can tell whether the organic-metal interactions are either due
to weak van der Waals attraction or strong chemical bonding. On the other hand,
organic molecules with π-conjugated structures have been found to be show compli-
cated adsorption behaviour on metal surfaces, with both van der Waals interaction
and static polarization involved.
An important issue about the organic/metal interface is the energy level alignment,
which can be described by two models, namely Schottky-Mott limit and Fermi-level
pinning. In the first model, the molecular energy levels are determined by the metal
work function, while in the second model, the molecular energy levels are defined rel-
ative to the Fermi energy of metal in which charge transfer occurs between adsorbent
and substrate. Neither of these models can explain the complicated adsorptions such
as the organic/metal interfaces that are involved in the chemisorption, charge transfer,
dipole induced at the interface and geometry change induced by adsorption. It is also
worth noting that the weak interactions between organic molecules and metal sub-
strates should be considered in order to describe the energy alignment of the interface
in an accurate way.
Quantum chemical calculation has been employed to understand the electronic
structure of organic/metal interfaces by evaluating the electronic levels, work func-
tions, and charge densities. Density functional theory (DFT) using the periodic
boundary condition is a commonly used approach to simulate the adsorption of an
8

organic molecule on a metal surface that consists of a few layers of metal atoms. The
unit cell of the adsorbent molecules and the slab are periodically repeated in two
dimensions. A vacuum is assumed on the top of adsorbent to restrain the electronic
interactions between surfaces.
Studies of the polycyclic aromatic hydrocarbons (PAHs) adsorbed on the surfaces
of copper and gold show that the charge rearrangement is proportional to the dis-
tance between positively and negatively accumulated charges, which is decreased by
reducing the size of the PAH molecule [27]. In another work, the effect of van der
Waals interactions on the work function of gold and highly ordered pyrolytic graphite
(HOPG) substrates was investigated. The results show that the work function of
the substrate is decreased due to the formation of a cobalt(II) octaethylporphyrin
monolayer [28].
In 2008 Hofmann and co-workers reported the use of TTF derivatives to tune the
work function of a copper substrate [29]. DFT calculations in the periodic condition
and generalized gradient approximation (GGA) were used to simulate the adsorption
of TTF on the (110) surfaces of gold and silver by Martorell et al. in 2009 [30]. The
adsorption of TTF and tetraselenofulvene on the surface of Ag (110) was studied by
the same group in 2011 [31]. The molecule was predicted to assume a parallel ad-
sorption orientation on the metal surface. Furthermore, simulated vibrational modes
of adsorbent on the surface of the metal were reported in this work. The adsorption
of TTF on the gold surface was compared against that on the silver surface. Charge
transfer from TTF to the slab was found in that work. The formation of TTF SAMs
on the surface of copper was studied by Wang et al. in 2011, which shows that the
molecules tilt along the chain at maximum molecule-molecule interactions [32]. The
thin film formation of TTF on the surface of Cu (110) was experimentally and com-
putationally investigated by Sarasola et al. in 2014 [33]. Results show that the tilted
9

adsorption mode leads to stronger binding to the surface at low temperature, which
is no longer stable at temperatures slightly above room temperature. Adsorption of a
π-extended TTF on the surface of copper was investigated to understand the changes
of electronic levels by Schuler et al. in 2014 [34]. Adsorption of a dihydro-TTF on
the gold surface was computationally studied by Jethwa et al. in 2014 [35]. Their
results show that each thiolate endgroup binds to a single gold atom, and there is a
small degree of charge transfer between the molecule and the substrate. Compared
with the well-studied TTF and related derivatives, little work has been devoted to
understanding the behavior of DTF molecules adsorbed on the metal surface. More
systematic studies in this direction are thus warranted.
1.4 Gold Nanoparticles: Synthesis and Properties
Metal nanoparticles with sizes ranging from 1–100 nm display properties that are very
different from those of bulk materials or single atoms [36]. Large surface area and high
surface energy are the two main features of nanoparticles [37]. Metal nanoparticles
can be prepared at relatively low costs to attain remarkable controllability and high
tunability in terms of dimension, shape, and functionality. As such, they have been
widely recognized as promising nanomaterials for developing new technologies, such
as bio-imaging, photocatalysis, and nanoscale optoelectronic devices [38].
Among numerous types of metal nanoparticles, gold nanoparticles (AuNPs) are
the ones showing the most intriguing properties and applicability. Enormous research
activity has been dedicated to the rational design and tailoring of AuNPs over the
past few decades. So far, a large array of functionalized AuNPs has been success-
fully applied in various areas, such as memory storage [39], semiconductor films [40],
biological detectors [36], monitoring of biomolecular events [41], catalysis, and sen-
10

sors [42], just to name a few. It is worth noting that AuNPs usually show very low
toxicity or even non-toxicity, which make them particularly useful in biological and
medicinal applications [36].
Synthetically, the preparation of AuNPs with defined shapes and dimensions can
be attained by tuning various parameters; for example, the type of ligands encap-
sulating AuNPs plays a key role in dictating the shape and size of AuNPs [43]. In
addition, the morphological features of AuNPs are also significantly influenced by
synthetic conditions, such as solvent, temperature, and pH. The formation of AuNPs
involves two key steps, namely nucleation and growth, which have a direct impact
on the final morphology of AuNPs. Nucleation is the process in which preliminary
seeds act as nuclei and template for the formation of nanometer-size particles, while
growth is the process in which other atoms accumulate on the nuclei to increase the
size of the particle. Herein, nuclei refers to the arrangement of very few Au(0) atoms
that can grow by deposition of additional atoms over the surface [44]. The formation
of colloids through “burst nucleation” was first proposed and investigated by Lamer
et al. in 1940. Burst nucleation considers the nucleation and growth as separate
process. In other words, there is no nucleation occurring during the growth step.
After growth, AuNPs are formed with an even distribution of the size and shape [44].
The nucleation and growth processes are then modeled and described by classical
nucleation theory and Ostwald ripening, followed by Lifshitz-Slyozov-Wagner (LSW)
theory [45,46]. The origin of Ostwald ripening theory comes from the lower energy of
smaller particles with a higher surface to volume ratio. The outer layer of a nanopar-
ticle is found to be at higher energy than the inner atoms. Therefore, the Ostwald
ripening is a thermodynamically favored phase-transformation process from liquid to
solid, by which monomers adsorb to the surface of solid to produce a more stable
species.
11

Figure 1.6: (a) The electrostatic stabilization of neighboring metal particles thatare approaching together until the surface to surface distance becomes larger thanthe particle’s double layer. (b) The potential energy as a function of the surface tosurface distance is plotted, which exhibits the dominance of repulsion forces before themaximum total potential. The total potential tends to a stronger van der Waals forceby further decreasing the distance by agglomeration. The dashed green line representthe total potential as the sum of repulsive and attractive forces. (c) Schematic ofsteric stabilization of nanoparticles by coating with the layer of anchoring polymer.(d) The neighboring particles experience strong repulsive forces when particles arecloser than the anchored layer.
1.4.1 Stabilization and Controlled Growth of AuNPs
As mentioned earlier, the large surface area to the volume ratio endows AuNPs with
excellent properties in comparison to bulk materials. The high surface energy, on the
other hand, makes AuNPs show strong tendency towards agglomeration or coagulation
[44]. To prevent this from happening, some means of stabilization must be introduced
during the formation of AuNPs. Different methods of stabilizing AuNPs have been
developed and investigated, in which the polymeric effect, electrostatic effect, and pH
effect are the most commonly used parameters for fine-tuning the stabilizing outcomes
[44,47].
The electrostatic effect is based on the repulsion of like charges that surround the
surface of nanoparticles at the double layer region (Figure 1.6A). The double layer is
12

the charge redistribution over the surface of a particle due to the electrostatic attrac-
tion between the particle and surrounding charged species (solvent molecules and/or
electrolytes). The classic illustration of electrostatic effect on a particle’s stabilization
was first proposed by Derjaguin, Landau, Verwey and Overbeek (DLVO) in 1940. The
DLVO theory considers ions as points of charges with a uniform distribution which is
supposed to decrease the speed of particle agglomeration with no dependency on the
type of ion. The total potential energy of two interacting particles is assumed to be
the sum of attracting forces (e.g., van der Waals) and repulsive forces [37,47,48].
A plot of potential energy versus the distance between two approaching metal
particles is shown in Figure 1.6B, in which VT (dashed green line) is the sum of
repulsion and van der Waals attraction potentials [49]. The repulsive potential is
higher than the attractive force when two particles are far away from each other.
However, the total potential starts to gradually increase by reducing the surface to
surface distance. The repulsive force becomes dominant until it reaches the maximum
potential at Vmax. The maximum potential is the energy barrier. After going through
it the van der Waals force becomes dominant [37].
The electrostatic layer can be experimentally evaluated by zeta potential and is
essentially influential in the dilute system [37, 49]. The different chemical nature of
charged particles can result in more complex charge rearrangement over the surface
of nanoparticles [37]. According to the DVLO theory, higher potential energy leads
to more stabilization of nanoparticles. Higher kinetic energy, on the other hand,
increases the coagulation of interacting particles. Therefore, the stability of the par-
ticles cannot be only ascribed to the electrostatic effect as described in the DVLO
theory. Charge redistribution or polarization effects are contributive to the strength
of electrostatic forces between a neutral metal particle and a point of charge where
there is no chemical interaction [37]. The partial positive charge can be distorted
13

upon approaching another positively charged particle, inducing an electric dipole mo-
ment in the metal particle. Shortening the distance between an external charge and
the surface of a metal particle increases the induced dipole moment and hence the
attractive force between them.
Coating metal nanoparticles with a tight layer of polymers or surfactant molecules
prevents the nanoparticles from aggregation, providing another approach for stabiliza-
tion of nanoparticles. As can be seen in Figure 1.6C, the layers repel the surrounded
coated particles due to steric hindrance and make the particles resistant to deforma-
tion. The repulsive forces have been found to be exponentially proportional to the
interparticle distance (Figure 1.6D) [50]. The neighboring particles experience strong
repulsive forces when the particles come within a distance shorter than the total thick-
ness of coating layers. Binding of polymers to the surface of metal particles can be
achieved through covalently anchoring the end functional groups of polymers to the
surface, or simply by adsorption of the polymers on the surface. The adsorption is
due to relatively weak non-covalent interactions, in which polymers randomly wrap
their backbones around the nanoparticles [37, 44]. Polymers with higher molecular
weights and stronger chelating ability can encapsulate and stabilize metal nanopar-
ticles more efficiently. In general, electron donating ligand groups, such as sulfur,
nitrogen, and aromatic rings with loosely bound π-electrons can interact effectively
with metal surfaces in particular those with partial positive charges [44,51,52].
1.4.2 Mechanisms of AuNP Formation
Many methods have been proposed for the preparation of colloidal noble metal nanopar-
ticles in solution during the last three decades. A commonly used strategy is to reduce
corresponding metal salts by a suitable reducing agent in the presence of the surfac-
tants. The nature of surfactant controls the size and morphology of the resulting
14

nanoparticles. Colloidal AuNPs can be prepared by adding a reducing agent to a so-
lution of HAuCl4 under stirring. A stabilizing agent is used to encapsulate the formed
particles to prevent the aggregation of nanoparticles. The nanoparticle nucleation be-
gins with the reduction of the Au(III) to Au(I) (equation 1.1), which is followed by
the formation of Au(0) seeds. Nanoparticle seeds are surrounded by Au(I) species
which will then reduce to Au(0) leading to an increase in the size of AuNPs [53].
Au(III) + 2 e− −−→ Au(I) (1.1)
In 1951 Turkevich developed the first synthesis of colloidal spherical AuNPs with
an average size of 200 ± 15 nm. In this method, trisodium citrate dihydrate
(Na3C6H5O7 · 2H2O) was added to a stirred solution of chloroauric acid (HAuCl4).
The mixture was heated to 100 ◦C to give a clear red solution which contained AuNPs
encapsulated by the citrate anions. At the last stage of the synthesis, hydroxylamine
hydrochloride (NH3OH·HCl) was added to terminate the growth of the AuNPs with a
desired average size [54]. The stability of AuNPs prepared with the Turkevich method
originates from the electrostatic effect; citrate ions carrying negative charges are de-
posited on the surface of AuNPs to engender repulsion between the particles [47]. In
1998 Henglein devised a method to convert Au(I) to AuNPs through a radiochemical
reaction [55]. In 2006, a revisited Turkevich’s method was reported by Kimling and
co-workers, in which ascorbic acid and cetyltrimethylammonium bromide (CTAB)
were used as the stabilizing agent and surfactant, respectively [56].
A strong ionic environment can significantly enhance the electrostatic stability of
AuNPs due to the charge transfer from ions to the surface of AuNPs [47]. Merk and co-
workers studied the effect of the polarizability of ions on AuNP formation in 2013 [48].
Their results clearly indicate that the colloidal stability of ligand-free AuNPs can be
15

improved with increasing the polarizability of ions. In the current literature, there
are numerous publications on mechanistic studies of AuNP formation, but knowledge
on the detailed steps involved in the actual process of AuNP growth is still quite
limited [44].
1.4.3 Functionalization and Application of AuNPs
Surface functionalization is a powerful technique for tailoring and controlling the
properties of AuNPs [44]. The large surface area of AuNPs allows a variety of func-
tional molecular moieties to be introduced to the AuNP systems, which in turn bring
about new features useful to many applications [36]. For example, AuNPs functional-
ized with specific receptors can act as highly efficient chemical and biological sensors.
Certain biologically active functional groups can be attached to AuNPs to dictate
the destinations and fates of AuNPs in a biological system [57]. Such functionalized
AuNPs are useful in the application of bio-imaging, bio-diagnosis, and targeted drug
delivery [58]. AuNPs in combination with conjugated polymers and dendrimers can
boost the efficiency of organic solar cells [59].
Thiol is a commonly used anchoring group for linking various organic/inorganic
functional groups to the surface of AuNPs, owing to its relatively high affinity for
gold (i.e., covalent bonding). Functionalization of AuNPs with thiol derivatives can
overcome the stability issue that colloidal AuNPs usually face. Thiol-functionalized
AuNPs were first reported by Brust in 1994 [60]. The Brust method yields AuNPs
throughout the reduction of HAuCl4 in the presence of sodium borohydrate and do-
decanethiol. A year later, Brust and co-workers developed a method to functionalize
AuNPs with p-mercaptophenol, which is a more stable thiol ligand than alkylthi-
ols [61]. The IR spectra of the p-mercaptophenol before and after reaction with
tetrachloroaurate ions were examined to clearly show the absence of the S–H stretch-
16

ing band at 2600 cm−1 and the presence of free hydroxyl group. They concluded that
the molecules were self-assembled on the surface of AuNPs through thiol groups. The
studies by Brust established a simple synthetic procedure for air stable functional-
ized AuNPs. Nitrogen-based surfactants were used to facilitate the transfer of HAuCl4
from water to the organic phase to further redox reactions; however, they tend to cover
the surface of formed AuNPs and hence require an extra effort of purification [62,63].
Sarathy et al. reported a novel procedure for the synthesis of gold nanostructures
that are derivatized with the dodecanethiol group. In their method, the nitrogen-
containing phase transfer agent was replaced by hydrochloric acid to facilitate the
transfer of Au to the organic layer containing the thiol compounds [62, 64]. X-ray
photoelectron (XPS) spectroscopy confirmed that the sulfur atoms were chemisorbed
on the surface of Au. Modification of the AuNP surface with thionicotinamide upon
laser excitation was reported by Fujiwara et al. in 1999 [65]. Their results indicated
that the AuNPs end-capped with thionicotinamide groups underwent physical changes
such as coagulation or dissolution upon laser radiation. As such, the characteristic
UV-Vis peak of AuNPs at 520 nm was shifted to higher wavelength due to coagula-
tion of AuNPs. Yee et al. reported a monophasic synthesis of functionalized spherical
AuNPs packed in the fcc arrangement. Octadecanethiol and lithium triethylborohy-
dride were used as the surfactant and reducing agent in THF solution [63].
In 1999 Nakai et al. synthesized a class of stable functionalized AuNPs function-
alized with tetrathiafulvalene (TTF) derivatives [66]. Zhou and co-workers reported a
redox reaction between HAuCl4 and poly(dithiafulvene)s in 2001, which gave AuNPs
with an average size of 6 nm [67]. The AuNPs were found to be stable for more than
a month with the narrow size distribution well kept. TTF compounds were also used
to synthesize silver nanostructures in acetonitrile by Wang et al. in 2003 [68]. The
TEM images of these silver particles showed a dendritic shape. Wang investigated the
17

reduction of Au ions to AuNPs through oxidation of a prepared layer-by-layer self-
assembled film of poly(dithiafulvene)s on an ITO substrate in 2006 [69]. Dithiafulvene
derivatives were used by Lanterna in 2015 to reduce Au(III) to Au(0), resulting in
stable AuNPs without the need for any other reducing agents [70].
1.5 Motivation and Organization of This Thesis
1,4-Dithiafulvene (DTF) and tetrathiafulvalene (TTF) functionalized oligomers are a
promising group of π-conjugated materials with excellent electron-donating and redox
properties. They are particularly useful in the application of thin-film molecular elec-
tronic and optoelectronic devices as the active materials [71]. The thesis work is aimed
at understanding the fundamental properties of a series of novel DTF-based molecules
and macromolecules. In particular the structural, electronic, and microscopic prop-
erties of these compounds in the forms of self-assembled monolayers (SAMs) on the
surface of Au (111) or AuNPs were investigated. Molecular modeling in the gas
phase and the solid state was conducted through density functional theory (DFT)
calculations, and the computational results were compared with various experimental
data such as Raman spectroscopy, atomic force microscopy (AFM), and ultraviolet-
visible (UV-Vis) spectroscopy to establish some understanding of structure-property
relationships.
The first part of this thesis focuses on the structural and electronic properties of
bis(DTF)-endcapped oligo(phenylene ethynylene)s in the neutral and oxidized forms.
The self-assembling properties of the oligomers in different redox states were examined
on mica and highly oriented pyrolytic graphite (HOPG) surfaces to show dependency
of thin film morphology on oxidation state. In the second part, the adsorption be-
haviour of a carboxylated DTF molecule on the surface of Au was studied by DFT
18
calculations with the Vienna Ab initio Simulation Package (VASP) under periodic
boundary conditions with Perdew-Burke-Ernzerhof (PBE) correlation and general-
ized gradient approximation (GGA) exchange functional and considering the effect
of van der Waals interaction by using the vdW-DFT (optB88-vdW) method. First,
the role of molecule-gold interaction is discussed with regards to the effect of mono-
layer formation on charge transfer. Second, the effect of van der Waals interactions
on metal organic interface is elucidated by comparison of the computational results
with and without dispersion correction. Raman spectroscopy and Kelvin probe force
microscopy (KPFM) were employed to evaluate the accuracy of the computed work-
functions. The results show that the workfunction of Au (111) can be tuned by
deposition of an aryl-substituted DTF film of varying polarity. In the final part, the
mechanism for the reduction of HAuCl4 with DTF derivatives is discussed based on
time–dependent UV-Vis analysis. The study discloses a promising one-phase syn-
thetic approach for AuNPs in aqueous media, where stepwise temperature control has
been found to exert a key effect on the synthetic outcomes.
Bibliography
[1] Fred Wudl, Darold Wobschall, and Earl J. Hufnagel. Electrical conductivity by
the bis(1,3-dithiole)-bis(1,3-dithiolium) system. J. Am. Chem. Soc., 94:670–672,
1972.
[2] Yuming Zhao, Guang Chen, Karimulla Mulla, Ilias Mahmud, Shuai Liang, Pra-
teek Dongare, David W. Thompson, Louise N. Dawe, and Stephen Bouzan.
Tetrathiafulvalene vinylogues as versatile building blocks for new organic ma-
terials. Pure Appl. Chem., 84:1005–1025, 2012.
19
[3] Kathleen Woolridge, Luana C. Goncalves, Stephen Bouzan, Guang Chen, and
Yuming Zhao. Aryl-substituted dithiafulvenes: synthesis, electronic properties,
and redox reactivity. Tetrahedron Lett., 55:6362 – 6366, 2014.
[4] Dominique de Caro, I Malfant, J-P Savy, and L Valade. A review of molecule-
based conductors electrodeposited as thin films on silicon wafers. J. Phys. Con-
dens. Matter, 20:184012, 2008.
[5] Henning Hopf and M. S. Sherburn. Cross conjugation: dendralene, radialene and
fulvene chemistry. Wiley-VCH, 2016.
[6] Olivier Alévêque, Pierre Frère, Philippe Leriche, Tony Breton, Antonio Cravino,
and Jean Roncali. Effects of aromatic spacers on the properties of organic field
effect transistors based on π-extended tetrathiafulvalene derivatives. J. Mater.
Chem., 19:3648–3651, 2009.
[7] Georg Heimel, Lorenz Romaner, Jean-Luc Brédas, and Egbert Zojer. Inter-
face energetics and level alignment at covalent metal-molecule junctions: π-
conjugated thiols on gold. Phys. Rev. Lett., 96:196806, 2006.
[8] Rafal Klajn, J. Fraser Stoddart, and Bartosz A. Grzybowski. Nanoparticles
functionalised with reversible molecular and supramolecular switches. Chem.
Soc. Rev., 39:2203–2237, 2010.
[9] Philippe Hapiot, Dominique Lorcy, André Tallec, Roger Carlier, and Albert
Robert. Mechanism of dimerization of 1,4-dithiafulvenes into TTF vinylogues.
J. Phys. Chem., 100:14823–14827, 1996.
[10] Pierre Frere and Peter J. Skabara. Salts of extended tetrathiafulvalene analogues:
relationships between molecular structure, electrochemical properties and solid
state organisation. Chem. Soc. Rev., 34:69–98, 2005.
20

[11] Marcos Chas, Margareth Lemarie, Mihaela Gulea, and Narcis Avar-
vari. Chemo- and enantioselective sulfoxidation of bis(ethylenedithio)-
tetrathiafulvalene (BEDT-TTF) into chiral BEDT-TTF-sulfoxide. Chem. Com-
mun., pages 220–222, 2008.
[12] J. L. Brédas, J. P. Calbert, D. A. da Silva Filho, and J. Cornil. Organic semicon-
ductors: a theoretical characterization of the basic parameters governing charge
transport. Proc. Natl. Acad. Sci., 99:5804–5809, 2002.
[13] Diego Paschoal and Hélio F. Dos Santos. Assessing the quantum mechanical
level of theory for prediction of linear and nonlinear optical properties of push-
pull organic molecules. J. Mol. Model., 19:2079–2090, 2013.
[14] G.H. Wagniere. Linear and nonlinear optical properties of molecules, volume 99.
Wiley-VCH, 1995.
[15] Richard J. D. Tilley. Colour and the optical properties of materials: an explo-
ration of the relationship between light, the optical properties of materials and
colour. Wiley, second edition, 2011.
[16] Elodie Gontier, Nathalie Bellec, Pierre Brignou, Arnaud Gohier, Michel Guerro,
Thierry Roisnel, and Dominique Lorcy. Pyridyldithiafulvenes as precursors of
coordination-driven self-assembled redox active macrocycle. Org. Lett., 12:2386–
2389, 2010.
[17] Michel Guerro, Ngoc Ha Pham, Julien Massue, Nathalie Bellec, and Dominique
Lorcy. New redox active ligands involving a tetrathiafulvalene vinylogue back-
bone. Tetrahedron, 64:5285–5290, 2008.
[18] Karimulla Mulla and Yuming Zhao. TTFV molecular tweezers with phenyl-
boronic acid and phenylboronate endgroups: modular synthesis and electrochem-
21

ical responses to saccharides and fluoride ion. Tetrahedron Lett., 55:382–386,
2014.
[19] Dominique Lorcy, Michel Guerro, Jean-François Bergamini, and Philippe Hapiot.
Vinylogous tetrathiafulvalene based podands: complexation interferences on the
molecular movements triggered by electron transfer. J. Phys. Chem. B, 117:5188–
5194, 2013.
[20] Karimulla Mulla, Prateek Dongare, David W. Thompson, and Yuming Zhao.
Click synthesized dianthryl-TTFV: an efficient fluorescent turn-on probe for tran-
sition metal ions. Org. Biomol. Chem., 10:2542–2544, 2012.
[21] Karimulla Mulla, Haseena Shaik, David W Thompson, and Yuming Zhao. TTFV-
based molecular tweezers and macrocycles as receptors for fullerenes. Org. Lett.,
15:4532–4535, 2013.
[22] Shuai Liang, Yuming Zhao, and Alex Adronov. Selective and reversible nonco-
valent functionalization of single-walled carbon nanotubes by a pH-responsive
vinylogous tetrathiafulvalene–fluorene copolymer. J. Am. Chem. Soc., 136:970–
977, 2014.
[23] Guang Chen, Ilias Mahmud, Louise N Dawe, and Yuming Zhao. Acetylenic
phenyldithiafulvene: a versatile synthon for TTFV-based macromolecules. Org.
Lett., 12:704–707, 2010.
[24] Emilie Ripaud, Philippe Leriche, Nicolas Cocherel, Thomas Cauchy, Pierre Frere,
and Jean Roncali. Tristhienylphenylamine - extended dithiafulvene hybrids as
bifunctional electroactive species. Org. Biomol. Chem., 9:1034–1040, 2011.
22
[25] Lauren E. Kreno, Kirsty Leong, Omar K. Farha, Mark Allendorf, Richard P.
Van Duyne, and Joseph T. Hupp. Metal–organic framework materials as chemical
sensors. Chem. Rev., 112:1105–1125, 2012.
[26] Yunfei Wang and Yuming Zhao. Carboxylated dithiafulvenes and tetrathiaful-
valene vinylogues: synthesis, electronic properties, and complexation with zinc
ions. Beilstein J. Org. Chem., 11:957–965, 2015.
[27] Paulo V.C. Medeiros, G.K. Gueorguiev, and S. Stafström. Bonding, charge re-
arrangement and interface dipoles of benzene, graphene, and PAH molecules on
Au(111) and Cu(111). Carbon, 81:620 – 628, 2015.
[28] Bhaskar Chilukuri, Ursula Mazur, and K. W. Hipps. Effect of dispersion on
surface interactions of cobalt(ii) octaethylporphyrin monolayer on Au(111) and
HOPG(0001) substrates: a comparative first principles study. Phys. Chem.
Chem. Phys., 16:14096–14107, 2014.
[29] Oliver T. Hofmann, Gerold M. Rangger, and Egbert Zojer. Reducing the metal
work function beyond pauli pushback: a computational investigation of tetrathi-
afulvalene and viologen on coinage metal surfaces. J. Phys. Chem. C, 112:20357–
20365, 2008.
[30] Benjamí Martorell, Anna Clotet, and Jordi Fraxedas. A first principle study
of the structural, vibrational and electronic properties of tetrathiafulvalene ad-
sorbed on Ag(110) and Au(110) surfaces. J. Comput. Chem., 31:1842–1852, 2010.
[31] B. Martorell, J. Fraxedas, and A. Clotet. Tetrathia- and tetraselenafulvalene
adsorbed on Ag(110): a theoretical study. Surf. Sci., 605:187–192, 2011.
[32] Yang Wang, Christian Urban, Jonathan Rodríguez-Fernández, José M. Gallego,
Roberto Otero, Nazario Martín, Rodolfo Miranda, Manuel Alcamí, and Fernando
23

Martín. Formation of self-assembled chains of tetrathiafulvalene on a Cu(100)
surface. J. Phys. Chem. A, 115:13080–13087, 2011.
[33] Ane Sarasola, Sara Barja, Amadeo L. Vázquez de Parga, and Andrés Arnau. Ad-
sorption of tetrathiafulvalene (TTF) on Cu(100): can π-stacked 1-D aggregates
be formed at low temperature? Chem. Phys. Lett., 612:45–50, 2014.
[34] Bruno Schuler, Shi-Xia Liu, Yan Geng, Silvio Decurtins, Gerhard Meyer, and
Leo Gross. Contrast formation in Kelvin probe force microscopy of single π-
conjugated molecules. Nano Lett., 14:3342–3346, 2014.
[35] Siddharth J. Jethwa, Federico Grillo, Herbert A. Fruchtl, Grant J. Simpson,
Michael-John Treanor, Renald Schaub, Stephen M. Francis, Neville V. Richard-
son, and R. Alan Aitken. Adsorption of a dihydro-TTF derivative on Au(111) via
a thiolate complex bonding to gold adatoms. Chem. Commun., 50:10140–10143,
2014.
[36] Lucas A. Lane, Ximei Qian, and Shuming Nie. SERS nanoparticles in medicine:
from label-free detection to spectroscopic tagging. Chem. Rev., 115:10489–10529,
2015.
[37] Scott Handy. Applications of ionic liquids in science and technology. InTech,
2011.
[38] Susie Eustis and Mostafa A. El-Sayed. Why gold nanoparticles are more precious
than pretty gold: Noble metal surface plasmon resonance and its enhancement
of the radiative and nonradiative properties of nanocrystals of different shapes.
Chem. Soc. Rev., 35:209–217, 2006.
24

[39] Peng Cui, Sohyeon Seo, Junghyun Lee, Luyang Wang, Eunkyo Lee, Misook Min,
and Hyoyoung Lee. Nonvolatile memory device using gold nanoparticles cova-
lently bound to reduced graphene oxide. ACS Nano, 5:6826–6833, 2011.
[40] Robert G. Palgrave, , and Ivan P. Parkin. Aerosol assisted chemical vapor de-
position using nanoparticle precursors: a route to nanocomposite thin films. J.
Am. Chem. Soc., 128:1587–1597, 2006.
[41] Sajanlal R. Panikkanvalappil, Steven M. Hira, Mahmoud A. Mahmoud, and
Mostafa A. El-Sayed. Unraveling the biomolecular snapshots of mitosis in healthy
and cancer cells using plasmonically-enhanced Raman spectroscopy. J. Am.
Chem. Soc., 136:15961–15968, 2014.
[42] Yuanchao Zhang, Wendy Chu, Alireza Dibaji Foroushani, Hongbin Wang, Da Li,
Jingquan Liu, Colin J. Barrow, Xin Wang, and Wenrong Yang. New gold nanos-
tructures for sensor applications: a review. Materials, 7:5169, 2014.
[43] Helmut Hinterwirth, Stefanie Kappel, Thomas Waitz, Thomas Prohaska, Wolf-
gang Lindner, and Michael Lämmerhofer. Quantifying thiol ligand density of
self-assembled monolayers on gold nanoparticles by inductively coupled plasma-
mass spectrometry. ACS Nano, 7:1129–1136, 2013.
[44] Pedro H. C. Camargo, Thenner S. Rodrigues, Anderson G. M. da Silva, and
Jiale Wang. Controlled synthesis: nucleation and growth in solution. Springer
International Publishing, 2015.
[45] Jörg Polte, T. Torsten Ahner, Friedmar Delissen, Sergey Sokolov, Franziska Em-
merling, Andreas F. Thünemann, and Ralph Kraehnert. Mechanism of gold
nanoparticle formation in the classical citrate synthesis method derived from
25

coupled in situ XANES and SAXS evaluation. J. Am. Chem. Soc., 132:1296–
1301, 2010.
[46] Taylor J. Woehl, James E. Evans, Ilke Arslan, William D. Ristenpart, and
Nigel D. Browning. Direct in situ determination of the mechanisms controlling
nanoparticle nucleation and growth. ACS Nano, 6:8599–8610, 2012.
[47] Christian Pfeiffer, Christoph Rehbock, Dominik Hühn, Carolina Carrillo-Carrion,
Dorleta Jimenez de Aberasturi, Vivian Merk, Stephan Barcikowski, and Wolf-
gang J. Parak. Interaction of colloidal nanoparticles with their local environ-
ment: the (ionic) nanoenvironment around nanoparticles is different from bulk
and determines the physico-chemical properties of the nanoparticles. J. R. Soc.
Interface, 11, 2014.
[48] Vivian Merk, Christoph Rehbock, Felix Becker, Ulrich Hagemann, Hermann
Nienhaus, and Stephan Barcikowski. In situ non-DLVO stabilization of
surfactant-free, plasmonic gold nanoparticles: effect of hofmeisteres anions. Lang-
muir, 30:4213–4222, 2014.
[49] Yaovi Holade, Nihat Ege Sahin, Karine Servat, Teko W. Napporn, and
Kouakou B. Kokoh. Recent advances in carbon supported metal nanoparticles
preparation for oxygen reduction reaction in low temperature fuel cells. MDPI,
Catalyst, 5:310–348, 2015.
[50] Younjin Min, Mustafa Akbulut, Kai Kristiansen, and Yuval Golan & Jacob Is-
raelachvili. The role of interparticle and external forces in nanoparticle assembly.
Nat. Mater., 7:527–538, 2008.
26

[51] Makoto Takafuji, Shunichi Ide, Hirotaka Ihara, and Zhenghe Xu. Preparation of
poly(1-vinylimidazole)-grafted magnetic nanoparticles and their application for
removal of metal ions. Chem. Mater., 16:1977–1983, 2004.
[52] Marie-Christine Daniel, , and Didier Astruc. Gold nanoparticles: assembly,
supramolecular chemistry, quantum-size-related properties, and applications to-
ward biology, catalysis, and nanotechnology. Chem. Rev., 104:293–346, 2004.
[53] J.R. Mycroft, G.M. Bancroft, N.S. McIntyre, and J.W. Lorimer. Spontaneous
deposition of gold on pyrite from solutions containing Au (III) and Au (I) chlo-
rides. Part I: A surface study. Geochimica et Cosmochimica Acta, 59(16):3351 –
3365, 1995.
[54] John Turkevich, Peter Cooper Stevenson, and James Hillier. A study of the nu-
cleation and growth processes in the synthesis of colloidal gold. Discuss. Faraday
Soc., 11:55–75, 1951.
[55] Arnim Henglein and Dan Meisel. Radiolytic control of the size of colloidal gold
nanoparticles. Langmuir, 14:7392–7396, 1998.
[56] J. Kimling, M. Maier, B. Okenve, V. Kotaidis, H. Ballot, , and A. Plech.
Turkevich method for gold nanoparticle synthesis revisited. J. Phys. Chem. B,
110:15700–15707, 2006.
[57] Yi-Cheun Yeh, Brian Creran, and Vincent M. Rotello. Gold nanoparticles: prepa-
ration, properties, and applications in bionanotechnology. Nanoscale, 4:1871–
1880, 2012.
[58] Mazaher Gholipourmalekabadi, Mohammadmahdi Mobaraki, Maryam Ghaffari,
Amir Zarebkohan, Vahid F. Omrani, Aleksandra M. Urbanska, and Alexander
27

Seifalian. Targeted drug delivery based on gold nanoparticle derivatives. Curr.
Pharm. Des., 23:2918–2929, 2017.
[59] Sai-Anand Gopalan, Anantha-Iyengar Gopalan, Ajayan Vinu, Kwang-Pill Lee,
and Shin-Won Kang. A new optical-electrical integrated buffer layer design based
on gold nanoparticles tethered thiol containing sulfonated polyaniline towards
enhancement of solar cell performance. Sol. Energy Mater Sol. Cells, 174:112 –
123, 2018.
[60] Mathias Brust, Merryl Walker, Donald Bethell, David J. Schiffrin, and Robin
Whyman. Synthesis of thiol-derivatised gold nanoparticles in a two-phase Liquid-
Liquid system. J. Chem. Soc., Chem. Commun., pages 801–802, 1994.
[61] M. Brust, J. Fink, D. Bethell, D. J. Schiffrin, and C. Kiely. Synthesis and
reactions of functionalised gold nanoparticles. J. Chem. Soc., Chem. Commun.,
pages 1655–1656, 1995.
[62] K. Vijaya Sarathy, G. U. Kulkarni, and C. N. R. Rao. A novel method of
preparing thiol-derivatised nanoparticles of gold, platinum and silver forming
superstructures. Chem. Commun., pages 537–538, 1997.
[63] Chanel K. Yee, Rainer Jordan, Abraham Ulman, Henry White, Alexander King,
Miriam Rafailovich, and Jonathan Sokolov. Novel one-phase synthesis of thiol-
functionalized gold, palladium, and iridium nanoparticles using superhydride.
Langmuir, 15:3486–3491, 1999.
[64] K. Vijaya Sarathy, Gargi Raina, R. T. Yadav, G. U. Kulkarni, , and C. N. R.
Rao. Thiol-derivatized nanocrystalline arrays of gold, silver, and platinum. J.
Phys. Chem. B, 101:9876–9880, 1997.
28

[65] Hiroaki Fujiwara, Shozo Yanagida, and Prashant V. Kamat. Visible laser induced
fusion and fragmentation of thionicotinamide-capped gold nanoparticles. J. Phys.
Chem. B, 103:2589–2591, 1999.
[66] Hidetaka Nakai, Masakuni Yoshihara, and Hisashi Fujihara. New electroac-
tive tetrathiafulvalene-derivatized gold nanoparticles and their remarkably stable
nanoparticle films on electrodes. Langmuir, 15:8574–8576, 1999.
[67] Yong Zhou, Hideaki Itoh, Takashi Uemura, Kensuke Naka, and Yoshiki Chujo.
Preparation of small π-conjugated polymer-protected gold nanoparticles in stable
colloidal form. Chem. Commun., pages 613–614, 2001.
[68] Xiaqin Wang, Hideaki Itoh, Kensuke Naka, and Yoshiki Chujo.
Tetrathiafulvalene-assisted formation of silver dendritic nanostructures in
acetonitrile. Langmuir, 19:6242–6246, 2003.
[69] Xiaqin Wang, Kensuke Naka, Chaosheng Wang, Hideaki Itoh, Takashi Uemura,
and Yoshiki Chujo. Layer-by-layer films based on charge transfer interaction of
π-conjugated poly(dithiafulvene) and incorporation of gold nanoparticles into the
films. J. Appl. Polym. Sci., 103:1608–1615, 2007.
[70] Anabel E. Lanterna, Eduardo A. Coronado, and Alejandro M. Granados. Synthe-
sis of gold nanoparticles using electron-donating dithiafulvene units. Tetrahedron
Lett., 56:4871 – 4876, 2015.
[71] Atsushi Wachi, Yusuke Kudo, Aoba Kanesaka, Hiroyuki Nishikawa, Takuya
Shiga, Hiroki Oshio, Masayuki Chikamatsu, and Reiko Azumi. Organic field-
effect transistor based on paramagnetic Cu(II) neutral complexes coordinated by
Schiff base-type TTF ligands. Polyhedron, 2017.
29

Co-authorship Statement
Dithiafulvenes and tetrathiafulvalene derivatives were obtained from Prof. Yuming
Zhao’s research lab, which were synthesized and purified by Karimulla Mulla, Yunfei
Wang, and Hadeel Adows.
The experimental work functions were measured with Kelvin probe force mi-
croscopy with the help of Abhijit Chatterjee, a Ph.D. student in Prof. Erika Mer-
schrod’s research group.
The designing of the procedure for AuNP synthesis and identification of the pro-
duced AuNPs at different pH were done through a collaborative study with Dr. Jiaqi
Cheng in January 2015, who was a post-doctoral fellow in Prof. Merschrod’s research
group.
All computational work was conducted by Sepideh Mehrani including the choice
of methods and parameters. The experimental protocols were designed and imple-
mented by Sepideh Mehrani, with collaboration mentioned above. All chapters and
appendices in this thesis were written by Sepideh Mehrani, with feedback and correc-
tions from Profs. Zhao and Merschrod. Data analysis was developed and carried out
by Sepideh Mehrani, with input from Profs. Zhao and Merschrod.
30

Chapter 2
Redox-dependent Properties of
DTF-endcapped π-Conjugated
Oligomers
2.1 Introduction
Redox-active π-conjugated oligomers and polymers have been extensively investigated
over the past few decades owing to their widespread uses in molecular electronic and
optoelectronic materials and devices [1–4]. In the current literature, a large family
of functional π-conjugated polymer structures has been established, wherein specially
designed electron-donating and/or electron-withdrawing groups are either incorpo-
rated in the polymer backbones or grafted to the side chains, resulting in p- or n-type
semiconducting π-conjugated materials for various molecular electronic and optical
devices [5–8]. In this context, tetrathiafulvalene (TTF) and related π-analogues have
constituted a popular class of building blocks for constructing functional organic elec-
tronic and optoelectronic materials, given their excellent electron-donating properties,
31

rich redox activity, and versatile supramolecular self-assembling behaviour [9–13]. 1,4-
Dithiafulvene (DTF), which is the half structure of TTF, is also a good π-electron
donor as a result of its gaining of aromaticity upon one-electron oxidation (see Fig-
ure 2.1). Synthetically, DTF-substituted arenes can undergo a facile coupling reaction
under oxidative conditions to form π-extended TTF derivatives as depicted in Fig-
ure 2.1, namely tetrathiafulvalene vinylogues (TTFVs) [14–21]. Over the past few
years, such reactivity has enabled the preparation of a variety of intriguing molecular
devices, including chemosensors [22–25], molecular switches [25–32], and supramolec-
ular hosts [23].
Figure 2.1: General redox reactivity of a DTF-substituted arene.
Most recently, the application of DTF as a redox-active substituent to modulate
the electronic and photonic properties of π-conjugated oligomers has been increasingly
pursued. In 2009, Roncali and co-workers reported the study of a series of bis(DTF)-
functionalized arenes (benezene, pyrrole, thiophene, etc.) as the active building com-
ponents for organic field effect transistors (OFETs) [33]. In 2012, Yang and co-workers
prepared a group of DTF-functionalized phenylene/thienylene oligomers and applied
them as highly efficient organic sensitizers for dye-sensitized solar cells [34]. In 2014,
Guo and co-workers discovered that a bis(DTF)-endcapped phenylene thienylene
oligomer can form J -aggregates in the solid state and hence give rise to aggregation-
induced enhanced emission (AIEE) [35]. Most recently, functionalization of DTF
groups on the π-frameworks of oligo(phenylene ethnylene)s was found to result in sig-
nificantly increased molecular conductance by Nielsen and co-workers [36, 37]. Mulla
32

and Zhao recently synthesized a group of bis(DTF)-endcapped phenylene ethynylene
and phenylene vinylene oligomers and characterized their supramolecular interactions
with fullerenes and single-walled carbon nanotubes (SWNTs) [38].
Despite the active exploration of DTF-functionalized π-oligomer systems in the
recent literature, there are still some fundamentally important questions that await
to be answered; for instance, in a dumbbell-like DTF−π−DTF system, (i) what are
the redox activity and reactivity of the two DTF groups in the solution phase and
solid state? (ii) How would the DTF groups affect the electron delocalisation of the
π-oligomer in their neutral and oxidized states? (iii) To what extent will the redox pro-
cesees taking place on the DTF groups change the solid-state aggregation properties?
Understanding these issues will be of great benefit and guidance to further develop-
ment of DTF-functionalized molecular materials, while comprehensive experimental
characterization in combination with high-level computational studies are deemed as
an effective problem-solving approach.
Figure 2.2: Structures of bis(DTF)-endcapped oligo(phenylene ethynylene)s 2.
In this work, linear-shaped bis(DTF)-endcapped phenylacetylene oligomers 2 (Fig-
ure 2.2) were chosen as model compounds for a joint experimental and theoretical in-
vestigation on the DTF−π−DTF systems. The synthesis of 2a has been established
previously [38]. Structurally, it contains two electron-donating DTF endgroups that
are in direct π-conjugation with a central trimeric phenylene ethynylene unit. Modula-
tion of the π-electron delocalization characteristics of the oligo(phenylene ethynylene)
unit by the DTF endgroups can thus be envisioned. In the previous studies carried
33

out by the Zhao group, the electronic and redox properties of 2a in solution phase
were generally characterized by UV-Vis absorption and cyclic voltammetric analyses
in solution [38], Herein the characterization of oligomer 2a in both solution and solid
phases was undertaken using electrochemical, UV-Vis absorption, and Raman spec-
troscopic analyses. It is worth mentioning that Raman spectroscopy has been proven
to be a very powerful tool for elucidating the properties of π-conjugated oligomers in
their neutral and various oxidized states [39–42]. To better interpret the experimental
data, density functional theory (DFT) calculations were conducted on a model com-
pound, bis(DTF)-oligomer 2b, which has an identical DTF−π−DTF framework to
that of 2a, but without the SC10H21 side groups attached to the DTF moieties to save
computational costs. The following sections describe the experimental and theoretical
data determined for the bis(DTF)-oligo(phenylene ethynylene) system 2a−b. On the
basis of these data, relevant structure-property relationships can be established.
2.2 Experimental Section
2.2.1 Computational Methods
DFT calculations were carried out with the Gaussian 09 software package [43], us-
ing Becke’s three-parameter exchange functional combined with the LYP correla-
tion functional (B3LYP) [44]. Optimization of molecular geometry was conducted
at the B3LYP/6-31++G(d,p) level of theory, with frequency calculations performed
afterwards to analyse the vibrational modes and to determine whether the optimized
structures are true minima. Excitation energies and excited-state properties were cal-
culated based on the time-dependent density functional theory (TD-DFT) [45] using
the B3LYP functional and 6-31++G(d,p) basis set, with only singlet to singlet tran-
sitions considered. Simulated UV-Vis absorption and Raman spectra were generated
34

by the GaussView 5 software package [46]. The polarizable continuum model (PCM)
was adopted to include the effect of chloroform solvent [47].
2.2.2 Experimental Characterization
Oligomer 2a was synthesized according to the reported procedures [38]. UV-Vis
absorption spectra of 2a were recorded in solution or solid thin films on a Cary 6000i
UV-Vis-NIR spectrophotometer. Cyclic voltammetric (CV) analysis was performed
on a BASi Epsilon electrochemical analyser using a standard three-electrode setup
(glass carbon as the working electrode, Ag/AgCl as the reference electrode, and Pt
wire as the counter electrode). Morphological study of the thin film surface was done
by using an MFP-3D (Asylum Research) atomic force microscope (AFM), with a
silicon tip (NSC35/AIBS, MikroMasch) operating in the tapping mode (scan rate 1
Hz). Surface roughness was calculated using the method implemented in the Asylum
Research software. Raman spectroscopic measurements of the thin film of 2a were
conducted on a Renishaw inVia instrument excited at 830 nm.
Thin films of 2a were prepared by drop-casting or spin-coating a solution of 2a in
toluene on the surfaces of mica, glass, or highly ordered pyrolytic graphite (HOPG)
using a Laurell WS-650-23 spin-coater (800 rpm for 1 min followed by 1000 rpm for
another 1 min). Chemical oxidation of the thin film of 2a was conducted by placing
the sample in a covered glass vessel containing iodine as oxidant. In this way, the
sample was exposed to iodine vapour for different time intervals and then taken out
for the spectroscopic and microscopic analyses.
35

2.3 Results and Discussion
2.3.1 Structural and Electronic Properties in the Neutral and
Oxidized States
The optimized geometry of model compound 2b in the neutral state is shown in
Figure 2.3. The entire molecular π-framework exhibits complete planarity, with the
two dithiole rings taking a trans orientation with respect to the central oligomer unit.
Such a molecular shape is in line with the the demands for maximal π-conjugation
and minimal molecular dipole moment.
Figure 2.3: Optimized geometry of 2b at the B3LYP/6-31++G(d,p) level and adoptedlabeling scheme in this study.
The optimized geometries of 2b in the radical cation and dication states were
also calculated. With these structures, the degrees of π-electron delocalisation for
2b in different oxidation states were assessed by examining the bond length changes,
particularly those of C=C (1−2 and 7−8) and C≡C (3−4 and 5−6) bonds in the
central π-framework, as it has been established that the bond length alternation
(BLA) is correlated with the electronic characteristics of π-conjugated systems [48–50].
Figure 2.4A depicts the comparison of averaged C=C and C≡C bond lengths in the
neutral, radical cation, and dication forms respectively. For the dication state, two
forms of spin multiplicity, singlet and triplet, were calculated and examined. As
shown in Figure 2.4A, both the averaged C=C and C≡C bonds are considerably
more elongated in the state of radical cation than in dication, indicating that the
radical cation state achieves the highest degree of π-electron delocalisation.
36

Figure 2.4: (A) Comparison of averaged C=C and C≡C bond lengths of compound 2bin neutral (Neu), radical cation (RC), singlet dication (DC(S)), and triplet dication(DC(T)) states. (B) A resonance scheme for the radical cation of 2b. (C) Calculatedspin density map for the radical cation of 2b. (D) Calculated spin density map forthe triplet dication of 2b. The high and low unpaired electron density areas arehighlighted by blue and green colours respectively.
37

The high degree of delocalisation in the radical cation state can be qualitatively
interpreted by the classical resonance model shown in Figure 2.4B, in which the vinyl
radical is predicted to delocalise through the oligo(phenylene ethynylene) π-bridge to
the dithiole moiety at the other end of the molecule. From the resonance scheme one
can also identify a synergistic stabilizing effect (known as the captodative effect) on the
radical imposed by the electron donating dithiole and electron-withdrawing dithiolium
units. The highly delocalised nature of the radical cation of 2b can also be seen from
the results of spin density analysis. In Figure 2.4C, the regions of high unpaired
electron density are found to populate along the entire molecular π-framework, with
particularly high concentration at the terminal dithiole rings.
In the state of dication, both the singlet and triplet forms show similar C=C bond
lengths, whereas the triplet appears to have a slightly longer C≡C bond than the
singlet. The computational results thus suggest that the singlet and triplet dications
possess similar degrees of π-delocalisation, although the triplet dication is calculated
to be 16.73 kJ/mol more stable than the singlet in the gas phase. The spin density
properties of the triplet dication of 2b, which is in essence a biradical dication, were
also calculated as depicted in Figure 2.4D. In this map, the highest unpaired electron
densities are clearly seen to be located around the vinyl carbons, which is different
than the case of radical cation (Figure 2.4C) where the radical character is more
dispersed along the molecular π-framework.
2.3.2 Frontier Molecular Orbitals and Redox Properties in
Solution Phase
The frontier molecular orbitals and orbital energies of 2b are shown in Figure 2.5. The
HOMO is found to be evenly distributed along the entire π-framework, encompassing
the central oligo(phenylene ethynylene) bridge and the two DTF endgroups. The
38

LUMO is mainly on the central oligomer bridge, while the DTF groups contribute
less significantly. For the HOMO−1 and LUMO+1, the orbital coefficients on central
benzene become quite insignificant. More significant contributions actually come from
the outside benzene rings and DTF groups in these two orbitals.
Figure 2.5: Contour maps of frontier MOs for compound 2b (isovalue = 0.02 a.u.)and their eigenvalues calculated at the B3LYP/6-31++G(d,p) level.
The oxidation processes of compound 2b leading to the formation of radical cation
and dication species were simulated by DFT calculations in both the gas and solution
phases (CH2Cl2 as solvent). The detailed thermodynamic data involved in each step
of single-electron transfer are provided in the square scheme shown in Figure 2.6. It is
particular notable that the ∆Go values for the formation of singlet dication and triplet
dication appear to be very different in the gas phase. However, in the solution phase
the values become identical, as a result of the different solvation energies for singlet
and triplet dications. The potentials (Eo) for the stepwise oxidation were calculated
using the equation, ∆Go = nFEo, where n is the number of electrons and F is the
39

Faraday constant. The calculation shows that the first oxidation potential (E1ox) is
at +5.05 V and the second oxidation potential (E2ox) is at +5.65 V. In reference to
a Ag/AgCl electrode (Eo(Ag/Ag+) = +4.66 V) [51], the two oxidation potentials
were then converted into +0.39 V and +0.99 V respectively for comparison with the
experimentally determined values of 2a.
Figure 2.6: Square scheme of stepwise oxidation of 2b to radical cation and dication.Gibbs free energies (∆G) are indicated in the unit of kJ mol−1.
The computational studies indicate that the two DTF moieties in the oligomer
should undergo two distinct steps of single-electron transfer to sequentially form rad-
ical cation and dication species. The theoretically predicted redox behaviour for
model compound 2b is consistent with the experimental results of compound 2a ob-
tained through cyclic voltammetric (CV) and differential pulse voltammetric (DPV)
analyses. Figure 2.7 shows the CV and DPV plots of 2a measured in CH2Cl2 with
Bu4NBF4 added as electrolyte. In the CV profile, two anodic peaks were observed
at +0.81 V and +1.03 V, which correspond to the formation of radical cation and
dication species. In the reverse scan, a cathodic peak emerges at +0.55 V. This peak
is due to the two-electron reduction of the TTFV moiety, resulting from the oxidative
40

dimerization of the DTF units [14–21]. Similarly, two oxidation peaks are seen in the
DPV plot of 2a at +0.74 V and +0.99 V. Compared with the computational results,
the experimental data shows a good agreement with the second oxidation potential
(E2ox), while for the first oxidation potential (E1
ox) the calculated value appears to be
lower than the experimental result by ca. 0.3−0.4 V. The discrepancy may arise from
overestimated π-delocalisation degree for the radical cation of 2b in solution phase,
since only the planar conformation was considered in the computational work.
Figure 2.7: (A) CV and (B) DPV profiles of 2a (1.33 ×10⁻³ M) measured in CH2Cl2at room temperature with Bu4NBF4 (0.1 M) as the supporting electrolyte, glassycarbon as the working electrode, Pt wire as the counter electrode, Ag/AgCl as thereference electrode. CV conditions: scan rate = 50 mV s−1. DPV conditions: scanrate = 20 mV s−1, pulse width = 20 mV, pulse period = 200 ms, pulse amplitude =50 mV, and step = 4 mV.
To further understand the electron-density contribution by different π-units in
the bis(DTF)-functionalized oligo(phenylene ethnylene)s, natural population analysis
(NPA) as proposed by Weinhold and co-workers [52] was performed on compound
2b. Figure 2.8 shows the NPA charge distribution between the DTF endgroup and
the central oligomer unit in the neutral, radical cation, and dication states. In the
41

Figure 2.8: NPA charge distribution for compound 2b in the neutral (Neu), radicalcation (RC), and triplet dication (DC(T)) sates. The values indicated are accumulatedNPA charges for the atoms in each shaded area.
neutral state, each of the DTF groups carries a slight positive charge of +0.066,
while the oligomer unit possesses a negative charge of −0.126. The result points to
a charge-transfer scenario from electron-donating DTF groups to the oligo(phenylene
ethynylene) unit. Upon oxidation to the radical cation, the DTF groups and oligomer
unit all gain significantly increased charge. Quantitatively, the NPA result shows that,
in the first step of single electron oxidation, 46% of electron density is extracted from
the two DTF groups and 54% taken from the central oligomer unit. This scenario is
in line with the highly delocalised nature of radical cation revealed by previous bond
length and spin-density analyses. For the second step of oxidation (i.e., from radical
cation to dication), the central oligomer unit shows a very tiny increase of +0.002 in
charge, while the accumulated charge of the two DTF groups are further increased
by +0.698, implying that electron density is predominantly extracted from the DTF
groups during the second oxidation.
2.3.3 Electrochromic Properties in Solution and in the Solid
State
The electronic absorption properties of compound 2a were investigated in solution
phase as well as the solid state by UV-Vis absorption spectroscopy. Figure 2.9A shows
42

the absorption spectrum of 2a determined in CH2Cl2, in which two π → π∗ transition
bands are clearly seen at 412 nm and 322 nm. The experimental data of 2a appear to
be consistent with the TD-DFT calculations that 2b gives two absorption bands at 471
nm and 352 mm as shown in Figure 2.9D. The peak at 471 nm is mainly attributed
to the HOMO→LUMO transition, while the peak at 352 nm is mainly due to the
HOMO−1→LUMO+1 transition. From Figure 2.5, it can be seen that the HOMO
and LUMO of 2b have similar symmetry and spatial distribution, and so do the
HOMO−1 and LUMO+1 orbitals. The HOMO→LUMO+1 and HOMO−1→LUMO
transitions, on the other hand, are forbidden as a result of their mismatching spatial
distribution.
The solid-state UV-Vis spectrum of 2a was measured from a thin film cast on
a quartz slide (Fig 2.9B). Unlike the spectrum obtained in solution, the solid-state
spectrum shows only one absorption peak at 424 nm, matching the HOMO→LUMO
transition, whereas the other transition band at 352 nm is barely distinguishable.
The thin film was then placed in an iodine chamber to be oxidized by iodine vapour
at room temperature for 30 min. According to the electrochemical data, oxidation
of compound 2a leads to sequential formation of radical cation and dication species.
The UV-Vis spectrum of oxidized 2a in solid thin film (Figure 2.9C) shows a wide
absorption profile extending to 800 nm, indicating the formation of cationic species
after iodine oxidation. Unfortunately, the UV-Vis spectrum of oxidized 2a appears to
be broad and featureless. As a result, it cannot be used to make good match with any
of the TD-DFT calculated spectra for oxidized 2a (Figure 2.9D−F) to convincingly
elucidate the nature of the oxidized species. Nevertheless, this dilemma has been
solved by Raman spectroscopic analysis (vide infra).
43

Figure 2.9: (A) Normalized UV-Vis absorption spectrum of 2a measured in CH2Cl2at room temperature. (B) UV-Vis absorption spectrum of the thin film of 2a cast ona quartz slide. (C) UV-Vis absorption spectrum of the thin film of 2a measured afterexposure to iodine vapour for 30 min. (D) Calculated UV-Vis absorption spectrum(normalized) of 2b. (E) Calculated UV-Vis absorption spectrum (normalized) of theradical cation of 2b. (F) Calculated UV-Vis absorption spectra (normalized) of thedications of 2b in the singlet and triplet states.
44

2.3.4 Raman Analysis
The thin film of 2a was exposed to iodine vapour in a glass chamber to induce chemical
oxidation in the solid state. This process was monitored by Raman spectroscopy, and
the spectra obtained at various time periods of oxidation are shown in Figure 2.10.
Figure 2.10: Raman spectroscopic analysis monitoring the thin film of 2a upon ex-posure to iodine vapour at various time periods. The baselines of the spectra werecorrected using the Fityk software (free version 0.9.8) [53].
To better understand the origins of the Raman bands experimentally observed,
the Raman spectra of model compound 2b in the neutral and oxidized states were
theoretically predicted based on DTF calculations. The calculated Raman spectra are
shown in Figure 2.11, and detailed spectral assignments and descriptions of Raman-
active vibrational eigenvectors can be found in the Appendix A.
Comparatively, the spectral patterns of the neutral thin film of 2a agree those
calculated for model compound 2b very well in the range of ca. 1000 to 1700 cm−1, a
region mainly due to the stretching of C=C bonds and bending of C−H bonds. Ex-
45

Figure 2.11: Raman spectra of compound 2b in different oxidation states calculatedat the B3LYP/6-31++G(d,p) level of theory.
perimentally, the Raman spectrum of the neutral 2a gives two significant vibrational
bands at 1571 cm−1 and 1590 cm−1, which reasonably match the DFT calculated C=C
stretching (mode III at 1621 cm−1) and a combination of C=C stretching and C−H
rocking (mode II at 1640 cm−1) modes. The detailed descriptions of the vibrational
eignevectors are provided in Figure 2.12. Besides, a strong Raman band at 1126 cm−1
can be clearly seen, the origin of which is ascribed to the C−H rocking theoretically
calculated at 1145 cm−1 (mode I). For the stretching of C≡C bonds, however, the ex-
perimentally observed band at 2206 cm−1 exhibits a much weaker relatively intensity
than that in the DFT predicted spectrum. The discrepancy between the experimental
and theoretical data may arise from a solid-state packing effect.
After exposing the solid film of 2a to iodine vapour for 10 min, more vibrational
bands emerge in the Raman spectrum in the range from ca. 900 to 1600 cm−1. The
46
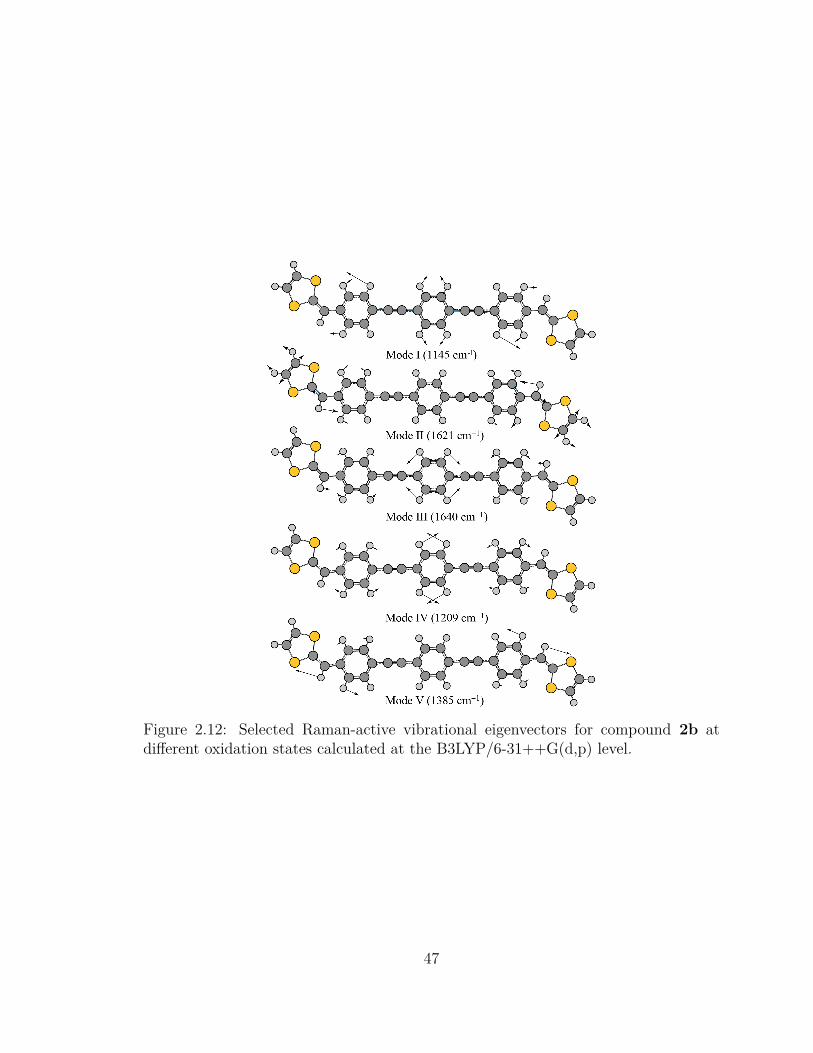
Figure 2.12: Selected Raman-active vibrational eigenvectors for compound 2b atdifferent oxidation states calculated at the B3LYP/6-31++G(d,p) level.
47

resulting spectral patterns match reasonably well with the calculated Raman spectrum
simulating a mixture of neutral, radical cation and triplet dication in a 10:1:1 ratio (see
Figure 2.10). In particular, good agreements can be found for the vibrational bands
due to the C=C stretching, C−H scissoring, and C−H rocking modes as highlighted
in Figure 2.13. As the oxidation proceeded further with increased exposure time to
iodine vapour, the C≡C and C=C stretching and C−H rocking (modes II and III)
bands disappeared in the Raman spectra (see Figure 2.10). The resulting spectra
show a very significant band at 1291 cm−1 along with several other relatively weak
bands in the region of 1200 to 1600 cm−1. The patterns of highly oxidized thin film
of 2a resemble those of triplet dication of 2b, suggesting the dominant species after
exhaustive oxidation in the solid state is triplet dication.
Figure 2.13: Comparison of (A) the Raman spectrum for the thin film of 2a uponexposure to iodine vapour for 10 min and (B) the simulated Raman spectrum for amixture of 2b in neutral, radical cation, and triplet dication states at a 10:1:1 molarratio.
The joint experimental and theoretical Raman study has allowed an in-depth un-
48

derstanding of the chemical oxidation reactions of bis(DTF)-encapped oligo(phenylene
ethynylene)s in the solid state. Consistent with the solution phase redox behaviour
as revealed by the electrochemical characterizations, the solid film of 2a is believed
to undergo stepwise single-electron transfers, forming radical cation and dication se-
quentially. The dication is in the triplet state as evidenced by Raman analysis. In
the meantime, DFT calculations in the gas phase corroborate that the triplet dica-
tion is more stable than the singlet dication by 16.73 kJ/mol. The solid film of 2a
after exposure to iodine vapour for about 1 hour was then placed under air to allow
the iodine adsorbed in the solid film to be dissipated slowly by vapourisation. After
two weeks, the thin film was re-examined by Raman spectroscopy, and the resulting
Raman spectrum was found to be similar to the spectrum of the initial neutral thin
film. This observation suggests that the DTF oxidative coupling reaction (as shown
in Figure 2.1), unlike in solution phase, occurs at a rather slow rate in the solid state.
2.3.5 Surface Self-assembling Properties
The morphologies of the thin films of 2b cast on solid substrates were analyzed by
atomic force microscopic (AFM) measurements. In the AFM experiments, two sub-
strates were used, freshly cleaved mica and highly ordered pyrolytic graphite (HOPG),
in order to assess the effects of substrate on the microscopic aggregation behaviour.
Figure 2.14A shows the AFM image for the thin film of 2b on a mica surface. The ag-
gregates of 2b on mica exhibit a certain degree of directional ordering, giving oblong
shaped micro-domains with an average length on the micron scale. On the surface
of HOPG, similar aggregation features can be seen (Fig. 2.14C), however, the dimen-
sions of the oblong microstructures appear to be much smaller. It is known that the
surface of mica contains polar and negatively charge functional groups, while the sur-
face of HOPG is made of hydrophobic polycyclic aromatic hydrocarbons. The AFM
49

results hence suggest that the nature of the substrate surface can significantly affect
the dimension of DTF-oligomer aggregates, but does not cause too much change in
shape.
Figure 2.14: AFM images of compound 2b (A) on freshly cleaved mica surface, (B)on mica after oxidation with iodine for 30 min, (C) on freshly cleaved HOPG, and(D) on HOPG after oxidation with iodine for 30 min.
After oxidation with iodine vapour for ca. 30 min, the surface morphologies for
the thin films of 2b show dramatic changes (see Figure 2.14B and D). On mica, the
closely packed oblong assemblies completely disappear, while some kind of flake-like
nanoassemblies can be observed in certain areas. The dimensions of these “flakes”
are on the scale of a few hundreds of nanometers. On HOPG, relatively uniform
droplet-like micro-domains were seen on the surface after oxidation (Figure 2.14D).
The dimensions of these “droplets” range from tens to hundreds of nanometers. Ob-
50

viously, the thin film of 2a on HOPG gains better ordering and uniformity after
oxidation. The improved inter-facial organization can be ascribed to the hydrophobic
interactions between the HOPG surface and the dication of 2a.
The aforementioned spectroscopic studies suggest that 2a does not undergo sig-
nificant polymerization in the solid state after oxidation. Hence, it is reasonable to
assume that the reconstruction of the surface morphologies is mainly driven by the
ionic interactions between the dications of 2b in the solid aggregates. Repulsive forces
are likely to play a major role, causing drastic changes in the sizes and shapes of ag-
gregates at the microscopic level. Furthermore, what turns out to be interesting is
that ordered nanoparticles were only formed on the surface HOPG, suggesting that
the substrate effect indeed plays a key role here. Detailed mechanisms for the surface
self-assembling processes require further investigation under more systematically con-
trolled experimental conditions are to be disclosed. Overall, the current AFM study
confirms that the thin film morphology of 2b shows redox-regulated responsiveness,
and such behaviour may be utilized to exert bottom-up controls over the microscopic
organisation of DTF-fuctionalised π-oligomers in the solid state.
2.4 Conclusions
This work has examined the properties of bis(DTF)-endcapped oligo(phenylene ethyny-
lene)s 2 by a joint experimental and theoretical study. The two DTF groups undergo
sequential single electron transfers upon oxidation leading to the formation of radical
cation and dication species in both solution phase and the solid state. The redox prop-
erties characterized by solution-phase electrochemical analysis are consistent with the
ionization energies elicited from DFT calculations. Of the oxidized species, the radical
cation form has a higher degree of π-electron delocalisation than the dication form.
51
For the dication, the triplet state is be energetically more stable than the singlet state
according to DFT calculations, and this has been corroborated by Raman analysis.
In the solution phase, oxidative polymerisation of 2a was observed to take place
upon electrochemical oxidation in our previous study [38]. In this work, however,
the electrochemical reactivity of 2a was found to be insignificant in the solid state.
Finally, the microscopic morphological properties for the thin film of 2a have been
observed to show responsiveness to different redox states. The nature of substrate also
appears to be a significant factor influencing the sizes and shapes of nano-assemblies on
surface. Currently, DTF-functionalized π-oligomers have begun to attract growing in-
terest in molecular electronic and optoelectronic applications. Our studies hence con-
tribute useful knowledge to the development of redox-active functional π-conjugated
oligomers and polymers.
Bibliography
[1] G Inzelt. Conducting polymers: a new era in electrochemistry. Springer, Berlin,
2008.
[2] Toshikazu Hirao. Redox systems under nano-space control. Springer, Berlin,
2006.
[3] Jean Roncali. Conjugated poly (thiophenes): synthesis, functionalization, and
applications. Chem. Rev., 92:711–738, 1992.
[4] Jean Roncali. Synthetic principles for bandgap control in linear π-conjugated
systems. Chem. Rev., 97:173–206, 1997.
[5] Toshikazu Hirao. Conjugated systems composed of transition metals and redox-
active π-conjugated ligands. Coord. Chem. Rev., 226:81–91, 2002.
52

[6] Bradley J Holliday and Timothy M Swager. Conducting metallopolymers: the
roles of molecular architecture and redox matching. Chem. Commun., pages
23–36, 2005.
[7] Hamad Khalid, Haojie Yu, Li Wang, Wael A Amer, Muhammad Akram, Nasir M
Abbasi, Muhammad Saleem, et al. Synthesis of ferrocene-based polythiophenes
and their applications. Polym. Chem., 5:6879–6892, 2014.
[8] Raquel Gracia and David Mecerreyes. Polymers with redox properties: materials
for batteries, biosensors and more. Polym. Chem., 4:2206–2214, 2013.
[9] Nazario Martín. Tetrathiafulvalene: the advent of organic metals. Chem. Com-
mun., 49:7025–7027, 2013.
[10] José L Segura and Nazario Martín. New concepts in tetrathiafulvalene chemistry.
Angew. Chem. Int. Ed., 40:1372–1409, 2001.
[11] Mogens Brøndsted Nielsen, Christian Lomholt, and Jan Becher. Tetrathiaful-
valenes as building blocks in supramolecular chemistry II. Chem. Soc. Rev.,
29:153–164, 2000.
[12] Martin R Bryce. Current trends in tetrathiafulvalene chemistry: towards in-
creased dimensionality. J. Mater. Chem., 5:1481–1496, 1995.
[13] David Canevet, Marc Salle, Guanxin Zhang, Deqing Zhang, and Daoben Zhu.
Tetrathiafulvalene (TTF) derivatives: key building-blocks for switchable pro-
cesses. Chem. Commun., pages 2245–2269, 2009.
[14] Yuming Zhao, Guang Chen, Karimulla Mulla, Ilias Mahmud, Shuai Liang, Pra-
teek Dongare, David W. Thompson, Louise N. Dawe, and Stephen Bouzan.
53

Tetrathiafulvalene vinylogues as versatile building blocks for new organic ma-
terials. Pure Appl. Chem., 84:1005–1025, 2012.
[15] Michael Bendikov, Fred Wudl, and Dmitrii F Perepichka. Tetrathiafulvalenes,
oligoacenenes, and their buckminsterfullerene derivatives: The brick and mortar
of organic electronics. Chem. Rev., 104:4891–4946, 2004.
[16] Jean Roncali. Linearly extended π-donors: when tetrathiafulvalene meets conju-
gated oligomers and polymers. J. Mater. Chem., 7:2307–2321, 1997.
[17] Adrian J Moore and Martin R Bryce. New vinylogous tetrathiafulvalene (TTF)
π-electron donors. Tetrahedron Lett., 33(10):1373–1376, 1992.
[18] Lianhe Yu and Daoben Zhu. New vinylogous tetrathiafulvalene π-electron donors
with lower oxidation potentials. Chem. Commun., pages 787–788, 1997.
[19] Hiroshi Kato and Tomoshige Kobayashi. Nonplanar tetrathiafulvalene viny-
logues. Adv. Mater., 5:750–751, 1993.
[20] Michel Guerro and Dominique Lorcy. A simple route to novel functionalized
tetrathiafulvalene vinylogues. Tetrahedron Lett., 46:5499–5502, 2005.
[21] Philippe Hapiot, Dominique Lorcy, André Tallec, Roger Carlier, and Albert
Robert. Mechanism of dimerization of 1, 4-dithiafulvenes into TTF vinylogues.
J. Phys. Chem., 100:14823–14827, 1996.
[22] Karimulla Mulla and Yuming Zhao. TTFV molecular tweezers with phenyl-
boronic acid and phenylboronate endgroups: modular synthesis and electrochem-
ical responses to saccharides and fluoride ion. Tetrahedron Lett., 55:382–386,
2014.
54

[23] Karimulla Mulla, Haseena Shaik, David W Thompson, and Yuming Zhao. TTFV-
based molecular tweezers and macrocycles as receptors for fullerenes. Org. Lett.,
15:4532–4535, 2013.
[24] Karimulla Mulla, Prateek Dongare, David W Thompson, and Yuming Zhao.
Click synthesized dianthryl–TTFV: an efficient fluorescent turn-on probe for
transition metal ions. Org. Biomol. Chem., 10(13):2542–2544, 2012.
[25] Julien Massue, Nathalie Bellec, Michel Guerro, Jean-François Bergamini,
Philippe Hapiot, and Dominique Lorcy. Crown ether vinylogous tetrathiafulva-
lene receptors: Complexation interference on the molecular movements triggered
by electron transfer. J. Org. Chem., 72:4655–4662, 2007.
[26] Dominique Lorcy, Michel Guerro, Jean-François Bergamini, and Philippe Hapiot.
Vinylogous tetrathiafulvalene based podands: complexation interferences on the
molecular movements triggered by electron transfer. J. Phys. Chem. B, 117:5188–
5194, 2013.
[27] Elodie Gontier, Nathalie Bellec, Pierre Brignou, Arnaud Gohier, Michel Guerro,
Thierry Roisnel, and Dominique Lorcy. Pyridyldithiafulvenes as precursors of
coordination-driven self-assembled redox active macrocycle. Org. Lett., 12:2386–
2389, 2010.
[28] Michel Guerro, Roger Carlier, Kamal Boubekeur, Dominique Lorcy, and Philippe
Hapiot. Cyclic vinylogous TTF: a potential molecular clip triggered by electron
transfer. J. Am. Chem. Soc., 125:3159–3167, 2003.
[29] Guang Chen, Stephen Bouzan, and Yuming Zhao. Synthesis and properties of
TTFV-hinged molecular tweezers. Tetrahedron Lett., 51:6552–6556, 2010.
55

[30] Guang Chen, Ilias Mahmud, Louise N Dawe, and Yuming Zhao. Acetylenic
phenyldithiafulvene: a versatile synthon for TTFV-based macromolecules. Org.
Lett., 12:704–707, 2010.
[31] Guang Chen, Ilias Mahmud, Louise N Dawe, Lee M Daniels, and Yuming Zhao.
Synthesis and properties of conjugated oligoyne-centered π-extended tetrathiaful-
valene analogues and related macromolecular systems. J. Org. Chem., 76:2701–
2715, 2011.
[32] Guang Chen and Yuming Zhao. Redox-regulated rotary motion of a bis (9-
triptycyl)-TTFV system. Org. Lett., 16:668–671, 2014.
[33] Olivier Alévêque, Pierre Frère, Philippe Leriche, Tony Breton, Antonio Cravino,
and Jean Roncali. Effects of aromatic spacers on the properties of organic field
effect transistors based on π-extended tetrathiafulvalene derivatives. J. Mater.
Chem., 19:3648–3651, 2009.
[34] Kunpeng Guo, Keyou Yan, Xiaoqing Lu, Yongcai Qiu, Zhike Liu, Jianwei Sun,
Feng Yan, Wenyue Guo, and Shihe Yang. Dithiafulvenyl unit as a new donor for
high-efficiency dye-sensitized solar cells: synthesis and demonstration of a family
of metal-free organic sensitizers. Org. Lett., 14:2214–2217, 2012.
[35] Kunpeng Guo, Junli Yang, Xiaofan Shi, Xiaoqing Lu, Jun Cheng, Yuling Wu,
Yun Guo, and Hua Wang. A pi-extended tetrathiafulvene derivative: Synthesis
and photoluminescence properties. Mater. Chem. Phys., 146:193–197, 2014.
[36] Christian R. Parker, Edmund Leary, Riccardo Frisenda, Zhongming Wei,
Karsten S. Jennum, Emil Glibstrup, Peter Bæch Abrahamsen, Marco Santella,
Mikkel A. Christensen, Eduardo Antonio Della Pia, Tao Li, Maria Teresa Gon-
zalez, Xingbin Jiang, Thorbjørn J. Morsing, Gabino Rubio-Bollinger, Bo W.
56

Laursen, Kasper Nørgaard, Herre van der Zant, Nicolas Agrait, and Mo-
gens Brøndsted Nielsen. A comprehensive study of extended tetrathiafulvalene
cruciform molecules for molecular electronics: synthesis and electrical transport
measurements. J. Am. Chem. Soc., 136:16497–16507, 2014.
[37] Zhongming Wei, Tim Hansen, Marco Santella, Xintai Wang, Christian R. Parker,
Xingbin Jiang, Tao Li, Magni Glyvradal, Karsten Jennum, Emil Glibstrup, Nico-
las Bovet, Xiaowei Wang, Wenping Hu, Gemma C. Solomon, Mogens Brøndsted
Nielsen, Xiaohui Qiu, Thomas Bjørnholm, Kasper Nørgaard, and Bo W. Laursen.
Molecular heterojunctions of oligo(phenylene ethynylene)s with linear to cruci-
form framework. Adv. Func. Mater., 25:1700–1708, 2015.
[38] Karimulla Mulla and Yuming Zhao. When dithiafulvenyl functionalized pi-
conjugated oligomers meet fullerenes and single-walled carbon nanotubes. J.
Mater. Chem. C, 1:5116–5127, 2013.
[39] Tracey M. Clarke, Keith C. Gordon, David L. Officer, and Daina K. Grant.
The effect of oxidation on the structure of styryl-substituted sexithiophenes: A
resonance Raman spectroscopy and density functional theory study. J. Chem.
Phys., 124:164501, 2006.
[40] John C. Earles, Keith C. Gordon, David L. Officer, and Pawel Wagner. A spectro-
scopic and computational study of the neutral and radical cation species of conju-
gated aryl-substituted 2,5-bis(2-thien-2-ylethenyl)thiophene-based oligomers. J.
Phys. Chem. A, 111:7171–7180, 2007.
[41] Reyes Malave Osuna, Rocio Ponce Ortiz, Victor Hernández, Juan
Teodomiro Lopez Navarrete, Makoto Miyasaka, Suchada Rajca, Andrzej Ra-
jca, and Rainer Glaser. Helically annelated and cross-conjugated beta-
57

oligothiophenes: a fourier transform Raman spectroscopic and quantum chemical
density functional theory study. J. Phys. Chem. C, 111:4854–4860, 2007.
[42] Sandra R. González, Yutaka Ie, Yoshio Aso, Juan T. Løpez Navarrete, and Juan
Casado. The frontiers of quinoidal stability in long oligothiophenes: Raman
spectra of dicationic polaron pairs. J. Am. Chem. Soc., 133:16350–16353, 2011.
[43] M. J. Frisch, G. W. Trucks, H. B. Schlegel, G. E. Scuseria, M. A. Robb, J. R.
Cheeseman, G. Scalmani, V. Barone, B. Mennucci, G. A. Petersson, H. Nakatsuji,
M. Caricato, X. Li, H. P. Hratchian, A. F. Izmaylov, J. Bloino, G. Zheng, J. L.
Sonnenberg, M. Hada, M. Ehara, K. Toyota, R. Fukuda, J. Hasegawa, M. Ishida,
T. Nakajima, Y. Honda, O. Kitao, H. Nakai, T. Vreven, J. A. Montgomery, Jr.,
J. E. Peralta, F. Ogliaro, M. Bearpark, J. J. Heyd, E. Brothers, K. N. Kudin,
V. N. Staroverov, R. Kobayashi, J. Normand, K. Raghavachari, A. Rendell, J. C.
Burant, S. S. Iyengar, J. Tomasi, M. Cossi, N. Rega, J. M. Millam, M. Klene,
J. E. Knox, J. B. Cross, V. Bakken, C. Adamo, J. Jaramillo, R. Gomperts, R. E.
Stratmann, O. Yazyev, A. J. Austin, R. Cammi, C. Pomelli, J. W. Ochterski,
R. L. Martin, K. Morokuma, V. G. Zakrzewski, G. A. Voth, P. Salvador, J. J.
Dannenberg, S. Dapprich, A. D. Daniels, ?. Farkas, J. B. Foresman, J. V. Or-
tiz, J. Cioslowski, and D. J. Fox. Gaussian 09 Revision D.01. Gaussian Inc.
Wallingford CT 2009.
[44] Axel D. Becke. A new mixing of Hartree-Fock and local density-functional the-
ories. J. Chem. Phys., 98:1372–1377, 1993.
[45] Erich Runge and E. K. U. Gross. Density-functional theory for time-dependent
systems. Phys. Rev. Lett., 52:997–1000, 1984.
58

[46] Roy Dennington, Todd Keith, and John Millam. GaussView Version 5. Semichem
Inc. Shawnee Mission KS 2009.
[47] Jacopo Tomasi, Benedetta Mennucci, and Roberto Cammi. Quantum Mechanical
Continuum Solvation Models. Chemical Reviews, 105(8):2999–3094, 2005.
[48] Miklos. Kertesz and Yong S. Lee. Energy gap and bond length alternation in het-
erosubstituted narrow gap semiconducting polymers. J. Phys. Chem., 91:2690–
2692, 1987.
[49] J. L. Brédas. Relationship between band gap and bond length alternation in
organic conjugated polymers. J. Chem. Phys., 82:3808–3811, 1985.
[50] J. Roncali. Molecular Engineering of the Band Gap of π-Conjugated Systems:
Facing Technological Applications. Macromol. Rapid Commun., 28:1761–1775,
2007.
[51] R. G. Bates and V. E. Bower. J. Res. Natl. Bur. Stand., 53:283–290, 1954.
[52] Alan E. Reed, Robert B. Weinstock, and Frank Weinhold. Natural population
analysis. J. Chem. Phys., 83:735–746, 1985.
[53] M. Wojdyr. Fityk: a general-purpose peak fitting program. J. Appl. Cryst.,
43:1126–1128, 2010.
59

Chapter 3
Adsorption of Dithiafulvene
Derivatives on an Au (111):
Orientational Geometry, Binding
Energies and Work Function
3.1 Introduction
For decades the interplay between organic molecules and various metal surfaces has
drawn considerable research attention, since the electronic properties of metal surfaces
(e.g., work function) can be readily altered and controlled by surface functionalization
with self-assembled monolayers (SAMs) of rationally designed molecules [1, 2]. Fun-
damental understanding of this phenomenon has greatly enriched the methodologies
for modifying metal surfaces with specific functionalities, which in turn lead to wide
applications in nanomaterials, molecular optoelectronic devices, and catalysis [3, 4].
Sulfur-containing π-conjugated heterocycles such as thiophene, dithiafulvene (DTF),
60

and tetrathiafulvalene (TTF) are π-electron donors that are often used as building
blocks for the preparation of organic conducting and semiconducting oligo-/polymers.
Over the past few years, the adsorption behavior of thiophenes, TTFs and relevant
aromatic molecules on noble metal surfaces has been subject of active experimental
and theoretical investigations [5–7]. The interactions between these organic molecules
and metal surfaces lead to significantly modulated surface properties, such as work
function (ϕ), metal-organic junction, and charge injection/transport, which are crucial
to the performance of thin film and molecular (opto-)electronic devices [8,9]. Recent
theoretical studies have disclosed that density functional theory (DFT) calculations
taking van der Waals exchange correlations into account and using localized basis sets
could describe the adsorption behavior of these aromatic molecules on metal surfaces
in a qualitatively good agreement with experimental results [5]. It is reported that
when thiophene or TTF is adsorbed on a metal surface (e.g., Au (111) or Cu(111))
at a low surface coverage, the molecule interacts with the surface in a “flat lying”
fashion. With increased surface coverage, a tilted orientation becomes more favored
for the surface-bound molecules [10].
As the half structure of TTF, dithiafulvene (DTF) also presents an excellent or-
ganic π-electron donor system, since it can form an aromaticity-stabilized radical
cation after releasing one electron. Unlike thiophene and TTF, there have been no
systematic studies on the interactions of DTF with noble metal surfaces in the cur-
rent literature. Many known DTF derivatives carry an arene moiety (e.g., phenyl,
naphthyl, and pyrenyl) directly connected to the DTF group due to their synthetic
accessibility. Such a motif allows the DTF derivatives to act as redox-active building
blocks in constructing complex π-conjugated oligomers, polymers, and macrocycles.
It can be readily envisioned that the arene unit in conjugation with DTF should
give rise to intriguing interactions with metal surfaces through various organic-metal
61

binding forces. A detailed study is therefore warranted to establish the fundamental
understanding on DTF−metal interactions as well as to seek potential applications
of DTF derivatives in surface science and nanotechnology.
At the outset of this study, a carboxylated phenyl-DTF 3a (Figure 3.1) was chosen
as a model compound for examination. Both theoretical modeling and experimental
analysis were carried out to characterize its adsorption behavior on an Au (111)
surface. Compound 3a was previously synthesized by Wang and Zhao as a building
block for redox-active coordination polymers, while the carboxylic group was designed
to serve as a ligand for binding with transition metal ions. In this work, it was
anticipated that the adsorption behavior of DTF 3a on an Au (111) surface would
be dictated by three major binding forces: van der Waals, Au−S and Au−COOH
interactions. Depending on the significance of each binding force, the possible binding
modes of 3a on an Au (111) were proposed to be “face-on”, “edge-on”, and “vertical”
as depicted in Figure 3.1B−E. It was also hypothesized that charge transfer between
DTF 3a and an Au (111) surface occurs to induce surface-enhanced Raman scattering
(SERS) effects, which might be of great interest to the research on chemical sensing
at organic-metal interfaces. The following sections describe the details addressing the
aspects mentioned above utilizing DFT calculations, Kelvin probe force microscopy
(KPFM), and Raman spectroscopic analyses.
3.2 Computational Methodology
3.2.1 Modeling the Gas-Phase Properties of DTF 3a
Density functional theory (DFT) calculations on the structural and electronic prop-
erties of compound 3a in the gas phase were conducted at the B3PW91/6-31+G(d,p)
level of theory [11] using the Gaussian 09 software package [12]. First, an optimized
62

Figure 3.1: (A) Molecular structure of carboxylated DTF 3a, and (B)−(E) fourpossible modes by which 3a can be bound to a metal surface.
geometry of 3a was computed and validated by frequency calculations to confirm
that it is indeed the ground state (i.e., zero imaginary frequencies). Raman spec-
troscopic properties were then calculated with the optimized structure. Simulated
Raman spectra and vibrational modes were visualized by GaussView 5 [13].
Figure 3.2 depicts the optimized structure of DTF 3a in the gas phase. As can
be seen, DTF 3a is not totally planar and there is a dihedral angle of 1.47◦ between
C4-C5-C3-S1. Molecular orbitals show that the HOMO is highly concentrated over the
C4, C3, S1 and S2 atoms, which are involved in electron donating and the oxidation
reaction. Furthermore, the LUMO is mainly localized over the benzene ring.
3.2.2 Modeling the Adsorption Behavior of DTF 3a on an
Au (111) Surface
DFT calculations on the adsorption behavior of compound 3a on the Au (111) surface
were carried out using the VASP 5.4.1 software package. Periodic calculations were
implemented based on the plane wave density functional theory within the projected
63

Figure 3.2: (A) and (B) Optimized structure of DTF 3a, which represents a dihedralangle of 1.47 degrees between the planes of C4-C5 and C3-S1. (C) Representation ofthe highest occupied and lowest unoccupied molecular orbitals of DTF 3a
augmented wave (PAW) to take into account the effect of core electrons on the valance
shell with the plane wave basis set to consider the valence electronic states. The
electron densities of non-dispersion calculations were obtained by using the generalized
gradient approximation (GGA), with an exchange-correlation functional of Perdew,
Burke and Enzerhof (PBE) [14–16]. The effect of the dispersion interactions was
considered by the use of optB86b-vdW functional [14,17–21] to include the non-local
nature of electron correlation. The gold slab, DTF 3a and the slab with the DTF
3a deposited on top were allowed to relax for geometry optimization until all forces
were smaller than 0.01 eV/Å [22]. The cut-off energy of 400 eV was used for all
calculations. The gamma point was found to be sufficient for Monkhorst Pack of the
integrals in the Brillouin zone in energy convergence. All outputs were visualized by
Virtual NanoLab version 2015.1.
The geometry of DTF 3a optimized by DFT calculations in the gas phase was
used for further optimization in large enough unit cells to avoid any interactions
between nearby molecules. Cell dimensions of the isolated molecule were optimized in
three directions to obtain the optimized cell dimensions in which nearby molecules do
64

not interact with one another (Appendix C). Results with and without considering
the dispersion correction show that the energy of the single molecule in the unit
cell reaches a plateau at 20×15×15 and remains consistent by increasing the cell
dimensions. Therefore, the lattice parameters of (α, β, γ = 90) and (a = 20, b =
15, c = 15) were adopted for the rest of the calculations to save computational costs.
The top layer of the gold slab and the molecule were allowed to relax until all forces
were smaller than 0.01 eV/Å for all relaxation convergences [22].
The FCC crystal structure of Au with lattice parameters of (α, β= 90, γ = 120)
and (a = 20, b = 15, c = 15) were optimized with PAW-DFT. The output was then
utilized building the four layers of 111 surface of the p(1×1) unit cell. The electronic
wave functions were sampled in a k-point grid of 21×21×21 and 5×5×1 for both
FCC crystal and slab structures. The calculated FCC lattice constant was found to
be 4.078, which almost matches the experimental value of 4.080. Two to six layers
and 15 to 20 Å of vacuum thickness on top of the slab were examined to achieve
efficient slab and vacuum thicknesses. The choice of the number of layers was decided
based on the comparison of the lattice constants and the total density of states of the
middle layer of the slab versus total density of state (DOS) of the bulk (Figure 3.3).
In all cases, the local DOS of the middle layer must match the bulk DOS. Moreover,
the vacuum should be thick enough so that the adsorbent on the top does not interact
with the surface in the cell above it. Eventually, four layers of Au (111) along with a
vacuum of 18 Å in the z direction were employed to simulate a real slab structure.
The optimized DTF 3a was then positioned on the Au (111) surface for further
optimization. Since the simulation of the metal-organic interface needs an appro-
priate initial geometry for the organic compound and substrate, a variety of initial
orientation geometries was evaluated and summarized in Figures 3.1 and 3.6 (more
details can be found in Appendix C). An internal layer Au−Au bond of the second
65

Figure 3.3: Total and projected density of states of (left) the bulk (right) and the Au(111). Total DOS of bulk closely matches the local DOS of the third layer of the slab.The numbering of the layers in the slab starts from the closest slab to the adsorbent.
and third layer of the gold slab was calculated to be 2.51 Å with and without the
dispersion correction being considered. The theoretically calculated data matches the
actual bond distance very well.
Because a perfectly ordered gold surface was used in the simulations, some discrep-
ancies between the calculated and experimental work functions were expected, since
the actual gold surface inevitably contains defects and disordered domains. Never-
theless, the gold substrates used in the experimental work are quite densely packed
metal surface and should give experimental results reasonably consistent with the
theoretical data.
3.3 Experimental Details
KPFM was performed at atmospheric pressure and room temperature using an MFP-
3D (Asylum Research) atomic force microscope (AFM), with a gold/platinum tip
(40 KHz, MikroMasch-CSC35) operating in the tapping mode at a scan rate of 0.1
Hz. The work function was calculated using the method implemented in the Asylum
66

Research software. In this technique, an electrostatic force between a conductive
tip and the sample is generated by applying an AC voltage of 1 mV to the sample.
The electrostatic forces are adjusted by a DC bias to match the contact potential
difference (CPD) between the tip and the sample. The work function of the sample
can be calculated by the sum of the work function of the cantilever and the contact
potential difference (Equation 3.1). The work function of the cantilever is calibrated
according to the known work function of highly ordered pyrolytic graphite (HOPG)
at 4.60 eV [23]. The CPD value of the HOPG is measured to be 0.17 eV. The work
function of the tip can be determined by Equation 3.2 [24].
CPD = ϕ(tip) − ϕ(sample) (3.1)
ϕ(sample) = 4.60eV + CPD(HOP G) − CPD(sample) (3.2)
X-ray diffraction (XRD) characterization ran by the Rigaku Ultima-IV instrument
using Cu K-α radiation. Raman spectroscopic analysis of the thin film of DTF 3a
was conducted on a Renishaw spectrometer excited at a wavelength of 633 nm.
3.4 Sample Preparation
Gold substrates with a thickness of 15 nm were prepared in a vacuum metal evaporator
built in the Merschrod lab. Gold wires were evaporated on cleaned glass slides under
a vacuum of 10−4 bar. The surface topography of one of these gold substrates was
examined by AFM, showing the presence of gold nano-islands across the surface. X-
ray powder diffraction of the gold surface reveals the Au (111) crystal orientation on
the surface (Appendix C).
DTF 3a was synthesized according to the reported procedures by Wang and Zhao
67

[25]. A solution of this compound was prepared by adding 0.1 mg [304.61 mmol] of
DTF 3a to 2 mL of organic solvent (methanol or toluene). Thin films of DTF 3a
were prepared by drop-casting the solution on gold substrates. Methanol and toluene
were used to prepare the AFM and Raman samples, respectively.
3.5 Results and Discussion
3.5.1 Crystallographic and Topographic Properties
Figure 3.4 shows the X-ray diffraction (XRD) patterns of the gold substrate with a
thickness of 15 nm. The peak at 37.5◦ is in line with the Au (111) structure. It
therefore confirms that that the Au (111) model used in the theoretical simulations
is a reasonable choice.
Figure 3.4: XRD patterns of the gold substrate prepared experimentally.
Figure 3.5A and B shows the representative AFM topography of the gold substrate
before and after depositing a thin film of DTF 3a on it. For comparison purpose, the
AFM image of DTF 3a thin film deposited on a glass slide is provided in Figure 3.5C.
It can be clearly seen from the AFM image of the bare gold substrate (Figure 3.5B)
68

Figure 3.5: AFM topography of (A) the bare gold substrate, (B) the gold substratewith a thin film of DTF 3a deposited on top of it, and (C) the thin film of DTF 3adeposited on a glass slide.
that discrete gold nano-islands are distributed all over the surface. The thin film of
3a deposited on the gold surface of gold substrate appears to assemble in a higher
uniformity than the thin film on glass slide. The better film forming behavior on gold
can be ascribed to the attraction between the π-electron density of 3a and a gold
surface. In the meantime, the presence of sulfur atoms in DTF 3a also engenders
Au−S interactions to enhance the binding to the gold surface. For the thin film on the
glass slide, the molecule/substrate interactions are not as significant. As a result, the
thin film topology shows randomly aggregated clusters rather than ordered features.
69

3.5.2 Geometric and Energetic Properties of DTF 3a on a
Gold Surface
The binding energy of each DTF 3a adsorbed on the Au (111) surface was calculated
according to Equation 3.3,
EB = ESA − (EA + ES) (3.3)
where EB is the calculated binding energy, EA is the total energy of the adsorbent
molecule, ES is the total energy of the slab and ESA is the total energy of the slab
with the absorbent molecule on the top of it. The total energy is the electronic
component without taking vibrational energies into account. The calculated binding
energies along with the corresponding Fermi energies, with and without considering
the dispersion correction, are provided in Appendix C.1. The absolute value of a
binding energy calculated with consideration of dispersion correction is much higher
than that calculated without dispersion correction.
The computational results indicate that among the several possible binding modes,
the face-on orientation gives rise to the strongest binding energy (with and without
the dispersion correction). Indeed, the face-on interaction allows the sulfur atoms
of the DTF to lie closer to the surface, achieving a synergistic effect of the strong
S−Au and π−Au attractions. Figure 3.6 illustrates two calculated geometries of a
DTF molecule adsorbed on the surface of a Au (111) slab, namely face-on and edge-on
modes.
On considering the van der Waals (vdW) interactions, the binding energies of DTF
3a on Au (111) surface are calculated to be −3.20 eV (face-on) and −3.01 eV (edge-
on) respectively. Calculations with consideration of vdW interactions give binding
energies of −0.28 eV (face-on) and −0.11 eV (edge-on). In both cases, face-on binding
70

Figure 3.6: Optimized structure of DTF 3a deposited on the surface of the Au (111).(A) and (B) show the face-on orientation at two different side views, (C) and (D)show two views of the edge-on orientation with a 42.8◦ angle between the plane of thebenzene ring and the surface of the slab.
appears to be more energetically favored over the edge-on binding by ca. 0.2 eV.
The non-covalent forces such as vdW seems to be a major contributor to the binding
energy. Generally speaking, a binding energy higher than 1.3 eV is considered to be
a strong adsorption [26].
Calculations with the dispersion correction show that the S1−slab distance is at
2.86 Å, while the SCH3 connected to C1 is at a closer distance of 2.55 Å to the slab.
Since the covalent Au−S bond distance is reported to be 2.46 Å [27], it is reasonable
to believe that the interactions of all the S atoms in DTF 3a with Au (111) surface
are of partial covalent bonding character. The dihedral angle between the S1-C3 and
C4-C5 bonds is calculated to be 6.9◦ for the single molecule of DTF 3a in the unit
cell and 4.8◦ when it is deposited on Au (111) surface. The central dihedral angle
is decreased by 2.1◦ after binding to Au (111) surface, resulting in a more flattened
shape of DTF 3a to gain stronger face-on interactions with the gold slab.
To assess the contribution of the SCH3 side groups to the binding energy, an anal-
ogous DTF molecule to 3a without the presence of SCH3 substituents on C1 and C2
was also calculated. The results show that the unsubstituted DTF molecule interacts
71
with the Au (111) surface to give a binding energy of −3.20 eV (with dispersion cor-
rection) or −0.29 eV (without dispersion correction). Upon comparing the binding
energies calculated for SCH3-substituted DTF 3a, the effects of SCH3 groups on the
binding energy can be deemed as negligible.
3.5.3 Raman Evidence for Geometrical Orientation
A Raman spectrum of the Au (111) substrate were taken before and after deposit-
ing the solutions of DTF 3a at different concentrations on the surface (shown in
Figure 3.7). As can be seen, the spectrum of the DTF 3a powder (Figure 3.7−B)
matches very well the simulated spectrum of the compound in the neutral state (Fig-
ure 3.7−A). The calculated C=O stretching peak at 1800 cm−1 is not observed in the
experimental spectra of DTF 3a measured in bulk solids and on Au (111) surface.
The exact reason for the disappearance of the C=O stretching band has not been fully
clarified. Intermolecular hydrogen bonding interactions through the carboxyl groups
of DTF 3a could be an important factor. The Raman spectrum of the bare gold can
be found in Appendix C.
The intensity of the broad experimental peak at 1451 cm−1 increases upon de-
creasing the concentration of the compound, which corresponds to the C=C bond
stretching of the benzene ring in the oxidized state. While the rest of the spectrum
agrees well with the spectrum of the neutral state, which can describe a partially oxi-
dized nature over the molecule due to the charge transfer between the gold substrate
and the compound (computational and experimental Raman spectra of DTF 3a in
the oxidized state are shown in Figure 4.8). Furthermore, the intensity of the peak
at 505 cm−1 is observed to significantly increase with decreasing concentration of the
compound. The relative intensity of the 505 cm−1 peak reaches its highest at the
lowest concentration of DTF 3a after washing the surface with deionized water. The
72

Figure 3.7: (A) Simulated Raman spectraum of DTF 3a in the gas phase obtained byB3PW91/6-31+G(d,p) level of theory. (B) Raman spectrum of the pure compoundin the solid state. (C−F) Raman spectrum of the DTF 3a on the surface of 15 nmAu (111) at different concentrations, starting from the lowest concentration on thebottom.
73

Figure 3.8: Vibrational modes of calculated peaks at 498, 519, 1453 cm−1.
corresponding peak is shifted to higher frequency for the bulk, which is assigned to
the out-of-plane vibrational modes of benzene and five member rings. The intensity
of the peaks mentioned above are greatly enhanced on the surface gold due to the
electronic interaction of molecular electron cloud and gold orbitals. The vibrational
modes of enhanced peaks are shown in Figure 3.8.
In-plane and out-of-plane vibration of the benzene ring is involved in all four peaks.
The results show that the molecule is bonded to the surface through the conjugated
π-electron cloud.
3.5.4 Work Function Modification
The work function of the gold substrate was calculated with and without considering
the dispersion correction. Experimentally, the work function was measured before and
after the deposition of the solution of DTF 3a. The work function (ϕ) is determined
by Equation 3.4.
Φ = Evac − εF (3.4)
Evac is the vacuum potential and εF is the Fermi level energy. The work function
of gold (FCC) is calculated to be 5.63 (5.67) eV, and the reported value is 5.30
eV [28]. Furthermore, the KPFM results show a value of 5.03 eV for the bare Au
(111) substrate, which is calculated to be 3.66 (3.57) eV and is reported as 4.72 eV in
74

the literature [29–31]. The measured work function of DTF 3a on the glass slide is
found to be 4.47 eV, which closely agrees with the calculated values with and without
the dispersion correction (4.43 (4.52) eV). The work function of DTF 3a at different
adsorption orientations on the Au (111) was calculated to be 3.30 ± 0.1 (3.40 ±
0.1) eV, which was measured to be 4.88 eV by the KPFM technique. The results
indicate that the molecular orientation does not impact the Φ values (all results are
reported in Appendix C). Moreover, the work function of the substrate decreases
both computationally and experimentally for 0.36 (0.17) and 0.15 eV, respectively.
Therefore, a thin film of DTF derivatives can be deposited on the gold surface to
modify the work function and electronic levels.
By removing the SCH3 groups on C1 and C2 atoms, the molecular work function
is calculated to be 4.50 (4.50) eV, while the work function of the gold substrate with
DTF deposited on top of it is computed to be 3.34 (3.41) eV. The absence of SCH3
groups leads to a slight decrease in the work function of the gold substrate by 0.32
(0.16) eV. It can therefore be concluded that the SCH3 groups do not play a major
role in modifying the work function of the substrate.
3.5.5 Charge Distribution
Adsorption of an organic π-conjugated molecule on the surface of a noble metal re-
sults in hybridization and charge re-distribution between the molecule and the metal
surface. The charge density differences in the Z direction (ρZ) are obtained with
Equation 3.5.
ρZ = ρ3a−Au − (ρ3a + ρAu) (3.5)
Herein ρ3a−Au is the charge density of the adsorbed DTF 3a on an Au (111), ρ3a
75

Figure 3.9: Iso-surfaces of difference charge distributions over adsorbent and surfaceat the top and side view with and without considering vdW interactions. The negativearea (green) shows the gaining of electrons, and the positive area (yellow) indicatesthe production of holes. The plot of charge distribution versus distance in the z-axiscan be seen on the right side of each type of calculation which is aligned with the sideview of the iso-surfaces.
and ρAu are the charge densities of the molecule and gold surface, respectively. The
charge difference iso-surfaces with and without considering the dispersion correction
are shown in Figure 3.9.
As can be seen in Figure 3.9 (right), only the first layer of the gold slab is in-
volved in charge perturbation with dispersion correction considered. Besides, the
negative charge migrates over the benzene ring and S1 while the hole or positive
charge appeared on S2, which matches very well the lowest unoccupied molecular
orbital (LUMO).
The charge density fluctuates over a much greater range of +6.0 and −0.08 e/Å3 in
the calculation without dispersion correction, which compares to +0.01 to −0.1 e/Å3
for the calculations with considering vdW interactions. The calculations without
dispersion correction show that the first two layers of the gold slab are involved in
76

charge distribution and the clear charge separation over the molecule and surface.
Most of the changes occurs over the molecule than the substrate. It can be concluded
that the calculations considering vdW interactions can significantly impact the charge
distribution. Furthermore, calculations with considering dispersion correction show
that transfer of negative charges occurs from the slab to the molecule.
3.5.6 Impact of Terminal Group on Electronic Properties
The impact of the substituents in the DTF molecule on the binding energy and elec-
tronic properties were investigated. As mentioned in Section 3.5.4, the orientational
geometry does not impact the work function. Therefore, the face-on orientation, in
which the dithiole ring is parallel to the surface of the slab, has been chosen for
studying the substituent effects on electronic properties. The list of Au−S1 distances
for optimized structures of DTF derivatives deposited on the gold surface is given in
Appendix C
Adsorption energy is defined as the difference of the Au (111) work functions
before and after deposition of a DTF molecule. Detailed absorption energy values for
DTF derivatives with six different substituents are calculated and listed in Table 3.1.
Molecular work function and polarizability values are provided in Appendix C.
µtot EB ΦDT F−Au ΦAu − ΦDT F−Au
NO2 8.1 −3.17 (−0.33) 3.36 (3.40) 0.30 (0.17)CN 7.2 −4.02 (−0.39) 3.26 (3.35) 0.40 (0.22)CHO 5.8 −3.02 (−0.14) 3.37 (3.42) 0.29 (0.15)OCH3 3.7 −3.24 (−0.29) 3.35 (3.36) 0.31 (0.21)Br 4.0 −3.24 (−0.49) 3.36 (3.37) 0.30 (0.20)NH2 3.4 −3.51 (−0.38) 3.35 (3.37) 0.31 (0.20)
Table 3.1: Adsorption energies (EB), work function of the Au (111) with depositedDTF on top (ΦDT F−Au) and the magnitude of drop in the work function of the Au(111) by deposition of DTF (ΦAu−ΦDT F−Au) with six different substituents (all valuesare reported in eV). The electric dipole moments (µtot) of the single molecule in thegas phase are investigated with B3LYP/6-31++G(d,p) level of theory.
77

Comparison of the binding energies shows that the dipole moments of the DTF
molecules are correlated to the binding energies. Calculations that include dispersion
correction show that the highest absolute value of binding energy belongs to the DTF
with CN substituent. The DTF with a CHO substituent has the weakest binding
affinity for the gold surface. The relatively high adsorption energies of the DTFs with
nitrogen-containing substituents, such as NO2, CN and NH2, suggest that nitrogen
can significantly contribute to the binding with the Au (111).
Comparison of the work function values shows that the work function can be varied
up to 0.1 eV by changing the substituent at the para position of the benzene ring.
The largest change in the work function is obtained by deposition of the DTF with
CN substituent. Furthermore, DTFs with CN and CHO show the highest and lowest
work functions, respectively.
The work function of the gold substrate changes as a function of the molecular
dipole moment of the DTF adsorbent, as a result of the formation of SAMs on the
substrate. There is a linearly proportional relationship between the work function
and the molecular dipole moment as described in Equation 3.6 [1].
∆ϕmol = −eµZ,mol
εoAΘΘ = −eµo,mol cos(β)
εoεeffAΘΘ (3.6)
µZ,mol is the Z component of molecular dipole, µo,mol is the molecular dipole mo-
ment, β is the tilt angle between the z axis through metal slab and the molecular
axis, εo is the vacuum permittivity, Θ is the surface coverage, εeff is the effective pa-
rameter that is dependent on the surface coverage and AΘ is the area of the unit cell
at the p(1×1) surface. So the higher molecular polarizability can lead to the easiest
circulation of loosely bound electron cloud over the molecule, which in turn results in
a better hybridization with the substrate. In our study, the binding energies do not
show a direct correlation with polarizability. Possibly, some other factors such as the
78

binding of the substituent to the substrate (face-on orientation on the gold surface)
also come into play in addition to the polarizability effect.
3.5.7 Substituent Effect on Charge Distribution
The plots of differences in charge distribution through z-axis along with iso-surfaces for
all DTF derivatives are shown in Figure 3.10 (iso-surfaces that are obtained without
considering vdW interactions are reported in Appendix C).
Iso-surfaces of all derivatives indicate that the electrons migrate over the sub-
stituent on the benzene ring and S1. The iso-surface at the interface of the molecule
and the slab illustrates that the charge migration occurs between the molecule and
the substrate, which happens through the dithiole side in all cases. Results show that
the interlayer of the slab is also involved in the charge disturbution, which could be
attributed to the higher molecular polarizability as discussed in the previous section.
Except DTF 3a, S1 and C1 gain a hole in all other DTF derivatives, whereas C4 loses
an electron in all molecules including DTF 3a. The DTF with the CN substituent
shows a slight fluctuation near zero in the range of −0.1 to +0.1 e/Å3, while the other
DTF molecules shows charge density differences in the range of −1.0 to +1.0 e/Å3.
Figure 3.11 shows the iso-surfaces and plots of integrated charge density changes
through the z-axis obtained by calculation without considering vdW interactions. As
can be seen, a clear charge separation occurs over the molecule and surface. The
common point between the calculations with and without the dispersion correction
is that the interlayers are involved in the charge distribution for all DTF derivatives
except DTF 3a. The major difference is that the charge density fluctuates at much
higher range from −4 to +4 e/Å3. The highest charge density is distributed over the
molecule rather than the slab. Therefore, vdW interactions play a major role in the
charge distribution and should be considered in 30further studies on charge transfer
79

Figure 3.10: Iso-surfaces of difference charge distribution over adsorbent and surfaceat top and side views with considering vdW interactions for (A) CHO (B) CN (C) NH2(D) NO2 (E) OCH3 substituents. The negative area (green) associated with gainingelectrons and the positive area (yellow) indicates the production of holes. The plot ofcharge distribution versus distance in the z-axis can be seen on the right side of eachtype of calculations which is aligned with the side view of the iso-surfaces.
80

Figure 3.11: Iso-surfaces of difference charge distribution over adsorbent and surfaceat top and side views without considering vdW interactions for (A) CHO (B) CN(C) NH2 (D) NO2 (E) OCH3 substituents. Negative area (green) shows the gainingof electrons and positive area (yellow) indicate the production of holes. The plot ofcharge distribution versus distance in the z-axis can be seen on the right side of eachtype of calculations which is aligned with the side view of the iso-surfaces.
81

properties.
3.6 Summary
In this chapter, DFT calculations were performed under periodic boundary conditions
to simulate the electronic properties of the SAM formation of DTF derivatives on the
surface of Au (111). The binding energy of the DTF 3a at eighteen different orienta-
tions on the substrate are calculated, and the most favored orientational geometry is
found to be a face-on mode through the dithiole ring. The Raman spectra of the DTF
compound on an Au (111) show that benzene vibrational modes at C3 and C4 are
involved in the molecule-substrate interactions, which lead to the face-on adsorption
mode and results in the highest hybridization between adsorbent and substrate. The
work functions of the gold surface before and after deposition of the DTF derivatives
was also computed. Computational results show that the work function of the gold
surface decreases upon adsorption of the DTF derivatives on the surface. As such,
the work function of the gold surface can be tuned by modification of the substituent
on the benzene ring of DTFs. The highest work function value to be computed was
the one for the DTF with the CN substituent. Experimentally measured work func-
tions by KPFM match very well the calculated values with and without the dispersion
correction. Among all derivatives, the DTF with CN substituent bind more strongly
than others. the DTF with the CHO substituent gives the weakest binding to the
gold surface. Finally, calculations with vdW interaction considered show that the
substituent on DTF has a significant impact on the charge redistribution between the
DTF molecule and the gold substrate.
82
Bibliography
[1] Elisabeth Verwüster, Oliver T. Hofmann, David A. Egger, and Egbert Zojer.
Electronic properties of biphenylthiolates on Au(111): the impact of coverage
revisited. J. Phys. Chem. C, 119:7817–7825, 2015.
[2] Silvio Osella, David Cornil, and Jerome Cornil. Work function modification of the
(111) gold surface covered by long alkanethiol-based self-assembled monolayers.
Phys. Chem. Chem. Phys., 16:2866–2873, 2014.
[3] Alexander S. Hyla, Paul Winget, Hong Li, Chad Risko, and Jean-Luc Brédas.
Work function reduction by a redox-active organometallic sandwich complex.
Org. Electron., 37:263 – 270, 2016.
[4] Yinhua Zhou, Canek Fuentes-Hernandez, Jaewon Shim, Jens Meyer, Anthony J.
Giordano, Hong Li, Paul Winget, Theodoros Papadopoulos, Hyeunseok Cheun,
Jungbae Kim, Mathieu Fenoll, Amir Dindar, Wojciech Haske, Ehsan Najafabadi,
Talha M. Khan, Hossein Sojoudi, Stephen Barlow, Samuel Graham, Jean-Luc
Brédas, Seth R. Marder, Antoine Kahn, and Bernard Kippelen. A universal
method to produce low–work function electrodes for organic electronics. 336:327–
332, 2012.
[5] Oliver T. Hofmann, Gerold M. Rangger, and Egbert Zojer. Reducing the metal
work function beyond pauli pushback: a computational investigation of tetrathi-
afulvalene and viologen on coinage metal surfaces. J. Phys. Chem. C, 112:20357–
20365, 2008.
[6] Siddharth J. Jethwa, Federico Grillo, Herbert A. Fruchtl, Grant J. Simpson,
Michael-John Treanor, Renald Schaub, Stephen M. Francis, Neville V. Richard-
son, and R. Alan Aitken. Adsorption of a dihydro-TTF derivative on Au(111) via
83

a thiolate complex bonding to gold adatoms. Chem. Commun., 50:10140–10143,
2014.
[7] Bruno Schuler, Shi-Xia Liu, Yan Geng, Silvio Decurtins, Gerhard Meyer, and
Leo Gross. Contrast formation in Kelvin probe force microscopy of single π-
conjugated molecules. Nano Lett., 14:3342–3346, 2014.
[8] Benjamin Bröker, Ralf-Peter Blum, Luca Beverina, Oliver T. Hofmann, Mauro
Sassi, Riccardo Ruffo, Giorgio A. Pagani, Georg Heimel, Antje Vollmer, Johannes
Frisch, Jürgen P. Rabe, Egbert Zojer, and Norbert Koch. A high molecular weight
donor for electron injection interlayers on metal electrodes. Chem. Phys. Chem.,
10:2947–2954, 2009.
[9] Patrizia Borghetti, Afaf El-Sayed, Elizabeth Goiri, Celia Rogero, Jorge Lobo-
Checa, Luca Floreano, Jose Enrique Ortega, and Dimas G. de Oteyza. Spectro-
scopic fingerprints of work-function-controlled phthalocyanine charging on metal
surfaces. ACS Nano, 8:12786–12795, 2014.
[10] Luiza Buimaga-Iarinca and Cristian Morari. Adsorption of small aromatic
molecules on gold: a DFT localized basis set study including van der Waals
effects. Theor. Chem. Acc., 133:1502, 2014.
[11] Axel D. Becke. A new mixing of Hartree-Fock and local density-functional the-
ories. J. Chem. Phys., 98:1372–1377, 1993.
[12] M. J. Frisch, G. W. Trucks, H. B. Schlegel, G. E. Scuseria, M. A. Robb, J. R.
Cheeseman, G. Scalmani, V. Barone, B. Mennucci, G. A. Petersson, H. Nakatsuji,
M. Caricato, X. Li, H. P. Hratchian, A. F. Izmaylov, J. Bloino, G. Zheng, J. L.
Sonnenberg, M. Hada, M. Ehara, K. Toyota, R. Fukuda, J. Hasegawa, M. Ishida,
T. Nakajima, Y. Honda, O. Kitao, H. Nakai, T. Vreven, J. A. Montgomery, Jr.,
84

J. E. Peralta, F. Ogliaro, M. Bearpark, J. J. Heyd, E. Brothers, K. N. Kudin,
V. N. Staroverov, R. Kobayashi, J. Normand, K. Raghavachari, A. Rendell, J. C.
Burant, S. S. Iyengar, J. Tomasi, M. Cossi, N. Rega, J. M. Millam, M. Klene,
J. E. Knox, J. B. Cross, V. Bakken, C. Adamo, J. Jaramillo, R. Gomperts, R. E.
Stratmann, O. Yazyev, A. J. Austin, R. Cammi, C. Pomelli, J. W. Ochterski,
R. L. Martin, K. Morokuma, V. G. Zakrzewski, G. A. Voth, P. Salvador, J. J.
Dannenberg, S. Dapprich, A. D. Daniels, ?. Farkas, J. B. Foresman, J. V. Or-
tiz, J. Cioslowski, and D. J. Fox. Gaussian 09 Revision D.01. Gaussian Inc.
Wallingford CT 2009.
[13] Roy Dennington, Todd Keith, and John Millam. GaussView Version 5. Semichem
Inc. Shawnee Mission KS 2009.
[14] Pedro O. Bedolla, Gregor Feldbauer, Michael Wolloch, Stefan J. Eder, Nicole
Dörr, Peter Mohn, Josef Redinger, and András Vernes. Effects of van der Waals
interactions in the adsorption of isooctane and ethanol on Fe(100) surfaces. J.
Phys. Chem. C, 118:17608–17615, 2014.
[15] Paulo V.C. Medeiros, G.K. Gueorguiev, and S. Stafström. Bonding, charge re-
arrangement and interface dipoles of benzene, graphene, and PAH molecules on
Au(111) and Cu(111). Carbon, 81:620 – 628, 2015.
[16] Yang Wang, Christian Urban, Jonathan Rodríguez-Fernández, José M. Gallego,
Roberto Otero, Nazario Martín, Rodolfo Miranda, Manuel Alcamí, and Fernando
Martín. Formation of self-assembled chains of tetrathiafulvalene on a Cu(100)
surface. J. Phys. Chem. A, 115:13080–13087, 2011.
[17] Ji ří Klimeš, David R. Bowler, and Angelos Michaelides. Van der Waals density
functionals applied to solids. Phys. Rev. B, 83:195131, 2011.
85

[18] M. Dion, H. Rydberg, E. Schröder, D. C. Langreth, and B. I. Lundqvist. Van
der Waals density functional for general geometries. Phys. Rev. Lett., 92:246401,
2004.
[19] Guillermo Román-Pérez and José M. Soler. Efficient implementation of a van der
Waals density functional: application to double-wall carbon nanotubes. Phys.
Rev. Lett., 103:096102, 2009.
[20] Valentino R. Cooper, Yungok Ihm, and James R. Morris. Hydrogen adsorption
at the graphene surface: a vdW-DF perspective. Physics Procedia, 34:34 – 38,
2012.
[21] Bhaskar Chilukuri, Ursula Mazur, and K. W. Hipps. Effect of dispersion on
surface interactions of cobalt(ii) octaethylporphyrin monolayer on Au(111) and
HOPG(0001) substrates: a comparative first principles study. Phys. Chem.
Chem. Phys., 16:14096–14107, 2014.
[22] Georg Heimel, Lorenz Romaner, Jean-Luc Brédas, and Egbert Zojer. Inter-
face energetics and level alignment at covalent metal-molecule junctions: π-
conjugated thiols on gold. Phys. Rev. Lett., 96:196806, 2006.
[23] M.M. Beerbom, B. Lägel, A.J. Cascio, B.V. Doran, and R. Schlaf. Direct com-
parison of photoemission spectroscopy and in situ Kelvin probe work function
measurements on indium tin oxide films. J. Electron. Spectrosc. Relat. Phenom.,
152:12 – 17, 2006.
[24] Wilhelm Melitz, Jian Shen, Sangyeob Lee, Joon Sung Lee, Andrew C. Kummel,
Ravi Droopad, and Edward T. Yu. Scanning tunneling spectroscopy and Kelvin
probe force microscopy investigation of Fermi energy level pinning mechanism on
InAs and InGaAs clean surfaces. J. Appl. Phys., 108, 2010.
86
[25] Yunfei Wang and Yuming Zhao. Carboxylated dithiafulvenes and tetrathiaful-
valene vinylogues: synthesis, electronic properties, and complexation with zinc
ions. Beilstein J. Org. Chem., 11:957–965, 2015.
[26] Scott Handy. Applications of ionic liquids in science and technology. InTech,
2011.
[27] Evangelina Pensa, Emiliano Cortés, Gastón Corthey, Pilar Carro, Carolina Ver-
icat, Mariano H. Fonticelli, Guillermo Benítez, Aldo A. Rubert, and Roberto C.
Salvarezza. The chemistry of the sulfur–gold interface: in search of a unified
model. Acc. Chem. Res., 45:1183–1192, 2012.
[28] W.M.H. Sachtler, G.J.H. Dorgelo, and A.A. Holscher. The work function of gold.
Surf. Sci., 5:221 – 229, 1966.
[29] Yingjie Zhang, Olivier Pluchery, Louis Caillard, Anne F Lamic Humblot, Sandra
Casale, Yves J. Chabal, and Miquel Salmeron. Sensing the charge state of single
gold nanoparticles via work function measurements. Nano Lett., 15:51–55, 2015.
[30] Anna L. Domanski, Esha Sengupta, Karina Bley, Maria B. Untch, Stefan A. L.
Weber, Katharina Landfester, Clemens K. Weiss, Hans-Jürgen Butt, and Rüdiger
Berger. Kelvin probe force microscopy in nonpolar liquids. Langmuir, 28:13892–
13899, 2012.
[31] H. L. Skriver and N. M. Rosengaard. Surface energy and work function of ele-
mental metals. Phys. Rev. B, 46:7157–7168, 1992.
87

Chapter 4
Reduction of Au (III) into Au
Nanoparticles by Dithiafulvenes in
Aqueous Media
4.1 Background
UV-Vis spectroscopy is a useful technique for detecting the presence of various metal
nanoparticles. Absorption of visible light by gold nanoparticles (AuNPs) is dependent
on the size of the particles. Nanoparticles usually absorb light in the range of 480
to 560 nm, which allows the growth of particles produced in solution to monitored.
In general, AuNPs can be synthesized by mixing a reducing agent with HAuCl4 in
a biphasic solution under certain conditions. Tuneable parameters for the reductive
synthesis of AuNPs include the reagent concentrations, stirring rate, and more im-
portantly the reaction temperature. The morphological properties of the produced
AuNPs, such as shape and size, are dependent on the applied conditions. Reduction of
HAuCl4 should be carried out in an appropriately chosen solvent and with a suitable
88

reductant to achieve size-control over the resulting nanoparticles.
The formation of AuNPs in solution can be characterized by UV-Vis spectroscopic
analysis; in particular, the absorption band at 520−620 nm is characteristic of AuNPs.
The solution of AuNPs absorbs the green light to give orange to red color depending on
the average size of the nanoparticles [1]. The wavelength of the absorption peak can be
useful for estimating the mean size of the AuNPs suspended in solution. Aggregation
and growth of AuNPs in size make the absorption band shift to longer wavelength
(620 nm), turning the color of the AuNP solution into blue [2]. Mechanistically, the
formation of AuNPs involves nucleation and growth steps. Addition of end-capping
agents with a high affinity for gold atoms (e.g., alkylthiols) can stabilize AuNPs by
forming a protecting layer to prevent AuNPs from further growth and agglomeration.
In this work, the reductive nature of DTF is taken advantage of for the synthesis
of AuNPs. Apart from being an effective reductant, DTF is also expected to act as
a stabilizing ligand binding with AuNPs due to the presence of sulfur atoms. This
would help prevent the AuNPs from agglomeration and keep the average size distri-
bution controlled under well-defined conditions, such as temperature, pH, and solvent
polarity. The following sections discuss on the experimental investigations of AuNPs
formation by treating Au(III) with DTF molecules in aqueous media. Computational
studies were also carried out in the mean time to gain deeper understanding on the
DTF−AuNP interactions at the molecular level.
4.2 Computational Methods
Density functional theory (DFT) calculations were performed using the Becke’s three
parameters exact exchange-function (B3) along with gradient-corrected correlation
function of Lee-Yang-Parr (LYP) and Perdew and Wang (PW91) that can predict
89

the best results for molecular geometry and vibrational frequencies of aromatic com-
pounds [3]. The 6-311+G(d,p) basis set was used to obtain the complete geometry
optimization and normal-mode analysis on isolated molecules in the ground state. The
values of all calculated vibrational modes indicate that the optimized molecular struc-
tures are the ground state rather than transition state structures. The polarizable
continuum model (PCM) was adopted to include the effect of solvent [4]. Excitation
energies and excited-state properties were calculated by time-dependent density func-
tional theory (TD-DFT) using the same functional and basis set as those used for
geometry optimization [5]. The structure of the gold group and compound-complex
were optimized using the B3LYP method with 6-31+G and LANL2DZ mixed basis
sets. All calculations were carried out using the Gaussian 09 software package and
the results were visualized by the GaussView 5.0.8 program [6,7].
4.3 Experimental Details
DTF 3a and 4a, as shown in Figure 4.1, were synthesized through the procedures
reported in Chapter 2 [8]. In these two compounds, the para position of the benzene
ring is substituted with carboxyl (DTF 3a) and methyl carboxylate (DTF 4a) re-
spectively, and they were both used for experimental investigations and comparative
studies in this chapter.
UV-Vis absorption spectra were recorded in solution or on solid thin films using
a Cary 6000i UV-Vis-NIR spectrophotometer. MFP-3D (Asylum Research) atomic
force microscope (AFM) was utilized to study the morphological properties of the thin
film surface with a silicon tip (NSC35/AIBS, MikroMasch) operated in the tapping
mode (scan rate 1 Hz). The nanostructures were also characterized by SEM. Raman
spectroscopic measurements of the thin film of 3a were conducted on a Renishaw
90
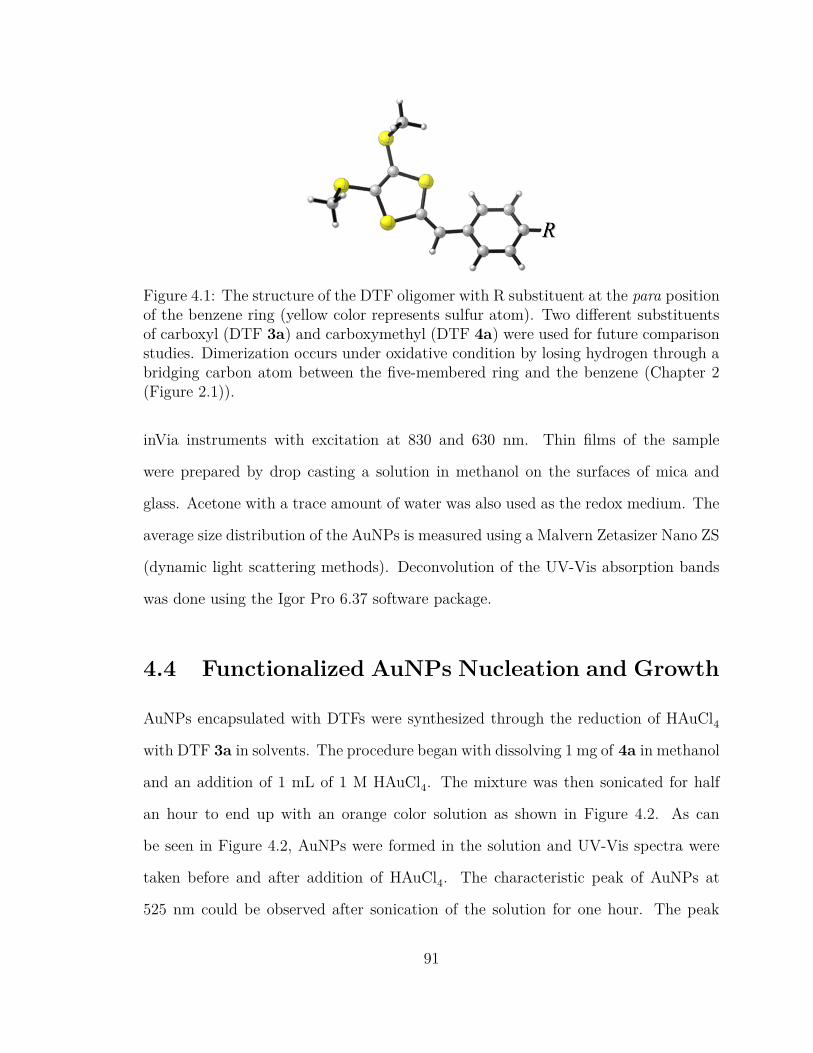
Figure 4.1: The structure of the DTF oligomer with R substituent at the para positionof the benzene ring (yellow color represents sulfur atom). Two different substituentsof carboxyl (DTF 3a) and carboxymethyl (DTF 4a) were used for future comparisonstudies. Dimerization occurs under oxidative condition by losing hydrogen through abridging carbon atom between the five-membered ring and the benzene (Chapter 2(Figure 2.1)).
inVia instruments with excitation at 830 and 630 nm. Thin films of the sample
were prepared by drop casting a solution in methanol on the surfaces of mica and
glass. Acetone with a trace amount of water was also used as the redox medium. The
average size distribution of the AuNPs is measured using a Malvern Zetasizer Nano ZS
(dynamic light scattering methods). Deconvolution of the UV-Vis absorption bands
was done using the Igor Pro 6.37 software package.
4.4 Functionalized AuNPs Nucleation and Growth
AuNPs encapsulated with DTFs were synthesized through the reduction of HAuCl4
with DTF 3a in solvents. The procedure began with dissolving 1 mg of 4a in methanol
and an addition of 1 mL of 1 M HAuCl4. The mixture was then sonicated for half
an hour to end up with an orange color solution as shown in Figure 4.2. As can
be seen in Figure 4.2, AuNPs were formed in the solution and UV-Vis spectra were
taken before and after addition of HAuCl4. The characteristic peak of AuNPs at
525 nm could be observed after sonication of the solution for one hour. The peak
91

at 372 nm disappeared, indicating that free DTF 4a molecules were all consumed
by the Au(III)/DTF redox reaction [9]. The average size of 30−50 nm is predicted
for the orange solution of AuNPs with the maximum absorption of 530 nm shown in
Figure 4.2 [2].
Figure 4.2: Left) The solution of 4a in methanol before (vial number one with yellowcolor) and after (vial number two with orange color) mixing it with the HAuCl4 andsonication for an hour. Right) The UV-Vis spectra of solution number one and twoas labeled. AuNPs peak at peak at 525 nm appeared after addition of the HAuCl4.
The AFM images of the synthesized nanoparticles on a mica surface were taken in
the tapping mode. The results are shown in Figure 4.4. As can be seen, flower-shaped
features are clearly observable. The indicated morphology is also confirmed by the
SEM image of carbon coated glass slides that are shown in Figure 4.3. SEM images
were not taken from a freshly prepared solution. Results indicate that the observed
features at the AFM images are not an artifact or impact of solvent evaporation on
the mica surface. The spherical feature with the approximate size of thousands of nm
has also appeared in the SEM image.
The mean size of AuNPs was measured to be 50 nm in the solution of methanol at
pH 10 using the zeta-sizer analyzer. The mean size of particles dramatically increases
to 800 nm at pH 6. Therefore, an acidic environment is thermodynamically more
92

Figure 4.3: SEM images of the AuNPs that are freshly prepared through redox reac-tion of 3a and gold acid.The film of solution on the glass slide was then coated witha layer of carbon for imaging.
Figure 4.4: AFM height image of the deposited AuNPs on freshly cleaved mica at twoscan areas. Left) the AFM image of the surface at 10×10 nm scan area. Right) Thefocused AFM image of the flower shape feature in 5×5 nm scan area.
93

favored for the oxidation reaction of 3a in which protons facilitate the oxidation
reaction.
Ethanol, water, THF, and acetone were also tested out to compare the reaction
rates of AuNP formation. The color change occurred at a much slower rate in acetone,
and a trace amount of water was necessary for the formation of gold nanoparticles.
Therefore, acetone and trace water were used in the experiments for the mechanistic
studies in the second part of the chapter. Solutions of 3a and 4a were prepared by
adding a 1 mg of DTF compound in 10 mL of acetone and a trace amount of water.
HAuCl4 was prepared by solvation of 1 mg of AuCl3 in 10 mL of acetone. 2 mL of
preheated HAuCl4 was mixed with 1 mL of the respective solutions of 5a and 5b and
then heated to 40 ◦C and stirred for half an hour. AuNPs were gradually formed by
reduction of Au3+ to Au0 through oxidation of dithiafulvene molecules, as evidenced
by the appearance of a UV-Vis peak at 520 nm. The yellow color of the solution
turned into red orange, indicating the presence of gold nanoparticles.
As can be seen in Figure 4.5A, the yellow color of 3a solution turned green after
half an hour of stirring with HAuCl4 at 40 ◦C (oil bath). The UV-Vis spectrum of
the green solution show a broad absorption band at 670−720 nm. The green color
gradually turned into orange throughout the next 24 hours, which eventually gave
the characteristic absorption at 520 nm. Eye-detectable fine dispersed dark particles
precipitated out of the solution after two weeks due to the excessive growth of particles.
There was a broad range of functionalized particle sizes in the solution based on the
multiple peaks that appeared between 520 to 700 nm.
Figure 4.5B shows the solution of 4a prepared by the addition of 1 mg of DTF
compound in 10 mL of acetone and a trace amount of water (yellow solution on the
left). The solution turned into blue after one hour of mixing with 1 mL of HAuCl4,
stirring and heating at 40 ◦C in an oil bath. The color of the solution turned into
94

Figure 4.5: (A) The solution of 3a in acetone and a trace of water (yellow solution).The color of the solution turns green by addition of preheated HAuCl4 to 40 ◦C andgradually turns orange by heating and stirring. (B) The solution of 4a in acetone anda trace of water (yellow solution). The color of the solution turns blue by addition ofpreheated HAuCl4 to 40 ◦C and gradually turns orange by heating and stirring.
orange over the next 24 hours and black precipitates formed after two weeks.
4.4.1 UV-Vis Analysis of Functionalized AuNPs
UV-Vis spectra of 4a in methanol before and after the addition of HAuCl4 are shown
in Figure 4.6 and the simulated UV-Vis spectra of the DTF compound in the gas
phase in both neutral and oxidized states are shown in Figure 4.7. Figures 4.6 and
4.7 are generated by cubic fitting (as shown on the top) of the measured spectra and
peaks are deconvoluted to the peaks involved in each absorption band (as shown on
the bottom). The original spectra are reported in Appendix E. Comparison of the
measured and calculated UV-Vis spectra reveals the following results:
1) Figure 4.6 on top: Experimental peaks at 216.22, 285.73, 420.73 and 487 nm
correspond to the simulated peaks at 206.52, 239, 275.59 and 381 nm (Figure 4.7 (A))
for 4a at neutral form (the peak assignments are reported in Appendixes E.2 and
E.3). The solvent impact causes the differences between simulated and experimental
peaks resulting in the bands appearing at higher wavelengths. The differences can
arise from the simulation of the single molecule in the gas phase without considering
95

Figure 4.6: (Top) UV-Vis spectrum of 4a; the peak at 420 nm refers to the maximumabsorption of 4a in neutral form, which is shown in simulated UV-Vis spectrumof 4a in neutral form (Figure 4.7 (A)). (Middle) UV-Vis spectrum of 4a after halfan hour addition of HAuCl4 and sonication; the peak at 524 nm corresponds tothe AuNPs absorbance. (Bottom) UV-Vis spectrum of 4a after twenty four hoursfollowing addition of the HAuCl4; the AuNPs corresponding peak is shifted to thehigher wavelengths at 547 nm with relatively higher absorbance.
96

the surrounding AuNPs that are grafted to DTF molecules in the presence of the
solvent.
Figure 4.7: (A) and (C) are simulated UV-Vis spectra of 4a in neutral and oxidizedforms, which are obtained with time-dependent B3PW91/6-311G(d,p) level of theoryand basis set and 40 number of states. Simulated UV-Vis spectrum indicate that thereis no band between 500−600 nm before, and after oxidation of 4a. Therefore the bandat 524 nm right after addition of HAuCl4 refers to the AuNPs absorbance, which shiftsfor 23 nm to the higher wavelength after twenty-four hours (Figure 4.6). (B) and (D)are simulated UV-Vis spectra of dimerized 4a in neutral and oxidized forms, whichare computed with time-dependent B3PW91/6-31+G(D,P) level of theory and basisset and the number of states is 40.
2) Figure 4.6 middle: AuNPs characteristic band at 524 nm appears after an hour
of mixing and sonication with HAuCl4. This band cannot be referred to any peak in
the simulated spectrum of the cationic form. As mentioned in the introduction, ab-
sorption of AuNPs at 520 nm indicates the average size distribution of approximately
30 nm [10].
3) Figure 4.6 bottom: AuNPs characteristic peak shifts to the higher wavelength at
97

547 nm, which indicates that the average size of the particles has grown substantially.
Absorption of AuNPs at 550 nm indicate the average size distribution of approxi-
mately 90 nm [10]. Hence, the size of synthesized nanoparticles can be controlled by
the time of sonication and temperature. Furthermore, the absorbance of the AuNPs
peak considerably increased after twenty-four hours.
4) Figure 4.6 bottom: As mentioned in Chapter 2, the DTF oxidative dimerization
reaction occurs in an oxidative environment. Accordingly the peaks at 689 and 677
nm (Figure 4.6 middle) correspond to a peak appears at 698 nm in the simulated
spectrum of dimerized compound in the cationic form (Figure 4.7D).
AuNPs can also be synthesized by 3a in which a carboxyl group is substituted at
the para position of the benzene ring instead of methyl carboxylate group (4a). The
substitution of a carboxyl group results in a faster rate of nucleation and growth of
functionalized AuNPs, likely because the carboxyl group releases hydrogen ion and
makes the solution more acidic than the solution of 4a. The presence of hydrogen ions
accelerates the release of electrons and oxidation of the compound. The color of the
solution turns into green right after addition of HAuCl4, whereas the solution of 4a
needs to be heated and sonicated at least for half an hour to give the same results. The
redox potentials of the reactants involved are discussed in Section 4.6.1 by calculating
the oxidation potentials of the molecules in the different types of solvents.
4.4.2 Raman Analysis of Functionalized AuNPs
Raman spectra of 3a in methanol before and after the addition of HAuCl4 are shown
in Figure 4.8. As can be seen, the predicted peak at 1620 cm−1 (Figure 4.8C), which is
the carbon-oxygen double bond stretching of carboxyl group, does not appear in the
experimental spectrum of the neutral compound (Figure 4.8A). It can be ascribed to
the strong intermolecular hydrogen bonding interactions between the carboxyl groups
98

of the DTF molecules, which prohibits the carbon-oxygen bond from stretching as
readily as in a free single molecule in the gas phase [11]. The corresponding peak
can be clearly seen in the Raman spectrum of 4a in the neutral form (Figure 4.9) in
which there is no hydrogen bonding between carboxylate ester groups.
Figure 4.8: (A) and (D) The experimental Raman spectra of 3a in methanol beforeand after addition of HAuCl4, respectively. Red spectrum (D) is taken from thesolution of 3a after twenty-four hours of mixing it with HAuCl4 in which the colorwas turned orange. (B) and (E) Simulated Raman spectra of dimerized 3a in neutraland oxidized states, respectively. (C) and (F) Simulated Raman spectra of 3a inneutral and oxidized states, respectively.
The experimental Raman spectra of 3a (Figure 4.8D) after mixing it with HAuCl4
does not match very well the simulated Raman spectra of 3a, nor dimerized 3a in
the oxidized state. However, there is a closer similarity with simulated spectra of
dimerized 3a in the neutral form such as peaks at 1612 and 1726 cm−1, which appeared
at 1494 and 1536 cm−1, respectively. The first peak is C=C bond stretching of the
benzene rings and the second band is due to the C=C bond stretching as they are
99

Figure 4.9: (A) The experimental Raman spectrum of 4a in methanol. (B) SimulatedRaman spectra of dimerized 4a in neutral form. (C) Simulated Raman spectrum of4a in neutral form at B3PW91/6-31+G(G,P) level of theory and basis set. C=Obond stretching band appears in both computed and experimental spectrum of 4aand dimerized 4a at 1800 and 1620 cm−1, respectively. All simulations performed atB3PW91/6-31+G(D,P) level of theory and basis set.
100
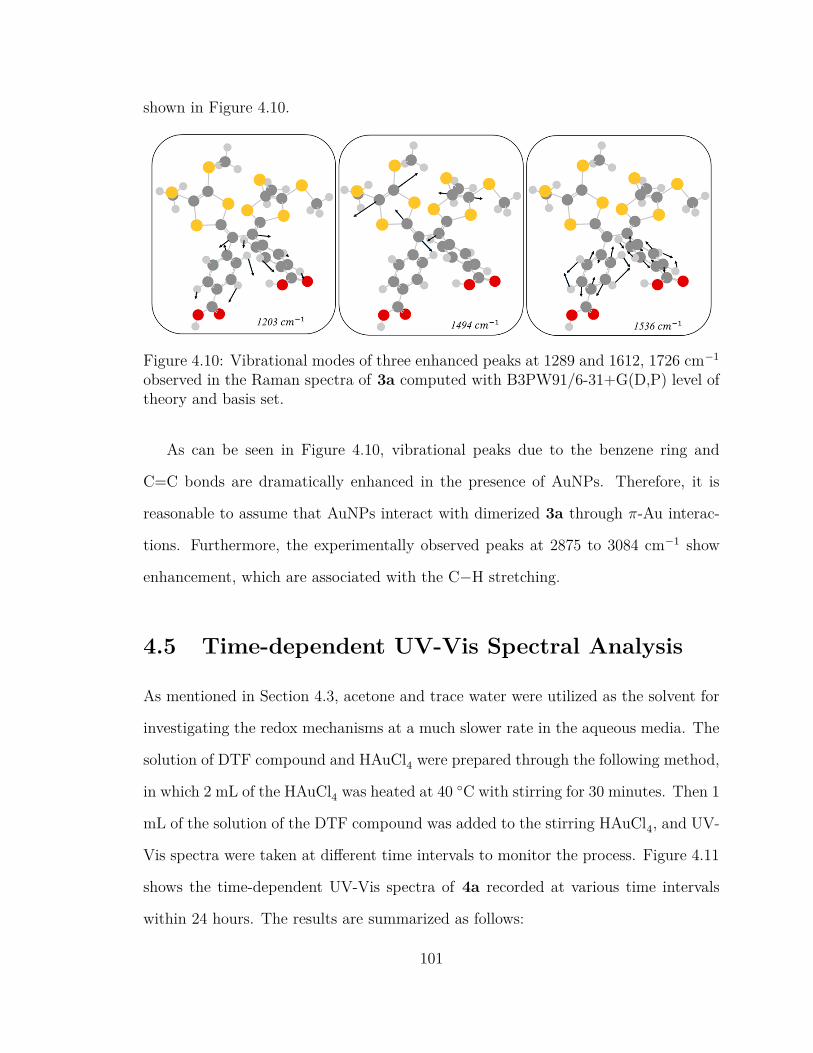
shown in Figure 4.10.
Figure 4.10: Vibrational modes of three enhanced peaks at 1289 and 1612, 1726 cm−1
observed in the Raman spectra of 3a computed with B3PW91/6-31+G(D,P) level oftheory and basis set.
As can be seen in Figure 4.10, vibrational peaks due to the benzene ring and
C=C bonds are dramatically enhanced in the presence of AuNPs. Therefore, it is
reasonable to assume that AuNPs interact with dimerized 3a through π-Au interac-
tions. Furthermore, the experimentally observed peaks at 2875 to 3084 cm−1 show
enhancement, which are associated with the C−H stretching.
4.5 Time-dependent UV-Vis Spectral Analysis
As mentioned in Section 4.3, acetone and trace water were utilized as the solvent for
investigating the redox mechanisms at a much slower rate in the aqueous media. The
solution of DTF compound and HAuCl4 were prepared through the following method,
in which 2 mL of the HAuCl4 was heated at 40 ◦C with stirring for 30 minutes. Then 1
mL of the solution of the DTF compound was added to the stirring HAuCl4, and UV-
Vis spectra were taken at different time intervals to monitor the process. Figure 4.11
shows the time-dependent UV-Vis spectra of 4a recorded at various time intervals
within 24 hours. The results are summarized as follows:
101

1) The peak at 334 nm is assigned to the HAuCl4 absorption that appears right
after the addition of HAuCl4 to the solution, which gradually decreases throughout
the reaction processes [12].
2) Peak assignments for 386 and 684 nm are obtained by comparison of simulated
UV-Vis peaks (Figure 4.7 (A) and (D)) and experimentally observed ones, which are
associated with the DTF monomer in the neutral form and TTFV2+ dimer in the
oxidized state. The UV-Vis spectra of 4a in acetone and a trace amount of water
show only one absorption band at 386 nm (Figure 4.11 (Left) yellow spectrum). The
broad peak at 684 nm appears after addition of HAuCl4, which gradually increases in
intensity to reach the maximum absorption after 30 minutes of mixing (Figure 4.11
(Right)). Then the TTFV2+ peak at 684 nm is seen to decrease and eventually disap-
pear after 24 hours. The corresponding peak completely vanishes after the appearance
of the characteristic peak of AuNPs at 510 nm (Figure 4.11 (Left) red spectra) by
warming the solution.
3) Comparison of the experimental and simulated spectra indicates that the peak
at 684 nm corresponds to dimerized 4a in the oxidized form, which is not yet bonded
to the gold species.
4) The peak at 386 nm gradually deceases with increasing concentration of Au (III).
Along with the increase is the decease of the peak at 684 nm (Figure 4.11 (Right)),
which indicates that 4a and Au(III) are consumed by the redox (Equation 4.1) and
dimerization reactions (Equation 4.2) respectively.
AuCl−4334 nm
+ 2 e− K1−−⇀↽−− Au+ + 4 Cl−
2 DTF386 nm
K2−−⇀↽−− 2 DTF·+ + 2 e(4.1)
102

Figure 4.11: Left) Experimental time-dependent UV-Vis spectra of 4a in acetone anda trace of water before and after addition of the pre-warmed HAuCl4 at different timeintervals. Red spectra are taken after warming the solution that was left in the closedcap vial overnight. Right) Peak intensity versus time are plotted for major peaks thatare indicated in UV-Vis spectra.
103

2 DTF·+ Dimerization (K3)−−−−−−−−−−−−−−⇀↽−−−−−−−−−−−−−− TTFV2+
684 nm
Reduction (K4)−−−−−−−−−−−−⇀↽−−−−−−−−−−−− TTFV + 2H+ (4.2)
5) Dimerization occurs right after the formation of DTF in the cationic state.
Therefore, there is no peak related to the DTF radical cation species. However,
Au(III) substitution occurs in a faster rate than reduction in the presence of thio-
cyanate and thiosulfate [13].
6) Decreasing the intensity of the peak at 684 nm after 30 minutes indicates that
the TTFV2+ species are consumed through another reaction, which is proposed to be
a reduction (Equation 4.2) and coupling reaction with gold atoms (Equation 4.3).
7) The complex formed between gold atoms and TTFV molecules are then going
through the propagation reaction to form the seeds of AuNPs, which contributes to
the growth of the absorption peak at 520 nm.
8) AuNPs formation is a process accompanied by the absorption of heat to over-
come the energy barrier and induce AuNPs seed formation at some steps. The color
of the solution never turns into orange without heating the samples.
TTFV + Au+ Heat/acetone/trace of water (K5)−−−−−−−−−−−−−−−−−−−−−−−−−−⇀↽−−−−−−−−−−−−−−−−−−−−−−−−−− [TTFV− Au1+]420 nm
3 [TTFV−Au1+]Propagation (K6)−−−−−−−−−−−−−⇀↽−−−−−−−−−−−−− 2 [TTFV− Au0]Seed
520 nm+ [TTFV−Au3+]
(4.3)
With the proposed method, AuNPs can only be obtained in acetone with a trace
amount of water; therefore, the role of acetone and water should be considered in
nanoparticle formation, which is still under debate and needs more investigation. It
is proposed that acetone can change the solvent effect by heating and in the presence
104

Figure 4.12: (Left) Experimental UV-Vis spectra of 3a in acetone and a trace ofwater before and after addition of the pre-warmed HAuCl4 to 40 ◦C throughout 32hours. (Right) Peak intensity versus time is plotted for the assigned peaks.
105

of water.
The same set of experiments was conducted for 3a and the results are plotted
in Figure 4.12. As can be seen, the DTF peak at 383 nm and Au(III) absorption
at 333 nm gradually decrease while TTFV2+ absorption at 684 nm increases. The
sample was then heated for 24 hours, after which a peak at 459 nm appeared, which
corresponds to the TTFV and Au(I) complex. AuNPs did not form in the solution,
and the color of the solution turned back to yellow. Hence, the TTFV-Au1+ complex
proved to be very stable, and the propagation reaction did not occur in the solution.
Based on the observations, it can be concluded that the gold and dimerized 3a
complex is stable and heating the sample at 40 ◦C does not supply enough driving
force to form the seeds of AuNPs. Therefore, the substituent plays a major role in
stabilizing the complex with gold. Peak intensity versus time for all the main peaks
shows a small bump right after heating the sample (Figure 4.12 (Right)).
The same set of experiments was repeated for three more samples that were first
left for 24 hours and then be heated to 40 ◦C. Finally, UV-Vis spectra of the sample
were taken over a period of 24 hours (Appendix E). All spectra show that the DTF
peak has shifted to higher wavelengths and the color of the solution turned back
yellow, which is a sign of dimerized DTF in the neutral state that is bonded to the
gold atoms.
4.6 Effective Parameters on Reaction
As mentioned earlier, 4a in acetone and a trace amount of water were used for UV-Vis
studies due to a slower rate of reaction that allows us to track the reaction mechanism
more accurately. The redox reaction proceeded readily without the need of heating
or light irradiation. 3a/4a can be easily oxidized in the presence of Au3+, which is
106

reduced to Au+. Furthermore, the AuNPs peak did not appear in the solution of
3a, and acetone and the color of the solution turned from back to yellow. So for
these reasons, the solvent effects on the redox reaction was found essential to the
AuNPs formation and the rate of reaction. On the other hand, the substituent on
the benzene ring was found to be very critical in AuNPs formation and play a major
role in stabilizing the [Au(I)-DTF] complex. So for the above-mentioned reason, the
study of effective parameters on redox reaction is crucial for further understanding of
the AuNP formation.
4.6.1 Effects of Solvents Polarity
It is necessary to mention that HAuCl4 undergoes stepwise hydrolysis depending on
the pH of the medium. AuCl2OH2 at pH 4.5 is the main species in aqueous media [14].
Equation 4.4 shows the reduction potentials of AuCl –4 and Au3+ at different oxidation
states that are reported in the literature (values obtained in 0.4 M NaCl to maintain
the concentration of Cl– high enough to prevent hydrolysis of HAuCl4) [15].
AuCl −4 + 3 e− −−→ Au0 + 4 Cl− Eo(AuCl−4 /Au0) = + 0.994 V
AuCl −4 + 2 e− −−→ AuCl −2 + 2 Cl− Eo(AuCl−4 /AuCl−2 ) = + 0.926 V
Au3+ + 3 e− −−→ Au0 Eo(Au3+/Au0) = + 1.42 V
Au3+ + 2 e− −−→ Au+ Eo(Au3+/Au+1) = + 1.29 V
Au+ + e− −−→ Au0 Eo(Au+/Au0) = + 1.68 V
(4.4)
The oxidation potentials of 3a and 4a in methanol are computed to be +5.16
and +5.13 V at the B3PW91/6-31+G(d,p) level of theory and basis set. Therefore,
oxidation potentials are calculated to be +0.50 and +0.47 V respectively in reference
107

to a Ag/AgCl electrode (Eo(Ag/Ag+) = +4.66 V) [16]. Equation 4.5 displays the
electrochemical half reactions of gold and DTF [17], and Equation 4.6 shows the
electrochemical redox reaction and total potential.
Au3+ + 2 e− −−→ Au+1 Eo(Au3+/Au+1) = + 1.29V
2 (4 a −−→ 4 a·+ + e−)Chloroform 2 Eo4a/4a.+ = 2 (−0 · 70)V
(4.5)
Au3+ + 2 (4 a) −−→ Au+1 + 2 (4 a·+) ∆E = Eored(Reduction)−Eo
red(Oxidation)
= −0 · 11 V(4.6)
Oxidation potentials of compounds and ∆E of redox reactions are calculated in
seven different solvents and shown in Table 4.1. Positive values indicate that the re-
dox reaction proceeds spontaneously and zero represents the reaction at equilibrium.
Oxidation potentials decrease upon increasing the solvent polarity due to better sta-
bilization of the ionic product of oxidation by the solvent. In the table, solvents are
ordered from top to bottom in terms of increasing polarity. As can be seen, solvent
polarity can change the absolute value of ∆ Eredox up to 0.5 V. Moreover, 3a shows
persistently a higher oxidation potential than 4a in all different types of solvents. It
is obvious that high solvent polarity can facilitate oxidation reaction.
4.7 Computational Analysis of 4a-Aun Complex
A number of different adsorption sites was studied in Chapter 3 such as adsorption
through dithiole, benzene and carboxylic ester groups. The results show that 4a tends
to bind to the surface in a way that the benzene, dithiole, and carboxyl group interact
with gold atoms synergistically.
108

Solvent Eo(4a/4a.+) ∆E1 ∆E2 ∆E3 ∆E4 ∆E5
Chloroform −0.58 −0.47 −0.51 −0.08 −0.21 0.18THF −0.63 −0.33 −0.27 0.16 0.03 0.42DCM −0.59 −0.26 −0.20 0.23 0.10 0.49Acetone −0.50 −0.07 0.00 0.43 0.30 0.69Methanol −0.47 −0.01 0.06 0.49 0.36 0.75Acetonitrile −0.46 0.00 0.07 0.49 0.36 0.75Water −0.44 0.05 0.12 0.54 0.41 0.80
Eo(3a/3a.+)
Chloroform −0.78 −0.64 −0.57 −0.14 −0.27 0.12THF −0.66 −0.40 −0.33 0.10 −0.03 0.38DCM −0.63 −0.33 −0.26 0.17 0.04 0.43Acetone −0.53 −0.13 −0.06 0.37 0.24 0.63Methanol −0.50 −0.07 0.00 0.42 0.29 0.68Acetonitrile −0.49 −0.06 0.01 0.43 0.30 0.69Water −0.47 −0.01 0.06 0.48 0.35 0.74
∆E1 = Eo(Oxidation) + Eo
(AuCl−4 /AuCl−2 )
∆E4 = Eo(Oxidation) + Eo
(Au3+/Au1+)
∆E2 = Eo(Oxidation) + Eo
(AuCl−4 /Au0)
∆E5 = Eo(Oxidation) + Eo
(Au1+/Au0)
∆E3 = Eo(Oxidation) + Eo
(Au3+/Au0)
Eo(Oxidation) = Eo
(3a/3a.+) or Eo(4a/4a.+)
Table 4.1: Calculated oxidation potential of 3a and 4a in different solvents withB3PW91/6-31+G(D,P) level of theory and basis set (all values are reported in Volts).
109

The adsorption of the sulfur group of cysteine to clusters of 1,3,5 and 8 gold atoms
were computationally studied by Zhao and co-workers, which shows a charge transfer
from the gold cluster to the sulfur atom and a combination of the covalent and donor-
acceptor interactions in the cluster of three gold atoms [18]. In this work, adsorption
sites have also been studied by simulation of 4a bonded to one gold atom and a cluster
of three gold atoms in order to gain an insight into the charge transfer between
the compound and the gold groups. Figure 4.13 shows the optimized structure of
three possible binding sites of 4a to the gold group containing one and three atoms
[19]. Among all three bonding sites for 4a−Au, binding mode (A) is the most stable
Figure 4.13: Optimized structure of 4a and a group of gold atoms (n= 1,3).
structure in both the neutral and the oxidized states. In the case of 4a−Au3, binding
mode (F) is the most stable structure in the neutral and cationic state. Indeed, there
are many possibilities of bonding, however, only the interactions involving the main
functional groups were considered in assessing possible binding structures.
Ionization potential (IP) is defined as the amount of energy required for removing
an electron away from a molecule in the gas phase. The adiabatic ionization energy
is shown by Equations 4.7 and 4.8. In Equations 4.8, a zero-point vibrational energy
110

correction was applied.
IP = Ecation − Eneutral (4.7)
IP = (Ecation + ZPV E)− (Eneutral + ZPV E) (4.8)
To optimize the oxidized state, two different charge distributions were studied, in
which the charge was considered to be dispersed over 4a or the gold group. Ionization
energies of both charge distributions show that the positive charge is more localized
over 4a than the Aun group. Analysis of Mülliken charge distribution for the lowest
energy structures is shown in Figure 4.14. The highest change in charge density
Figure 4.14: Mülliken charge distribution over 4a-Au3 after oxidation. Red regionsrepresent a higher concentration of electron density while green shows less electrondensity.
after oxidation compared to the neutral molecule occurs over S11 and C14 for both
complexes as shown in Figure 4.14.
4.8 Summary
In the current chapter, AuNPs were synthesized through the reduction of the HAuCl4
using DTF derivatives as reductants. UV-Vis spectroscopic analysis was used to
reveal the redox reaction mechanisms. Experimental results show that in the first
redox step, Au(III) is reduced to an Au(I) species (Au(II) is not stable in the presence
of an oxidant). DTF is oxidized to the cationic state of DTF. In the second step, a
111

dimerization reaction occurs on cationic DTF and then an Au(I)-TTFV complex is
formed. It has been found that the oxidation of DTF occurs at a much faster rate
than the formation of Au-DTF complex. Finally, the characteristic peak of AuNPs
can be observed after heating the sample. It is concluded that the substituent on the
para position of the benzene ring of DTF plays a major role in the formation AuNPs.
Nanoparticles did not appear in the solution of DTF with carboxyl substituent and
formed a stable Au(I)-dimerized DTF complex instead. Moreover, the polarity of the
solvent and temperature directly impact the AuNP formation.
Bibliography
[1] James J. Storhoff, Robert Elghanian, Robert C. Mucic, Chad A. Mirkin, and
Robert L. Letsinger. One-pot colorimetric differentiation of ppolynucleotides
with single base imperfections using gold nanoparticle probes. J. Am. Chem.
Soc., 120:1959–1964, 1998.
[2] Debanjana Ghosh and Nitin Chattopadhyay. Gold nanoparticles: acceptors for
efficient energy transfer from the photoexcited fluorophores. OPJ, 3:18–26, 2013.
[3] Axel D. Becke. A new mixing of hartree-fock and local density-functional theories.
J. Chem. Phys., 98:1372–1377, 1993.
[4] Jacopo Tomasi, Benedetta Mennucci, and Roberto Cammi. Quantum mechanical
continuum solvation models. Chemical Reviews, 105(8):2999–3094, 2005.
[5] Erich Runge and E. K. U. Gross. Density-functional theory for time-dependent
systems. Phys. Rev. Lett., 52:997–1000, 1984.
[6] M. J. Frisch, G. W. Trucks, H. B. Schlegel, G. E. Scuseria, M. A. Robb, J. R.
Cheeseman, G. Scalmani, V. Barone, B. Mennucci, G. A. Petersson, H. Nakatsuji,
112

M. Caricato, X. Li, H. P. Hratchian, A. F. Izmaylov, J. Bloino, G. Zheng, J. L.
Sonnenberg, M. Hada, M. Ehara, K. Toyota, R. Fukuda, J. Hasegawa, M. Ishida,
T. Nakajima, Y. Honda, O. Kitao, H. Nakai, T. Vreven, J. A. Montgomery, Jr.,
J. E. Peralta, F. Ogliaro, M. Bearpark, J. J. Heyd, E. Brothers, K. N. Kudin,
V. N. Staroverov, R. Kobayashi, J. Normand, K. Raghavachari, A. Rendell, J. C.
Burant, S. S. Iyengar, J. Tomasi, M. Cossi, N. Rega, J. M. Millam, M. Klene,
J. E. Knox, J. B. Cross, V. Bakken, C. Adamo, J. Jaramillo, R. Gomperts, R. E.
Stratmann, O. Yazyev, A. J. Austin, R. Cammi, C. Pomelli, J. W. Ochterski,
R. L. Martin, K. Morokuma, V. G. Zakrzewski, G. A. Voth, P. Salvador, J. J.
Dannenberg, S. Dapprich, A. D. Daniels, ?. Farkas, J. B. Foresman, J. V. Or-
tiz, J. Cioslowski, and D. J. Fox. Gaussian 09 Revision D.01. Gaussian Inc.
Wallingford CT 2009.
[7] Roy Dennington, Todd Keith, and John Millam. Gaussview Version 5. Semichem
Inc. Shawnee Mission KS 2009.
[8] Yunfei Wang and Yuming Zhao. Dithiafulvenyl-substituted phenylacetylene
derivatives: synthesis and structure-property-reactivity relationships. Org.
Biomol. Chem., 13:9575–9579, 2015.
[9] Huaiyong Zhu, Xuebin Ke, Xuzhuang Yang, Sarina Sarina, and Hongwei Liu. Re-
duction of nitroaromatic compounds on supported gold nanoparticles by visible
and ultraviolet light. Angew. Chem., 122:9851–9855, 2010.
[10] Wolfgang Haiss, Nguyen T. K. Thanh, Jenny Aveyard, , and David G. Fernig.
Determination of size and concentration of gold nanoparticles from uv-vis spectra.
Anal. Chem., 79:4215–4221, 2007.
113

[11] J. Binoy, Jose P. Abraham, I. Hubert Joe, V. George, V. S. Jayakumar,
J. Aubard, and O. Faurskov Nielsen. Near-infrared fourier transform raman,
surface-enhanced raman scattering and fourier transform infrared spectra and
ab initio calculations of the natural product nodakenetin angelate. J. Raman
Spectrosc., 36:63–72, 2005.
[12] Li Shi, Qing Yu, Yiyin Mao, Hubiao Huang, Hongwen Huang, Zhizhen Ye, and
Xinsheng Peng. High catalytic performance of gold nanoparticle-gelatin meso-
porous composite thin films. J. Mater. Chem., 22:21117–21124, 2012.
[13] Anna Ericson, Lars I. Elding, and Sofi K. C. Elmroth. Kinetics and mechanism
of reduction of gold(iii) complexes by dimethyl sulfide. J. Chem. Soc., Dalton
Trans., pages 1159–1164, 1997.
[14] S Ivanova, C Petit, and V Pitchon. A new preparation method for the formation
of gold nanoparticles on an oxide support. Appl. Catal., A, 267:191 – 201, 2004.
[15] Mirjana D. Durovic, Ralph Puchta, Zivadin D. Bugarcic, and Rudi van Eldik.
Studies on the reactions of [AuCl4]- with different nucleophiles in aqueous solu-
tion. Dalton Trans., 43:8620–8632, 2014.
[16] R. G. Bates and V. E. Bower. J. Res. Natl. Bur. Stand., 53:283–290, 1954.
[17] Li Li, Pedram Jahanian, and Guangzhao Mao. Electrocrystallization of tetrathi-
afulvalene charge-transfer salt nanorods on gold nanoparticle seeds. J. Phys.
Chem. C, 118:18771–18782, 2014.
[18] Yaxue Zhao, Feng Zhou, Huchen Zhou, and Haibin Su. The structural and
bonding evolution in cysteine-gold cluster complexes. Phys. Chem. Chem. Phys.,
15:1690–1698, 2013.
114

[19] Sandhya Rai, N. V. Suresh Kumar, and Harjinder Singh. A theoretical study on
interaction of proline with gold cluster. Bull. Mater. Sci., 35:291–295, 2012.
115

Chapter 5
Conclusions and Future Work
This work was aimed at characterizing dithiafulvene and tetrathiafulvalene derivatives
as a class of excellent π-electron donors and their interactions with gold nanoparti-
cles. The findings show that the DTF and TTF derivatives could be employed in
synthesizing AuNPs decorated with dithiole groups, which have many applications in
a variety of disciplines such as biological sensors. The findings suggest that the for-
mation of functionalized AuNPs in aqueous media is a strong motivational factor for
investigating the reaction mechanism and simulation of the redox reaction in solution.
Moreover, the influence of the DTF adsorption on the substrate properties should be
investigated to understand the DTF-gold interactions for further device applications.
The results can be used to improve the electronic properties and design more
efficient DTF-based molecular materials/devices. One of the themes to emerge from
my computational and experimental analysis is that the DTF molecule binds through
face-on orientation on the Au (111) surface at the highest degree of hybridization
between the π-electron cloud of DTF and the gold orbitals. The DTF thin film could
decrease the Au (111) work function by about 0.1 eV, which is directly proportional
to the polarity of the substituents. The results indicate that the major charge density
116

is distributed over the molecule rather than the surface. These findings are broadly
in line with the literature reports, such as the results published by Hyla et al. in 2016,
Osella et al. in 2013, and Li et al. in 2009. [1–3]
The mechanistic studies on AuNP formation through reduction with DTF com-
pounds are only supported by UV-Vis spectroscopic evidence. One avenue for further
study would be through time-dependent experiments using cyclic voltammetry and
NMR technqiues. Furthermore, it is important to simulate the active vibrational
modes of the DTF on the surface of Au (111) and compare them with the actual Ra-
man spectral data of the compound’s thin film on the gold substrate. Such research
requires a piece of equipment to produce a uniform thin film of the compound on
the surface of gold such as a Langmuir trough, in which the thickness of the film can
be carefully controlled. Quantum Espresso was found to be the best available soft-
ware package for simulation of the Raman bands in the solid state. Future research
into orbital overlap population with the band structure data can help understand the
covalent nature of the gold and DTF interactions [4, 5].
The size and dimension of synthesized AuNPs must be carefully studied and
compared with different common methods such as transmission electron microscopy
(TEM), atomic force microscopy (AFM), scanning electron microscopy (SEM), and
dynamic light scattering (DLS) in order to discover a suitable method for character-
ization of nanoparticles [6]. Furthermore, controlling the NPs size and morphology
is a critical approach for future work, which can directly impact the properties of
particles. Besides, the analysis of the HAuCl4 reaction with DTF molecules that are
substituted with different end-groups such as thiolester, ester, and carboxyl group can
uncover some steps of the reaction mechanism puzzle.
Another possible area for further investigations is the application of DTF in molec-
ular junctions in which organic π-conjugated molecules are used to modify the conduc-
117

tivity of transistors [7]. Atomic force microscopy (AFM) serves as a facile technique
for investigating the electronic properties of organic molecules that covalently bonds
to the drain and source [8].
Bibliography
[1] Alexander S. Hyla, Paul Winget, Hong Li, Chad Risko, and Jean-Luc Brédas.
Work function reduction by a redox-active organometallic sandwich complex. Org.
Electron., 37:263 – 270, 2016.
[2] Silvio Osella, David Cornil, and Jerome Cornil. Work function modification of the
(111) gold surface covered by long alkanethiol-based self-assembled monolayers.
Phys. Chem. Chem. Phys., 16:2866–2873, 2014.
[3] Fenghong Li, Yi Zhou, Fengling Zhang, Xianjie Liu, Yiqiang Zhan, and Mats
Fahlman. Tuning work function of noble metals as promising cathodes in organic
electronic devices. Chem. Mater., 21:2798–2802, 2009.
[4] Paolo Giannozzi, Stefano Baroni, Nicola Bonini, Matteo Calandra, Roberto Car,
Carlo Cavazzoni, Davide Ceresoli, Guido L Chiarotti, Matteo Cococcioni, Ismaila
Dabo, Andrea Dal Corso, Stefano de Gironcoli, Stefano Fabris, Guido Fratesi,
Ralph Gebauer, Uwe Gerstmann, Christos Gougoussis, Anton Kokalj, Michele
Lazzeri, Layla Martin-Samos, Nicola Marzari, Francesco Mauri, Riccardo Maz-
zarello, Stefano Paolini, Alfredo Pasquarello, Lorenzo Paulatto, Carlo Sbraccia,
Sandro Scandolo, Gabriele Sclauzero, Ari P Seitsonen, Alexander Smogunov,
Paolo Umari, and Renata M Wentzcovitch. QUANTUM ESPRESSO: a modular
and open-source software project for quantum simulations of materials. Journal
of Physics: Condensed Matter, 21(39):395502 (19pp), 2009.
118

[5] Gerold M. Rangger, Lorenz Romaner, Oliver T. Hofmann, Georg Heimel,
Michael G. Ramsey, and Egbert Zojer. Analysis of bonding between conjugated
organic molecules and noble metal surfaces using orbital overlap populations. J.
Chem. Theory Comput., 6:3481–3489, 2010.
[6] A direct comparison of experimental methods to measure dimensions of synthetic
nanoparticles. Ultramicroscopy, 182.
[7] Georg Heimel, Lorenz Romaner, Jean-Luc Brédas, and Egbert Zojer. Interface
energetics and level alignment at covalent metal-molecule junctions: π-conjugated
thiols on gold. Phys. Rev. Lett., 96:196806, 2006.
[8] Lanlan Sun, Yuri A. Diaz-Fernandez, Tina A. Gschneidtner, Fredrik Westerlund,
Samuel Lara-Avila, and Kasper Moth-Poulsen. Single-molecule electronics: from
chemical design to functional devices. Chem. Soc. Rev., 43:7378–7411, 2014.
119

Appendix A
Redox-dependent Properties of
DTF-endcapped π-Oligomers
∗
A.1 Electronic Transition and Molecular Orbital
Properties
Electronic transition properties for model compound 2b in different oxidation states
were simulated by the TD-DFT method at the B3LYP/6-31++(d,p) level of the-
ory. Detailed electronic transition energies and MO assignments are listed in Ta-
bles A.1,A.2, A.3 and A.4. Eigenvalues of frontier molecular orbitals for 2b are
provided in Table A.5, and detailed contour plots for these orbitals are illustrated in
Figure A.1 and A.2.∗This appendix provides the supporting information from “Blah blah”, Authors, Journal vol,
pages (year).
120

Oscillator strength (f) Wavelength(nm) transition MO contribution2.665 471 HOMO>LUMO 0.702270.7492 352.02 HOMO−1>LUMO−1 0.5212
HOMO−2>LUMO −0.46202
Table A.1: Assignments of electronic transitions of 2b in the neutral state.
Oscillator strength (f) Wavelength(nm) transition MO contribution1.0425 1823.54 SOMO>LUMO(β) 1.07711
LUMO>SOMO(β) −0.42385SOMO>LUMO(α) −0.14552
1.2274 592.73 SOMO>LUMO(α) 0.82471SOMO>LUMO+2(β) −0.33823SOMO−1>LUMO+1(β) 0.26939SOMO−3>SOMO(β) −0.17459SOMO>LUMO(β) 0.16416SOMO−2>LUMO(α) −0.13221SOMO−1>LUMO+1(β) 0.12393SOMO>LUMO(β) −0.11999SOMO−2>LUMO+2(α) −0.10539
0.7142 421.07 SOMO−1>LUMO+1(β) 0.5762SOMO>LUMO+2(β) −0.54353SOMO>LUMO(α) −0.445SOMO−2>LUMO(α) −0.30482SOMO−1>LUMO+1(α) 0.12183SOMO>LUMO(β) −0.11847SOMO−1>LUMO+3(β) 0.1054SOMO>LUMO(β) 0.10443SOMO−2>LUMO+2(β) −0.101
Table A.2: Assignments of electronic transitions of 2b in the radical cation state.
121

Oscillator strength (f) Wavelength(nm) transition MO contribution0.9399 1105.1 SOMO>LUMO(β) 0.96778
SOMO>LUMO(α) −0.19161SOMO−1>LUMO+1(α) 0.1396
1.5665 554.93 SOMO>LUMO(α) 0.77272SOMO−1>LUMO+1(β) 0.47651SOMO>LUMO+2(β) 0.17438SOMO−2>LUMO(α) 0.16635SOMO>LUMO+2(α) −0.14723SOMO−3>LUMO(β) −0.12437SOMO>LUMO(β) 0.11664SOMO−2>LUMO+2(α) −0.10259
Table A.3: Assignments of electronic transitions of 2b in the dication triplet state.
Oscillator strength (f) Wavelength(nm) transition MO contribution2.9995 1025.440 SOMO>LUMO(α) 0.84748
SOMO>LUMO(β) 0.84748SOMO>LUMO(α) −0.47177SOMO>LUMO(β) −0.47177
0.7929 397.5 SOMO>LUMO+2(α) 0.57554SOMO>LUMO+2(β) 0.57554SOMO−1>LUMO+1(α) 0.39521SOMO−1>LUMO+1(β) 0.39521
Table A.4: Assignments of electronic transitions of 2b the dication singlet state.
Neu RC (α) RC (β) DC(T)(α) DC(T)(β) DC(S)LUMO+3 −0.745 −2.9721 −3.099 −5.479 −6.235 −5.624LUMO+2 −0.781 −3.245 −3.870 −5.625 −6.760 −6.438LUMO+1 −1.485 −4.0271 −4.552 −6.601 −8.687 −7.117LUMO −2.121 −4.643 −6.709 −6.986 −8.969 −9.117HOMO/SOMO −5.030 −7.434 −7.244 −9.828 −10.388 −9.711HOMO−1/SOMO−1 −5.277 −7.714 −8.194 −10.290 −11.256 −10.682HOMO−2/SOMO−2 −6.020 −8.477 −9.038 −10.885 −11.453 −11.540HOMO−3/SOMO−3 −6.780 −9.254 −9.536 −11.522 −11.842 −11.962HOMO−4/SOMO−4 −7.157 −9.572 −9.539 −11.636 −11.843 −11.979
Table A.5: Frontier molecular orbital energies of 2b in various oxidation states.
122

Figure A.1: Contours of frontier MOs for compound 2b in the radical cation stateand their eigenvalues calculated at the B3LYP/6-31++G (d,p) level.
Figure A.2: Contours of frontier MOs for compound 2b in the triplet dication stateand their eigenvalues calculated at the B3LYP/6-31++G (d,p) level.
123

Figure A.3: Contours of frontier MOs for compound 2b in the singlet dication stateand their eigenvalues calculated at the B3LYP/6-31++G (d,p) level.
A.2 Descriptions of Raman-Active Vibrational Modes
Tables A.6, A.7, A.8 and A.9 list the active vibrational modes of the Raman spectra
for compound 2b in the neutral, radical cation, dication singlet, and triplet states,
respectively. DFT-calculated Raman frequencies were found to be slightly lower than
experimental values, which can be rationalized by the effect of molecular orientation
and inter-molecular interaction in the solid state on the vibrational energies. Fig-
ure A.4, A.5, A.6 and A.7 describe the vibrational eigenvectors of the outstanding
Raman-active vibrational modes for compound 2b in the neutral and cationic states.
124

Entry νcal(cm−1) νexp(cm−1) Mode ∆ν(exp−cal)1 1145.35 1126.7 C−H rocking 18.652 1592.35 1541.13 C=C stretching 51.223 1621.23 1565.1 C=C stretching 56.134 1640.64 1588.8 C−H rocking 51.84
C=C stretching5 2280.39 2203.7 Triple bond stretching 76.69
Table A.6: Raman active vibrational modes for 2b in the neutral state.
Figure A.4: Raman active vibrational vectors for compound 2b in the neutral statecalculated at the B3LYP/6-31++G(d,p) level.
Entry νcal(cm−1) νexp(cm−1) Mode ∆ν(exp−cal)1 747.16 722.13 C−C Stretching 25.032 1133.50 1125.9 C−C Stretching 7.6
C−H rocking3 1225.17 1189.8 C−H rocking 35.375 1579.76 1567.9 C−H rocking 11.86
C=C Stretching6 1615 1588 C−H rocking 27
C=C Stretching7 3162.28 2898.7 C−H stretching 263.58
Table A.7: Raman active vibrational modes for 2b in the radical cation state.
125
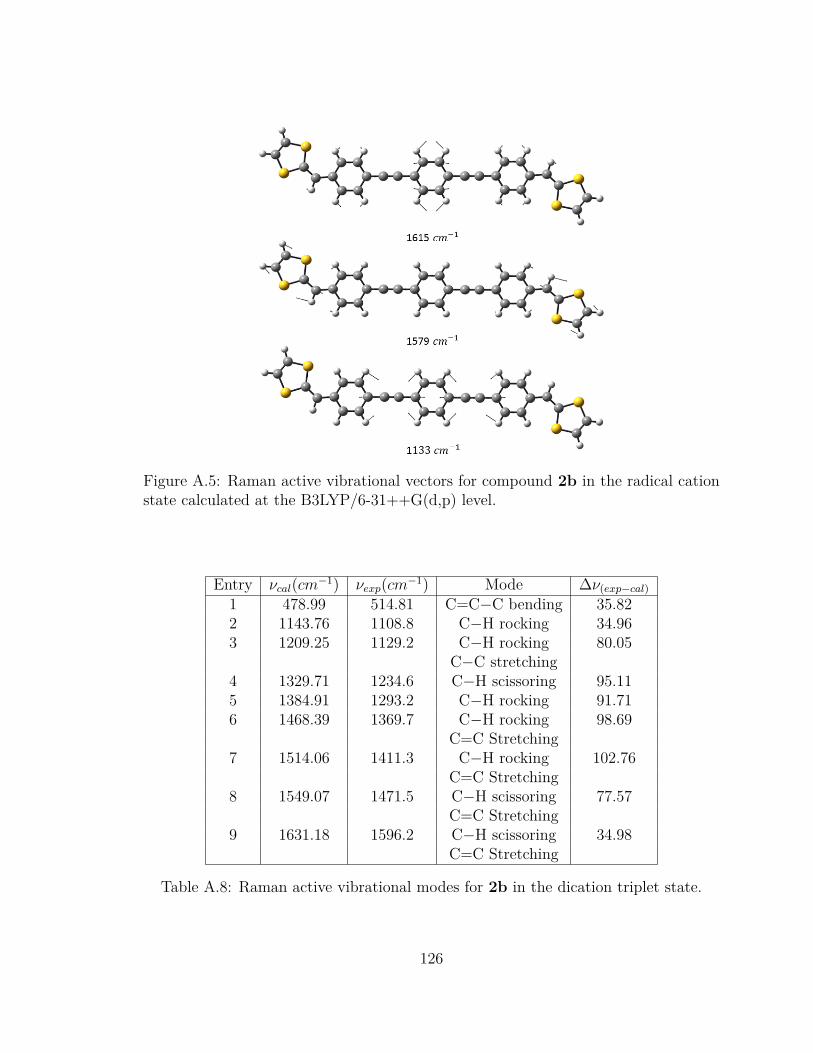
Figure A.5: Raman active vibrational vectors for compound 2b in the radical cationstate calculated at the B3LYP/6-31++G(d,p) level.
Entry νcal(cm−1) νexp(cm−1) Mode ∆ν(exp−cal)1 478.99 514.81 C=C−C bending 35.822 1143.76 1108.8 C−H rocking 34.963 1209.25 1129.2 C−H rocking 80.05
C−C stretching4 1329.71 1234.6 C−H scissoring 95.115 1384.91 1293.2 C−H rocking 91.716 1468.39 1369.7 C−H rocking 98.69
C=C Stretching7 1514.06 1411.3 C−H rocking 102.76
C=C Stretching8 1549.07 1471.5 C−H scissoring 77.57
C=C Stretching9 1631.18 1596.2 C−H scissoring 34.98
C=C Stretching
Table A.8: Raman active vibrational modes for 2b in the dication triplet state.
126

Figure A.6: Raman active vibrational vectors for compound 2b in the dication tripletstate calculated at the B3LYP/6-31++G(d,p) level.
Entry νcal(cm−1) Mode1 1119.57 C−H scissoring
C=C benzene rings Stretching2 1547.20 C=C dithiole rings Stretching3 1602.43 C−H scissoring
C=C benzene rings Stretching4 2175.40 CC triple bond Stretching
Table A.9: Raman active vibrational modes for 2b in the dication singlet state.
127

Figure A.7: Raman active vibrational vectors for compound 2b in the dication singletstate calculated at the B3LYP/6-31++G(d,p) level.
A.3 Raman Spectra of the Oxidized Film of 2a
After Two Weeks
The film of 2a spin-cast on a glass substrate was exposed to iodine vapour in a closed
beaker. Raman spectra of the film were taken before and after exposure, as discussed
in the paper. The film was then left in open air for two weeks and examined by
Raman again (Figure A.8).
A.4 Coordinates of Optimized Geometries and En-
ergies
128

Figure A.8: Raman spectra of the solid thin film of 2a on a glass substrate measured(A) before exposure to iodine vapour, (B) after exposure to iodine vapour for 65 min,and (C) after being left in open air for two weeks.
129

Figure A.9: Cartesian coordinates of compound 2b in the neutral state (sum ofelectronic and thermal Energies = −2746.293943 Hartree, zero-point correction =0.377252 Hartree)
130

Figure A.10: Cartesian coordinates of compound 2b in the radical cation state (Sumof electronic and thermal Energies = −2746.077723 Hartree, zero-point correction =0.378033 Hartree)
131

Figure A.11: Cartesian coordinates of compound 2b in the dication singlet state (sumof electronic and thermal Energies = −2745.773027 Hartree, zero-point correction =0.378722 Hartree)
132

Figure A.12: Cartesian coordinates of compound 2b in the dication triplet state (sumof electronic and thermal Energies = −2745.779398 Hartree, zero-point correction =0.378547 Hartree)
133

Appendix B
Redox-dependent Properties of
DTF-endcapped π-Oligomers
B.1 NLO Properties
NLO properties of DTF-end capped π-oligomers are calculated at the B3LYP/6-
31++G (d,p) level and shown in Table B.1. Results show relatively high γ polar-
izability than α which is found to be much higher for neutral molecule, while β and
µ polarizability calculated to be zero. Equation B.1 can calculate the total dipole
moment.
µ =√µ2
x + µ2y + µ2
z (B.1)
In this equation µx, µy, µz are dipole moments in x, y, z directions. The mean polar-
izability can be achieved by Equation B.2.
α0 = αxx + αyy + αzz
3 (B.2)
134

where αxx, αyy, αzz are polarizability tensors. Anisotropy polarizability can be derived
from Equation B.3.
∆α = 1√2
√(αxx − αyy)2 + (αyy − αzz)2 + (αzz − αxx)2 + 6α2
xx (B.3)
The first hyper-polarizability is obtained by Equation B.4.
βi = βiji + 13Σi 6=j(βiji + βjij + βjji) (B.4)
where i, j are x, y or z directions. First hyper-polarizability can be derived also by
the complete Equation B.5.
β0 =√
(βxxx + βxyy + βxzz)2 + (βyyy + βxxy + βxzz)2 + (βzzz + βxxz + βyyz)2 (B.5)
Diradical dication with singlet multiplicity shows higher γ value than triplet.
B.2 Phenol Detection
UV-Vis spectroscopy was tested to detect the presence of phenol on the surface of
DTF. First, a glass slide that was coated with a layer of gold was immersed in the
solution of DTF in the toluene for two hours. Second, the surface was then washed
with deionized water and finally, the prepared glass slide immersed in the solution of
500 ppm toluene for two more hours. The UV-vis spectra of the surface at different
stages regarding the bare glass slide are shown in Figure B.1. As can be seen, the
absorption peak at 600 nm shifts to higher wavenumbers with a decrease in intensity
of absorbance. Based on the discussion in chapter 4, the broad peak at 600 nm may
come from oxidized form of DTF. Raman spectra of the same surfaces are also taken
135

Neutral Radical cation Diradical dication (T) Diradical dication (S)αxx −96.893 328.170 813.407 744.522αxy 23.910 −24.004 −24.728 −24.463αyy −202.027 −187.007 −172.007 −172.583αxz 0.000 0.000 0.000 0.001αyz −0.001 0.003 0.004 0.004αzz −242.263 −236.230 −230.428 −344.370αtot −180.394 −47.533 205.486 113.785∆α 136.445 543.063 1016.787 1014.857βxxx 0.001 0.000 0.001 0.002βxxy 0.000 0.001 0.012 0.003βxyy 0.000 0.000 0.0018 0.001βyyy 0.000 0.000 0.000 0.000βxxz −0.009 −0.025 −0.0136 −0.003βxyz −0.011 0.011 0.012 0.003βyyz 0.000 −0.001 −0.001 0.000βxzz 0.000 0.000 0.00 0.000βyzz 0.00 0.000 0.000 0.000βzzz 0.000 0.000 0.000 0.000βtot 0.00 0.000 0.000 0.000γxxxx −69350.794 −10113.167 57839.151 47191.500γyyyy −1945.308 −1831.913 −1710.711 −1722.871γxxyy −15798.182 −14352.120 −12908.171 −13024.471γzzzz −308.362 −289.519 −272.658 −273.138γxxzz −18599.343 −17921.593 −17352.445 −17334.211γyyzz −451.836 −433.860 −413.457 −416.930γtot −28260.637 −15529.981 −1098.472 −3271.147µx 0.000 0.000 0.000 0.000µy 0.000 0.000 0.000 0.000µz 0.000 0.000 0.000 0.000µtot 0.000 0.000 0.000 0.000
Table B.1: The electric dipole moment (µ,D), polarizability (α), first hyperpolarizabil-ity (β), and second hyperpolarizability (γ) of investigated compounds at B3LYP/6-31++G(d,p) level.
136

and shown in Figure B.2. There is no detectable change in Raman spectra after
immersion in the phenol.
Figure B.1: UV-Vis spectra of (orange) glass slide that are coated with gold layer (yel-low) coated glass slide with gold that was then immersed in the solution of DTF, thatis dissolved in toluene, for two hours (blue) the prepared surface that was immersedin the phenol solution with concentration of 500 ppm for two hours.
B.3 UV-Vis Spectra of DTF and HAuCl4
Figure B.3 shows the Uv-Vis spectra of DTF dissolved in toluene and mixed with
gold acid. The gold peak intensity at 330 nm dramatically decreases after mixing it
with DTF solution which represents the reaction processed. The DTF peak at 400
nm shifts to higher wavenumbers which are due to the bonding of compounds with
gold species (chapter 4).
137

Figure B.2: Raman spectra of (a) glass slide that is coated with gold layer and thenimmersed in the solution of DTF, that is dissolved in toluene, for two hours (b) glassslide that is coated with gold layer and then immersed in the solution of DTF, that isdissolved in toluene, for twenty-two hours (c) the prepared surface that was immersedin the phenol solution with concentration of 500 ppm for two hours.
Figure B.3: UV-Vis spectra of .
138

Appendix C
SAM formation of Dithiafulvene
Derivatives on Au(111):
Orientational Geometry, Binding
Energies and Work Function
C.1 Geometry Optimization and Electronic Prop-
erty Calculations
As it is mentioned in the chapter 3, the molecule should be optimized in a very large
cell to prevent interacting with nearby molecules. In Figure C.1, the total energy of
the single DTF 3a in the cell is plotted against cell dimensions with and without con-
sidering vdW interactions. Both plots reach a plateau at the dimension of (20,15,15)
Å. So the corresponding cell dimension was employed for further calculations. Energy
increases by considering dispersion correction from (15,8,8) to (20,15,15) Å, which
is due to reducing the effect of vdW interaction by increasing the molecule-molecule
139

Figure C.1: Energy variation by increasing the cell lengths in (x, y,z) directions with(A) and without (B) dispersion correction. The numbers that are shown on the x-axis stand for (15,8,8), (20,15,15), (24,17,17), (25,20,20), (25,25,25) and (30,25,25)dimensions , respectively. All total energies have been obtained by 5×5×1 number ofk-points.
distances. Therefore the overall stability of cell decreases. Calculation without con-
sidering the vdW interaction shows that the stability of the cell rises by expanding
the cell dimensions due to the reduction of the repulsion forces.
Table C.1, shows the binding energy of the DTF 3a adsorbed on the surface of
Au (111) at different starting orientational geometries.
Table C.2 shows the distance of the gold substrate to the DTF derivative’s sulfur
atoms (S1 and Sc2) along with the magnitude of change in C4−C5 and C3−S1 dihedral
angle.
C.2 Molecular Work Function
Table C.3 shows the work function of the sole DTF derivatives in a very large unit
cell.
140

Orientation Angle (◦) EB εF ϕ
30 −2.942 (+0.063) −1.78 (−1.72) 3.34 (3.40)Vertical through carboxyl 45 −0.724 (+0.060) −1.81 (−1.72) 3.35 (3.39)
75 −0.687 (+0.021) −1.80 (−1.69) 3.34 (3.38)90 −0.684 (+0.075) −1.82 (−1.74) 3.36 (3.40)30 −3.052 (−0.217) −1.81 (−1.73) 3.36 (3.41)
Vertical through dithiol 45 −2.349 (−0.232) −1.84 (−1.75) 3.38 (3.41)75 −1.781 (−0.183) −1.90 (−1.78) 3.41 (3.43)90 −1.244 (−0.014) −1.95 (−1.85) 3.42 (3.46)30 −3.005 (−0.028) −1.79 (−1.75) 3.35 (3.41)
Edge−on 2 45 −2.788 (+0.002) −1.79 (−1.76) 3.35 (3.42)75 −2.336 (+0.019) −1.78 (−1.78) 3.35 (3.42)90 −1.032 (+0.041) −1.81 (−1.94) 3.42 (3.44)30 −3.184 (−0.218) −1.79 (−1.71) 3.35 (3.40)
Edge−on 1 45 −3.177 (−0.317) −1.79 (−1.71) 3.35 (3.40)75 −3.172 (−0.245) −1.79 (−1.72) 3.35 (3.40)90 −2.877 (+0.045) −1.78 (−1.79) 3.34 (3.47)B −3.009 (−0.114) −1.79 (−1.73) 3.35 (3.43)
Face−on S −3.197 (−0.276) −1.79 (−1.68) 3.35 (3.36)
Table C.1: Calculated binding energies (EB), Fermi energies (εF ) and work-function(ϕ) of the DTF 3a at eighteen different orientations on the surface of Au(111) with(without) dispersion correction. All values are reported in eV. B stands for the benzeneplane and "S" stands for the dithiol plane.
dAu−S1 dAu−SC2∆Φ
NO2 2.79 (3.20) 2.57 (2.67) 7.54 (11.86)CN 3.17 (3.73) 2.64 (3.75) 9.33 (8.49)CHO 2.85 (3.57) 2.67 (3.43) 2.44 (6.02)OCH3 2.62 (3.47) 2.55 (3.56) 2.50 (10.37)Br 3.51 (3.83) 2.57 (2.63) −6.60 (0.08)NH2 2.58 (3.42) 2.64 (3.82) 4.77 (7.22)
Table C.2: Table shows the Au−S1 and Au−SC2 distances (d) in Å along with theC4−C5 and C3−S1 dihedral angle change between plane of bonds (∆Φ) by depositionon the A (111) .
141

ΦDT F
NO2 4.64 (4.64)CN 4.51 (4.53)CHO 4.51 (4.50)Br 4.26 (4.26)
OCH3 3.92 (3.96)NH2 3.82 (3.73)
Table C.3: Molecular work function ϕ of the DTF derivatives in the unit cell with(without) dispersion correction. All values are reported in eV.
C.3 Polarizability
The polarizability values for DTF derivatves with different substitutes at para position
of the benzene ring are listed in Table C.4.
C.4 Raman Spectra of Gold Substrate
Figure C.2 shows the Raman spectra of the bare gold substrate that doesn’t show any
characteristic peak. The broad peak at 1600 cm−1 doesn’t have any overlap with the
spectra of deposited compound on the substrate.
Figure C.2: Raman spectra of the prepared gold substrate.
142

Br CHO CN COOH NH2 OCH3 NO2µx −2.4 −5.5 −6.5 −4.1 2.7 1.7 −7.5µy −0.9 0.0 −1.9 −0.1 −0.1 −1.1 −1.2µz 2.6 1.8 2.3 2.2 2.1 3.4 2.3µtot 3.7 5.8 7.2 4.6 3.4 4.0 8.1αxx −146.0 −170.4 −180.7 −152.7 −102.8 −116.2 −181.6αxy 1.6 7.4 −8.5 11.5 4.0 −2.4 −5.0αyy 10.6 23.0 25.2 −125.9 −119.0 −126.1 −126.7αxz −11.1 −15.1 −11.3 −14.7 −11.7 −3.6 −12.1αyz −1.4 −0.8 −1.5 0.4 −3.5 −1.5 −140.0αzz −3.8 5.6 10.0 −141.8 −132.6 −136.2 0.45αtot −46.4 −47.3 −48.5 −140.1 −118.1 −126.2 −149.4∆α 151.1 187.7 200.3 39.9 34.1 19.1 54.6βxxx 77.5 −407.5 −542.4 −147.8 220.0 177.6 −425.4βxxy −36.5 −3.5 −122.6 45.9 −14.9 −56.4 −86.9βyyz 24.9 22.2 21.5 23.2 19.5 22.1 23.1βyyy 22.7 9.1 6.2 11.8 15.8 14.7 4.6βxxz 62.7 −1.3 24.1 9.5 17.4 84.9 32.1βxyz −10.5 −9.0 −14.1 −4.5 −22.7 −6.7 −3.8βzzz 14.1 11.2 8.3 10.3 9.3 13.2 10.6βxzz 42.8 −16.7 −24.5 −9.1 −21.6 −6.2 0.3βxyy 39.9 −5.0 −29.2 −1.0 −5.6 −16.6 −26.7βyzz 10.9 5.3 4.9 8.7 3.8 6.6 8.5βtot 18014.7 92693.0 185324.2 15585.0 19655.3 19845.4 106948.0γtot −4886.1 −4860.5 −5090.5 −4864.0 −3305.6 −4050.1 −5295.1
Table C.4: The electric dipole moment (µ,D), polarizability (α), first hyperpolar-izability (β), and second hyperpolarizability (γ) of DTF derivatives with differentsubstitutes at para position of benzene ring with B3PW91/6-31+G(d,p) level of the-ory.
143

Appendix D
Vienna Ab-initio Simulation
Package (VASP)
D.1 Introduction
The VASP software package [1–4] is based on ab-initio quantum mechanical simu-
lation which computes the Schrödinger equation by density functional theory using
plane wave basis sets in order to consider the electronic charge density and the local
potential effect of electrons. Periodic calculations were implemented based on the
plane wave density functional theory. The interactions between the electrons and
ions are described using pseudopotentials or the projector-augmented-wave (PAW)
method. [5, 6]
D.2 Pseudopotentials and PAW
Matter consists of core electrons, that are closely localized at inner atomic shells, and
valence electrons that exist in outer electronic shells. The core electron wave functions
144

cannot be accurately describe by plane wave basis sets due to the large number of
wave functions needed to describe the oscillations. Furthermore, the chemical nature
of the core electrons remain constant in different chemical environments and can
be included in the calculation by pseudopotential approximations. Therefore, the
effective ionic potential of core electrons on the valence shells are considered instead
in this approximation.
There are three types of potentials accessible through the VASP package, includ-
ing:
1. norm-conserving pseudopotentials
2. ultra-soft pseudopotentials
3. PAW potentials
In all different methods, the core electrons are kept frozen for the above-mentioned
reasons. In the PAW technique, the oscillatory wave functions of the valence shell
electrons are Fourier transformed to well-behaved and smooth wave functions. The
PAW total energy is a slightly modified functional of ultrasoft psedopotentials which is
obtained by linearization of two terms of psedopotential total energy functional. [5,7].
All information about the quantum calculation of psedopotentials and PAW can be
found in detail at:
1. cms.mpi.univie.ac.at/wiki/index.php/VASP_workshop
2. www.vasp.at/index.php/documentation
D.3 Periodic boundary condition
The periodic boundary condition is used to accurately model the crystalline structure
that is infinite in x and y directions in which each unit cell is surrounded by an infinite
145

number of identical unit cells. In the slab simulation, the adjacent unit cells should
not be interacting in the z direction [8].
D.4 Reciprocal space and k-points
Density functional theory is performed by using pseudopotentials in reciprocal space
by using Fourier transforms. The smallest repetition unit in reciprocal space is the
Brillouin zone defined by k vectors and containing k-points [9, 10].
In this work, the FCC crystal structure optimization of the Au is computed with
21 × 21 × 21 k-points. For the calculation of energy and electronic properties of the
slab (and slab plus molecule), calculations at the Γ point only were sufficient. An
increase in the number of k-points doesn’t significantly impact the total energy and
the electronic properties. Furthermore, the calculated work functions at Γ match well
with experimental values. Moreover, all calculated energies and properties were used
to compare adsorption orientations or effect of substituents. In using a difference
between two values, these comparisons cancel out the intrinsic error of choosing the
number of k-points in reciprocal space.
All optimization parameters such as k-points and cutoff energy should be identical
in order to compare the energy and electronic properties of systems. Figure D.1
represents a sample INCAR file that was used to optimize and compute the work-
function for the adsorbent on the surface as described in detail in chapter 3.
Bibliography
[1] G. Kresse and J. Hafner. Ab initio molecular dynamics for liquid metals. Phys.
Rev. B, 47:558–561, 1993.
146

Figure D.1: A sample INCAR file that was used for optimization and work-functioncalculations in this work.
147

[2] G. Kresse and J. Hafner. Ab initio molecular-dynamics simulation of the
liquid-metal-amorphous-semiconductor transition in germanium. Phys. Rev. B,
49:14251–14269, 1994.
[3] G. Kresse and J. Furthmüller. Efficiency of ab-initio total energy calculations for
metals and semiconductors using a plane-wave basis set. Comput. Mater. Sci.,
6:15–50, 1996.
[4] G. Kresse and J. Furthmüller. Efficient iterative schemes for ab initio total-energy
calculations using a plane-wave basis set. Phys. Rev. B, 54:11169–11186, 1996.
[5] G. Kresse and D. Joubert. From ultrasoft pseudopotentials to the projector
augmented-wave method. Phys. Rev. B, 59:1758–1775, Jan 1999.
[6] Cesare (ed) Pisani. Quantum-mechanical ab-initio calculation of the properties
of crystalline materials. Springer, 1996.
[7] P. E. Blöchl. Projector augmented-wave method. Phys. Rev. B, 50:17953–17979,
1994.
[8] Pedro H. C. Camargo. Electronic structure: basic theory and practical methods.
Cambridge University Press, 2008.
[9] Roald Hoffmann. Solids and surfaces: a chemist’s view of bonding in extended
structures. Wiley, 1989.
[10] Roald Hoffmann Richard Dronskowski. Computational Chemistry of Solid State
Materials: A Guide for Materials Scientists, Chemists, Physicists and others.
Wiley, 2006.
148

Appendix E
One phase reduction mechanism of
Au (III) by dithiafulvene building
blocks in aqueous media
E.1 Simulated and experimental IR spectra
Figure E.1 are the experimental and simulated IR spectra of dimerized 3a powder and
residual particles of mixed dimerized 3a and gold acid. As it can be seen, the spectra
of the neutral compound match very well calculated spectra of dimerized neutral,
while spectra of the compound after the reaction completed with gold acid shows
better agreement with dimerized neutral too.
E.2 Raman spectra of 3a
Figure E.2 shows simulated and experimental Raman spectra of 4a and dimerized 4a
in neutral state. The peak at 1800 cm−1 which is due to C=O stretching can be clearly
149

Figure E.1: IR spectra of (A) dimerized 3a powder, (B) residual particles of mixeddimerized 3a and gold acid solutions.(C) and (D) Calculated IR spectra of dimerized3a in neutral and oxidized forms in order.
seen in the experimental Raman spectra. The corresponding peak was disappeared in
the Raman spectra of 3a due to hydrogen bonding between nearby molecules through
carboxyl group.
E.3 calculated oxidation potential of gold
The oxidation potential of gold(I) to gold(0) in different solvents are computed with
b3PW91/6-31+G (d,p) level of theory and basis set. Oxidation potentials are calcu-
lated in reference to a Ag/AgCl electrode (Eo(Ag/Ag+) = +4.66 V) in Table E.1. The
highest oxidation potential is found to be in chloroform which is a nonpolar solvent,
and the lowest is calculated to be in the water with the highest polarity.
150

Figure E.2: (A) Experimental Raman spectra of 4a in methanol. (B) SimulatedRaman spectra of dimerized 4a. (C) Simulated Raman spectra of 4a in neutralstates.
Solvent Eo(Au+/Au0)
Chloroform 1.51THF 1.18DCM 1.09Acetone 0.83Methanol 0.75Acetonitrile 0.74Water 0.68
Table E.1: The calculated oxidation potential of gold(I) to gold(0) in different solventswith b3pw91/6-31+g(d,p) level of theory and basis set (all values are reported inVolts).
151

E.4 UV-Vis investigations of redox reaction
E.4.1 UV-Vis spectra of 4a before peak deconvolution
Figure E.3 represent the original UV-Vis spectra of 4a in acetone before, right after
addition of gold acid and twenty-four hours after mixing it with gold acid. To be
able to analyze each peak clearly, spectra are deconvoluted to the involved peaks and
shown in Figure 4.6.
Figure E.3: UV-Vis spectra of 4a in acetone (yellow graph), after addition of HAuCl4for half an hour (Orange graph) and after twenty four hours (red graph).
E.4.2 Time dependant UV-Vis measurements
The time-dependent spectra of 3a in acetone and trace of water in three samples
that ran individually for UV-Vis measurements are shown in Figure E.4. The time-
dependent spectra of the first trial are shown in Figure 4.12. AuNP’s characteristic
peak at 520 nm did not appear at each trial, and the color of the solution turned
back to yellow. Furthermore, the neutral compound absorption peak shifts to the
higher wavelengths due to binding it to the gold species. The shift in HOMO>LUMO
transition to the higher wavelengths represent a decrease in band gap due to covalent
152

Figure E.4: Time-dependent UV-Vis spectra of 3 samples of 3a in acetone and traceof water at different concentrations.
Oscillator strength (f) Wavelength(nm) transition MO contribution0.6032 382.49 HOMO>LUMO 0.68563
HOMO>LUMO+2 0.142840.1647 279.05 HOMO−2>LUMO 0.63628
HOMO−1>LUMO −0.24479HOMO−1>LUMO+1 −0.10362
0.0396 207.32 HOMO−7>LUMO 0.59801HOMO−4>LUMO+2 −0.10458HOMO−2>LUMO+3 −0.23948HOMO−1>LUMO+3 −0.15859
Table E.2: Assignments of electronic transitions of 4a in the neutral state.
bonding of 4a with gold and lower energy transition of electrons from valence band to
conduction band. UV-Vis spectroscopy is not an enough evidence showing the exact
mechanism of interaction between 4a and gold species. Although it can qualitatively
says the formation of the functionalized nanoparticles through redox reaction and
proofs formation of the major component in the solution.
E.4.3 UV-Vis peaks assignments
The UV-Vis band assignments of the 4a at neutral and oxidized form are reported in
table. E.2, E.3. As can be seen, the maximum absorbance of 4a appeared at 382.47.59
and 780 nm in neutral and oxidized forms which are correlated to the HOMO>LUMO
and SOMO>LUMO (α, β) transitions, respectively. The peak at 370 nm, which is
153

Oscillator strength (f) Wavelength(nm) transition MO contribution0.2089 787.59 SOMO>LUMO(α) −0.18424
SOMO>LUMO(β) 0.977600.1693 437.48 SOMO>LUMO(α) −0.53360
SOMO−5>LUMO(β) 0.72931SOMO>LUMO(β) −0.13607SOMO>LUMO+1(β) 0.31734
0.3582 285.4 SOMO−1>LUMO(α) 0.70631SOMO−1>LUMO+2(α) −0.10582SOMO−10>LUMO(β) 0.13721SOMO−8>LUMO(β) −0.11651SOMO>LUMO+1(β) −0.59906SOMO−2>LUMO+3(β) −0.11189
Table E.3: Assignments of electronic transitions of 4a in the radical cation state.
a maximum absorption of 4a at the neutral form (Figure 4.2), was appeared at the
same wavelength that was predicted computationally in the gas phase.
E.5 Substituent effect on electronic levels
As can be seen in Figure 4.1, the R substituent on the benzene ring can be replaced
by different substituents to modify electronic properties. The total energy and Fermi
energy of the compound with the various substituents at three positions of ortho, meta
and para are calculated and shown in Table E.4. Calculations are conducted with
Abinit-7.6.4 software to perform electronic structure and ionic relaxation calculations
based on the density functional theory in the local density approximation (LDA) using
the exchange and correlation functional of Perdew using Projector Augmented-Wave
(PAW) calculations. The maximal absolute force tolerance for structural relaxation
iterations was set to 0.00004 Hartree/Bohr at which iterations will stop below this
value. The value for tolerance indifference of forces was set to 0.000002 Hartree/Bohr.
The energy cutoff was set at 300 eV.All the calculations were carried out using a very
154
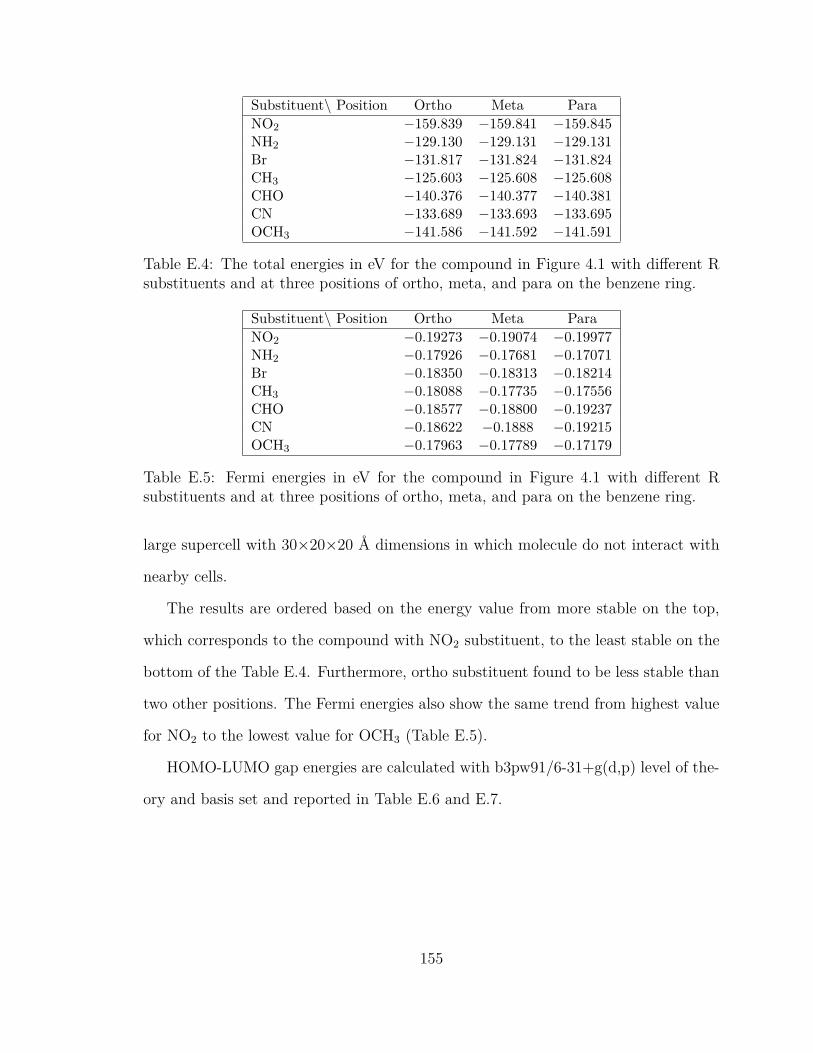
Substituent\ Position Ortho Meta ParaNO2 −159.839 −159.841 −159.845NH2 −129.130 −129.131 −129.131Br −131.817 −131.824 −131.824CH3 −125.603 −125.608 −125.608CHO −140.376 −140.377 −140.381CN −133.689 −133.693 −133.695OCH3 −141.586 −141.592 −141.591
Table E.4: The total energies in eV for the compound in Figure 4.1 with different Rsubstituents and at three positions of ortho, meta, and para on the benzene ring.
Substituent\ Position Ortho Meta ParaNO2 −0.19273 −0.19074 −0.19977NH2 −0.17926 −0.17681 −0.17071Br −0.18350 −0.18313 −0.18214CH3 −0.18088 −0.17735 −0.17556CHO −0.18577 −0.18800 −0.19237CN −0.18622 −0.1888 −0.19215OCH3 −0.17963 −0.17789 −0.17179
Table E.5: Fermi energies in eV for the compound in Figure 4.1 with different Rsubstituents and at three positions of ortho, meta, and para on the benzene ring.
large supercell with 30×20×20 Å dimensions in which molecule do not interact with
nearby cells.
The results are ordered based on the energy value from more stable on the top,
which corresponds to the compound with NO2 substituent, to the least stable on the
bottom of the Table E.4. Furthermore, ortho substituent found to be less stable than
two other positions. The Fermi energies also show the same trend from highest value
for NO2 to the lowest value for OCH3 (Table E.5).
HOMO-LUMO gap energies are calculated with b3pw91/6-31+g(d,p) level of the-
ory and basis set and reported in Table E.6 and E.7.
155

NO2 NH2 Br CH3HOMO −0.20377 −0.19469 −0.20081 −0.19897
Ortho LUMO −0.09717 −0.04345 −0.04497 −0.04238π − π∗ 0.10660 0.15124 0.15584 0.15659HOMO −0.20797 −0.19253 −0.20149 −0.19463
Meta LUMO −0.10135 −0.04570 −0.05839 −0.04836π − π∗ 0.10662 0.14683 0.14310 0.14627HOMO −0.21343 −0.18281 −0.19985 −0.192880
Para LUMO −0.10287 −0.03823 −0.05839 −0.04682π − π∗ 0.11056 0.14458 0.14223 0.14659
Table E.6: HOMO, LUMO, band gap energies of the ortho, meta, and para at neutralstate obtained with b3pw91/6-31+g(d,p) level of theory and basis set.
CHO CN OCH3HOMO −0.19975 −0.20485 −0.19413
Ortho LUMO −0.07883 −0.06931 −0.04891π − π∗ 0.12092 0.13554 0.14522HOMO −0.20533 −0.2078 −0.19550
Meta LUMO −0.0.07813 −0.06931 −0.04938π − π∗ 0.12720 0.13849 0.14612HOMO −0.20725 −0.20976 −0.18866
Para LUMO −0.08493 −0.07953 −0.04207π − π∗ 0.12232 0.13023 0.14659
Table E.7: HOMO, LUMO, band gap energies of the ortho, meta, and para at neutralstate obtained with b3pw91/6-31+g(d,p) level of theory and basis set.
156

Ortho Meta ParaSubstituent DTF DTF0+ DTF DTF0+ DTF DTF0+
NO2 53.9 59.0 −10.2 −9.0 −9.4 −18.0NH2 −50.4 −32.10 −22.8 −3.7 −19.1 −1.2Br −77.1 −66.7 −13.7 0.0 −16.3 0.1CH3 −61.1 −51.4 −19.5 −11.0 −19.1 0.2CHO −41.6 −45.3 −15.2 −17.1 −12.0 −15.1CN −47.1 −47.2 −12.6 −17.6 −11.8 −14.8OCH3 −35.9 −18.4 −22.1 11.7 −19.6 0.0
Table E.8: C1−C2−C3−S1 dihedral angles before and after oxidation for the com-pound with different Substituents at three positions of ortho, meta, and para.
E.6 Substituent effect on structural properties
Table E.8 shows C1−C2−C3−S1 (as shown in Figure E.5) dihedral angle changes after
oxidation.
Figure E.5: The structure of dithiafulvenyl with R substituent at the para positionof the benzene ring.
157
Copyright © 2022 FDOKUMEN