Benzene and Toluene Biodegradation with Different ... - CORE
Upload
khangminh22Category
view
1download
0
Copyright Warning & Restrictions
The copyright law of the United States (Title 17, United States Code) governs the making of photocopies or other
reproductions of copyrighted material.
Under certain conditions specified in the law, libraries and archives are authorized to furnish a photocopy or other
reproduction. One of these specified conditions is that the photocopy or reproduction is not to be “used for any
purpose other than private study, scholarship, or research.” If a, user makes a request for, or later uses, a photocopy or reproduction for purposes in excess of “fair use” that user
may be liable for copyright infringement,
This institution reserves the right to refuse to accept a copying order if, in its judgment, fulfillment of the order
would involve violation of copyright law.
Please Note: The author retains the copyright while the New Jersey Institute of Technology reserves the right to
distribute this thesis or dissertation
Printing note: If you do not wish to print this page, then select “Pages from: first page # to: last page #” on the print dialog screen

The Van Houten library has removed some of the personal information and all signatures from the approval page and biographical sketches of theses and dissertations in order to protect the identity of NJIT graduates and faculty.

ABSTRACT
1,4-DIOXANE BIODEGRADATION IN PROPANOTROPHS:
MOLECULAR FOUNDATIONS AND IMPLICATIONS FOR
ENVIRONMENTAL REMEDIATION
by
Fei Li
1,4-Dioxane (dioxane) has emerged with an escalating concern given its human
carcinogenicity and widespread occurrence in groundwater. Bioremediation is promising
as an effective and cost-efficient treatment alternative for in situ or ex situ cleanup of
dioxane and co-existing pollutants in the field. Soluble di-iron monooxygenases
(SDIMOs) are reputed for their essential roles in initiating the cleavage of dioxane and
other pollutants. In this doctoral dissertation, molecular foundations for SDIMOs-
mediated dioxane biodegradation are untangled to promote the development and
implication of site-specific bioremediation and natural attenuation strategies. This
dissertation focused on propanotrophic bacteria given their pivotal roles in dioxane
metabolism and co-metabolism.
The first part of this dissertation is centered on investigating the distinctive
catalytic behaviors between two archetypical dioxane degrading enzymes, propane
monooxygenase (PRM) and tetrahydrofuran monooxygenase (THM), belonging to
group-6 and group-5 SDIMOs, respectively. They are compared from kinetics, inhibition,
and substrate range. Results reveal that PRM is more profitable in environmental
conditions such as low dioxane concentration, co-existing chlorinated solvents, and many
other pollutants suggesting that PRM may has been long underestimated.
The second section refines the phylogenies of SDIMOs into six groups. The
evaluation sequence of this multi-component enzyme family follows the order: group-4

alkene MO group-5 propane/tetrahydrofuran MO group-6 propane MO group-3
methane/butane MO. Their short-chain gaseous hydrocarbon degradation capabilities
evolve from unsaturated to saturated compounds and from low C-H bond to high energy.
Results allow a robust bioprospecting of SDIMO.
The third part of this dissertation is aimed to untangle downstream dioxane
degradation pathways in metabolic degraders via genome the comparison of metabolic
and co-metabolic strains. A putative flavin-containing monooxygenase (fmo) gene is
cloned and expressed in mc2-155. Unfortunately, no HEAA transformation activity is
exhibited by this transformant. Existence of the complete glycolate transformation
pathway in all dioxane metabolizers reveals its essential role in dioxane mineralization.
As trace levels of dioxane (<1 mg/L) are widely detected in contaminated sites,
the fourth part aims to tackle such biotransformation hindrance by bioaugmentation with
a novel dioxane co-metabolizer, Azoarcus sp. DD4. DD4 exhibited formidable
adaptability and relatively stable performance on dioxane degradation with the
supplement of propane, supporting its feasibility for both in situ and ex situ treatment of
dioxane even when its concentration is below 100 µg/L. Pure strain study reveals DD4
can overcome the inhibition of cVOCs and degrade them when supplied with propane.
Last but not the least, a bioremediation treatment train combining the reductive
dehalogenation by halorespiring consortium, SDC-9, and cometabolic oxidation by DD4
to address the commingling contamination of TCE and dioxane. SDC-9 can effectively
remove TCE, however, lingering with less-chlorinated but toxic metabolites, vinyl
chloride (VC) and cis-dichloroethene (cDCE). Subsequent aerobic bioaugmentation with
DD4, can concurrently degrade dioxane, VC, and cDCE.

1,4-DIOXANE BIODEGRADATION IN PROPANOTROPHS:
MOLECULAR FOUNDATIONS AND IMPLICATIONS FOR
ENVIRONMENTAL REMEDIATION
by
Fei Li
A Dissertation
Submitted to the Faculty of
New Jersey Institute of Technology
in Partial Fulfillment of the Requirements for the Degree of
Doctor of Philosophy in Environmental Science
Department of Chemistry and Environmental Science
August 2020
Copyright © 2020 by Fei Li
ALL RIGHTS RESERVED
.

APPROVAL PAGE
1,4-DIOXANE BIODEGRADATION IN PROPANOTROPHS:
MOLECULAR FOUNDATIONS AND IMPLICATIONS FOR
ENVIRONMENTAL REMEDIATION
Fei Li
Dr. Mengyan Li, Dissertation Advisor Date
Assistant Professor of Chemistry and Environmental Science, NJIT
Dr. Somenath Mitra, Committee Member Date
Distinguished Professor of Chemistry and Environmental Science, NJIT
Dr. Edgardo T. Farinas, Committee Member Date
Associate Professor of Chemistry and Environmental Science, NJIT
Dr. Alexei Khalizov, Committee Member Date
Associate Professor of Chemistry and Environmental Science, NJIT
Dr. Lucia Rodriguez-Freire, Committee Member Date
Assistant Professor of Civil and Environmental Engineering, NJIT

iv
BIOGRAPHICAL SKETCH
Author: Fei Li
Degree: Doctor of Philosophy
Date: August 2020
Undergraduate and Graduate Education:
Doctor of Philosophy in Environmental Science,
New Jersey Institute of Technology, Newark, NJ, 2020
Master of Science in Fermentation Engineering,
Tianjin University of Commerce, Tianjin, P. R. China, 2015
Bachelor of Science in Bioengineering,
Tianjin University of Commerce, Tianjin, P. R. China, 2012
Major: Environmental Science
Presentations and Publications:
Li, F., Deng, D., and Li, M., Distinct catalytic behaviors between two 1, 4-dioxane
degrading monooxygenases: kinetics, inhibition, and substrate range.
Environmental Science & Technology. 2020, 54(3), 1898-1908
Li, F., Deng, D., and Li, M., Comparison of catalytic behaviors between two 1,4-dioxane
degrading monooxygenases. 2019 Bioremediation Symposium. Baltimore, MD
Deng, D., Pham, DN., Li, F., and Li, M., Discovery of an inducible toluene
monooxygenase that co-oxidizes 1, 4-dioxane and 1, 1-dichloroethylene in
propanotrophic Azoarcus sp. DD4. Applied and Environmental Microbiology.
2020
Deng, D., Li, F., Ye, L. and Li, M., Complete genome sequence of Azoarcus sp. strain
DD4, a Gram-negative propanotroph that degrades 1, 4-dioxane and 1, 1-
dichloroethylene. Microbiology resource announcements, 2019, 8(33), e00775-
19.
Deng, D., Li, F., Wu, C. and Li, M., Synchronic biotransformation of 1, 4-dioxane and 1,
1-dichloroethylene by a Gram-negative propanotroph Azoarcus sp. DD4.
Environmental Science & Technology Letters, 2018, 5(8), 526-532.

v
Deng, D., Li, F. and Li, M., A novel propane monooxygenase initiating degradation of 1,
4-dioxane by Mycobacterium dioxanotrophicus PH-06. Environmental Science &
Technology Letters, 2018, 5(2), 86-91.

vi
To my dearest dad and mom. Thanks for always being there for me.
致我最亲爱的爸爸,妈妈,感谢你们一直陪伴在我身边

vii
ACKNOWLEDGMENT
Over the past four years, I have received support and encouragement from the numbers of
individuals. I would not complete my Ph.D. degree without their support, accompanying,
and nurturing. Here I would like to express my deepest appreciation to those people who
made this journey an unforgettable experience.
I am deeply indebted to my adviser, Dr. Mengyan Li for his critical role in my
doctoral work. Professor Li provided me with professional guidance, assistance, and
expertise that I needed during my experimental design, troubleshooting, article writing,
preparing for conferences, and any other circumstances. His patience, expertise, kindness
always impressed and encouraged me, leading my research to the right track. I am always
grateful for his help in opening my horizons and mentoring me thinking from various
aspects. I have fortunately been involved in many research projects, attended numerous
international and regional conferences in the related field, and mentor students. These
precious experiences taught me how to be an independent researcher and mentor. I quite
simply cannot imagine a better adviser.
I would like to extend my gratitude to my dissertation committee members:
Dr. Somenath Mitra, Dr. Alexei Khalizov, Dr. Edgardo Farinas, and Dr. Lucia
Rodriguez-Freire. Special thanks to them for finding time in their busy schedules to
attend my proposal and dissertation defense, also review this dissertation and provide me
constructive advice, critical comments, and valuable feedback.
I gratefully acknowledge all the financial support that made the completion of the
dissertation, provided by the National Science Foundation NSF CAREER CBET-
1846945, United States Geological Survey (USGS) State Water Resources Research Act

viii
Program (2018NJ400B), Langan Engineering, HDR, and the start-up fund from the
Department of Chemistry and Environmental Science at NJIT.
The instrumentation and chemical support from Dr. Pin Gu, Mr. Yogesh Gandhi,
Dr. Jeong Shim, Dr. Chaudhery M. Hussain, Dr. Xiaoyang Xu, Mr. Lei Ye,
Dr. Hao Chen, Dr. Yuanwei Zhang, Dr. Wen Zhang, and Dr. Yongick Kim cannot be
overestimated. They generally provided their best help to support my experiment.
Furthermore, Dr. Kathleen M. Gilbert, Genti M. Price, and Sylvana L. Brito provided
administrative support that made me a successful graduate. Thanks also to Lingke Zeng,
Stewart Abrams from Langan Engineering, Andrew Wadden, Patricia Parvis from HDR
for their unwavering supports. I found them particularly helpful to me during the time for
sampling from rivers, sediments, and Superfund sites.
I am also grateful to my previous and current group members, Dr. Daiyong Deng,
Dr. Qiong Wu, Dr. Guifen Lyu, Wu Chen, Dung Ngoc Pham, Na Liu, Yue Zhang, Jian
Wang, Jose Antunes and all the students who worked in our lab. I really appreciate their
valuable help and support in my academic life. I would like also to say thanks to my
friends: Chunzhao Chen, Na Mao, Wanyi Fu, Zhou Sun, Hongling Deng, Caiwu Ding
who provided me an enjoyable life.
Lastly, but most importantly, I am deeply thankful to my family for their love,
support, and sacrifices. Without them, I would not succeed in this endeavor. They are
providing me long-lasting support, understanding, encouragement, and patience, which
accompanied me through all the hardships during this research adventure. Words fail to
express my gratitude to them.

ix
TABLE OF CONTENTS
Chapter Page
1 INTRODUCTION …............................……………...….………………………….. 1
1.1 Background Information of 1,4-Dioxane ………………………………………. 1
1.2 Variety of Bioremediation Strategies for Dioxane Bioremediation ……………. 4
1.2.1 Monitored Natural Attenuation ………….…….…………………………. 5
1.2.2 Biostimulation ………….…….…………………………………………... 6
1.2.3 Bioaugmentation ………….…….………………………………………... 7
1.2.4 Bioreactor ………….…………………...……………………………….... 8
1.2.5 Pump-and-treat Treatment …….…….…………………...………………. 9
1.3 Current Research on Key Enzymes Responsible for Dioxane Degradation ….... 10
1.3.1 Dioxane Biodegradation Pathways ……….…….………………………... 10
1.3.2 Soluble Di-iron Monooxygenases (SDIMOs) ……………………………. 11
1.3.3 Enzymes Involved in Downstream Biotransformation …………………... 13
1.4 Current Challenges in Dioxane Bioremediation ….…….……………...………. 13
1.4.1 Limited Understanding of Initial Dioxane Oxidation at the Enzymatic
Level ……………………………………………………………………………. 13
1.4.2 Missing Step in the Dioxane Metabolic Pathway ………………………... 16
1.4.3 Limitations of Dioxane Bioremediation via Metabolism ………………... 17
1.4.4 Co-existence of Chlorinated Solvents with Dioxane …………………….. 18
1.5 Research Objectives ……………………………………………………………. 19

x
TABLE OF CONTENTS
(Continued)
Chapter Page
2 DISTINCT CATALYTIC BEHAVIORS BETWEEN TWO 1,4-DIOXANE
DEGRADING MONOOXYGENASES: KINETICS, INHIBITION, AND
SUBSTRATE RANGE ……………………………………………………………..
21
2.1 Introduction ……………………………………………………………………. 21
2.2 Materials and Methods ………...………………………………………………. 23
2.2.1 Chemicals and Cultures ………………………………………………….. 23
2.2.2 Heterologous Expression of PRM and THM ………….………….……... 24
2.2.3 Culturing and Induction of Transformants ………………………………. 25
2.2.4 SDS-PAGE Analysis …………………………………………………….. 25
2.2.5 Reverse Transcription Quantitative PCR (RT-qPCR) and Expression
Level Assay ……………………………………………………………………. 26
2.2.6 Enzyme Kinetics Modeling ……………………………………………… 28
2.2.7 Enzyme Kinetics and Inhibition Tests …………………………………... 30
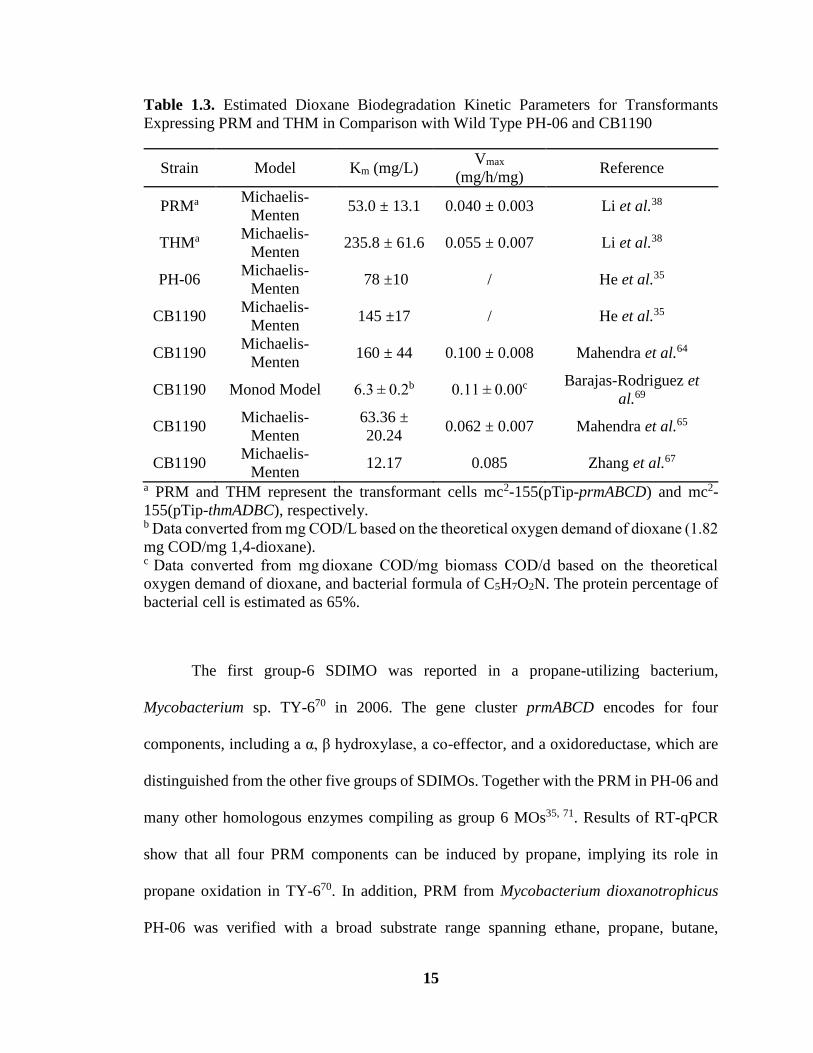
2.2.8 Substrate Range Characterization ……………………………………….. 32
2.2.9 Genomic Comparison ……………………………………………………. 34
2.2.10 Analytical Approaches …………………………………………………. 34
2.3 Results and Discussions ……………………………………………………….. 35
2.3.1 PRM Exhibits Higher Affinity to Dioxane than THM …………………... 35
2.3.2 1,1-DCE is the Most Potent Inhibitor to Both PRM and THM …………. 38
2.3.3 PRM is Less Susceptible to Chlorinated Solvent Inhibition than THM … 40
2.3.4 PRM has a Broader Substrate Range than THM ………………………... 43
2.4 Implications ……………………………………………………………………. 50

xi
TABLE OF CONTENTS
(Continued)
Chapter Page
2.4.1 Environmental Implications for Monitored Natural Attenuation of
Dioxane ………………………………………………………………………... 50
2.4.2 Environmental Implications for Biostimulation with Short-Chain
Alkane/ Alkene Gases …………………………………………………………. 53
3 CHARACTERIZING THE SOLUBLE DI-IRON MONOOXYGENASES
FAMILY: PHYLOGENY, EVOLUTION, AND SUBSTRATE RANGE ………... 55
3.1 Introduction ……………………………………………………………………. 55
3.2 Methods ………………………………………………………………………... 56
3.2.1 Construction of Phylogenetic Tree ………………………………………. 56
3.2.2 Alignment of Regulation Region Upstream of SDIMOs ………………... 57
3.3 Results and Discussions ……………………………………………………….. 57
3.3.1 Evolution of SDIMOs ………………..………………………………….. 57
3.3.2 Evidence of Horizontal Gene Transfer (HGT) …………………………... 59
3.3.3 SDIMOs Evolve Towards Saturated Substrates with High Dissociation
Energy of C-H Bonds ………………………………………………………….. 65
3.3.4 SDIMO Gene Regulation …..……………………………………………. 66
3.4 Implications ……………………………………………………………………. 71
4 UNTANGLING THE GENOMIC DIVERGENCE BETWEEN METABOLIC
AND CO-METABOLIC DIOXANE-DEGRADING ACTINOMYCETES ………. 72
4.1 Introduction ……………………………………………………………………. 72
4.2 Materials and Methods ………………………………………………………… 75
4.2.1 Genome Analysis and Comparison ……………………………………... 75
4.2.2 HEAA Degrading Gene Verification ……………………………………. 76
xii
TABLE OF CONTENTS
(Continued)
Chapter Page
4.3 Results and Discussion ………………………………………………………... 77
4.3.1 Putative HEAA Degrading Genes ..……………………………………... 77
4.3.2 Phylogenetic Analysis of Protein Candidates …………………………… 79
4.3.3 A Putative FMO Doesn’t Have HEAA Degradation Capacity ………….. 81
4.3.4 Downstream Genes Involved in Glycolate Transformation Are Essential
for Metabolic Biodegradation of Dioxane …………………………………….. 82
4.4 Future Work …………………………………………………………………… 85
5 EFFECTIVE REMOVAL OF TRACE LEVELS OF 1,4-DIOXANE BY
BIOAUGMENTATION WITH AZOARCUS SP. DD4 AND A
PROPANOTROPHIC CONSORTIUM ……………………………………………. 86
5.1 Introduction ……………………………………………………………………. 86
5.2 Materials and Methods ……….………………………………………………... 87
5.2.1 Sample Collection ………………………………………………………. 87
5.2.2 Microcosm Assays ……………………………………………………… 90
5.2.3 Quantitative Polymerase Chain Reaction (qPCR) ……………………… 91
5.2.4 Microbial Community Analysis ………………………………………… 92
5.2.5 Analytical Approaches ………………………………………………….. 93
5.3 Results …………………………………………………………………………. 94
5.3.1 Dioxane Degradation and Propane Utilization in Microcosms …………. 94
5.3.2 Community Structure Analysis by 16S rRNA Sequencing ……………... 97
5.3.3 TmoA, PrmA, and ThmA Abundances in Microcosms by qPCR Analysis 103

xiii
TABLE OF CONTENTS
(Continued)
Chapter Page
5.4 Discussion …………………………………………………............................... 106
5.4.1 Azoarcus sp. DD4 Bioaugmentation is Effective for Both ex situ and in
situ Dioxane Treatment at a Superfund Site …………………………………... 106
5.4.2 Exogenous Metabolizers Diminished but May Transfer Dioxane-
Degrading Genes to the Native Microorganisms ……………………………… 108
5.4.3 Indigenous Propanotrophic Mycobacterium May Participate in Propane
Utilization ……………………………………………………………………... 110
5.4.4 TmoA is a Suitable Biomarker for the Rapid Assessment of DD4
Bioaugmentation Performance ………………………………………………... 112
5.5 Conclusions ……………………………………………………………………. 113
6 SEQUENTIAL ANAEROBIC AND AEROBIC BIOREMEDIATION OF THE
COMMINGLED GROUNDWATER CONTAMINATION OF
TRICHLOROETHENE AND 1,4-DIOXANE ………………...…………………... 115
6.1 Introduction ……………………………………………………………………. 115
6.2 Materials and Methods .………………………………………………………... 117
6.2.1 Chemicals and Cultures …………………………..................................... 117
6.2.2 Anaerobic Microcosm Assays ……………………................................... 117
6.2.3 Bacterial Community Analysis after the Anaerobic Treatment …………. 122
6.2.4 Aerobic Microcosm Assays …………………………............................... 122
6.2.5 qPCR Analysis to Enumerate the Relative Abundance of DD4 after
Aerobic Treatment …………………………………………………………….. 124
6.2.6 Biotransformation of VC and cDCE by DD4 and their Inhibitory Effects
to Dioxane Degradation in DD4 ………………………………………………. 124
6.3 Results and Discussions.……………………………………………………….. 125

xiv
TABLE OF CONTENTS
(Continued)
Chapter Page
6.3.1 TCE was Transformed to cDCE and VC by SDC-9 in Anaerobic
Microcosms ……………………………………………………………………. 125
6.3.2 Halorespiring Bacteria Prevailed after the Anaerobic Bioaugmentation ... 126
6.3.3 Contribution of Abiotic Reactions to the TCE Removal was Minimal ..... 129
6.3.4 DD4 Effectively Eliminated Dioxane and Sustained its Abundance in
Aerobic Microcosms …………………………………………………………... 132
6.3.5 DD4 Entailed Cometabolic Degradation of cDCE and VC, Two Main
Accumulating Products from TCE Dehalogenation …………………………... 135
6.3.6 cDCE Was More Potent in Inhibiting Dioxane Degradation by DD4 than
VC ……………………………………………………………………………... 138
6.4 Conclusions …………………………………………………………………… 139
7 CONCLUSIONS AND FUTURE WORK ………………………………………… 142
REFERENCES ………………………………………………………………………... 146

xv
LIST OF TABLES
Table Page
1.1 Physical Properties of Dioxane …....……………….……………………………. 2
1.2 Dioxane Drinking Water or Groundwater Guidelines by States and National or
International Organizations ……….……………………………………………... 4
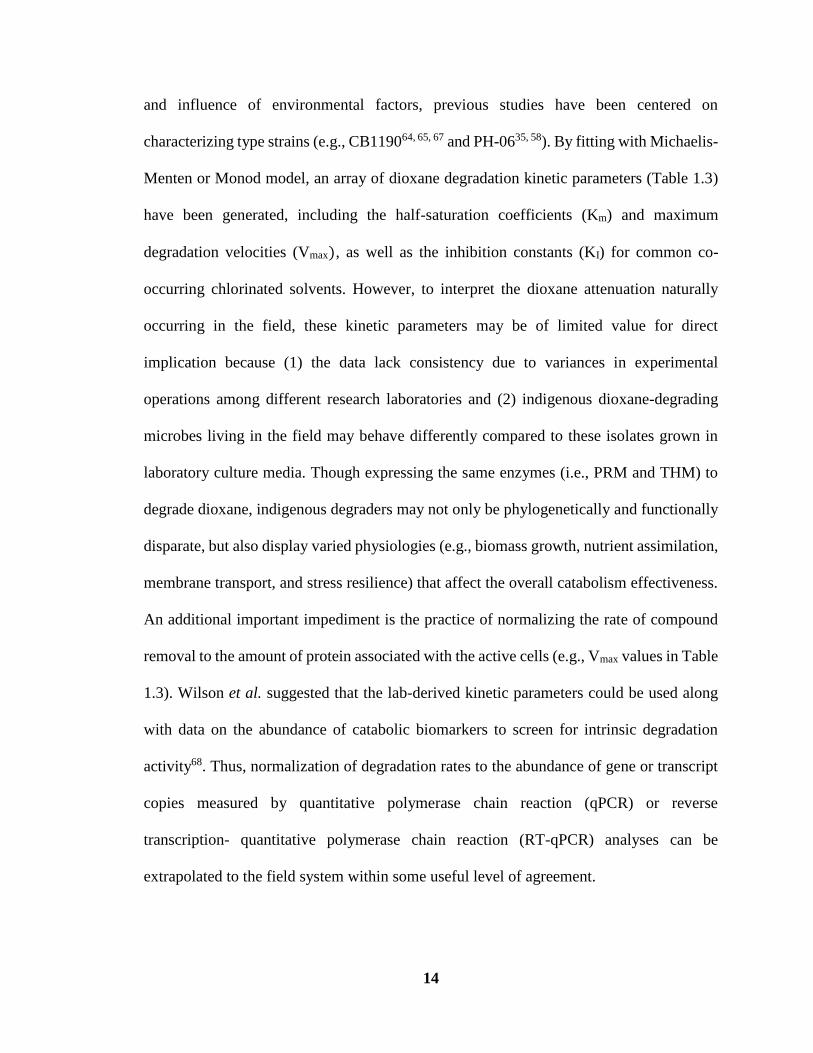
1.3 Estimated Dioxane Biodegradation Kinetic Parameters for Transformants
Expressing PRM and THM in Comparison with Wild Type PH-06 and CB1190 15
2.1 GC-FID or GC-MS Analysis of Tested Substrates ……………………………… 33
2.2 Inhibition Kinetic Parameters for Dioxane Degradation by PRM and THM
Expressing Transformants with the Presence of Three Chlorinated Compounds . 42
2.3 Inhibition Constants of Chlorinated Solvents to THM Expressing Transformants
in Comparison with CB1190 ……………………………………………………. 43
2.4 Substrate Range of PRM and THM and Accordant Degradation Rates ...………. 45
2.5 Bacteria Harboring the Complete Gene Clusters of prmABCD and thmADBC … 47
3.1 Subdivisions of SDIMO Enzyme Family, Host Strain, Accession Number,
Location of Gene Cluster, and Class and Phylum of Host Strain ……………….. 61
3.2 The C-H Bond Dissociation Energy of Alkanes, Alkene, and Dioxane
Analogues ……………………………………………………………………….. 66
3.3 Regulatory Regions Upstream of SDIMOs through Docking Sequence Motifs ... 69
4.1 List of Dioxane Degrading Strains ……………………………………………… 76
4.2 The HEAA Degrading Gene Candidates …....…………………………………... 78
4.3 Unique Downstream Genes Involving Dioxane/HEAA Degradation in
Metabolic Degraders …....……………………………………………………….. 84
5.1 Initial Concentrations of VOCs and Metals in Different Groundwater Samples .. 89
5.2 Microcosm Setup ....……………………………………………………………... 90
5.3 Sequences of Primers and Probes Used for qPCR ………………………………. 92

xvi
LIST OF TABLES
(Continued)
Table Page
5.4 The Relative Abundances of the Top 10 Most Abundant Genera in Various
Field Samples ……………………………………………………………………. 98
5.5 The Community Diversity Analysis Including Shannon and Simpson Index ....... 107
6.1 Characterization of VOCs in the Groundwater Sample from the Site ………....... 118
6.2 Compositions of Anaerobic Microcosms ………………………………………... 121
6.3 Compositions of Aerobic Microcosms ………………………………………….. 123
6.4 Monitoring of Dissolved Iron During the Anaerobic Treatments ………………. 131

xvii
LIST OF FIGURES
Figure Page
1.1 Chemical structure of dioxane. Left: structural formula. Right: three-
dimensional structural formula ……….…………………………………………. 1
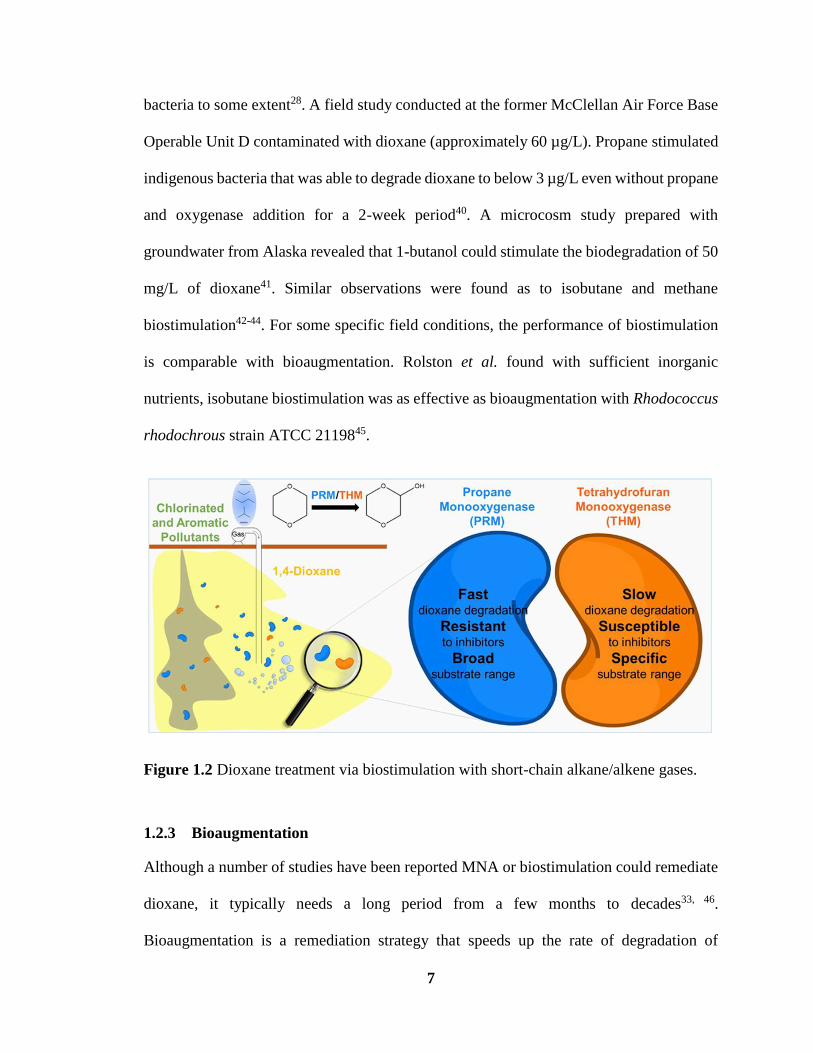
1.2 Dioxane treatment via biostimulation with short-chain alkane/alkene gases …… 7
1.3 Dioxane biodegradation pathway ……………………………………………….. 12
1.4 Overview schematic of this doctoral dissertation ……………………………….. 20
2.1 RT-qPCR analysis revealed uniform expression in mc2-155(pTips-prmABCD)
and mc2-155(pTips-thmADBC) after induction .………………………………… 28
2.2 (A) Michaelis-Menten curves exhibiting dioxane degradation kinetics by
transformant cells expressing PRM (blue square) and THM (orange triangle).
Dioxane degradation at environment-relevant concentrations were shown in the
inserted figure (B).……….………………………………………………………. 36
2.3 Inhibition of dioxane biodegradation by three chlorinated solvents in
transformant cells expressing PRM and THM. Cells were pre-exposed to 2
mg/L of each chlorinated solvent and then assessed their dioxane removal
efficiencies in the contact time of 3 h with an initial dioxane concentration of
10.0 mg/L. Error bars represent the standard deviation of triplicates. Asterisk
marks represent significant (p < 0.05) dioxane removal differences between
PRM and THM ……….…………………………………………......................... 39
2.4 Enzyme inhibition kinetics by the Michaelis-Menten model for PRM (A, B, C)
and THM (D, E, F) with the presence of 1,1-DCE (A, D), TCE (B, E), and
1,1,1-TCA (C, F). Degradation rates were estimated as the average of the
dioxane disappearance among triplicates within the contact duration of 3 h and
normalized towards the initial protein concentrations. No significant change in
three inhibitor concentrations was observed during these assays ……….............. 41
2.5 Regression between the apparent Vmax and Km values versus the concentrations
of inhibitors fitted by the linearized inhibition model with the highest R2 value .. 42

xviii
LIST OF FIGURES
(Continued)
Figure Page
2.6 Alignment of the nucleotide sequences of (A) five prmABCD gene clusters and
(B) five thmADBC gene clusters from different Actinomycetes generated by
Mauve 2.4.0. The prmABCD or thmADBC gene clusters are indicated by the
black bars. The Locally Collinear Blocks (LCB) indicate regions of homology
among all five strains; the similarity profiles of the genome sequences are
denoted by colored line inside blocks. The blocks depicted above or below the
center line indicate the location of the transcription strand in the forward or
inverse orientation …....……………………………………..................................
52
3.1 Phylogeny and operon organization of SDIMO family. (A) Unrooted maximum
likelihood phylogenetic tree of α- and β-oxygenase subunits. (B) Operon
organization for each group. Components are indicated in different colors …...... 64
4.1 Dioxane biodegradation pathways in metabolic and co-metabolic bacterial
strains. 2-Hydroxyethoxyacetic acid (HEAA) is mineralized in metabolism
pathway. In contrast, HEAA accumulated in co-metabolism degradation
pathway ………………………………………………………………………….. 73
4.2 Phylogenetic trees of (A) LLM class flavin-dependent oxidoreductase; (B)
cytochrome P450; (C) cyclohexanone monooxygenase ………………………… 81
4.3 SDS-PAGE analysis depicting the increased expression of the FMO proteins in
cell extracts from mc2-155 transformants with pTip-fmoPH and pTip-fmoCB in
comparison with the empty vector (pTio-QC2) control. Band positions
indicating two components of fmo gene clusters were estimated based on their
calculated protein size …………………………………………………………… 82
4.4 Alcohol/aldehyde dehydrogenases involving dioxane degradation are
extensively detected in Group 5 and 6 SDIMOs. Alcohol dehydrogenases are
shadowed in blue and aldehyde dehydrogenases are shadowed in orange ....…… 84
5.1 The 100, 10, 0.5 μg/L of dioxane isocontours at the Combe Fill South Landfill
Superfund site. The two in situ sampling points, MW1 and MW2, are indicated
as yellow circles …………………………………………………………………. 88
5.2 The flow chat of groundwater extraction and treatment (GWET) facility …........ 89

xix
LIST OF FIGURES
(Continued)
Figure Page
5.2 The flow chat of groundwater extraction and treatment (GWET) facility …........ 92
5.3 Dioxane degradation in microcosms treated with propane, DD4, and
propanotrophic consortium in comparison with the abiotic control. Microcosms
were prepared with varying groundwater samples, including (A) the influent and
(B) effluent of the GWET facility and two monitoring wells (C) MW1 and (D)
MW2. Arrows indicate repeated propane amendments when over 90% of
propane was consumed. The colors of the arrows are corresponding to the
treatment as indicated in the legend ……………………………………………... 95
5.4 Propane consumption in microcosms prepared by (A) Influent, (B) Effluent, (C)
MW1, and (D) MW2 …………………………………………………………….. 96
5.5 Dendrogram depicting the microbial community distribution at the genus level.
The columns represent groundwater microcosm treatments and the rows
represent genera. Color in the heat map is scaled in accordance with the relative
sequence abundance of a specific genus. Treatments that showed complete
dioxane removal are highlighted in blue. Treatments with no observable dioxane
degradation are highlighted in red. Dioxane in INF-propane (marked in green)
was partially degraded by indigenous microorganisms …………………………. 101
5.6 Neighbor-joining phylogenetic trees including representative OTUs annotated
as Mycobacterium (shaded by blue), Rhodococcus (shaded by green), and
Azoarcus (shaded by red), and some known propanotrophs. Phylogeny is
calculated in accordance with the V3-V4 region of 16S rRNA sequences. E. coli
DH5a and some known propanotrophic strains are included as references. The
numbers in the right table indicate the occurrence frequency of representative
OTUs in four types of water. The first column indicates the occurrences in
original water (maximum is 3 because of the missing EFF sample), the second
column represents the occurrences after propane inducement. The last two
columns indicate the treatments with DD4 and mixed culture augmentations ...... 103
5.7 The relative abundance of tmoA, prmA, and thmA by qPCR to target the toluene
monooxygenase in DD4, propane monooxygenase in PH-06, and
tetrahydrofuran monooxygenase in CB1190. All types of gene clusters are
normalized by the total bacteria equivalent to the total 16S rRNA gene copies
divided by 4.2 according to the qPCR detection ………………………………… 104

xx
LIST OF FIGURES
(Continued)
Figure Page
5.8 The principal coordinates analysis (PCoA) biplot shows weighted-UniFrac
based on distances quantitative (i.e., phylogeny) measures of microbial
community. PC1, PC2, represent the first and second principal components,
respectively. The percentage represents the contribution rate of this component
to sample difference. The distance between samples indicates the similarity of
the distribution of functional classifications in the sample. The closer the
distance, the higher similarity. INF (yellow), EFF (green), MW1 (blue), and
MW2 (red) ………………………………………………………………………. 109
5.9 Positive linear correlations between (A) dioxane degradation rate (μ/L/day) and
absolute copy number of Azoarcus (copy/sample), (B) dioxane degradation rate
(μ/L/day) and absolute copy number of tmoA (copy/sample), and (C) relative
abundance of tmoA (%) and relative abundance of Azoarcus (%). The
Spearman’s R indicates the correlation of two values …………………………... 113
6.1 Experimental scheme of the sequential anaerobic-aerobic treatment in this
microcosm study. Killed control (KC) and live control (LC) were designed for
both anaerobic (stage I) and aerobic (stage II) treatments. After the anaerobic
treatment, samples from I-SDC or I-SDC-SO4 were aerated, pooled, and split to
prepare the stage II aerobic treatments ………………………………………….. 121
6.2 cVOCs monitoring during the anaerobic treatments in killed control (I-KC), live
control (I-LC), and bioaugmentation microcosms amended with SDC-9 (I-
SDC), and with both SDC-9 and sulfate (I-SDC-SO4), respectively. Blue, green,
and yellow bars represent the concentration of TCE, cDCE, and VC in µM,
respectively ……………………………………………………………………… 126
6.3 Relative abundance (%) of dehalogenation bacteria, sulfate-reducing bacteria,
and other genera associated with dehalogenation in anaerobic microcosms after
bioaugmention with SDC-9 consortia. Red bars denote the genera relative
abundance (%) in anaerobic treatment that was bioaugmented with SDC-9 (I-
SDC). Blue bars represent genera relative abundance (%) in the anaerobic
treatment which was augmented with both SDC-9 and sulfate (I-SDC-SO4) …... 127
6.4 Dark particles formed in the anaerobic treatments bioaugmented with SDC-9
and sulfate (I-SDC-SO4) ………………………………………………………… 131

xxi
LIST OF FIGURES
(Continued)
Figure Page
6.5 Dioxane depletion in the aerobic treatments, including killed control (II-KC),
live control (II-LC), bioaugmentation with DD4 (II-DD4), and bioaugmentation
with DD4 and propane (II-DD4-Propane). The aerobic microcosms were
prepared with samples from the previous anaerobic treatment of (A) SDC-9
without sulfate (I-SDC) and (B) SDC-9 with sulfate amended (I-SDC-SO4).
Green arrows indicate the addition of propane ………………………………….. 132
6.6 Propane consumption (mg/L in headspace) in aerobic treatment (II-DD4-
Propane) after anaerobic treatment by SDC-9 bioaugmention (I-SDC) or SDC-9
with sulfate addition (I-SDC-SO4) ………………………………………………. 133
6.7 Relative abundance of DD4 estimated by qPCR in microcosms at the beginning
and end of the aerobic treatments by DD4 and DD4 with propane. The x-axis
indicates the samples were previously anaerobically treated by SDC-9 without
sulfate (I-SDC) or with sulfate (I-SDC-SO4) .…………………………………… 133
6.8 Degradation of dioxane by DD4 resting cells with or without the presence of
VC and cDCE. The concentrations of cDCE and VC were shown in (A) and
dioxane concentration was shown in (B) ………………………………………...
136
6.9 Co-metabolic degradation of dioxane (10 mg/L) by DD4 in anaerobically
pretreated groundwater with (A) or without (B) the presence of VC (1 mg/L)
and cDCE (1 mg/L) ……………………………………………………………… 137

xxii
LIST OF DEFINITIONS
USEPA United States Environmental Protection Agency
MNA monitored natural attenuation
SDIMO soluble di-iron monooxygenase.
SCAM short-chain alkane monooxygenase
sMMO soluble methane monooxygenase
PRM propane monooxygenase
THM tetrahydrofuran monooxygenase
TMO toluene monooxygenase
cVOC chlorinated volatile organic compounds
PCE tetrachloroethene
TCE trichloroethene
1,1,1-TCA 1,1,1-trichlorethane
cDCE 1,2-cis-dichloroethene
tDCE 1,2-trans-dichloroethene
1,2-DCA 1,2-dichloroethane
VC vinyl chloride
MTBE Methyl tert-butyl ether
THF tetrahydrofuran
MDL method detection limit
MRL minimum report limit

xxiii
LIST OF DEFINITIONS
(Continued)
PDX 1,4-dioxane-2-one
HEAA 2-hydroxyethoxyacetic acid, 2-(2-hydroxyethoxy) acetic acid
BSA bovine serum albumin
AMS ammonium mineral salts
NMS nitrate mineral salt
PBS phosphate-buffered saline
Vmax maximum degradation velocity
Km half-saturation coefficient
KI inhibition constant
qPCR quantitative polymerase chain reaction
RT-qPCR reverse transcription- quantitative polymerase chain reaction
GC gas chromatography
MS mass spectrometry
FID flame ionization detector
SDS-PAGE sodium dodecyl sulfate–polyacrylamide gel electrophoresis
SRB sulfate reducing bacteria
OD optical density
1
CHAPTER 1
INTRODUCTION
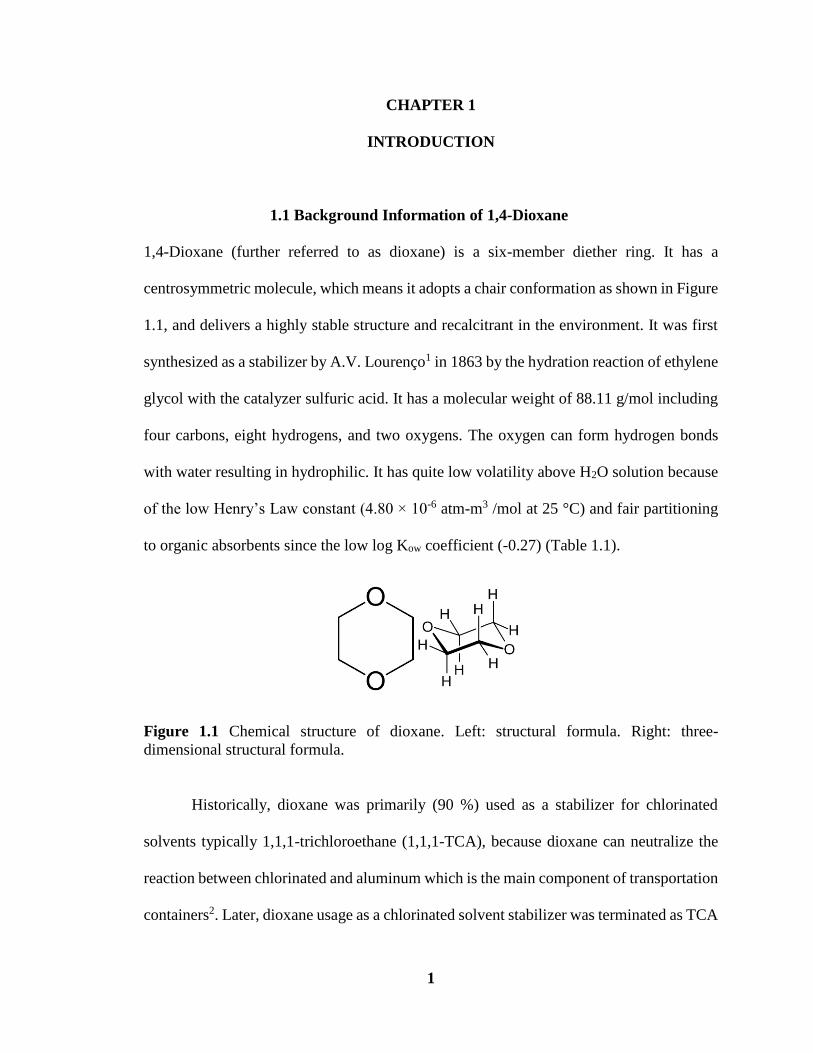
1.1 Background Information of 1,4-Dioxane
1,4-Dioxane (further referred to as dioxane) is a six-member diether ring. It has a
centrosymmetric molecule, which means it adopts a chair conformation as shown in Figure
1.1, and delivers a highly stable structure and recalcitrant in the environment. It was first
synthesized as a stabilizer by A.V. Lourenço1 in 1863 by the hydration reaction of ethylene
glycol with the catalyzer sulfuric acid. It has a molecular weight of 88.11 g/mol including
four carbons, eight hydrogens, and two oxygens. The oxygen can form hydrogen bonds
with water resulting in hydrophilic. It has quite low volatility above H2O solution because
of the low Henry’s Law constant (4.80 × 10⁻⁶ atm-m3 /mol at 25 °C) and fair partitioning
to organic absorbents since the low log Kow coefficient (-0.27) (Table 1.1).
Figure 1.1 Chemical structure of dioxane. Left: structural formula. Right: three-
dimensional structural formula.
Historically, dioxane was primarily (90 %) used as a stabilizer for chlorinated
solvents typically 1,1,1-trichloroethane (1,1,1-TCA), because dioxane can neutralize the
reaction between chlorinated and aluminum which is the main component of transportation
containers2. Later, dioxane usage as a chlorinated solvent stabilizer was terminated as TCA

2
was phased out under the 1995 Montreal Protocol. However, dioxane is still being
produced as an additive in many other products such as paint strippers, dyes, ink, greases,
antifreeze, polyethylene terephthalate (PET) plastic2, 3 and aircraft deicing fluids4. Because
of its good solubility for organic compounds, it is used as a purifying agent in the
manufacturing of pharmaceuticals and surface treatment agent for high purity metal. It is
also an excellent solvent for reaction systems. Trace levels of dioxane can be found in
consumer products such as detergents, shampoos, deodorants, and cosmetics. It may be
present in food supplements as well, which is expected from the residues from packing
adhesive or on food crops treated with a pesticide that contains dioxane5.
Table 1.1 Physical Properties of Dioxane
Properties Description
Chemical formula C4H8O2
Molar mass 88.11 g/mol
Appearance Colorless liquid
Odor Mild, ether-like
Density (25 °C) 1.033 g/mL
Melting point 11.8 °C
Boiling point 101.1 °C
Solubility (water) Miscible
Polarity index 4.8
Octanol-water partition coefficient (log Kow) -0.27
Organic carbon partition coefficient (log Koc) 1.23
Henry’s law constant at 25 °C (atm-m3 /mol) 4.80 ×10⁻⁶
Unfortunately, dioxane has been widely detected across the world in various
aquatic systems such as drinking water systems, municipal wastewater streams, rivers and
river beds, coastal marine environment, and groundwater6-9. In Japan, research
demonstrated that the water from river basin sewerage systems, chemical plants, and
effluents from the combined collection treatment from apartment houses serve as the
pollutant source discharging dioxane to the aquatic systems6. A dioxane concentration

3
investigation was done in Europe also revealing that the sewage treatment plant cannot
remove dioxane, whilst bank filtration and drinking water purification process cannot
eliminate dioxane. It marginally degraded from 650ng/L and 670 ng/L to 600 ng/L and 490
ng/L, respectively10. Approximately 22% of the public water systems (PWSs) were
detected with results higher than the minimum reporting level (MRL) which is 0.07 µg/L.
7% of the PWSs were detected higher than the reference concentration (i.e., 0.35 µg/L)
with the cancer risk level of 1:10000011. Among the US Air Force (USAF) installations, a
total of 732 out of 4196 (17%) groundwater monitor wells (GMWs) were contaminated
with dioxane that higher than the reporting limit4. Recent site surveys revealed a high co-
occurrence frequency of dioxane with 1,1,1-TCA and/or trichloroethene (TCE) at impacted
sites nationwide4, 8, 12.
Dioxane is classified as a possible human carcinogen by the Environmental
Protection Agency (EPA), the International Agency for Research on Cancer (IARC), the
National Institute for Occupational Safety and Health (NIOSH), and the European Union
(EN)13-15. Dioxane has also been listed as a “high priority” pollutant in the 2016 amendment
of the Toxic Substance Control Act (TSCA)16. Although there is limited evidence showing
its carcinogenic effect to humans, dioxane’s carcinogenicity has been verified with
increasing incidences of nasal cavity, liver and gall bladder tumors after a chronic exposure
based on animal studies. A short-term exposure to a high concentration of dioxane (> 200
mg/L) causes nausea, drowsiness, headache, and irritation to organisms reported by the
Agency for Toxic Substances and Disease Registry (ATSDR), EPA, NIOSH, and EU.
The lack of federal maximum contaminant level (MCL) makes states to legislate
varying guideline levels for dioxane. To date, dioxane in drinking water was suggested to

4
be lower than 50 µg/L accordingly to the lifetime cancer risk of 10-5 by WHO17.
Independently, USEPA also reported a guideline for dioxane in drinking water at the cancer
risk level of 10-6, which is 0.35 µg/L18. The New Jersey Department of Environmental
Protection (NJDEP) released a strict groundwater criterion of 0.4 µg/L for dioxane in
groundwater following the cancer risk level at 1:100000019. The most stringent regulation
level is 0.25 µg/L in New Hampshire initiated in 2011 (Table 1.2).
Table 1.2 Dioxane Drinking Water or Groundwater Guidelines by States and National or
International Organizations
State/Organization Guideline (µg/L) Source
Alaska 77 AL DEC 2016
California 1.0 Cal/EPA 2011
Colorado 0.35 CDPHE 2017
Connecticut 3.0 CTDPH 2015
Delaware 6.0 DE DNR 1999
Florida 3.2 FDEP 2005
Indiana 7.8 IDEM 2015
Maine 4.0 MEDEP 2016
Massachusetts 0.3 MADEP 2004
Minnesota 1.0 MDH 2015
Mississippi 6.09 MS DEQ 2002
New Hampshire 0.25 NH DES 2011
New Jersey 0.4 NJDEP 2015
New York 50 NYDOH 2015
North Carolina 3.0 NCDENR 2015
Pennsylvania 6.4 PADEP 2011
Texas 9.1 TCEQ 2016
Vermont 3.0 VTDEP 2016
Washington 0.438 WA ECY 2015
West Virginia 6.1 WV DEP 2009
United States 0.35 US EPA 2010
WHO 50 WHO 2011
1.2 Variety of Bioremediation Strategies for Dioxane Bioremediation
Dioxane poses a current and future threat to human due to its recalcitrance and possible
human carcinogen. As a cyclic ether, dioxane exhibits high mobility and persistency once

5
released to the environment. It is recognized as one of the most frequently detected
nonregulated pollutants in our water supplies and sources based on the national survey for
the Third Unregulated Contaminant Monitoring Rule (UCMR3)11. Dioxane’s extreme
hydrophilicity and water miscibility may also lead to the formation of large dilute plumes
with trace concentrations (e.g., < 1 mg/L20) in the subsurface2, 21. Due to the miscible
solubility and low organic carbon partition coefficient (log KOC = 1.23) of dioxane22, its
efficiency limits the use of GAC in groundwater treatment with high flows and low
concentration. Although a novel adsorbent, AMBERSORBTM 560, can effectively remove
dioxane over a wide range of concentration down to sub-0.3 µg/L23, the cost is non-
negligible because of the large volume of the dioxane-impacted plume. Same to physical
adsorption, AOP is a strategy that needs high cost although it can unbiasedly oxidize many
persistent organic contaminants24. Typically, capital costs range from $80,000 to $500,000
with operations and maintenance costs ranging from $0.20 to $1.50 per 1,000 gallons of
water treated25. Some other reasons also significantly limit the application of AOP
including the turbidity of aqueous, hydroxyl radical scavenging, unexpected toxic
byproducts and acidity of the treated water26-29. Biological treatment strategies including
monitored natural attenuation (MNA), bioaugmentation, biostimulation, pump-and-treat,
membrane bioreactor (MBR) have supported bioremediation as a viable method for
dioxane cleanup, especially in terms of cost, feasibility, and destruction of dioxane.
1.2.1 Monitored Natural Attenuation
Monitored Natural attenuation (MNA) generally relies on biological processes, which,
unaided by deliberate human intervention, reduce the low concentration of dioxane.
However, its feasibility highly dependents on the biodegradation capabilities of indigenous

6
communities at specific sites30-32. Increasingly, stakeholders responsible for cleanup as
well as environmental regulators are relying upon natural attenuation as a remediation
strategy because it is the most cost-efficient approaches to manage groundwater
contamination and also it has the lowest sustainability impacts to the environment33. A few
of current research revealed that dioxane MNA happens at a significant number of project
sites12, 32. It relies on the indigenous bacteria harboring propane monooxygenase (PRM),
tetrahydrofuran monooxygenase (THM) which can degrade dioxane from the field
samples30-32, 34-38. With the assistance of modern molecular techniques, such as compound-
specific isotope analysis (CSIA)39, gene biomarker30, 32, 35, 36, and microarray32, genes
encoding these dioxane degrading monooxygenases were successfully detected at
contaminated sites to support the feasibility of MNA.
1.2.2 Biostimulation
Similar to MNA, biostimulation utilizes the indigenous degraders to degrade organic
pollutants. It is a biological remediation strategy that involves the modification of the
environment to stimulate the indigenous bacteria capable of bioremediation. To our best
knowledge, most dioxane-degraders can utilize auxiliary substrate (alkane, alkene,
alcohols, and THF) as carbon source and enable the dioxane degradation. The reason
underlying is because the involving degrading enzymes, SDIMOs, has a wide range of
substrate range. To data, only a handful of field or microcosm studies documented methane,
propane, isobutane, and 1-butanol biostimulation in dioxane cleanups. Propane is the most
promising stimulation gas for dioxane remediation due to the research found most of the
dioxane degraders are propanotrophs. Amendment of 1-butanol (100 mg/L) or THF (300
µg/L) could enhance the trace level dioxane (<300 µg/L) degradation by indigenous
7
bacteria to some extent28. A field study conducted at the former McClellan Air Force Base
Operable Unit D contaminated with dioxane (approximately 60 µg/L). Propane stimulated
indigenous bacteria that was able to degrade dioxane to below 3 µg/L even without propane
and oxygenase addition for a 2-week period40. A microcosm study prepared with
groundwater from Alaska revealed that 1-butanol could stimulate the biodegradation of 50
mg/L of dioxane41. Similar observations were found as to isobutane and methane
biostimulation42-44. For some specific field conditions, the performance of biostimulation
is comparable with bioaugmentation. Rolston et al. found with sufficient inorganic
nutrients, isobutane biostimulation was as effective as bioaugmentation with Rhodococcus
rhodochrous strain ATCC 2119845.
Figure 1.2 Dioxane treatment via biostimulation with short-chain alkane/alkene gases.
1.2.3 Bioaugmentation
Although a number of studies have been reported MNA or biostimulation could remediate
dioxane, it typically needs a long period from a few months to decades33, 46.
Bioaugmentation is a remediation strategy that speeds up the rate of degradation of

8
contaminants by adding bacterial cultures. Many researches have been studies on dioxane
remediation by bioaugmentation technology including the use of CB1190, ENV425, DVS
5a1, and many other strains. Microcosm study revealed that the augmentation of CB1190
or DVS 5a1 could degrade 50 mg/L initial dioxane at the degradation rate of 0.16 ± 0.04
and 0.015 ± 0.006 mg dioxane/d/mg protein at 14 °C, respectively41. Results showed that
propane biosparging with the addition of Rhodococcus ruber ENV425 (4×10⁹ cells/mL)
can be used for in situ treatment of dioxane from 1090 µg/L to below 2 µg/L within 8-
month of operating time47. He et al. indicated PH-06 would be a better bioaugmentation
candidate because of the greater cells yield (Y = 0.16 g protein/g dioxane) and higher
affinity to dioxane (Km = 78 ± 10 mg/L) in comparison with CB1190 (Km = 145 ± 17
mg/L, Y = 0.11 g protein/g dioxane). Our results also suggested that the PH-06 is a better
alternative for bioaugmentation than CB1190 because PRM in PH-06 has a broader
substrate range than THM38 (Figure 1.2). However, the current studies only focused on
Gram-negative strains.
1.2.4 Bioreactor
Bioreactor is a manufactured device that supports a biologically active environment. It
enables the operation controllable and easily changes the reaction condition depending on
different water types and bacterial strains. Entrapped Afipia sp. strain D1 in a continuous
feeding bioreactor could degrade dioxane from 400-730 mg/L to 3.4-3.6 mg/L with
estimated degradation rates of 0.67 and 0.46 kg dioxane/m3/day at the loading rate ranging
from 0.09-0.7 kg dioxane//m3/day48, 49. Pseudonocardia sp. D17 were used to replace D1
which could degrade the low level of influent dioxane (5-15 mg/L) and also promote the
effluent quality to 0.38-0.49 mg/L at the loading rate of 0.06-0.10 kg dioxane/m3/day50. An

9
up-flow biological aerated filter (UBAF) was used to treat the wastewater from polyester
manufacture containing an average of 31 mg/L of dioxane. A lab-scale bioreactor indicates
that maximum of 99.5% dioxane was removed by packed sludge at the loading rate of 0.04
to 0.31 kg dioxane/m3/day51. A full-scale treatment test was conducted at the Lowry
Landfill Superfund Site using moving bed bioreactor at the loading rate of 25.2 kg
dioxane/m3/day. Results showed that 99% of dioxane (initial concentration: 10-25 mg/L)
was degraded together with THF presence (10-60 mg/L)52, 53.
1.2.5 Pump-and-treat Treatment
Pump-and-treat approach is a viable ex situ contaminant-removal approach due to the high
mobility of dioxane. However, its mobility reversely causes the back diffusion from low
permeability subsurface which makes pump-and-treat a long-term proposition46. This
treatment approach particularly suitable for those contaminated sites with limit in situ
treatment efficiencies or co-contaminated with other pollutants. Because the following
sections after extraction from ground can be various including sorption, advanced
oxidation, and biological methods depending on the site properties. However, of significant
sites have a relatively large mass of contaminants in the tremendous volume of plumes
(e.g., over hundred million liters54) comparing with the rate of removal by pump-and-treat
option. To this aspect, this treatment approach is best thought of as a management tool to
prevent continuation of contaminant migration54.

10
1.3 Current Research on Key Enzymes Responsible for Dioxane Degradation
1.3.1 Dioxane Biodegradation Pathways
Dioxane biodegradation pathways in metabolizers and co-metabolizers have been
proposed by previous research55-57. It is well established that bacterial monooxygenases
confer dioxane initialization ability in many dioxane degraders36, 37, 58. Hydroxylation
firstly happens at any C-H bond in dioxane resulting in production of 1,4-dioxane-2-one
and/or 2-hydroxyethoxyacetaldehyde. These two intermediates can be oxidized by
alcohol/aldehyde dehydrogenases to 1,4-dioxane-2-one (PDX) and/or 2-
hydroxyethoxyacetic acid (HEAA). In metabolizers, CB1190, PH-06, and Acinetobacter
baumannii DD1, they subsequently oxidize to carboxylic acid, and then cleavage the
second ether bond leading to the production of two-carbon intermediates, such as glyoxal,
ethylene glycol, glycoaldehyde, glycolate. Further, they become glyoxylate which is
another key feature in dioxane degradation pathway besides HEAA. From glyoxylate, it
partially converted to oxalate and completely mineralized to carbon dioxide. Results
showed that when CB1190 grew on isotope-labelled [13C] dioxane, all detected amino acids
also labeled through dioxane assimilation, which directly indicates that dioxane served as
a sole carbon source to CB1190. Collectively, dioxane either converted to CO2 or enter the
bacterial central metabolism (Figure 1.3)55, 57, 59. Unlike metabolizers, co-metabolizers
including Pseudonocardia sp. Strain ENV478, Pseudomonas mendocina KR1,
Rhodococcus ruber T1 and T5 cease the degradation process at HEAA60-62 and
accumulated as the end product.

11
1.3.2 Soluble Di-iron Monooxygenases (SDIMOs)
Soluble Di-iron Monooxygenases (SDIMOs) are multicomponent bacterial enzymes that
can incorporate one oxygen atom from O2 into various substrates such as chlorinated
solvents, aromatic hydrocarbons, alkanes, and alkenes to initiate catabolism. They were
found in phylogenetically and physiologically diverse bacteria including Actinobacteria
(e.g., Mycobacterium, Rhodococcus, Pseudonocardia, Gordonia, Nocardioides) and
Proteobacteria (e.g., Burkholderiales, Xanthobacter, Pseudomonas, Methylomonas,
Ralstonia, Cupriavidus)63. Six groups of SDIMOs were distinguished on the basis of their
component arrangement, substrate specificity, and alpha oxygenase subunit identity.
Corresponding to their physiological roles, they were named as phenol monooxygenases
(group 1), alkene/aromatic monooxygenases (group 2), soluble methane monooxygenases
(sMMO) (group 3), alkene monooxygenases (group 4), tetrahydrofuran monooxygenase
(THM) and propane monooxygenases (group 5), and group 6 monooxygenases embracing
a collection of MOs that can catalyze a variety of short-chain alkanes/alkenes. SDIMOs
are essential enzymes in bacterial oxidation of many pollutants and have broad applications
in environmental and industrial biotechnology63. Coleman et al. did a survey of SDIMO in
environmental samples, ethene enrichments, and ethene-degrading bacterial isolates.
Results showed the ubiquity and diversity of SDIMOs in theses samples and
microorganisms with positive detection of genes encoding ethene (etnC), propene (amoC,
pmoC), propane (prmA), and butane (bmoX) monooxygenases. Given the tight lingkage
between SDIMO catalysis and dioxane biodegradation, several SDIMOs have been studied
using state-of-the-art molecular tools. With the combination of Geochip and denaturing
gradient gel electrophoresis (DGGE), Li et al. revealed that thmA-like genes coding for

12
group-5 SDIMOs were detected 2.4-fold more abundant over the background at the source
zone of dioxane plume32. Recent research discovered a group-6 propane monooxygenase
in PH-06 is an alternative dioxane degrading enzyme that can also intiate the dioxane
metabolic degradation pathway35, 36, 63. Further, some previous studies reported that group-
1 and 2 SDIMOs from Pseudomonas mendocina KR1, Ralstonia pickettii PKO1, and
Burkholderia cepacia G4 may involve in dioxane biodegradation via cometabolism64, 65.
Figure 1.3 Dioxane biodegradation pathway.
Source: Grostern et al.55

13
1.3.3 Enzymes Involved in Downstream Dioxane Biotransformation
After dioxane is oxidized by SDIMOs to 2-hydroxy-1,4-dioxane and/or 2-
hydroxyethoxyacetaldehyde, further oxidization by dehydrogenases (i.e., alcohol or
aldehyde dehydrogenases) forms 1,4-dioxane-one and/or 2-hydroxyethoxyacetic acid. In
dioxane metabolizers (e.g., CB1190 and PH-06), these intermediates undergo a further
oxidation step catalyzed by an unknown enzyme that can insert another hydroxyl group to
1,4-dioxane-one and 2-hydroxyethoxyacetic acid. Sebsequent cleavage takes place to
produce two-carbon intermediates (e.g., glycolate and glyoxylate in Figure 1.3). Some of
these two-carbon intermediates will be further converted to glyoxylate by multiple oxidases,
such as aldehyde dehydrogenases and glycolate oxidases. The heterologously expressed
glyoxylate carboligase encoding gene from CB1190 in Rhodococcus jostii RHA1 could
activated by the exposure of dioxane. It suggests the participation of this key enzyme in
downstream degradation of dioxane55. Glyoxylate is further assimilated into the bacterial
central metabolism, TCA cycle. It also reported that CB1190 is an autotrophical bacterial
strain that can grow using H2 and CO2. The results of gene expression microarrays
suggested that CB1190 fixes CO2 through Calvin-Benson-Bassham (CBB) cycle
depending on the key enzyme RubisCO and PRK66.
1.4 Current Challenges in Dioxane Bioremediation
1.4.1 Limited Understanding of Initial Dioxane Oxidation at the Enzymatic Level
To date, two well studied dioxane metabolic degraders CB1190 and PH-06 harbor group-
5 tetrahydrofuran monooxygenase and group-6 propane monooxygenase, respectively, for
the initialization of dioxane biodegradation. To discern dioxane degradation capabilities
14
and influence of environmental factors, previous studies have been centered on
characterizing type strains (e.g., CB119064, 65, 67 and PH-0635, 58). By fitting with Michaelis-
Menten or Monod model, an array of dioxane degradation kinetic parameters (Table 1.3)
have been generated, including the half-saturation coefficients (Km) and maximum
degradation velocities (Vmax), as well as the inhibition constants (KI) for common co-
occurring chlorinated solvents. However, to interpret the dioxane attenuation naturally
occurring in the field, these kinetic parameters may be of limited value for direct
implication because (1) the data lack consistency due to variances in experimental
operations among different research laboratories and (2) indigenous dioxane-degrading
microbes living in the field may behave differently compared to these isolates grown in
laboratory culture media. Though expressing the same enzymes (i.e., PRM and THM) to
degrade dioxane, indigenous degraders may not only be phylogenetically and functionally
disparate, but also display varied physiologies (e.g., biomass growth, nutrient assimilation,
membrane transport, and stress resilience) that affect the overall catabolism effectiveness.
An additional important impediment is the practice of normalizing the rate of compound
removal to the amount of protein associated with the active cells (e.g., Vmax values in Table
1.3). Wilson et al. suggested that the lab-derived kinetic parameters could be used along
with data on the abundance of catabolic biomarkers to screen for intrinsic degradation
activity68. Thus, normalization of degradation rates to the abundance of gene or transcript
copies measured by quantitative polymerase chain reaction (qPCR) or reverse
transcription- quantitative polymerase chain reaction (RT-qPCR) analyses can be
extrapolated to the field system within some useful level of agreement.
15
Table 1.3. Estimated Dioxane Biodegradation Kinetic Parameters for Transformants
Expressing PRM and THM in Comparison with Wild Type PH-06 and CB1190
Strain Model Km (mg/L) Vmax
(mg/h/mg) Reference
PRMa Michaelis-
Menten 53.0 ± 13.1 0.040 ± 0.003 Li et al.38
THMa Michaelis-
Menten 235.8 ± 61.6 0.055 ± 0.007 Li et al.38
PH-06 Michaelis-
Menten 78 ±10 / He et al.35
CB1190 Michaelis-
Menten 145 ±17 / He et al.35
CB1190 Michaelis-
Menten 160 ± 44 0.100 ± 0.008 Mahendra et al.64
CB1190 Monod Model 6.3 ± 0.2b 0.11 ± 0.00c Barajas-Rodriguez et
al.69
CB1190 Michaelis-
Menten
63.36 ±
20.24 0.062 ± 0.007 Mahendra et al.65
CB1190 Michaelis-
Menten 12.17 0.085 Zhang et al.67
a PRM and THM represent the transformant cells mc2-155(pTip-prmABCD) and mc2-
155(pTip-thmADBC), respectively. b Data converted from mg COD/L based on the theoretical oxygen demand of dioxane (1.82
mg COD/mg 1,4-dioxane). c Data converted from mg dioxane COD/mg biomass COD/d based on the theoretical
oxygen demand of dioxane, and bacterial formula of C5H7O2N. The protein percentage of
bacterial cell is estimated as 65%.
The first group-6 SDIMO was reported in a propane-utilizing bacterium,
Mycobacterium sp. TY-670 in 2006. The gene cluster prmABCD encodes for four
components, including a α, β hydroxylase, a co-effector, and a oxidoreductase, which are
distinguished from the other five groups of SDIMOs. Together with the PRM in PH-06 and
many other homologous enzymes compiling as group 6 MOs35, 71. Results of RT-qPCR
show that all four PRM components can be induced by propane, implying its role in
propane oxidation in TY-670. In addition, PRM from Mycobacterium dioxanotrophicus
PH-06 was verified with a broad substrate range spanning ethane, propane, butane,

16
isobutane, and ethene38. Further, two homologues of group-6 SDIMOs (i.e., Gene IDs of
alpha subunits are CRM90_28385 and CRM90_29005) and one SDIMO similar to group-
3 sMMO (CRM90_28910) were discovered in Mycobacterium sp. ENV42172. The
comparative proteomics using MALDI/MS revealed that the expression of alpha
component, CRM90_29005, was upregulated by propane over three orders of magnitude
greater than the control that was grown with succinate73, 74.
1.4.2 Missing Step in the Dioxane Metabolic Pathway
Though dioxane biodegradation pathways have been investigated in many previous studies
with many involved enzymes explicitly uncovered or postulated, it remain to be seen what
enzyme is responsible for the oxidation of dioxane-2-one and HEAA. HEAA and dioxane-
2-one are spontaneously interconverted by adding or losing a water molecule. As key
intermediates in dioxane biodegradation, HEAA and dioxane-2-one were initially reported
as accumulating metabolites in dioxane biotransformation mediated by cytochrome P450
monooxygenases in humans75 and rats76-78. Similarly, in dioxane co-metabolic degraders,
such as ENV478 and DD4, HEAA was found as a terminal product generated from dioxane
oxidation. When ENV478 was exposed to 14C-labeled dioxane, isotopic HEAA was
detected as the sole metabolite by HPLC without derivatization60. Thus, whether HEAA
can be further assimilated or not is the prominent difference that distinguishes dioxane
metabolizers and co-metabolizers. To date, little is known regarding the enzyme
responsible for this critical step of HEAA oxidation. Mahendra et al. firstly proposed that
the enzyme initializing dioxane degradation also involved in HEAA hydroxylation56.
However, later Sales et al. heterologously expressed thmADBC confirming its encoded
group-5 THM can oxidize dioxane and stoichiometrically form HEAA in the transformant

17
clone. Microarray data suggest that HEAA upregulates the expression of thmADBC, but
THM is not the enzyme responsible for the degradation of HEAA in CB119057. Thus, a
major knowledge gap persists regarding the molecular basis of HEAA biotransformation
in dioxane metabolizers, underscoring the needs for further investigation.
1.4.3 Limitations of Dioxane Bioremediation via Metabolism
Although bioaugmentation is generally effective in removing target pollutants under
laboratory conditions, performance of inoculating bacteria under natural conditions is less
reliable due to the complexity of environmental conditions79. A study was conducted to
systematically compare the biodegradation via metabolism (i.e., in CB1190) and co-
metabolism (i.e., in ENV425). Kinetical fitting by Monod model suggest that co-
metabolism of dioxane is faster than metabolism when the initial dioxane concentration is
1 mg/L or lower69. A microcosm study also revealed that auxiliary substrate (300 µg/L of
THF) temporarily enhanced the degradation of low concentration of dioxane (i.e., <300
µg/L) by the metabolic degrader CB1190. However, addition of this auxiliary carbon
source can have counterproductive consequences in long term, since the inducing substrate
may exert competitive inhibition to dioxane degradation. When CB1900 is fed with non-
inducing substrates (e.g., 1-butanol), it can cure the catabolic plasmid that carries
thmADBC, leading to the loss of dioxane degradation capacity28. Given the fastidious
growth condition of microbes imposed in typical environment, including the inhibitory
substances and the low concentration of available nutrients, the co-metabolic strains are
more profitable to such conditions80.

18
1.4.4 Co-existence of Chlorinated Solvents with Dioxane
As the main use of dioxane for stabilizing chlorinated solvents, dioxane therefore
commonly found co-occurring with chlorinated solvents including TCE, TCA, and its
anaerobic metabolites, cDCE and VC. Co-contamination of TCE and dioxane has been
reported across the US and globally. Anderson et al.4 unveiled that 93.5% (730 out of 781)
of TCE detectable sites co-exist with dioxane, and 1,1,1-trichloroethane (TCA) co-exist in
29.3% (229 out of 781) of the dioxane-contaminated wells based on the monitoring data
from over 4196 United States Air Force (USAF) sites. Similarly, Adamson et al.8
investigated > 2000 sites in California. Among the 605 sites with positive detection of
dioxane, 94% had TCE/TCA contamination. Chlorinated volatile organic compounds
(cVOCs) are the most prevalently detected organic contaminants in aquifers, overburdens,
and soils. Once released to the subsurface, cVOCs interact with aquifer materials through
dynamic adsorption and desorption processes governed by their relatively low solubility
and high hydrophobicity81. Trichloroethene (TCE) in particular is of great concern because
it is a potent mutagen and can generate carcinogenic metabolites, such as cis-
dichloroethene (cDCE), trans-dichloroethene (tDCE), vinyl chloride (VC), via biotic and
abiotic degradation82. Thus, USEPA has enforced a stringent regulation for TCE with a
maximum contaminant level (MCL) of 5 μg/L83, stimulating extensive research and
engineering efforts in TCE remediation.
With the discovery of reductive dehalogenation84, 85, anaerobic bioremediation has
emerged as a feasible and economical alternative for in situ treatment of chlorinated
solvents, particularly TCE. For instance, SDC-9 (Aptim, Inc., Lawrenceville, NJ) is a
commercialized consortium consisting of the dehalorinating bacteria belonging to genera

19
Dehalococcoides (31%) and Desulfitobacterium (2.7%) and many other bacteria associated
with dehalogenation86. Via respiratory dehalogenation, SDC-9 can effectively reduce TCE
to cDCE and VC87, and eventually to the non-toxic ethene84, 88, under anaerobic condition.
SDC-9 thus has been widely used as the bioaugmentation inoculum for in situ
bioremediation of TCE and other highly chlorinated cVOCs at over 600 impacted sites
with varying geochemical conditions89, 90. However, dioxane anaerobic biodegradation is
elusive at current time. To our best knowledge, only one research reported the anaerobic
biodegradation of dioxane, in which an enriched anaerobic sludge with iron-reducing
bacteria was operated over the 70-days while being amended with Fe(III) oxide (30 mM)
and humic acid (0.5g/L)91. Therefore, an effective and feasible in situ treatment strategy
for chlorinated solvents and dioxane is of urgent needs.
1.5 Research Objectives
Built upon current research progress and challenges in dioxane biodegradation molecular
foundations and their implications for groundwater bioremediation, this dissertation is
oriented to tackle major knowledge gaps and technology barriers from five aspects listed
as follows:
(1) To comprehensively characterize and compare two archetypical dioxane-
degrading enzymes, PRM and THM, on their enzyme kinetics, substrate ranges, responses
to co-existing chlorinated solvent inhibitors. This study uncovers the differences between
group-5 and group-6 SDIMOs at the enzymatic level, revealing their contributions in
natural attenuation and biostimulation with short-chain alkanes.
(2) To investigate the evolution, configuration, regulation, and catalytic ability of
group-6 SDIMOs. This work sheds light on fundamental understanding of microecological
roles of group-6 SDIMOs in natural and engineered environments.
(3) To untangle the genomic divergence between metabolic and co-metabolic
dioxane cometabolizers and postulate enzyme candidates that may involve in HEAA
oxidation. This study is of great value to underpin and potentially complete the dioxane
biodegradation pathway in metabolism.

20
(4) To assess the treatment efficiency of trace levels of dioxane by a newly isolated
co-metabolizer, Azoarcus strain DD4, in pure and mixed inocula. This is an exampelary
study demonstrating the advantages of co-metabolizers for both in situ and ex situ
treatments of dioxane, particularly when the intial concentration is low at ppb levels.
(5) To develop an anaerobic-aerobic sequential treatment approach for sites
impacted by commingled contamination of trichloroethene and dioxane. This novel
treatment train doesn’t only accelerate the removal of both trichloroethene and dioxane,
but also alleviates the issue caused by hazardous byproduct accumulation.
The overview organization of this doctoral research is shown in Figure 1.4.
Figure 1.4 Overview schematic of this doctoral dissertation.

21
CHAPTER 2
DISTINCT CATALYTIC BEHAVIORS BETWEEN TWO 1,4-DIOXANE
DEGRADING MONOOXYGENASES: KINETICS, INHIBITION, AND
SUBSTRATE RANGE
2.1 Introduction
As the increasing attention to dioxane bioremediation, a number of bacteria have been
isolated and identified given their ability of growing with dioxane as their sole carbon and
energy source via metabolism58, 92, 93. Mycobacterium dioxanotrophicus PH-0636, 58 and
Pseudonocardia dioxanivorans CB119092, 94 are two archetypic dioxane degrading strains
which share the same transformation pathway57, 58. In PH-06, we recently uncovered and
verified the dioxane catalytic function of a novel propane monooxygenase (PRM)36, 95
encoded by the gene cluster prmABCD located on a linear plasmid. In contrast, CB1190
expresses tetrahydrofuran monooxygenase (THM)57 encoded by thmADBC to oxidize
dioxane and tetrahydrofuran (THF). Though with relatively low sequence identity (< 40%
for α subunits) and different arrangement of core gene components, PRM and THM are
phylogenetically related, both belonging to the multi-component bacterial enzyme family,
soluble di-iron monooxygenases (SDIMOs)36, 96, 97. PRM and THM are categorized as
subgroups 6 and 5 SDIMOs30, 35, 36, respectively, reflecting the potential divergence of their
enzyme structures and catalytic behaviors.
Genes encoding THM (e.g., thmA and thmB) have been detected at sites historically
impacted by dioxane, indicating the existence of indigenous dioxane degrading
microorganisms by use of modern biotechnologies (e.g., quantitative PCR [qPCR]30, 31, 98,
99 and microarray32). Abundance of thm genes was positively correlated with the dioxane
removal observed in bench-scale microcosm and in situ Biotrap assays30, 31, 99, supporting

22
the significant contribution of bacteria expressing THM to intrinsic dioxane attenuation in
the field. The discovery of dioxane degrading propanotrophs and the essential PRM
enzyme in recent field demonstration studies assayed and validated the dominance of prm
genes after biostimulation with propane40 and bioaugmentation of some propanotrophs47.
qPCR35 and targeted gene sequencing100 were used to monitor the dioxane degradation by
prm-harboring Mycobacterium spp. in non-contaminated garden soil enrichments. These
lines of evidence corroborate the prevalence of bacteria expressing PRM in engineered or
enriched environments with or without previous exposure of dioxane. However, the
contribution of naturally occurring bacteria expressing PRM to the overall dioxane
attenuation at impacted sites remained unknown.
To date, the lack of comparable PRM kenetic data as described in Section 1.4.1
limits our knowledge of it and its application.Therefore, we heterologously expressed PRM
and THM in competent cells Mycobacterium smegmatis mc2-155 and compared their
kinetic performance at the enzymatic level, which excludes other potentially interfering
biological factors (e.g., molecular transport, gene regulation, global stress response). We
further investigated the inhibitory effects of three chlorinated compounds (1,1-
dichloroethene [1,1-DCE], trichloroethene [TCE], and 1,1,1-trichloroethane [1,1,1-TCA])
given their high co-occurrence frequency with dioxane at impacted sites4, 7, 8. In this study,
substrate range of both dioxane degrading enzymes was surveyed to investigate their
catalytic versatility, particularly toward prevailing chlorinated and aromatic pollutants, as
well as short-chain alkane/alkene gases given their association with the success of
biostimulation. We hypothesize distinct performances between PRM and THM in regard
of dioxane degradation kinetics, susceptivity to environmental inhibitors, and catalytic

23
versatility given their sequence dissimilarity and evolutionary divergence. The expression
of both enzymes is unified in an identical heterologous system and monitored by RT-qPCR,
thus allowing kinetic parameters to be normalized based on the transcript copy numbers of
their encoding genes, providing useful quantitative data for field assessment. This research
is of critical value to advance our fundamental understanding of dioxane degrading
enzymes and enable the prediction of their environmental behaviors and contributions to
dioxane biotransformation naturally occurring in the field or stimulated with auxiliary
substrates.
2.2 Materials and Methods
2.2.1 Chemicals and Cultures
Propane, butane, isobutane, ethane, and ethene were purchased from Airgas (Radnor, PA)
with the purity of 99.5% or higher. Dioxane, THF, trichloroethene (TCE), 1,1-
dichloroethene (1,1-DCE), cis-1,2-dichloroethene (cDCE), trans-1,2-dichloroethene
(tDCE), vinyl chloride (VC), 1,2-dichloroethane (1,2-DCA), toluene, benzene, methyl tert-
butyl ether (MTBE), cyclohexane, chloramphenicol, and thiostrepton were purchased from
Sigma-Aldrich (St. Louis, MO). Neat 1,1,1-trichloroethane (1,1,1-TCA) was bought from
Ultra Scientific (North Kingstown, RI) and diluted with HPLC-grade (99.9%) methanol
(Sigma-Aldrich). Bacterial strains PH-06 and mc2-155 were originally obtained from Dr.
Yoon-Seok Chang (POSTECH, Pohang, South Korea) and Dr. Nicolas Coleman
(University of Sydney, Sydney, Australia); CB1190 was bought from DSMZ; E. coli DH5α
was purchased from Thermo (Carlsbad, CA), and the plasmid pTip-QC2 was acquired from
Dr. Tomohiro Tamura at AIST, Japan.

24
2.2.2 Heterologous Expression of PRM and THM
The 4.0 kb fragment of the prmABCD gene cluster in PH-06 was amplified with the forward
primer 5’-AAGGAGATATACATATGACTGCATCGGTCACCACAC-3’ and the
reverse primer 5’-GTATGCGGCCGCCATGAAGCTTCACGCGGATACCGGGG-3’,
containing NdeI and HindIII sites (underlined), respectively. In parallel, the 4.3 kb
fragment of the thmADBC gene cluster in CB1190 was amplified with the forward primer
5’-AAGGAGATATACATATGACTGCCCCACCGATGAA-3’ and reverse primer 5’-
GTATGCGGCCGCCATGGAATTCTACGACTCAGAGTTGATCAGCTCGAT-3’,
containing NdeI and EcoRI sites (underlined), respectively. Each 50 μL of PCR reaction
mixtures consisted of 1 × PCR buffer, 100 nM dNTPs, 250 nM each primer, 1 unit of Pfu
polymerase (Thermo, Carlsbad, CA), and 25 ng of the genomic DNA of PH-06 or CB1190
as the template. Thermocycling conditions were: 98 ºC for 5 min, then 30 cycles of 98 ºC
for 20 s and 72 ºC for 6 min, and 72 ºC for 10 min at the end. Amplicons with appropriate
size were gel-purified using the Zymoclean™ Gel DNA Recovery Kit (Zymo Research
Corp, Irvine, CA).
PCR amplicon and vector pTip-QC2 plasmid36, 57, 101 were both digested with the
designed enzyme (New England Biolabs, Ipswich, MA). After purification, the plasmid
and PCR insert were ligated at a 1:3 (plasmid:insert) ratio at 16 ºC overnight with T4 DNA
ligase (New England Biolabs, Ipswich, MA). The ligation mixture (1 μL) was then used
to transform electrocompetent E. coli DH5α cells. Colonies with ampicillin (50 μg/mL)
resistance were screened for appropriate recombinant constructs, which were designated
as pTip-prmABCD and pTip-thmADBC, respectively. After purification with the Zyppy™
Plasmid Miniprep Kit (Zymo Research Corp, Irvine, CA), 50 ng of plasmid pTip-

25
prmABCD, pTip-thmADBC, or empty vector pTip-QC2 was used to transform
electrocompetent mc2-155 cells using the method as described in Ly et al.102
Electroporation was conducted at 1.8 kV/cm for 4.5 ms by the MicroPulser™
Electroporator (Bio-Rad, Hercules, CA). Successful transformants were selected on LB
plates with ampicillin (50 μg/mL) after incubation at 30 ºC for 2 days.
2.2.3 Culturing and Induction of Transformants
Single colonies of mc2-155 containing the plasmid pTip-QC2 constructs with and without
the prmABCD or thmADBC insert, designated as mc2-155(pTip-QC2), mc2-155(pTip-
prmABCD) and mc2-155(pTip-QC2), respectively, were inoculated in 5 mL of LB broth
dosed with chloramphenicol (34 μg/mL) and grown at 30 ºC while being shaken at 150
rpm. After the initial growth for 48 h, cell culture (5 mL) was then inoculated to a 1-L flask
containing 0.2 L of LB broth with chloramphenicol. In addition, 0.1% (v/v) of Tween-80
were added to prevent the formation of cell aggregates during growth103. Cells were further
incubated at 30 ºC while being shaken at 175 rpm until an OD600 of 0.6 was reached.
Then, thiostrepton (EMD Millipore, Billerica, MA) in DMSO was added to a final
concentration of 1 μg/mL to induce the heterologous expression. Induced cultures were
incubated for a further 48 h. Cells were harvested and the pellets were washed twice with
40 mL of ice-cold phosphate buffered saline (PBS) (20 mM sodium phosphate, pH 7.0,
0.1% Tween-80) prior to the degradation assays.
2.2.4 SDS-PAGE Analysis
After induction by thiostrepton for 48 h, 1 mL of mc2-155(pTip-prmABCD), mc2-
155(pTip-thmADBC) and mc2-155(pTip-QC2) bacterial culture were adjusted to OD
around 6. Cells were then lysed by ultrasonication using the Sonic Dismembrator FB-120

26
(Fisher Scientific, Pittsburgh, PA) for 15 min with 5 s pulse and 5 s of interval. After
centrifugation at 15,000 × g for 30 min at 4 ºC, the supernatant consisting ~20 μg of the
total protein and SDIMOs fraction was mixed with the Pierce LaneTM Marker Reducing
Sample Buffer (Thermo, Waltham, MA) containing 5% of 2-mercaptoethanol (2-ME).
After boiling 10 min, 20 μL of the resulted mixture was loaded onto a 4-12% NuPAGETM
Bis-Tris polyacrylamide gel (Thermo, Waltham, MA) according to the method of
Laemmli104. Pierce™ Unstained Protein MW Marker (Thermo, Waltham, MA) were used
for protein size comparison.
2.2.5 Reverse Transcription Quantitative PCR (RT-qPCR) and Expression Level
Assay
After induction with thiostrepton, total RNA of mc2-155(pTip-prmABCD), mc2-155(pTip-
thmADBC), and mc2-155(pTip-QC2) transformants was extracted using PureLink™ RNA
Mini Kit coupled with PureLink™ DNase Set (Thermo, Carlsbad, CA) to eliminate DNA
contamination. The RNA extracts were converted to cDNA using the High-Capacity cDNA
Reverse Transcription Kit (Thermo, Foster City, CA). Concentrations of synthesized
cDNA were measured by SpectraMax Plus 384 Microplate Reader equipped with a
SpectraDrop Micro-Volume Microplate (Molecular Devices, Sunnyvale, CA) and
subsequently diluted to 5 ng/μL with nuclease-free water for further qPCR analysis. qPCR
reaction (20 μL) consisted of 2 μL diluted cDNA, 10 μL of 2× SYBR Green PCR master
mix (Thermo, Foster City, CA), 0.2 μM of each forward and reverse primer, and DNA-free
water to a total volume of 20 μL. The primers were designed by He et al.35 and Li et al.30
for prmA and thmA quantification. RT-qPCR was conducted using QuantStudio™ 3 Real-
Time System (Thermo, Carlsbad, CA) with the following temperature setup: 95 °C for 10

27
min and 40 cycles of 95 °C for 15 s and 60 °C for 1 min. The copy numbers of target genes
were quantified using standard curves prepared with serial dilution of genomic DNA of
CB1190 and PH-06. The expression levels of PRM and THM were defined as copy
numbers of expressed prmA or thmA over a unit milligram of protein extracted from the
induced transformants.
Comparable transcription levels (Figure 2.1) of inserted prm and thm gene clusters
in transformants were checked by reverse transcription quantitative PCR (RT-qPCR)
before processing enzyme comparison assays. The heterologous expression procedures
were designed and verified to ensure an identical transcription of both PRM and THM
expressed with active catalytic functions. First, the sequence accuracy was ensured since
high fidelity polymerase was used to amplify the complete prm and thm gene clusters from
the genomic DNA. This greatly reduced the chance of function discrepancies caused by
PCR-derived mutations. Second, transcription of the inserted genes was solely regulated
by thiostrepton to induce the promoter system embedded on pTip-QC2. Gene clusters were
inserted from their start codons (ATG) of prm or thm’s α-subunits without their original
promoters or regulators in wild-type strains PH-06 or CB1190. Third, complete prm and
thm gene clusters were cloned with the same initial restriction site, NdeI, at their 5’ ends
into the expression shutter vector, pTip-QC2. Thus, the start of the prm and thm transcripts
were identical, allowing the consensus of ribosome binding to initiate the translation. Last
but not the least, the gene expression shutter vector, pTip-QC2, plasmid proliferation host
(E. coli DH5α), and expression host (Mycobacterium smegmatis mc2-155), have all been
successfully employed to express THM, PRM, and other SDIMOs in our lab and others36,

28
57, 105-107. This set of expression system enabled effective production of SDIMOs with
catalytic functions comparable with wild-type strains.
Figure 2.1 RT-qPCR analysis revealed uniform expression in mc2-155(pTips-prmABCD)
and mc2-155(pTips-thmADBC) after induction.
2.2.6 Enzyme Kinetics Modeling
Dioxane degradation kinetics were well described by the Michaelis-Menten equation (1.1).
Parameters for chlorinated solvent inhibition were estimated using equations (1.2), (1.3),
and (1.4)65, respectively.
Michaelis-Menten equation: 𝑣0 =𝑉𝑚𝑎𝑥[𝑆]
𝐾𝑚+[𝑆] (1.1)
Competitive inhibition: 𝑣0 =𝑉𝑚𝑎𝑥
1+𝐾𝑚[𝑆]
(1+[𝐼]
𝐾𝐼𝐶) (1.2)
Uncompetitive inhibition: 𝑣0 =𝑉𝑚𝑎𝑥
1+[𝐼]
𝐾𝐼𝑈+𝐾𝑚[𝑆]
(1.3)

29
Noncompetitive inhibition:
𝑣0 =𝑉𝑚𝑎𝑥
(1+[𝐼]
𝐾𝐼𝑁)+(1+
𝐾𝑚[𝑆]
) (1.4)
As experiment had verified the trend of 𝐾𝑚𝑎𝑝𝑝
and 𝑉𝑚𝑎𝑥𝑎𝑝𝑝
, they can be transformed to
the following format accordingly (Equation 1.5-1.7):
Competitive inhibition: 𝐾𝑚𝑎𝑝𝑝 = 𝐾𝑚 (1 +
[𝐼]
𝐾𝐼𝐶) (1.5)
Uncompetitive inhibition: 𝐾𝑚𝑎𝑝𝑝 = 𝐾𝑚/(1 +
[𝐼]
𝐾𝐼𝑈) and 𝑉𝑚𝑎𝑥
𝑎𝑝𝑝 = 𝑉𝑚𝑎𝑥/(1 +[𝐼]
𝐾𝐼𝑈) (1.6)
Noncompetitive inhibition: 𝑉𝑚𝑎𝑥𝑎𝑝𝑝 = 𝑉𝑚𝑎𝑥/(1 +
[𝐼]
𝐾𝐼𝑁) (1.7)
Where Km is the half saturation coefficient; Vmax denotes the maximum degradation
rate; app means the apparent value based on our experiments; [S] and [I] represent the
concentrations of substrate and inhibitor; KIC, KIN, and KIU are competitive, uncompetitive,
and noncompetitive inhibition constants, respectively. To estimate the inhibition constant
KI of each model, equations (S5), (S6) and (S7) can be linearized as follows108, 109:
Competitive Inhibition: 𝐾𝑚𝑎𝑝𝑝
𝑉𝑚𝑎𝑥𝑎𝑝𝑝 =
𝐾𝑚
𝑉𝑚𝑎𝑥+
𝐾𝑚
𝑉𝑚𝑎𝑥𝐾𝐼𝐶[𝐼] (1.8)
Uncompetitive Inhibition: 1
𝑉𝑚𝑎𝑥𝑎𝑝𝑝 =
1
𝑉𝑚𝑎𝑥+
1
𝑉𝑚𝑎𝑥𝐾𝐼𝑈[𝐼] &
1
𝐾𝑚𝑎𝑝𝑝 =
1
𝐾𝑚+
1
𝐾𝑚𝐾𝐼𝑈[𝐼] (1.9)
Noncompetitive Inhibition: 1
𝑉𝑚𝑎𝑥𝑎𝑝𝑝 =
1
𝑉𝑚𝑎𝑥+
1
𝑉𝑚𝑎𝑥𝐾𝐼𝑁[𝐼] (1.10)

30
Therefore, KI can be computed by the intercept divided by the slope of the
regression line drawn by [I] against 𝐾𝑚𝑎𝑝𝑝/𝑉𝑚𝑎𝑥
𝑎𝑝𝑝, 1/𝑉𝑚𝑎𝑥
𝑎𝑝𝑝, or 1/𝐾𝑚
𝑎𝑝𝑝. The experimental
data with different concentrations of inhibitors and dioxane were fitted to three possible
inhibition models for KIC, KIN, and KIU estimation. The most appropriate model was
selected on the basis of the best fitness with the highest R2 (coefficient of determination).
2.2.7 Enzyme Kinetics and Inhibition Tests
After cultivation and induction as described above, transformant cells were washed twice
and re-suspended in phosphate-buffered saline (PBS) to achieve an optical density (OD) of
approximately 2.0 at 600 nm. Dioxane was then spiked to achieve the initial concentrations
of 10, 40, 80, 160, 320, and 640 mg/L to perform the kinetic assays. Such high initial
concentrations were used because PRM and THM both exhibited high Km and Vmax values,
which were in good agreement with previous studies35, 64, 67, 69 using wild-type strains
(Table 1.3). Two liquid samples (600 µL) were collected, including one at the beginning
and the other after 3 h of the enzymatic reaction in each batch test. Samples were then
filtered using 0.22 µm Nylon syringe filters and kept in glass vials at 4 °C prior to the gas
chromatograph (GC) analysis. Instant degradation rates were calculated by averaging
dioxane disappearance in triplicate within the first 3 h, which were further normalized by
the initial protein concentration65 measured by the Bradford Assay110. In addition, to
evaluate dioxane degradation kinetics under environment-relevant dioxane contaminations,
resting cells were exposed to 1.0 and 0.2 mg/L of dioxane, respectively. All treatments
were conducted in triplicate and negative controls were prepared with autoclaved biomass.

31
The significance level among different treatments was statistically determined using the
Student’s t-test.
To assess the inhibition effects from the presence of chlorinated solvent compounds
(i.e., 1,1-DCE, TCE, and 1,1,1-TCA), harvested transformant cells were first exposed to
the desired concentrations (0-8 mg/L in the aqueous phase) of inhibitors for 20 min,
allowing complete portioning of volatile inhibitors in the batch setup and sufficient contact
between enzymes and inhibitors. Based on our preliminary tests with varying pre-exposure
durations (data not shown), pre-exposure of 20 min is optimal to prevent rapid dioxane
degradation by inhibitor-free enzymes without significant impact to enzyme activities,
which could greatly affect the estimation of degradation rates. After the pre-exposure,
dioxane was spiked at varying initial concentrations and its disappearance was measured
at 3 h. Calculation of the concentrations of chlorinated solvents in aqueous phase were
based on the mass balance and Henry’s law equilibrium using the following equation.
𝑉𝑠𝑡𝑜𝑐𝑘 × 𝐶𝑠𝑡𝑜𝑐𝑘 = 𝑉𝑎𝑞 × 𝐶𝑎𝑞 + 𝑉𝑔𝑎𝑠 ×𝐶𝑎𝑞
𝐻𝑐 (1.8)
Where, Cstock and Caq are the concentrations of chlorinated compounds in stock
solution and aqueous phase; Vstock, Vaq, and Vgas are the volumes of stock solution, aqueous
phase, and headspace, respectively. Hc is the dimensionless Henry’s constant of a specific
chlorinated compound111. All dioxane degradation rates were first fitted to the non-linear
Michaelis-Menten model (Equation 1.1) to compute apparent kinetic values, which were
then fitted with three inhibition equations (Equations 1.1-1.7) (i.e., competitive,

32
noncompetitive, and uncompetitive) to estimate their inhibition factors and distinguish the
dominant inhibition mechanism.
2.2.8 Substrate Range Characterization
Three transformants, mc2-155(pTip-prmABCD), mc2-155(pTip-thmADBC), and mc2-
155(pTip-QC2), were harvested using the procedures as mentioned above. Five milliliters
of resuspended cells were transferred to 35-mL sealed serum bottles and then exposed to
19 selected compounds individually to assess if significant degradation occurs in
comparison with abiotic controls prepared with PBS with 0.1% Tween 80 as the medium.
These tested compounds are categorized into four groups, embracing (1) cyclic and
branched ethers (dioxane, THF, MTBE) and a structural analogue (cyclohexane), (2) short-
chain alkane/alkene gases (ethane, propane, butane, isobutane, and ethene), (3) aromatic
compounds (e.g., toluene, benzene), and (4) chlorinated aliphatic hydrocarbons (1,1-DCE,
tDCE, cDCE, 1,1-DCA, 1,2-DCA, VC, TCE, and 1,1,1-TCA). The exposure dosage of
each compound is listed in Table 2.1. MTBE, cyclohexane, alkanes, aromatic compounds,
and chlorinated solvents were detected in the headspace; dioxane and THF were measured
in the filtered aqueous solutions. Concentrations of these compounds were monitored by
GC coupled with a flame ionization detector (FID) detector or mass spectrometry (MS)
with key analytical details (e.g., retention time and target ions) indicated in Table 2.1. As
concentrated non-growing transformant cells were used in these assays, degradation rates
were estimated based on the disappearance of each tested compound with the first 4 h of
incubation. Samples were also collected at 24 h after the exposure, which were analyzed
to verify the occurrence and extent of degradation. All experiments were conducted in
triplicate to avoid discrepancy among individual tests and minimize system errors.
33
Significant degradation was only recognized by the Student’s t-test when the substrate
disappearance in clones expressing PRM or THM within first 4 h is statistically greater (p
< 0.05) than (1) the abiotic loss observed in negative controls and (2) the biotic loss in mc2-
155(pTip-QC2) transformant cells which contain the empty vector. The degradation ability
was verified based on the observation of (1) continuous substrate depletion at 24 h and (2)
degradation exhibited by the wild type strains, PH-06 and CB1190. PH-06 and CB1190,
which were grown with 50 mL of ammonium mineral salts (AMS) and 500 mg/L of
dioxane as a growing substrate in 160 mL serum bottles. Cells were harvested at their
exponential phase and diluted to OD600 around 1.0 by PBS with 0.1% Tween-80.
Table 2.1 GC-FID or GC-MS Analysis of Tested Substrates
Substrate Molecular weight
(g/mol)
Total molar
(μmol)
Retention
time (min)
Selected
ion (m/z)
Ethers/Analogs
Dioxane 88.11 5 7.9
GC/FID Tetrahydrofuran 72.11 5 5.7
MTBE 88.15 5 11.1
Cyclohexane 84.16 5 2.7 84
Short-chain Alkanes/Alkene
Ethene 28.05 5 1.7
GC/FID
Ethane 30.07 5 1.8
Propane 44.1 5 2.1
Butane 58.12 5 3
Isobutane 58.12 5 2.8
Aromatics
Benzene 78.11 5 2.7 78
Toluene 92.14 5 5.2 92
Chlorinated Aliphatic Hydrocarbons
VC 62.5 0.2 1.3 62
1,1-DCE 96.94 0.2 1.6 96, 61
cDCE 96.95 0.2 2.1 96, 61
tDCE 96.95 0.2 1.8 96, 61
1,2-DCA 98.96 0.2 2.5 Full scan
TCE 131.4 0.2 3.3 130, 95
1,1,1-TCA 133.4 0.2 2.5 96,61

34
2.2.9 Genomic Comparison
Genomes of 10 Actinomycetes in the genera of Mycobacterium, Pseudonocardia, and
Rhodococcus that carry complete genes clusters of prmABCD or thmADBC were retrieved
from National Center for Biotechnology Information (NCBI). The sequence alignment was
conducted using Mauve 2.4.0112 with the default parameters.
2.2.10 Analytical Approaches
The total protein content of cells was used to quantify the bacterial biomass by Bradford
Assay36, 64. Serial dilution of bovine serum albumin (BSA) (Thermo Scientific, Rockford,
IL) was made to prepare a linear standard curve for the total protein measurement. The
spectral absorbance at 660 nm was measured using the SpectraMax Plus 384 Microplate
Reader (Molecular Devices, Sunnyvale, CA).
Dioxane concentration (> 1.0 mg/L) was detected by GC-FID (Trace 1300, Thermo,
Waltham, MA) coupled with a TG-BOND Q capillary column (30 m length × 0.32 mm ID
× 10 μm film). Direct injection volume of filtered aqueous sample was 1 µL. Helium was
used as the carrier gas with a constant flow rate of 6.0 mL/min. The inlet temperature was
set as 200 °C, and samples were split at the ratio of 2:1 by the split flow of 12 mL/min. The
oven temperature started from 110 °C for 1 min, then ramped to 180 °C at the rate of
15 °C/min, and held for 4 min. The detector temperature was maintained at 250 °C.
For samples with relatively low dioxane concentration (< 1.0 mg/L), dioxane in the
aqueous phase was extracted by the frozen micro-extraction (FME) method113, with
dioxane-d8 and THF-d8 used as the surrogate and internal standard, respectively. Chemical
separation was achieved by a TG-5MS column (30 m × 0.25 mm × 0.25 μm) with a constant
helium flow at 1.5 mL/min. The inlet temperature of GC was set at 250 °C. The oven

35
temperature program was set initially at 40 °C for 2 min, increased to 150 °C at 10 °C/min.
Select ion monitoring (SIM) mode was employed to obtain the fingerprint ions of m/z 58,
96 and 80, which were used to represent the ion abundance of dioxane, dioxane-d8 and
THF-d8, respectively. The retention time of dioxane, dioxane-d8, and THF-d8 were 3.66,
3.74, and 2.45 min, respectively.
2.3 Results and Discussion
2.3.1 PRM Exhibits Higher Affinity to Dioxane than THM
In comparision with THM, PRM exhibited a higher affinity to dioxane since the Km of
PRM (53.0 ± 13.1 mg/L) was significantly lower (p < 0.05) than that of THM (235.8 ±
61.6 mg/L) (Figure 2.2, Table 1.3). The Vmax values for PRM and THM were estimated as
0.040 ± 0.003 and 0.055 ± 0.007 mg-dioxane/h/mg-protein, respectively. On the basis of
our RT-qPCR analysis (Figure 2.1), Vmax of PRM and THM can be converted to (9.52 ±
0.71) × 10-12 and (1.13 ± 0.14) × 10-11 mg dioxane/h/transcript copy, respectively. These
values may be of significant value to evaluate real-time dioxane degradation activities in
the field when total RNA is recovered from environmental samples. Vmax of PRM is
significantly smaller than THM (p < 0.05), indicating PRM has a relatively lower
maximum catalytic capacity for dioxane transformation. However, when dioxane
concentration is lower than 430 mg/L, PRM surpasses THM in dioxane degradation rate,
primarily due to its greater affinity to dioxane. This was evident by the faster dioxane
biotransformation observed under two environment-relevant dioxane concentrations
commonly found in the field (Figure 2.2B). When the transformant cells exposed to an
initial dioxane concentration of 1082.5 ± 29.3 µg/L, the dioxane biotransformation rate by
PRM was 0.42 ± 0.01 µg dioxane/h/mg protein, equivalent to (1.00 ± 0.02) × 10-13 mg

36
dioxane/h/transcript copy. This was two times as high as that of THM (0.20 ± 0.01 µg
dioxane/h/mg protein, equivalent to (4.12 ± 0.21) × 10-14 mg dioxane/h/transcript copy).
When we lowered the initial dioxane concentration to around 250 µg/L, PRM (0.11 ± 0.01
µg dioxane/h/mg protein, equivalent to (2.62 ± 0.23) × 10-14 mg dioxane/h/transcript copy)
retained higher efficiency in dioxane degradation than THM (0.04 ± 0.01 µg dioxane/h/mg
protein, equivalent to (0.82 ± 0.21) × 10-14 mg dioxane/h/transcript copy). Since dioxane
concentration is generally lower than 1 mg/L in groundwater8 and rarely exceeds 100 mg/L
at impacted sites, it can be speculated that bacteria that express PRM are more
advantageous compared to those with THM given their higher efficiency in exploiting low
or trace levels of dioxane for metabolism (Figure 2.2).
Figure 2.2 (A) Michaelis-Menten curves exhibiting dioxane degradation kinetics by
transformant cells expressing PRM (blue square) and THM (orange triangle). Dioxane
degradation at environment-relevant concentrations were shown in the inserted figure (B).

37
Our enzymatic kinetic results are in good agreement with some previous dioxane
degradation kinetic studies using wild type model dioxane degraders that actively express
these two enzymes essential for dioxane metabolism (Table 1.3). For instance, He et al.35
observed a stronger affinity for dioxane in PH-06 that expresses PRM than CB1190 that
expresses THM. Relatively high Km and Vmax values were also reported in an early study
that characterize dioxane degradation kinetics in CB119064. However, results from some
other investigations65, 67, 69 in CB1190 dioxane degradation kinetics were at variance (Table
1.3). The variation in kinetic coefficients among studies is attributed, at least in part, to the
differences in (1) culturing conditions and (2) dioxane exposure duration in the degradation
tests69, 114. Different culturing media, temperatures, and initial biomass concentrations may
affect overall microbial activities and induction of the specific degradation enzyme(s).
Dioxane exposure duration is also a critical parameter for the estimation of the kinetic
coefficients. These reported studies exposed cells to dioxane for a period ranging from 0.5
to 8 h. Short exposure time may result in an underestimation of degradation rates as cells
may take time to acclimate to a new environment. However, long exposure time may cause
unwanted biomass growth, as CB1190 cells can grow with dioxane, particularly in the high
concentrations dosed in the testing system. In this case, dioxane degradation rates could be
overestimated, introducing the extrapolation inaccuracy of Vmax and Km using the
Michaelis-Menten model that assumes non-growth condition. In our study, we employed
expressing cells that do not grow with dioxane and a median exposure duration of 3 h to
improve the measurement consistency for dioxane degradation rates.

38
2.3.2 1,1-DCE is the Most Potent Inhibitor to Both PRM and THM
For both PRM and THM, the inhibitory effects of three tested chlorinated compounds were
ranked as: 1,1-DCE > TCE > 1,1,1-TCA (Figure 2.3). The dioxane removal efficiency of
PRM dropped from 85.3 ± 12.9% in inhibitor-free PBS solution to 45.8 ± 15.4% with the
presence of 2 mg/L of 1,1-DCE. TCE also significantly reduced the dioxane removal
efficiency to 52.0 ± 4.1% (p < 0.05). However, the influence of 1,1,1-TCA to PRM-
catalyzed dioxane degradation was negligible when dosed with the same concentration (i.e.,
2 mg/L). A similar inhibitory order of these three chlorinated compounds was also
observed in transformant cells expressing THM (Figure 2.3). In PBS solution without any
chlorinated inhibitors, cells expressing THM can eliminate 81.2 ± 6.0% of the initial
dioxane after 3 h. The addition of 2 mg/L of 1,1-DCE, TCE, and 1,1,1-TCA greatly
inhibited the dioxane degradation by THM and reduced the removal efficiencies to 20.0 ±
9.7, 24.0 ± 2.8, and 49.5 ± 8.2%, respectively. This inhibitory order is in concert with
previous inhibition tests using growing cells of CB1190 by Zhang et al.67. The consensus
between our enzyme study and their pure culture assay suggest the observed inhibition of
chlorinated compounds to dioxane degradation is dominantly governed by the direct
interaction between inhibitory molecules and catalytic enzymes, though these inhibitors
may also negatively affect the degrading bacteria by inducing universal stress, repressing
gene expression, impeding substrate transport, and/or interrupting membrane integrity67.
1,1-DCE has been well recognized as a potent inhibitor to SDIMOs, such as group-
3 methane monooxygenase115, 116, group-3 butane monooxygenase117, and group-2 toluene-
4-monooxygenase65, as well as many other bacterial catabolic enzymes (e.g., ammonium
monooxygenase118). 1,1-DCE can incur an irreversible loss of butane monooxygenase

39
activity in alkane degrading Pseudomonas butanovora117. Our study using heterologous
expression cells provides the first evidence unequivocally revealing the inhibition of 1,1-
DCE to group-6 and group-5 SDIMOs that are responsible for dioxane metabolism. The
inhibition of 1,1-DCE may be attributed to its steric and chemical properties (e.g. polarity
and degree of unsaturation and chlorination). The double bond in 1,1-DCE confers to a
greater reactivity compared to 1,1,1-TCA. Furthermore, 1,1-DCE has a carbon with two
chlorine atoms paired with a carbon with no chlorine. In contrast, TCE has a carbon with
two chlorine atoms paired with a carbon with one chlorine atom. Such asymmetry of the
double bound in 1,1-DCE may result in a higher reactivity than TCE67.
Figure 2.3. Inhibition of dioxane biodegradation by three chlorinated solvents in
transformant cells expressing PRM and THM. Cells were pre-exposed to 2 mg/L of each
chlorinated solvent and then assessed their dioxane removal efficiencies in the contact time
of 3 h with an initial dioxane concentration of 10.0 mg/L. Error bars represent the standard
deviation of triplicates. Asterisk marks represent significant (p < 0.05) dioxane removal
differences between PRM and THM.

40
2.3.3 PRM is Less Susceptible to Chlorinated Solvent Inhibition than THM
Based on the best fitness (i.e., highest coefficient of determination [R2]) with the nonlinear
Michaelis-Menten model and its derived equations, negative effects of 1,1-DCE and 1,1,1-
TCA on dioxane degradation by PRM and THM might be dominated by noncompetitive
inhibition (Table 2.2 and Figure 2.4). Previous investigation by Mahendra65 also revealed
noncompetitive inhibition for 1,1-DCE and 1,1,1-TCA on dioxane degradation kinetics
using live cells of CB1190 (Table 2.3). Thus, 1,1-DCE and 1,1,1-TCA may bind to an
allosteric site (non-active site) on PRM and THM and trigger desensitization of the active
site, conducive to the decrease in overall catalytic performance119. Unlike 1,1-DCE and
1,1,1-TCA, TCE was inclined to inhibit both enzymes via competitive inhibition (Table
2.2 and Figure 2.4). The presence of TCE may compete with dioxane for the active sites
on PRM and THM, resulting in a decreased affinity. Such inhibition may be alleviated
when dioxane concentrations are sufficiently high to outcompete TCE. Over the course of
dioxane kinetic assays, no significant change was observed in concentrations of three
chlorinated compounds (data not shown), precluding negative effects caused by toxic
products derived from intracellular reactions of these chlorinated compounds.
It is noted that the R2 values representing the fitness of empirical data to varying
inhibition models were close for some cases in this study and in many previous studies65,
67, 120-123. This insufficient resolution inherently presented in kinetic studies may result from
the mixed inhibitory mechanisms, systematic errors, and unweighted regression
approaches. Our experiments were carried out with whole cells that actively express
enzymes of interest, rather than purified enzymes considering the technical challenges in
in vitro purification. Substrate transport to enzymes and other cellular dynamic processes

41
may thus influence our inhibition observations108. On the other hand, nonlinear regression
with the classic Michaelis-Menten model is quite robust in estimating apparent Km and
Vmax values and can work fairly well even when the errors are not Gaussian-distributed124.
Comprehensively weighing the shifting of these kinetic parameters in response to a series
of inhibitor concentrations, the fitness with different inhibition models is the most
frequently used and well-received approach to interpret enzyme-substrate inhibition
mechanisms and estimate inhibition constants providing implications for scaling the
inhibition potencies.
Figure 2.4 Enzyme inhibition kinetics by the Michaelis-Menten model for PRM (A, B, C)
and THM (D, E, F) with the presence of 1,1-DCE (A, D), TCE (B, E), and 1,1,1-TCA (C,
F). Degradation rates were estimated as the average of the dioxane disappearance among
triplicates within the contact duration of 3 h and normalized towards the initial protein
concentrations. No significant change in three inhibitor concentrations was observed
during these assays.

42
Figure 2.5. Regression between the apparent Vmax and Km values versus the concentrations
of inhibitors fitted by the linearized inhibition model with the highest R2 value.
Table 2.2 Inhibition Kinetic Parameters for Dioxane Degradation by PRM and THM
Expressing Transformants with the Presence of Three Chlorinated Compounds
Chlorinated
Solvent Enzyme
Competitive Noncompetitive Uncompetitive
KIC
(mg/L) R2
KIN
(mg/L) R2
KIU
(mg/L) R2
1,1-DCE PRM 5.27 0.745 6.22 0.937 -19.20 0.216
THM 1.41 0.901 2.14 0.987 -10.00 0.172
TCE PRM 5.23 0.919 18.43 0.857 -13.00 0.800
THM 1.13 0.921 -22.48 0.053 -3.06 0.599
1,1,1-TCA PRM 5.17 0.888 20.66 0.940 -15.15 0.747
THM 2.06 0.951 1.72 0.957 44.00 0.054
The inhibition model exhibiting the highest R2 value was selected and bolded.

43
Table 2.3 Inhibition Constants of Chlorinated Solvents to THM Expressing Transformants
in Comparison with CB1190
Inhibitor Inhibition model KI (mg/L) R2 Reference
1,1-DCE
Noncompetitive 2.14 0.987 this study
Noncompetitive 3.3 ± 2.9 0.95 Mahendra et al.65
Uncompetitive 1.51 ± 0.26 0.978 Zhang et al.67
TCE Competitive 1.13 0.921 this study
Uncompetitive 8.60 ± 1.74 0.974 Zhang et al.67
1,1,1-TCA Noncompetitive 1.72 0.957 this study
Noncompetitive 1.2 ± 1.0 0.93 Mahendra et al.65
Remarkably, PRM is less susceptible than THM to the inhibition of all three
chlorinated solvents tested in this study. As depicted in Figure 2.3, under a same
concentration of any chlorinated solvent (i.e., 2 mg/L), the initial 10 mg/L of dioxane was
removed in a significantly greater extent in transformant cells expressing PRM than those
that express THM. This was also echoed by the computed inhibition constants KI based on
our experimental results (Table 2.2). For each chlorinated solvent, the best described
inhibition mechanism was identical for PRM and THM (Table 2.3); further, KI values were
always greater for cells expressing PRM. These results suggested that PRM is more
resistant to the inhibition of chlorinated solvents than THM. Considering that chlorinated
solvents are common co-contaminants of dioxane8, 12, microorganisms expressing PRM
may be catalytically more active and enduring in the proximity of the source zone where
dioxane and chlorinated solvents co-occur.
2.3.4 PRM has a Broader Substrate Range than THM
As expected, PRM and THM are both efficient in transforming cyclic ethers, including
dioxane (0.287 ± 0.010 and 0.171 ± 0.042 μmol/h/mg, respectively) and THF (0.368 ±
0.055 and 0.497 ± 0.036 μmol/h/mg) (Table 2.4). Additionally, both PRM and THM can

44
degrade cyclohexane, a structural analog of dioxane. This is the first report that aligns PRM
and THM with cyclohexane degradation, which was previously observed in wild type
dioxane degrader PH-0658. However, degradation of this 6-membered carbocyclic alkane
was much slower (0.098 ± 0.001 and 0.066 ± 0.011 μmol/h/mg for PRM and THM,
respectively) in comparison to the 6-membered heterocyclic dioxane. It is also interesting
to notice that PRM exhibited significantly higher degradation rates (p < 0.05) for six-
membered ring compounds (dioxane and cyclohexane) than THM. Reversibly, THM is
faster in degrading the five-membered ring THF. The varied degradation efficiencies on
different substrates could partially result from the fitness of substrate molecules with the
active site or the transport channel of the catalytic enzyme. MTBE is a highly branched
ether pollutant of emerging water concern, since it has been widely used as oxygenate for
gasoline125. However, neither PRM nor THM can degrade MTBE.

45
Table 2.4 Substrate Range of PRM and THM and Accordant Degradation Rates
Substrate Degradation Rate (μmol/h/mg protein)
PRM THM
Ethers/Analogs
Dioxane 0.287 ± 0.010 0.171 ± 0.042
THF 0.368 ± 0.055 0.497 ± 0.036
Cyclohexanea 0.098 ± 0.001 0.066 ± 0.011
MtBE - -
Short-chain Alkanes/Alkene
Ethene 0.487 ± 0.047 -
Ethane 0.127 ± 0.053 -
Propane 0.307 ± 0.045 -
Butane 0.246 ± 0.050 -
Isobutane 0.208 ± 0.084 -
Aromatics
Benzene 0.106 ± 0.011 -
Toluene 0.345 ± 0.039 -
Chlorinated Aliphatic Hydrocarbons
VC 0.060 ± 0.007 -
1,2-DCA 0.038 ± 0.005 -
1,1-DCE - -
cDCE - -
tDCE - -
TCE - -
1,1,1-TCA - -
Green cells represent significant degradation (p<0.05) exhibited by the transformant cells expressing PRM
or THM in comparison with both (1) the abiotic control and (2) biotic control with transformant cells carrying
the empty vector.
Red cells represent substrate depletion was not observed or not significantly different from either abiotic or
biotic control treatment. a Degradation rates for cyclohexane were calculated based on the concentration difference between 4 and 24
h due to a prolonged equilibrium of this chemical in the sealed bottles.
Short-chain (C1-C4) alkanes and alkenes are primary substrates of many subgroups
of SDIMOs126. They also play an important role in the regulation of SDIMO expression in
bacteria. In our transformation surveys (Table 2.4), PRM exhibited exceptional ability to
degrade all alkanes (C2-C4) and the C2 alkene (i.e., ethene) tested in this study. Ethene
showed the highest degradation rate (0.487 ± 0.047 μmol/h/mg), followed by propane
(0.307 ± 0.045 μmol/h/mg), butane (0.246 ± 0.050 μmol/h/mg), isobutane (0.208 ± 0.084

46
μmol/h/mg), and ethane (0.127 ± 0.053 μmol/h/mg). Homologues to the PH-06 group-6
PRM have been previously identified in dioxane co-metabolizers that grow on propane or
isobutane, such as Mycobacterium sp. ENV421127 and Rhodococcus rhodochrous 2119839,
45 (Table 2.5). Further, the presence of propane can also upregulate the polycistronic
transcription of the prmABCD clusters in PH-0636 and ENV42172, 73, which subsequently
promoted the activity of dioxane biotransformation. Our study revealed this single PRM
enzyme can degrade both dioxane and gaseous alkanes. This novel finding unveiled the
plausible linkage between propane/isobutane assimilation and dioxane degradation as
evident in the mentioned wild-type strains.

Table 2.5 Bacteria Harboring the Complete Gene Clusters of prmABCD and thmADBC
Strain Name Dioxane
Degradation
Other Inducible
Substrate
Gene
Localization
Geographic
Location
Gene
Cluster
Identity
(%)
Reference
prm Harboring Bacteria
Mycobacterium
dioxanotrophicus PH-06 m propane plasmid
Pohang, South
Korea 100 58
Mycobacterium sp. ENV421 ca propane ic New Jersey, US 88.84 47, 72, 127
Rhodococcus rhodochrous
strain 21198 ca propane/isobutane ic Japan 86.24 39, 45, 128
Rhodococcus aetherovorans
BCP1 u C2-C7 alkanes plasmid Bologna, Italy 86.24 129, 130
Mycobacterium chubuense
NBB4 u ethene/C2-C4 alkanes plasmid
New South Wales,
Australia 86.51 63, 126
thm Harboring Bacteria
Pseudonocardia
dioxanivorans CB1190 m THF plasmid South Carolina, US 100 92, 131
Pseudonocardia sp. N23 m THF ic Japan 97.1 132
Pseudonocardia sp. K1 ct THF ic Göttingen,
Germany 94.86 133, 134
Pseudonocardia sp. ENV478 ct THF ic New Jersey, US 96.84 60, 135
Rhodococcus ruber YYL u THF plasmid Zhejiang, China 99.74 136
m = metabolism
ca = co-metabolism with alkane gases
ct = co-metabolism with THF
u = unknown
ic = incomplete genome with major gaps (precluding the determination of localization of prm or thm genes
47
48
Besides propane and isobutane, PRM can oxidize a greater range of short-chain
alkanes and alkenes, including ethene, ethane, and butane. This is in concert with the
previous observations that some prmABCD-harboring microorganisms can grow on a wide
variety of alkane/alkene gases though their ability to degrade dioxane has yet been
characterized (Table 2.5). For instance, Rhodococcus sp. BCP1129 can grow on all C2-C7
linear alkanes, which also induced the expression of its group-6 SDIMO. Similarly,
Mycobacterium chubuense NBB4 can grow on C2-C4 alkanes and ethene126. It is noted
that these Actinomycetes express a diversity of SDIMOs and other enzymes (e.g.
cytochrome P450 and dehydrogenase) that may also contribute to the observed alkane and
alkene oxidation126, 137. However, this is the first study to ascertain the ability of group-6
SDIMO for the oxidation of C2-C4 alkanes (linear or branched) and ethene.
Chlorinated solvents and aromatic compounds represent two groups of
groundwater pollutants commonly found in contaminated aquifers8, 138, 139. We assessed the
capability of PRM and THM of degrading these common co-contaminants. Notably, PRM
degrades both VC and 1,2-DCA, though the degradation rates were relatively low (0.060
± 0.007 and 0.038 ± 0.005 μmol/h/mg for VC and 1,2-DCA, respectively) (Table 2.4). This
suggests the active site of PRM can weakly react with VC and 1,2-DCA, despite of low
affinity. Particularly, VC is a carcinogenic pollutant commonly accumulated as an
undesirable metabolite via anaerobic dehalogenation in TCE-contaminated aquifers140, 141.
Thus, presence of bacteria expressing PRM can in addition synchronize the removal of
dioxane and VC co-occurring at the chlorinated solvent sites. PRM can also degrade
benzene and toluene at the degradation rates of 0.106 ± 0.011 μmol/h/mg and 0.345 ± 0.039
μmol/h/mg, respectively. Ability to degrade these two aromatic compounds was validated

49
using PH-06 cells actively expressing PRM as they were grown with propane. As major
gasoline constituents, benzene and toluene are contaminants prevalently detected in
groundwater. Compared with toluene, benzene is more toxic and recalcitrant with strict
regulation by EPA142. To break the aromatic ring, dihydroxylation is imperative to insert
two hydroxyl groups at adjacent aromatic carbon positions. This can be achieved by two
sequential oxidations catalyzed by monooxygenases or a simultaneous oxidation by
dioxygenases143. This is the first study report that PRM has the capability of degrading
aromatic compounds, such as benzene and toluene. Overall, PRM’s versatile degradation
capability of degrading a broad spectrum of common groundwater pollutants (e.g., benzene,
toluene, VC, and 1,2-DCA) underscores its value for environmental remediation.
Transformant cells expressing THM did not show degradation capability toward
any of the alkanes, alkenes, chlorinated and aromatic compounds in our tests (Table 2.4).
This demonstrates that THM is highly specific to cyclic compounds. In contrast, PRM has
a much broader substrate range, unveiling greater potential for in situ and ex situ treatments
of commingled contaminations. Even better, expression of PRM may also enable
microorganisms to assimilate other carbon sources, such as propane and isobutane, for cell
growth, and support decomposition of a variety of pollutants. Collectively, this group-6
PRM displays unparalleled catalytic versatility towards various types of small molecules
including alkane, alkene, cyclic, chlorinated, or aromatic144. In our previous paper36, we
named this type of group-6 SDIMOs as PRM after its first discovery in the propanotroph,
Mycobacterium sp. TY-670. They were also designated as “short chain alkane-oxidizing
monooxygenase (SCAM)” in other reports39. We propose the nomenclature of this group-
6 SDIMOs can be unified in the future.

50
2.4 Implications
2.4.1 Environmental Implications for Monitored Natural Attenuation of Dioxane
Besides PH-06 and CB1190, many other Actinomycetes also harbor prm and thm genes
(Table 2.5). Though not all were verified at the molecular level, it is prudent to assume that
these strains can utilize PRM or THM for the initial breakdown of dioxane. It is interesting
to note that these prm and thm harboring bacteria were isolated from geographically
disparate locations (e.g., Asian, Europe, and America). However, sequences of their
multicomponent gene clusters prmABCD and thmADBC are highly conservative with
minimum identities of 86% and 94%, respectively, even with the consideration of the
spacers and overlaps between gene components. It is also notable that most of these gene
clusters are localized on plasmids (Table 2.5) and/or adjacent to mobile elements. For
instance, the prmABCD gene cluster in PH-06 is carried by a transposon cassette flanked
by insertion sequences36. The meticulous examination (Figure 2.6) revealed all gene
clusters are intact without noticeable internal rearrangements. In addition, upstream and
downstream sequences (the colored blocks shown in Figure 2.6) of the prm or thm gene
cluster also demonstrated high homology suggesting a consensus origin. These converging
lines of evidence corroborate that dioxane degradation genes prm and thm are disseminated
via horizontal gene transfer (HGT), enabling the intercellular spreading of dioxane
catabolism across species.
In contaminated aquifers, HGT of prm and thm may occur among indigenous
microorganisms at varying frequencies in response to the concentration of dioxane as the
selective pressure99, 145, 146. Our enzymatic study suggests that transfer of prm may be both
physiologically and ecologically more profitable than thm. This is because (1) PRM
displays a faster dioxane catabolism at field-relevant dioxane concentrations (e.g., < 1
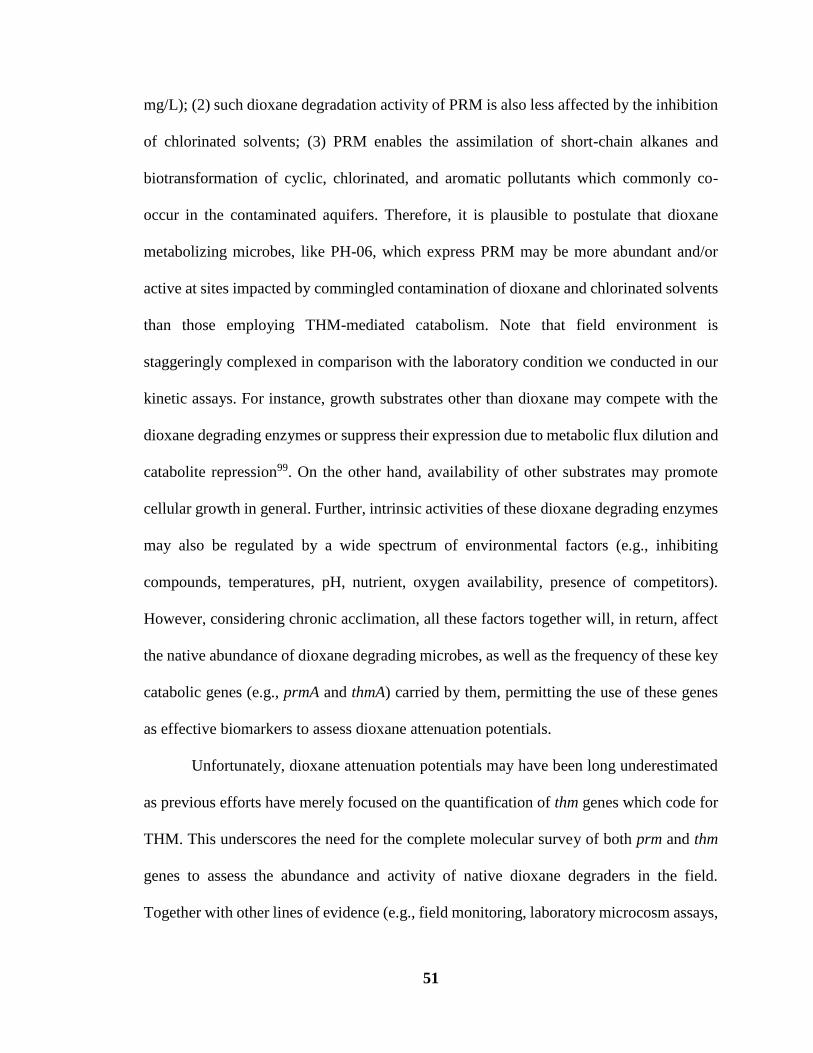
51
mg/L); (2) such dioxane degradation activity of PRM is also less affected by the inhibition
of chlorinated solvents; (3) PRM enables the assimilation of short-chain alkanes and
biotransformation of cyclic, chlorinated, and aromatic pollutants which commonly co-
occur in the contaminated aquifers. Therefore, it is plausible to postulate that dioxane
metabolizing microbes, like PH-06, which express PRM may be more abundant and/or
active at sites impacted by commingled contamination of dioxane and chlorinated solvents
than those employing THM-mediated catabolism. Note that field environment is
staggeringly complexed in comparison with the laboratory condition we conducted in our
kinetic assays. For instance, growth substrates other than dioxane may compete with the
dioxane degrading enzymes or suppress their expression due to metabolic flux dilution and
catabolite repression99. On the other hand, availability of other substrates may promote
cellular growth in general. Further, intrinsic activities of these dioxane degrading enzymes
may also be regulated by a wide spectrum of environmental factors (e.g., inhibiting
compounds, temperatures, pH, nutrient, oxygen availability, presence of competitors).
However, considering chronic acclimation, all these factors together will, in return, affect
the native abundance of dioxane degrading microbes, as well as the frequency of these key
catabolic genes (e.g., prmA and thmA) carried by them, permitting the use of these genes
as effective biomarkers to assess dioxane attenuation potentials.
Unfortunately, dioxane attenuation potentials may have been long underestimated
as previous efforts have merely focused on the quantification of thm genes which code for
THM. This underscores the need for the complete molecular survey of both prm and thm
genes to assess the abundance and activity of native dioxane degraders in the field.
Together with other lines of evidence (e.g., field monitoring, laboratory microcosm assays,

52
isotopic fractionation, and geochemical indication), comprehensive biomarker analysis
will facilitate the justification to select or reject MNA for the mitigation of dioxane. This
may elicit significant reduction of field remediation efforts and associated costs at sites
where pump-and-treat is actively employed.
Figure 2.6. Alignment of the nucleotide sequences of (A) five prmABCD gene clusters
and (B) five thmADBC gene clusters from different Actinomycetes generated by Mauve
2.4.0. The prmABCD or thmADBC gene clusters are indicated by the black bars. The
Locally Collinear Blocks (LCB) indicate regions of homology among all five strains; the
similarity profiles of the genome sequences are denoted by colored line inside blocks. The
blocks depicted above or below the centre line indicate the location of the transcription
strand in the forward or inverse orientation.

53
2.4.2 Environmental Implications for Biostimulation with Short-Chain Alkane/
Alkene Gases
In addition to MNA, biostimulation is an alternative that can effectively accelerate the
cleanup of dioxane in the field. A pilot trial lasting over 9 months demonstrated amendment
of propane and oxygen into recirculating groundwater sustained an effective removal of
dioxane, 1,2-DCA, and other chlorinated compounds at the former air force base site40.
Ethane and isobutane were also reported for spurring monooxygenase-driven co-
metabolism of dioxane in aquifers45, 147. In this study, we unequivocally proved that PRM
can degrade both dioxane and short-chain alkane/alkene gases, explaining that PRM may
contribute to the dioxane co-metabolism observed in previous field and microcosm tests
for alkane biostimulation45, 47, 147. However, the presence of prm genes does not guarantee
their ability to carry out catabolic dioxane degradation. Dioxane co-metabolism can be
hindered by field factors, such as the lack of inorganic nutrients or inhibition of the
auxiliary substrate45. Thus, further investigation regarding the PRM-associated dioxane
metabolism or co-metabolism are needed to guide for field applications.
We also note that, contribution of bacteria expressing THF to short-chain alkane
biostimulation should not be precluded. Though THM is highly specific to heterocyclic
ethers, many of thm harboring bacteria also carry other SDIMOs genes enabling the
assimilation of short-chain alkanes/alkenes. Taking the archetypic THM-mediated dioxane
degrader CB1190 as an example, it also carries a group-5 propane monooxygenase gene
cluster in the chromosome131 and its propane degradation capacity was verified in our lab
(data not shown). Further investigation is needed to assess the effectiveness of propane and
other short-chain alkanes or alkenes for bacteria that carry both thm and some other
SDIMO genes. However, curing of thm carrying plasmids may be of concern. In our
54
previous study, CB1190 tends to lose redundant plasmids (e.g., the plasmid that carries
thm) when it is fed with substrates that are readily biodegradable (e.g., 1-butanol and
acetate)99. Further, in aquifers, the case becomes more intricate, particularly when prm
harboring bacteria co-exist. Again, this calls for a comprehensive survey of PRM, THM,
and other SDIMO genes that are associated with dioxane co-metabolism and the
assimilation of the selected auxiliary substrate, which facilitate the design and monitoring
of the intrinsic biostimulation. Nonetheless, primary attention is recommended to be made
to PRM given their unique and synchronic ability of transforming dioxane and other
pollutants and assimilating gaseous alkane/alkene substrates.

55
CHAPTER 3
CHARACTERIZING THE SOLUBLE DI-IRON MONOOXYGENASE FAMILY:
PHYLOGENY, EVOLUTION, SUBSTRATE RANGE
3.1 Introduction
Soluble di-iron monooxygenases (SDIMOs) can catalyze the addition of an oxygen atom
to the C-H bond in organic hydrocarbons including aromatics, alkanes, alkenes, chlorinated
ethenes/ethanes, and heterocyclic ethers. Given the importance of SDIMOs in the
assimilation of various substrates and degradation of different contaminants, catabolic
functions of SDIMO are of great interest. Although SDIMOs are found in diverse bacterial
strains, their physiological function in each subdivision menifests a remarkable level of
specificity according to previous research96, 97, 148, 149. For instance, enzymes in group 1 and
2 predominantly function as aromatic monooxygenases and group 3-6 serve as aliphatic
monooxygenases. Therefore, the analysis of SDIMOs would provide insights into their
evolution and ecology. Bioprospecting of uncharacterized and novel monooxygenases
benefits from understanding the principles of SDIMO catalysis on the basis of prior
research.
With the advancement of modern molecular techniques, such as metagenomics and
biomarker profiling, it is viable to screen the SDIMOs in environmental samples.
Alignment of these SDIMOs with characterized enzymes could exploit their potential
physiological functions. Metagenomics approaches are state-of-the-art sequencing tools
for bioprospecting of pivotal enzymes from diverse environmental samples150.
Metagenomics also facilitate the idenfication of putative genes encoding SDIMOs from
microbial populations, particularly those have relatively low abundances or are

56
uncultivable but critical in communities. Holmes et al.97 revealed the unprecedented
diversity of SDIMOs using nest-PCR with degenerate primers.
This research reviews the existing research about SDIMOs in terms of their
phylogeny, evolution, regulation mechanisms. With the inclusion of most-recently
discovered SDIMOs, an updated SDIMO phylogenetic tree is constructed which
catagorizes the family of SDIMOs into 6 groups. In addition, we re-examine the C-H bond
dissociation energies in various common substrates of SDIMOs. This analysis is corherent
with the potential evolution direction of SDIMOs. Our updated phylogenetic tree reveals
three sub-clusters of group-6 SDIMOs for the first time. Physiological differences of
representative group-6 SDIMOs are investigated using transformant clones that
heterologously express individual enzymes. Molecular docking is employed to delineate
their structural properties and associations with catalytic functions characterized in
heterologous expression assays.
3.2 Methods
3.2.1 Construction of Phylogenetic Tree
SDIMOs’ α and β hydroxylases have some degrees of similarity in their protein primary
and secondary structure, respectively. Leahy et al.96 reported some specific residues
located at the catalytic center, “canyon”, “handle” and hydrogen-bonding residues are
conserved in α and β subunits. Rosenzweig et al.151 characterized the crystal structure of
sMMO from M. capsulatus Bath by X-ray, revealing 10 α-helices exhibit virtually identical
folds. Thus, it is reasonable to surmise that α and β subunits originated with duplication of
an ancestral carboxylate-bridged protein with a di-iron center96. The deduced amino acid

57
sequences of α and β subunits were aligned using MUSCLE (3.8.31)152 with default
parameters. The phylogenetic tree was constructed using the maximum likelihood
statistical analysis with 1000 Bootstrap by PhyML (version 3.3.20190909)153. LG+G+F
model was selected as the best substitution model based on the model optimization test
ProtTest 3.4.2 (https://github.com/ddarriba/prottest3)154. The phylogenetic tree
visualization was carried out using the webserver iTOL (version 5.5)155.
3.2.2 Alignment of Regulation Region Upstream of SDIMOs
The intervals between SDIMOs and their upstream gene were extracted and alignment
were aligned using MUSCLE (3.8.31) with default parameters. The regions including the
consensus sequences of σ54 (-24 and -12) and σ70 (-35 and -10) promoters were aligned
with the known motifs. The transcription start sites (TSS) were also pointed out on the
basis of the known TSS.
3.3 Results and Discussions
3.3.1 Evolution of SDIMOs
According to the alignment of the full-length amino acid sequences of SDIMOs, both α-
and β-oxygenase subunits in SDIMOs are distinctly separated into 6 groups using the
unrooted maximum likelihood algorithm with 1000 bootstraps. α- and β-oxygenase
subunits diverged from a putative common ancestor in the middle region of the
phylogenetic tree which is in line with Leahy et al.96 described. In vivo degradation
capacities of multiple members from each SDIMO group have been characterized in
previous studies as listed in Table 3.1. It concurs with their designated names: group 1 as
phenol monooxygenases, group 2 as aromatic monooxygenases, group 3 as methane

58
monooxygenases, group 4 as alkene monooxygenases, group 5 as propane/tetrahydrofuran
monooxygenases, and group 6 as propane monooxygenase. However, it should be noted
that this nomenclature is somewhat oversimplified due to the substrate promiscuity of
SDIMOs. Take propane degradation activity as an example, the propane degradation
capability has been found in group 5 and 6. Group-5 SDIMOs compose of two sub-
branches as shown in Figure 3.1: one of the branches accommodates well-studied
tetrahydrofuran degrading monooxygenase from P. CB119057, P. K1134, and P. ENV478135;
the other branch accommodates three monooxygenases found in the bacterial strains of
Gordonia sp. TY-5, Rhodococcus jostii RHA1, and Rhodococcus sp. RR1. It is reported
that TY-5 harbors a gene cluster designated as prmABCD that is involved in oxidation of
propane to 2-propanol156. However, to our best knowledge, the propane oxidation abilities
of the other two group-5 homologies in RHA1 and RR1 have not been explicitly explained.
It should be noted that both wild-type strains can grow with propane as the sole carbon and
energy source157, 158. In group 6, PH-06, TY-6, NBB4, ENV421, and BCP1 have been
confirmed that can utilize propane and supply energy to their host strains36, 70, 73, 126, 130.
Our results echo by a number of recent studies which differentiated the enzyme
family of SDIMOs into six groups according to their amino acid sequences and discrete
physiological roles. Holmes et al.97 constructed a phylogenetic tree by aligning 600 amino
acid sequences of α hydroxylase subunits. The phylogenetic tree constructed by He et al.35
using Neighbor-joining algorithm also exhibits the same classification pattern. The
distinctive operon arrangements of SDIMOs presented in Figure 3.1B also strongly support
that these six lineages in SDIMOs are phylogenetically distinct.

59
To be noted, the first discovered PRM in TY-6 with its homology forming a sub-
branch designed as cluster I. Based on the identity of α subunits, another two group 6
SDIMOs have a distinct distance from the cluster I group 6 SDIMOs. Therefore, group 6
SDIMOs phylogenetically diverged another two sub-branches designed as cluster II and
cluster III. Although previous research uncovered the group 6 SDIMOs in term of their
high identity of amino acid sequences, the three clusters’ physiological properties,
evolutionary developments, and substrate ranges are still elusive. Take Mycobacterium
marium E11159 as an exemple, its high identical group 6 SDIMO was mentioned in previous
study73. However, no detailed studies and comparison about degradation capacity,
evolutionary pattern, and many other aspects of this monooxygenase. Apart from the
scarcity investigations associated within group 6 SDIMOs, the evolution activity of group
6 in the SDIMOs family is ambiguous. Further, it is interesting to learn that group-6
SDIMOs can be distinctly devided into 3 clusters designated as Cluster I, II, and III,
respectively (Table 3.1 and Figure 3.1A). However, due to the limited knowledge about
group-6 SDIMOs, their physiological properties, substrate range, and evolution remain
elucive.
3.3.2 Evidence of Horizontal Gene Transfer (HGT)
SDIMO sequence analysis revealed that distances within a specific group are significantly
closer than those between groups. It suggests that SDIMOs evolve through genetic
variations (i.e., mutation and recombination) and their coding gene clusters can be spread
through HGT. The distances from the branch-off point of each group to the common
ancestor decide the evolution order in SDIMOs, following group 1 2 5 4 6
3 (Figure 3.1). This evolution order indicated group 3 and group 6 likely to have emerged

60
from most recent evolution events. Previous research96, 149 also found group-3 SDIMOs
represent the most distant branch in SDIMO phylogenetic tree from the “ancestor” and thus
surmised their methane oxidization activity may occur in the latest evolutionary stage.
It is likely that SDIMO genes spread through HGT because of the significantly high
similarity within each group and their localization on mobile elements. Among the selected
52 monooxygenases in the present study, 13 (25%) have been shown to be plasmid-
encoded (Table 3.1). Given the pivotal role of plasmids in HGT in the prokaryotes160, it is
reasonable to speculate that the genes located on plasmid have been obtained via HGT
process. Among the rest, 25 (48% of the 52) of them are chromosomal genes and 27% of
them are elusive because of their incomplete genome. As persistent vertical transmission
which would manifest in the retention of these enzymes in species and genus161. However,
the strains contain SDIMOs are diverse (Table 3.1); together with the high identity
indicating they may from the same origin, it can be surmised that chromosome-encoding
genes likely acquired via HGT and ultimately integrated to chromosome96.
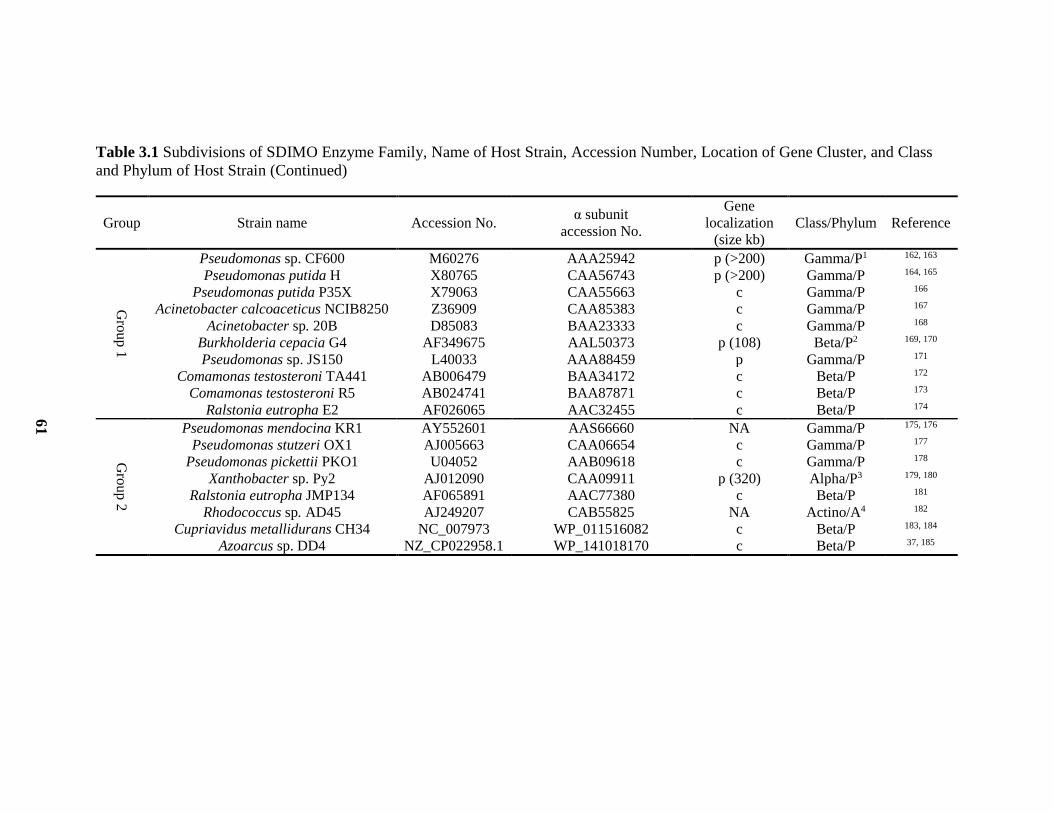
Table 3.1 Subdivisions of SDIMO Enzyme Family, Name of Host Strain, Accession Number, Location of Gene Cluster, and Class
and Phylum of Host Strain (Continued)
Group Strain name Accession No. α subunit
accession No.
Gene
localization
(size kb)
Class/Phylum Reference
Gro
up 1
Pseudomonas sp. CF600 M60276 AAA25942 p (>200) Gamma/P1 162, 163
Pseudomonas putida H X80765 CAA56743 p (>200) Gamma/P 164, 165
Pseudomonas putida P35X X79063 CAA55663 c Gamma/P 166
Acinetobacter calcoaceticus NCIB8250 Z36909 CAA85383 c Gamma/P 167
Acinetobacter sp. 20B D85083 BAA23333 c Gamma/P 168
Burkholderia cepacia G4 AF349675 AAL50373 p (108) Beta/P2 169, 170
Pseudomonas sp. JS150 L40033 AAA88459 p Gamma/P 171
Comamonas testosteroni TA441 AB006479 BAA34172 c Beta/P 172
Comamonas testosteroni R5 AB024741 BAA87871 c Beta/P 173
Ralstonia eutropha E2 AF026065 AAC32455 c Beta/P 174
Gro
up 2
Pseudomonas mendocina KR1 AY552601 AAS66660 NA Gamma/P 175, 176
Pseudomonas stutzeri OX1 AJ005663 CAA06654 c Gamma/P 177
Pseudomonas pickettii PKO1 U04052 AAB09618 c Gamma/P 178
Xanthobacter sp. Py2 AJ012090 CAA09911 p (320) Alpha/P3 179, 180
Ralstonia eutropha JMP134 AF065891 AAC77380 c Beta/P 181
Rhodococcus sp. AD45 AJ249207 CAB55825 NA Actino/A4 182
Cupriavidus metallidurans CH34 NC_007973 WP_011516082 c Beta/P 183, 184
Azoarcus sp. DD4 NZ_CP022958.1 WP_141018170 c Beta/P 37, 185
61

Table 3.1 Subdivisions of SDIMO Enzyme Family, Name of Host Strain, Accession Number, Location of Gene Cluster, and Class
and Phylum of Host Strain (Continued)
Group Strain name Accession No. α subunit
accession No.
Gene location
(size kb) Class/Phylum Reference
Gro
up 3
Type X Methylococcus capsulatus Bath M90050 AAB62392 c Gamma/P 186, 187
Type I Methylomonas sp. KSPIII AB025021 BAA84751 NA Gamma/P 188
Methylomonas sp. KSWIII AB025022 BAA84757 NA Gamma/P 188
Type
II
Methylosinus trichosporium
OB3b CP023737 ATQ70365 c Alpha/P 189, 190
Methylocystis sp. M U81594 AAC45289 c Alpha/P 191
Methylocystis sp. WI14 AF153282 AAF01268 c Alpha/P 192
New
cluster
Mycobacterium sp. ENV421 NZ_PDHO01000066.1 WP_102810290 NA Actino/A 72
Mycolicibacterium chubuense
NBB4 GU174751.2 ACZ56334 p (615) Actino/A 126
Mycolicibacterium rhodesiae
NBB3 NC_016604.1 WP_014211362 c Actino/A 63
Gro
up 4
Nocardia corallina B-276 D37875 BAA07114 p (185) Actino/A 193
Mycobacterium chubuense
NBB4 GU174752 ACZ56346 p (144) Actino/A 126
Mycobacterium sp. JS623 NC_019966 WP_015305852 c Actino/A 194
Mycobacterium rhodesiae JS60 AY243034 AAO48576 NA Actino/A 63
Nocardioides sp. JS614 AY772007 AAV52084 p (290) Actino/A 195
Gro
up
5
Pseudonocardia dioxanivorans
CB1190 CP002597 AEA29037 p (66) Actino/A 55
Pseudonocardia sp. ENV478 HQ699618 AEI99544 c Actino/A 135
Pseudonocardia sp. K1 AJ296087 CAC10506 c Actino/A 134
Pseudonocardia sp. N23 BEGX01000008 GAY07941 c Actino/A 132
Rhodococcus ruber YYL NZ_CP024892 WP_102032065 p (236) Actino/A 136
Gordonia sp. TY-5 AB112920 BAD03956 c Actino/A 156
Rhodococcus jostii RHA1 NC_008268 WP_011593714 c Actino/A 101
Rhodococcus sp. RR1 HM209445 ADM83577 NA Actino/A 32
62

Table 3.1 Subdivisions of SDIMO Enzyme Family, Name of Host Strain, Accession Number, Location of Gene Cluster, and Class
and Phylum of Host Strain (Continued)
Group Strain name Accession No. α subunit accession No.
Gene
location
(size kb)
Class/Phylum Reference
Gro
up 6
Clu
ster I
Mycobacterium sp. ENV421 NZ_PDHO01000068 WP_102810306 NA Actino/A 72
Mycobacterium dioxanotrophicus PH-
06 CP020812 ART74426 p (106) Actino/A 35, 36
Rhodococcus aetherivorans BCP1 NZ_CM002179 WP_006947300 p (103) Actino/A 129
Mycolicibacterium chubuense NBB4 NC_018022.1 WP_014805366 p (615) Actino/A 126
Clu
ster II
Mycobacterium sp. 012931 AOPX01000001 EPQ44813 NA Actino/A 196
Mycobacterium pseudoshottsii BCND01000037 GAQ35500 NA Actino/A 197
Mycobacterium marinum E11 HG917972 CDM74267 c Actino/A 198
Mycobacterium ulcerans subsp.
Shinshuense NZ_AP017624 WP_096369473 c Actino/A 199
Clu
ster III
Mycobacterium sp. ENV421 NZ_PDHO01000056 WP_102810202 NA Actino/A 72
Mycobacterium gordonae 1245752.6 NZ_MAEM01000159 WP_065133219 NA Actino/A NA
Mycobacterium lentiflavum CSUR
P1491 NZ_CTEE01000002 WP_090609799 NA Actino/A 200
Mycobacterium sp. TY-6 AB250938 BAF34294 c Actino/A 70
NA: Not available
p: plasmid
c: chromosome 1: Gammaproteobacteria/Proteobacteria 2: Betaproteobacteria/Proteobacteria 3: Alphaproteobacteria/Proteobacteria 4: Actinobacteria/Actinobacteria
63

64
Figure 3.1 Phylogeny and operon organization of SDIMO family. (A) Unrooted maximum
likelihood phylogenetic tree of α- and β-oxygenase subunits. (B) Operon organization for
each group. Components are indicated in different colors.

65
3.3.3 SDIMOs Evolve Towards Saturated Substrates with High Dissociation Energy
of C-H Bonds
According to the phylogeny analysis, it shows that SDIMOs evolved from unsaturated
aromatics or alkenes towards saturated alkanes, ultimately to methane, the most stable
hydrocarbon201. Alkenes oxidized through the formation of epoxide intermediates while
saturated alkanes directly attack the C-H bonds. Thus, the high C-H cleavage energy
required for the oxidation of saturated substrates suggests the SDIMO may evolve to attack
substrates with the dissociation energies from low towards high. Methane exhibits the
highest dissociation energy (i.e., 431.0 kJ/mol) in C-H bond (Table 3.2). The extremely
strong C-H bond in methane requires an enzymatic intermediate Q in di-iron core202 which
is an FeIV2O2 diomond core structure has extremely high oxidation capability found in
nature203. C-H bond at the primary location in propane requires 410.0 kJ/mol at the second
place of all the alkanes. While with the high dissociation energy for the primary C-H bond,
the secondary C-H bond in propane has a relatively low energy (i.e., 395.8 kJ/mol). The
whole cell degradation assay revealed that the group-6 propane monooxygenases in TY-6
and BCP1 could oxidize propane through the terminal and sub-terminal oxidation leading
to the production of 1-propanol and 2-propanol72, 129. On the contrary, the propane
monooxygenases belonging to group 5 oxidize propane via sub-terminal oxidation that
only produces 2-propanol129. These observations support our hypothesis for the correlation
between evolution of SDIMOs and the bond cleavage energy of their primary substrates.
To be specific, group-6 SDIMOs could cleavage the C-H bond including energy of 410.0
kJ/mol which is the dissociation energy of primary C-H bond in propane. It could surmise
that this branch of propane monooxygenases can oxidize most of the C2-C4 gaseous
alkanes such as ethane, butane, and isobutane. This prospective in accords with our

66
substrate assay for the group-6 SDIMO in PH-0638. Whilst group-5 propane
monooxygenase are capable to oxidize those bonds possessing energy includes 395.8
kJ/mol (the energy of the secondary C-H bond in propane). Of great interest that according
to the substrate range of THM in CB1190, the other sub-branch in group 5 SDIMOs
exhibits lower capacity that can oxidize C-H bonds possess 393.3 kJ/mol (in cyclohexane)
or less38.
Table 3.2 The C-H Bond Dissociation Energy of Alkanes, Alkene, and Dioxane Analogues
Substrate Dissociation energy Reference
Methane 431.0 kJ/mol Dean et al.204
Ethene 428.9 kJ/mol Kerr et al.205; Gurvich et al.206
Propane (primary) 410.0 kJ/mol Kerr et al.205
Ethane 410.0 kJ/mol Kerr et al.205
Butane (primary) 409.9 kJ/mol
431.0 kJ/mol
Gribov et al.207
Dean et al.204
Isobutane 408.5 kJ/mol Gribov et al.207
Propane (secondary) 395.8 kJ/mol Dean et al.204
Cyclohexane 393.3 kJ/mol Kerr et al.205
Dioxane 389.1 kJ/mol Battin et al.208
THF 382.8 kJ/mol Cruickshank et al.209; Dean et al.204
3.3.4 Gene Regulation of SDIMOs
Sequence motifs located upstream of gene clusters are marked as red in Table 3.3 through
alignment to the known regulatory regions. As previously reported, group 1, 2, and 3
SDIMOs are regulated by σ54-dependent promoters. In this regulation system, sigma factor
54 can direct RNA polymerase (RNAP)- σ54 to bind with the consensus polymerase binding
region. The sequences of two hexmars comparing with the sigma factor 70 recognizing
67
elements (i.e., TTGACA at - 35 hexamer and TATAAT at the - 10 hexamer in E.coli210)
are highly consensus. In groups 1, 2, and 3 SDIMOs (Table 3.3), the typical consensus
motifs are TGGCA – 24 and BTGC -12. Activation of σ54-dependent promoters requires
the assistance of an activator (also known as bacterial enhancer binding protein, bEBP) that
incorporates the energy generated from ATP hydrolysis and enables the isomerization of
the RNAP-σ54 closed complex (CC) to open complex (OC)211. σ54-dependent activators are
classified as members of the AAA+ (ATPases associated with various cellular activities)
superfamily212 on the basis of their structures and functions213. Previous investigations
regarding groups 1, 2, and 3 SDIMO transcription echoed the prerequisite of an activator.
Multiple activators have been discovered, such as DmpR encoded by dmpR from
Pseudomonas CF600, XylR encoded by xylR from Pseudomonas putida, TbuT encoded by
tbuT from Burkholderia pickettii PKO1, MmoR encoded by mmoR from Bath and OB3b,
as well as many other regulatory proteins (e.g., TouR, TbmR, and RhhR). The activator
binding site resides upstream of the consensus sequences recognized by polymerase and
embodies as a pair of inverted repeats214, 215. DNA must be folded up to 180° because
activator binding site is relatively far upstream of two transcriptional sites (-24 and -12)216,
217. Integration host factor (IHF) often binds between these two transcriptional sites
facilitating the formation of the DNA looping218, 219.
Unlike groups 1, 2, and 3 SDIMOs, group-6 SDIMOs are likely to be regulated by
σ70-dependent promoters considering the absence of feature sequences for the σ54-
dependent regulation region. This is in line with a previous study that reported the putative
-35 and -10 hexamers upstream of group-6 SDIMO gene clusters in BCP1 and NBB4129.
Researchers reported that RNA polymerase holoenzyme (Eσ70 ) in E. coli recognizes and

68
binds to the consensus sequences TTGACA at the -35 and positions of TATAAT at the -
10, and the spacing between these sequences is crucial for transcription initiation210, 220.
However, consensus sequences identified as putative transcriptional elements of group-6
SDIMOs are not in good consistence with those reported in E. coli. Further, they are weakly
conserved for group-6 SDIMOs as compared to those in groups 1, 2, and 3. Unlike σ54-
dependent promoters, RNAP-σ70 closed complex is an energetic unfavorable structure that
is readily converted to the open complex. Thus, the activator is not required by all of the
σ70-dependent regulation processes, though this remains unclear and warrents further
verification.

Table 3.3 Regulatory Regions Upstream of SDIMOs through Docking Sequence Motifs (Continued)
Strain Name Gene Promotera Regulatory motifb RBS References
Gro
up 1
Pseudomonas sp. strain CF600 dmp σ54 tggcacagccgttgcttgatgtcctgcg GGAG 221
Pseudomonas putida H phl σ54 tggcacagctgttgcactttgtcctgcg GGAG NA
Pseudomonas putida P35X phh σ54 tggcacagctgttgctttatgtcctgcg GGAG 222
Acinetobacter calcoaceticus NCIB8250 mop σ54 tggcacgacttttggaatatctagagta AGGA NA
Acinetobacter sp. strain 20B dso miss AGGA NA
Burkholderia cepacia G4 tom miss GGAGA NA
Pseudomonas sp. strain JS150 tbm σ54 tggcacaccttctgcaaaagaggagcgt AGCGGA NA
Comamonas testosteroni TA441 aph σ54 tggcacgggctgtgcaattgcaaaggcc AGGAG NA
Comamonas testosteroni R5 phc σ54 tggcacgggctgtgcaattgcaaaggcc AGGAG NA
Ralstonia eutropha strain E2 pox σ54 tggcacggtcttcgcaatagaccgggca AGGAG NA
Gro
up 2
Pseudomonas mendocina KR1 tmo miss CGGAGA NA
Pseudomonas stutzeri OX1 tou σ54 tggcatatacattgcttcagatacagata AAGGAGA 223
Pseudomonas pickettii PKO1 tbu σ54 tggcaccggccttgcaatggaggaccg AAGGAGA 178
Xanthobacter sp. Py2 aam σ54 tgggcgcaccttgccgctcatcgcaa GGGAGG NA
Ralstonia eutropha JMP134 phl σ54 tggcattgcatttgcgaaagggacagc AAGGAGA NA
Rhodococcus sp. AD45 iso miss AGGAAA NA
Cupriavidus metallidurans CH34 dmp miss TGGAGA NA
Gro
up 3
Methylococcus capsulatus strain Bath smo σ54 tggcacgatccctgtaactaggttgtcac CGGAGGA 214
Methylomonas sp. strain KSPIII smo σ54 tggcacgtgtgttgcaatctgccctgcga AGGAGGA 188
Methylomonas sp. strain KSWIII smo σ54 tggcacacgtgttgcaatctgaccaccga AGGAGGA 224
Methylosinus trichosporium OB3b smo σ54 tggcacaggccttgccaaataagaagcgt ACGAGGA 224
Methylocystis sp. Strain M smo σ54 tggcacgcgccttgccaaataagtcgggt ACGAGGA 191
Methylocystis sp. strain WI14 smo miss NA
69

Table 3.3 Regulatory Regions Upstream of SDIMOs through Docking Sequence Motifs (Continued)
Strain Name Gene Promoter Regulatory motif RBS References
Gro
up 6
Mycobacterium sp. ENV421 prm σ70 taggcaaccgcagagctatgtgtgagcatggtctca CGGGAG NA
Mycobacterium dioxanotrophicus strain PH-06 prm σ70 tgttcgcccgcagatccgcgtgtgatgctggtctca CGGGAG NA
Rhodococcus aetherivorans strain BCP1 prm σ70 tagtcaacccggggtagaaatgtgatggtgatctca CGGGAG 129
Mycolicibacterium chubuense NBB4 prm σ70 tagtcgacggcatccgcgcgtgtgacgatgatctca CGGGAG 129
Mycobacterium sp. 012931 prm σ70 tagtgcagaccggcgggtggtgtgatcctggtctca CAAGAG NA
Mycobacterium pseudoshottsii prm σ70 tagtgcagaccggcgggtggtgtgatcctggtctca CAAGAG NA
Mycobacterium marinum E11 prm σ70 tagtgcagaccggcgggtggtgtgatcctggtctca CAAGAG NA
Mycobacterium ulcerans subsp. Shinshuense prm σ70 tagtgcagaccggcgggtggtgtgatcctggtctca CAAGAG NA
Mycobacterium sp. ENV421 prm σ70 cgcacagctgccaagcctagggtgatctctatcacc GGGGAG NA
Mycobacterium gordonae strain 1245752.6 prm σ70 ccgcgaagagagcgccttacagtgacaggcatcacg GGGAAG NA
Mycobacterium lentiflavum strain CSUR P1491 prm miss GGAAG NA
Mycobacterium sp. TY-6 prm σ70 ttgccgattcccacccttacggtgatgtctatcacc GGAAG NA
NA: not available a: The promoters are indicated by σ54- and σ70-dependent polymerases. b: The consensus sequence of polymerase binding sites are marked as red. The transcriptional start sites are bolded.
70

71
3.4 Implication
Along with the advent of the next-generation sequencing, an increasing number of
SDIMOs are discovered from the environment as they are potent biocatalysts valuable for
applications, such as bioremediation and green energy production. However, SDIMOs
exhibit eminently diverse and relatively low abundance in environment. Thus, it leads to
an intricate process to characterize the physiological roles of newly discovered SDIMOs.
For example, the isolation of target SDIMO-expressing strains that are of low abundance
is labor-intensive. Even if the isolation is successful, characterization of the target SDIMO
involves extensive laboratory efforts. This research reconciles the existing challenges by
bioprospecting intrinsic properties and physiological roles of SDIMOs. According to the
amino acid sequences of the component that exerts oxidation function (i.e., the α subunit),
together with the explicit operonal organization, SDIMOs can be classified into 6 groups
as shown. Consequently, for accurate categorization, it is necessary to recover individual
SDIMO gene components as well as their entire operons. Though the α subunit of the
hydroxylase is the site of hydroxylation, there is evidence that other proteins also affect
the catalytic properties of SDIMOs. The bioinformatic profiling of SDIMOs provides the
whole picture of this enzymatic family including the novel SDIMOs in group 6, regarding
their phylogeny, evolution, and physiological functions. Their physiological roles can be
roughly predicted according to characterized enzymes from the same clade. This could
provide information in terms of the SDIMOs’ substrate range and poteintial properties.

72
CHAPTER 4
UNTANGLING THE GENOMIC DIVERGENCE BETWEEN METABOLIC AND
CO-METABOLIC DIOXANE-DEGRADING ACTINOMYCETES
4.1 Introduction
To date, over 28 bacterial strains have been reported given their capability of degrading
dioxane via metabolism or co-metabolism. Based on the taxonomic analysis, many of
known degraders are Actinomycetes and can be classified into three genera:
Rhodococcus225, 226, Mycobacterium58, 227, and Pseudonocardia60, 228. Among these dioxane
degrading Actinomycetes, 12 of them are dioxane metabolizers that can ultilize dioxane as
a sole carbon and energy source to support the growth and fully mineralize it into carbon
dioxide. Unlike metabolic degraders, co-metabolic degraders refer to those bacterial strains
that can fortuitously degrade dioxane but require the supplement of additional carbon
source. Co-metabolizers cannot grow when dioxane is provided as the only carbon source.
propane35, 36, toluene229, THF41, 135 are common auxiliary substrates that can not only
stimulate the expression of “sloppy” enzymes that concurrently oxidize dioxane, but also
sustain the growth of the co-metabolizers.

73
Figure 4.1 Dioxane biodegradation pathways in metabolic and co-metabolic bacterial
strains. 2-Hydroxyethoxyacetic acid (HEAA) is mineralized in metabolism pathway. In
contrast, HEAA accumulated in co-metabolism degradation pathway.
Increasing attention has been drawn to the biodegradation of dioxane within the last
decade. SDIMOs are essential for initiating the dioxane degradation, particularly the group-
6 SDIMOs in Actinomycetes as discussed in Chapter 3 of this dissertation. However, as
previous studies primarily focused on the first step of dioxane oxidation, limited is known
about the downstream degradation pathway after 2-(2-hydroxyethoxy) acetic acid (HEAA)
is formed55, 57. The initialization of dioxane breakdown is catalyzed by a variety of

74
SDIMOs including propane monooxygenases, tetrahydrofuran (THF) monooxygenases,
toluene monooxygenases, soluble methane monooxygenases230. These SDIMOs initialized
dioxane degradation by inserting a hydroxyl group to the α-carbon to form p-dioxanol.
Then it undergoes hydrolysis and forms 2-(2-hydroxyethoxy) acetaldehyde, which is
further subject to the oxidation by aldehyde dehydrogenase enzyme forming 2-(2-
hydroxyethoxy) acetic acid, which is also named as HEAA56, 228 (Figure 6-1). Afterward,
metabolism and co-metabolism behave divergently regarding to HEAA. Metabolic
degraders can continue to transform HEAA into small molecules such as ethylene glycol,
glyoxylate, and gylcoaldehyde, which enter central metabolic pathways55, 57. Grostern et al.
revealed that glyoxal, ethylene glycol, and glycolate were the oxidation products after
HEAA oxidized by an unknown oxygenase. They underwent sequential oxidation by
dehydrogenases and oxidase to glyoxylate, which was approved to be a key downstream
product, which is eventually mineralized to carbon dioxide or enter TCA cycle. Thus,
glyoxylate assimilation is critical for CB1190 to grow on dioxane as a sole carbon and
energy source. Sales et al. further explored the degradation pathway of THF. Comparing
with the dioxane degradation pathway, the initialization of the ring cleavage of THF was
performed by the same dioxane-degrading enzyme THM in CB1190. However, THF was
oxidized to 4-hydroxybutyrate without generating HEAA. The succinate was the key
metabolite analogous to glyoxylate in the dioxane degradation pathway.
In contrast to dioxane metabolism, HEAA accumulates in co-metabolic degraders
without generating downstream metabolites. Thus, HEAA degradation capacity is key to
distinguish the dioxane metabolizers with co-metabolizers. Thus, contrasting the genomes
of dioxane metabolizers and co-metabolizers may enable the discovery of genes involved

75
in HEAA biotransformation and other downstream mineralization steps. Heterologous
expression of their encoded enzymes can be used to validate their catalytic functions.
4.2 Materials and Methods
4.2.1 Genome Analysis and Comparison
We postulate that genes responsible for the HEAA degradation are only present in dioxane
metabolizers but absent in co-metabolic strains. Based on this hypothesis, we investigated
the genomic differences between metabolic and co-metabolic strains. The genomic
information was retrieved from the database of the National Center for Biotechnology
Information (NCBI), which contains the complete genomes of only 4 dioxane metabolic
strains and 6 dioxane co-metabolic strains (Table 4.1). CD-HIT algorithm231, 232 was used
to identify specific genes shared only by metabolic strains, but not co-metabolic strains.
The comparison was based on the protein sequences to provide a direct linkage with their
phenotypes. The cutoff threshold for the identity of protein sequences was 40% to
categorize proteins that may exhibit similar functions. The putative functions of the
encoded proteins were annotated using the Kyoto Encyclopedia of Genes and Genomes
(KEGG) database by the KEGG Automatic Annotation Server (KAAS)233 and NCBI
BLAST. The degradation pathways involving the genes/enzymes of interest were predicted
by KEGG orthology (KO) identifiers. Based on the previous study56, HEAA degradation
may be catalyzed by bacterial oxygenases, such as monooxygenase, dioxygenase, ether
hydrolase, carbon-oxygen lyase, peroxidase, laccase, and etherase. Thus, we primarily
focus on genes encoding these oxygenases to investigate their association with HEAA
degradation.

76
Table 4.1 List of Dioxane Degrading Strains
Metabolism Co-metabolism
Mycobacterium dioxanotrophicus PH-06* Mycobacterium chubuense NBB4*
Mycobacterium sp. D6 Pseudonocardia sp. K1
Mycobacterium sp. D11 Pseudonocardia sp. ENV478*
Pseudonocardia dioxanivorans CB1190* Mycobacterium sp. ENV421*
Pseudonocardia sp. N23* Pseudonocardia acaciae JCM 16707*
Pseudonocardia dioxanivorans BERK-1*
Pseudonocardia asaccharolytica JCM
10410*
Pseudonocardia benzenivorans B5 Rhodococcus aetherivorans BCP1*
Pseudonocardia antarctica DVS 5a1 Rhodococcus aetherivorans JCM 14343T
Pseudonocardia sp. D17 Rhodococcus sp. ENV425
Pseudonocardia sp. RM31 Rhodococcus ruber T1
Rhodococcus ruber 219 Rhodococcus ruber T5
Acinetobacter baumannii DD1 Flavobacterium sp.
Afipia sp. D1
Rhodanobacter sp. AYS5
Xanthobacter flavus DT8
Cordyceps sinensis A *Strain with sequenced genomes available in NCBI
Actinomycetes are indicated in bold.
4.2.2 HEAA Degrading Gene Verification
Based on the genome analysis, HEAA degrading gene candidates were selected. To
validate their functions, we heterologously expressed the most likely genes in mc2-155 as
described in Section 2.2.2. Mycobacterium dioxanotrophicus PH-06 and Pseudonocardia
dioxanivorans CB1190 are selected as representatives for dioxane metabolism. The ~2.6
kb gene clusters (containing two components) encoding Flavin monooxygenase (FMO)
were amplified from PH-06 and CB1190 using the specific primers. PCR was performed
using th forward primer 5’-AGATATACATATGGTGGCCGCACCCCACATCG-3’ and
reverse primer 5’-AGATATAAAGCTTCTAGCCGGTGACCGCGGTC-3’ for PH-06 and
forward primer 5’-AGATATACATATGGTGCCCGATACCCCCCTTCACC-3’ and
reverse primer 5’-AGATATAAAGCTTTCAGACGCTCGCGCGGG-3’ for CB1190.

77
Restriction digest sites for NdeI and HindIII are underlined. The expression process was
carried out as described in Section 2.2.2. Successful expression of cloned genes in
transformants was verified by SDS-PAGE and physiological assay.
4.3 Results and Discussion
4.3.1 Putative HEAA Degrading Genes
Based on the CD-HIT genomic analysis, 637 clusters of protein sequences have been
screened out for those that are harbored only by four dioxane metabolizers (i.e., CB1190,
PH-06, N23, and BERK-1) but not in the six co-metabolizers. Subsequent annotation
showed only 49 genes are relevant to oxidation (Table 4.2). To shorten the candidate list,
candidate genes were compared with previous results for screening genes whose
transcription was upregulated by dioxane. RNA sequencing (RNA-seq) was employed by
He et al.31 to quantify the gene expression fold change during the growth on dioxane
relative to glucose in PH-06. Among these genes shown with dioxane upregulation I PH-
06, BTO20_RS24595 is the only one found in the candidate list. Further, candidate genes
were compared with the results of microarray assays conducted by Sales et al. and Grostern
et al.55, 57 which surveyed the expression ratio of every single gene induced by dioxane and
glycolate relative to growth on pyruvate in CB1190. The gene tagged with Psed_2030 on
chromosome was found with 2.2 times induction by dioxane relative to pyruvate. This was
the only gene overlapping with candidate genes generated by our comparative genome
analysis, though it also induced by the downstream product, glycolate (2.4 time induction).
Thus, these two candidate genes are more likely involved in the degradation of HEAA.
Cyclohexane is an analog to dioxane, the cyclohexanone monooxygenase participates in
the oxidation of cyclohexanone, which is a metabolite of cyclohexane. The cyclohexanone

78
oxidized by this monooxygenase, which adds a ketone group at the ortho location. Thus,
this monooxygenase is also a potent candidate.
Table 4.2 The HEAA Degrading Gene Candidates (Continued)
Tag Description
CB1190 PH-06
Psed_1410 BTO20_RS12775 4-hydroxyphenylpyruvate dioxygenase
Psed_3175 BTO20_RS33850
alpha/beta hydrolase
Psed_6109 BTO20_RS04180
Psed_3059 BTO20_RS21400
Psed_0347 BTO20_RS16920
Psed_0919
Psed_2003 BTO20_RS07510 alpha-ketoglutarate-dependent dioxygenase AlkB
Psed_3145 BTO20_RS26460 beta-phosphoglucomutase family hydrolase
Psed_0764 BTO20_RS25720
catechol 1,2-dioxygenase CatA Psed_3093
Psed_6065
Psed_0488 BTO20_RS21890
cyclohexanone monooxygenase Psed_2233
Psed_5827
Psed_0549 BTO20_RS08130 cysteine dioxygenase
Psed_0057 BTO20_RS30275 cytochrome c oxidase assembly protein
Psed_5032
Psed_2030 BTO20_RS32940
cytochrome P450 Psed_2740 BTO20_RS35755
Psed_2618 BTO20_RS32300
Psed_2691
Psed_5823 BTO20_RS14095 ectoine hydroxylase
Psed_3103 BTO20_RS29675 epoxide hydrolase
Psed_1827 BTO20_RS00490 EthD family reductase
Psed_1828 BTO20_RS32740 FAD-dependent oxidoreductase
Psed_1455 BTO20_RS28730
Glyoxalase Psed_3315 BTO20_RS31180
Psed_4204 BTO20_RS13230
Psed_2367 BTO20_RS26605 iron-containing redox enzyme family protein

79
Table 4.2 The HEAA Degrading Gene Candidates (Continued)
Tag Description
CB1190 PH-06
Psed_4928 BTO20_RS24600
LLM class flavin-dependent oxidoreductase (FMO)
Psed_5838 BTO20_RS34065
Psed_2056 BTO20_RS05760
Psed_2622 BTO20_RS12265
Psed_5837 BTO20_RS24595
Psed_4935 BTO20_RS32215
Psed_2897 BTO20_RS23965 LysR family transcriptional regulator
Psed_0431 BTO20_RS30790 MBL fold metallo-hydrolase
Psed_3608 BTO20_RS19425 NUDIX domain-containing protein
Psed_1703 BTO20_RS09025 NUDIX hydrolase
Psed_1565 BTO20_RS25650 protocatechuate 3,4-dioxygenase α subunits
Psed_1566 BTO20_RS25655 protocatechuate 3,4-dioxygenase β subunits
Psed_6712 BTO20_RS05975 recombinase family protein
Psed_2573 BTO20_RS35485
SDR family NAD(P)-dependent oxidoreductase Psed_3999 BTO20_RS08640
BTO20_RS10385
BTO20_RS24095
Psed_0988 BTO20_RS14745 VOC family protein
Psed_3302 BTO20_RS09680
4.3.2 Phylogenetic Analysis of Protein Candidates
Three potential HEAA degrading proteins were screened based on the comparison with
transcription data generated by previous studies, as well as the dioxane structure analog
degradation pathway analysis. We focused on cyclohexanone monooxygenase
(BTO20_RS21890), LLM class flavin-dependent oxidoreductase (BTO20_RS24595
named as FMNH2-dependent monooxygenase in He’s paper), and cytochrome P450
(Psed_2030 named as Linalool 8-monooxygenase in Sales’s paper) for their potentials in
HEAA degradation. Protein sequences with high identities (> 40%) were extracted from
all the dioxane degraders to validate their ubiquitous presence and assess their phylogenetic
relationships (Figure 4.2).

80
The phylogentic tree in Figure 4.2A showed LLM class Flavin-dependent
oxidoreductases were phylogenetically close in all dioxane metabolizers, though with one
found in a dioxane co-metabolizer, BCP1. The four oxidoreductases from the metabolizers
exhibited high similarity (> 63%). However, the one harbored by BCP1 is phylogenetically
apart from the four harbored by metabolizers with a relatively low identity (55%) to that in
CB1190. Thus, it may suggest a distinct physiological role of these enzymes in
metabolizers against co-metabolizer. Figure 4.2B showed cytochrome P450 proteins are
widely found in both metabolic and co-metabolic degraders. Though three metabolic
strains (CB1190, N23, and BERK-1) all harbor cytochrome P450 proteins with high
identity (> 88%), the cytochrome P450 protein harbored by PH-06 is distantly related with
a low identity of 47% to the one in CB1190. This is also the case for the third enzyme
candidate, cyclohexanone monooxygenase (Figure 4.2C). According to these sequence
analyses, we postulate LLM class Flavin-dependent oxidoreductases are most likely to be
the enzymes that catalyze the HEAA degradation. LLM class Flavin-dependent
oxidoreductase is also named as FMNH2-dependent monooxygenase or FMO, representing
a common monooxygenase responsible for oxidation of a variety of xenobiotics, such as
the sulfonamide degradation in Microbacterium sp. strain BR1234. Notably, another
component of FMO is adjacent to this gene without an interval and was observed in all four
metabolizers with high identity. Thus, FMO in metabolizers could be a two-component
monooxygenase to exert its physiological function. Research reported that one of them is
a NAD(P)H:Flavin oxidoreductase, which provides a reduced flavin to the second
component, the proper monooxygenase235.

81
Figure 4.2 Phylogenetic trees of (A) LLM class flavin-dependent oxidoreductases, (B)
cytochrome P450, and (C) cyclohexanone monooxygenases in dioxane metabolic and co-
metabolic strains.
4.3.3 A Putative FMO Doesn’t Have HEAA Degradation Capacity
Heterologous transformation of FMOs from CB1190 and PH-06 to mc2-155was successful
as evident by the overexpression of two FMO components of 47 and 54 kDa in size (Figure
4.3). These transformants were cultured, induced, and harvested as described in Section
2.2.3. Unfortunately, no HEAA degradation was observed in degradation assays with the
resting transformants. This may result from several reasons: (1) it indicates that maybe the
expressed FMO is not the enzyme in charge of HEAA degradation. (2) or the incorrect fold
leading to the abnormal function. To sovle these, we can improve the screening techniques
to obtain correct genes. Although we carefully screened the potential HEAA-degrading
genes from the list which was acquired from genome comparison, as well as the induced
genes from other research, pitfalls are remaining considering the huge gene pools from the
dioxane degraders. Transcriptomic analysis of dioxane degraders helps the target gene

82
screening via comparing the gene abundance with amendment of dioxane or HEAA verses
amended with other uninducable substrates, such as succinate, glycolate. Also, some
strategies that could result in a correct folded protein may get a protein exerting its function.
Figure 4.3 SDS-PAGE analysis depicting the increased expression of the FMO proteins in
cell extracts from mc2-155 transformants with pTip-fmoPH and pTip-fmoCB in comparison
with the empty vector (pTip-QC2) control. Band positions indicating two components of
FMOs were estimated based on their calculated protein size.
4.3.4 Downstream Genes Involved in Glycolate Transformation Are Essential for
Metabolic Biodegradation of Dioxane
Interestingly, a number of genes involved in glycolate transformation were identified in the
candidate list, indicating their pivotal role in dioxane mineralization specific for metabolic
degraders (Table 4.3). As evident in CB1190, these genes are responsible for generating
energy and building blocks for dioxane metabolizers55. Glycolate is first oxidized to
glyoxylate by GlcF. Glyoxylate is further metabolized through three pathways (Figure 1.3):

83
(1) glyoxylate is transformed to oxalate, ultimately to carbon dioxide236 (2) glyoxylate is
incorporated with acetyl coenzyme A by malate synthase G and then converted to malate,
and (3) two glyoxylate molecules are merged by glyoxylate carboligase, which
simultaneously decarboxylates the condensation product to tartronic semialdehyde237, 238.
Despite the enzyme catalyzing the first pathway remains unknown, enzymes involving the
second and third pathways have been identified in metabolic strains, indicating their key
roles in dioxane metabolic degradation. Mahendra et al.56 used the isotope-labeled (14C)
dioxane to track the mineralization products derived from the degradation of dioxane in
CB1190. After 40 h, 40% of 14C was converted to CO2, and 5% was recovered in CB1190
biomass. Grostern et al.121 carried out isotopomer analysis with 13C-labelled dioxane,
results suggest that carbon dioxide and all of the detected amino acids were labeled
indicating dioxane was converted to both CO2 and biomass. They also exploited that
CB1190 assimilated carbon partially from atmospheric CO2 for the generation of amino
acids.
Several alcohol and aldehyde dehydrogenases (Figure 4.4), well-known enzymes
participating in the secondary step of dioxane biodegradation (Figure 1.3)239, are present
in both metabolizers and co-metabolizers (take group-5 and group-6 SDIMO-containing
strains as examples Figure 4.4). It indicates that dioxane is unbiasedly converted to HEAA
as a key intermediate products regardless of metabolic or co-metabolic pathways.

84
Table 4.3 Unique Downstream Genes Involved in Dioxane/HEAA Degradation in
Metabolic Degraders
KO No. EC. No. Encoded Enzyme Catalytic Reacion
K11473 1.1.3.15 glycolate oxidase iron-sulfur
subunit (glcF) glycolate to glyoxylate
K01608 4.1.1.47 tartronate-semialdehyde
synthase (gcl)
glyoxylate to tartronate
semialdehyde
K00042 1.1.1.60 2-hydroxy-3-oxopropionate
reductase
tartronate semialdehyde to D-
glycerate
K00865 2.7.1.165 glycerate 2-kinase D-glycerate to 2-phospho-D-
glycerate
K01638 2.3.3.9 malate synthase G glycolate/Acetyl-CoA to
malate
K01816 5.3.1.22 hydroxypyruvate isomerase hydroxypruvate to tartronate
semialdehyde
K00135
1.2.1.16 succinate-semialdehyde
dehydrogenase / glutarate-
semialdehyde
dehydrogenase
succinate semialdehyde to
succinate
1.2.1.79
1.2.1.4 NADP-dependent aldehyde
dehydrogenase
adipate semialdehyde to
adipate
K01692 4.2.17 enoyl-CoA hydratase ethene bonds to -OH
Figure 4.4 Alcohol/aldehyde dehydrogenases involved in dioxane degradation are
extensively detected in bacteria that harbor group-5 and 6 SDIMO genes. Alcohol
dehydrogenases are shadowed in blue and aldehyde dehydrogenases are shadowed in
orange.

85
4.4 Future Work
Although this study failed for the discovery of the HEAA oxidation gene/enzyme, it
provides a feasible strategy for exploiting the novel functions distinct among degradation
pathways in phylogenetically related bacteria. In the future, an intricate screening should
be conducted by the optimization of the threshold to sort enyzmes of similar functions.
Transcriptomic analysis is also recommended as it explicitly points out genes that can be
upregulated by HEAA in comparison with downstream intermediates, such as ethylene
glycol, glycolate, and other compounds shown in Figure 1.3. Genome sequencing of more
dioxane degraders could elevate the availability of genome database, which endows the
genome comparison between metabolic and co-metabolic strains a more reliable.

86
CHAPTER 5
EFFECTIVE REMOVAL OF TRACE LEVELS OF 1,4-DIOXANE BY
BIOAUGMENTATION WITH AZOARCUS SP. DD4 AND A
PROPANOTROPHIC CONSORTIUM
5.1 Introduction
A growing body of evidence shows monooxygenase-expressing microorganisms such as
Mycobacterium dioxanotrophicus PH-06, Pseudonocardia dioxanivorans CB1190,
Mycobacterium sp. strain ENV421, Pseudonocardia sp. strain ENV478, Burkholderia
cepacia G4, and Pseudomonas mendocina KR158, 135, 175, 240-242 are able to degrade dioxane
co-metabolically or metabolically. Although the bioaugmentation approach is usually
highly efficient in the removal of the target pollutants under laboratory conditions, their
performance under natural conditions cannot be predicted because of the complexity of the
environmental conditions79. Given the severe growth condition of microbes imposed,
including more inhibitory substances and the low concentration of available nutrients. The
co-metabolic strains involving bioremediation may become prevalent under such fortuitous
conditions80. A co-metabolic strain Azoarcus sp. DD4, the first Gram-negative bacterium,
is able to synchronize dioxane oxidation when fueled with propane. It could oxidize
dioxane by adding a hydroxyl group to the α-carbon adjacent to oxygen by toluene
monooxygenase37, 229. Due to the high cell yield and well-distribution, it may likely to
degrade low concentration (approximate 100 µg/L) of dioxane to less than New Jersey
guidance when feeding with propane.
In the current study, we obtained the influent and effluent water samples from
pump-and-treat facility to estimate the DD4 performance in ex situ groundwater. Two
groundwater samples from near the source zone and middle of the plume were also

87
collected to evaluate the DD4’s feasibility at in situ Superfund site. A microcosm assay
was set up to evaluate the feasibility of a Gram-negative propanotrophs Azoarcus sp. DD4
at authentic Superfund site water samples with low dioxane concentration. To investigate
the effects of the co-occurring indigenous or exogenous propanotrophs, propane induced
treatment and propane with metabolizers (i.e., CB1190 and PH-06) treatment were
conducted in the present study. The molecular microbiology techniques were employed to
monitor the survivability and feasibility of DD4 at such groundwater samples and
environmental conditions.
5.2 Materials and methods
5.2.1 Sample Collection
Combe Fill South Superfund Site is located at Chester Township, NJ (Figure 5.1). It has
been put on the National Priority List (NPL) by USEPA since September 1983 due to the
detection of toxic compounds such as benzene, methylene chloride, and chloroform. It is
still active for VOCs and dioxane cleanup because of a recent investigation. The ongoing
pump-and-treat approach exhibits in Figure 5.2 efficiently remove VOCs to under the
NJDEP groundwater quality standards (GWQS) as shown in Table 5.1. Apart from the
detected VOCs, many other organic compounds could be efficiently removed by GAC
adsorption243. The extracted groundwater is pooled together as a composite influent sample
(INF). A series of treatments are followed, including equitation, sedimentation, filtration
and carbon adsorption to remove recalcitrant VOCs. The effluent (EFF) is discharged after
the passage of the effluent monitoring tank. Samples were collected by HDR at this
Superfund Site in May 2019 and sent to our laboratory at NJIT with refrigeration on the

88
same day of the sampling. They were stored at 4 °C in amber glass bottles without
headspace prior to the microcosm setup. Four water samples include two groundwater
samples from monitoring wells exhibiting typical high- and medium-level dioxane
concentrations in the plume at the site (MW1 and MW2 as shown in Figure 5.1), as well
as the influent and effluent samples (INF and EFF) from the groundwater extraction and
treatment (GWET) facility were collected, aiming to provide potential treatment strategies
for ex situ or in situ bioremediation.
Figure 5.1 The 100, 10, 0.5 μg/L of dioxane isocontours at the Combe Fill South Landfill
Superfund site. The two in situ sampling points, MW1 and MW2, are indicated as yellow
circles.

89
Figure 5.2 The flow chat of groundwater extraction and treatment (GWET) facility.
Table 5.1 Initial Concentrations of VOCs and Metals in Different Groundwater Samples
(Continued)
Compounds Concentration (µg/L)
INF EFF MW1 MW2
VOCs
1,1-Dichloroethene 0.13 < 0.50 < 0.50 < 0.5
1,2-Dichlorobenzene 0.40 < 0.50 0.15 0.14
1,2-Dichloroethane < 0.50 < 0.50 < 0.50 0.5
1,4-Dichlorobenzene 1.2 < 0.50 2.3 0.4
Benzene 0.97 < 0.50 < 0.50 0.64
Chlorobenzene 2.9 < 0.50 0.64 1.5
Chloroform 0.46 0.041 < 0.50 < 0.5
Cis-1,2-Dichloroethylene 1.7 < 0.50 < 0.50 15
Methylene Chloride 0.13 < 0.50 < 0.50 < 0.5
Tert-Butyl Methyl Ether < 0.50 < 0.50 0.14 0.1
Tetrachloroethylene 0.23 < 0.50 < 0.50 < 0.5
Toluene < 0.50 < 0.50 < 0.50 0.072
Trans-1,2-Dichloroethene 0.11 < 0.50 < 0.50 0.37
Trichloroethylene 3.9 < 0.50 < 0.50 7.8
Trichlorofluoromethane 0.59 < 0.50 < 0.50 < 0.5
Vinyl Chloride 0.48 < 0.50 < 0.50 9.2
Metals
Aluminum 34 <20 <20 330
Iron 3100 <20 5500 40000
Manganese 2300 <1 1800 920
Magnesium 11000 11000 23000 5600
Sodium 28000 90000 140000 7800

90
Table 5.1 Initial Concentrations of VOCs and Metals in Different Groundwater Samples
(Continued)
Compounds Concentration (µg/L)
INF EFF MW1 MW2
Other
Dioxane 34.3±1.1 27.4±0.5 130.0±3.3 83.2±2.3
TOC 3000 1900 12000 1700 Concentrations that exceed the groundwater quality standards (GWQS) by the New Jersey Department of
Environmental Protection (NJDEP) are in bold.
5.2.2 Microcosm Assays
Microcosm assays were conducted in triplicate to discern the rate and extent of dioxane
biodegradation occurring in groundwater samples of interest, enabling the assessment of
the effectiveness of different bioremediation strategies (e.g., ex situ vs in situ). For each
sample, an abiotic control and three biologically active treatments mimicking (1)
biostimulation with propane, (2) bioaugmentation with the dioxane co-metabolizer,
Azoarcus sp. DD437, and (3) bioaugmentation with a mixed consortium consisting of two
dioxane metabolizers (CB119092 and PH-06244) and one co-metabolizer (DD4) were
conducted as shown in Table 5.2.
Table 5.2 Microcosm Setup
Treatment Control Propane DD4+propane Mix+propane
Propane
(0.15 % v/v in headspace) √ √ √
Groundwater
(60 mL in 160 mL serum
bottle)
√ √ √ √
DD4
(0.17 mg as total protein) √
Mixture of DD4, PH-06, and
CB1190
(0.17 mg as total protein)
√

91
All microcosms were prepared in 160-mL serum bottles sealed with rubber caps.
DD4 was cultured in nitrate mineral salt (NMS) media with propane as the growth substrate
and harvested at the exponential growth phase. CB1190 and PH-06 grown on 100 mg/L of
dioxane in ammonium mineral salts (AMS) media. Cultures were harvested at their
exponential growth phases, washed for three times, and resuspended to OD600nm of 2.0 with
fresh AMS medium. For the DD4 bioaugmentation microcosms, 0.5 mL of the harvested
cells were inoculated to achieve an initial total protein of 0.17 mg per vial. For the mixed
inoculum, the seeding mixture was composed of DD4, CB1190, PH-06 with the biomass
ratio of 2:1:1. Propane (0.15 % v/v) was amended to all active treatments to supplement
carbon and energy. Microcosms were incubated at room temperature (i.e., 24±3 °C) while
being shaken at 150 rpm. At selected intervals, liquid and headspace samples were
collected for the analysis of dioxane and propane, respectively. Propane was re-amended
once when over 95% of the initial propane was consumed.
5.2.3 Quantitative Polymerase Chain Reaction (qPCR)
Total DNA from the original field samples and samples collected after the completion of
all microcosm treatments was extracted using the PowerSoil® DNA Isolation Kit (Qiagen,
Hilden, Germany) following the manufacturer’s instruction. The amount of the toluene
monooxygenase gene (tmoA) in DD4, the propane monooxygenase gene (prmA) in PH-06,
and the tetrahydrofuran monooxygenase gene (thmA) in CB1190 were quantified by qPCR
using designed probe/primers specifically targeting their α subunit components (Table 5.3).
A set of generic 16S rRNA primers (341F and 534R) was used to enumerate the total
biomass245. Each qPCR reaction (20 μL) consisted of 0.1 μL of paired primers (10 µmol/L),
1 μL of 5 ng/μL of the DNA extract, and 10 μL of Power SYBR® Green or TaqMan®

92
Mastermix (Thermo, Carlsbad, CA). qPCR was run with the Quant Studio3 (Thermo,
Carlsbad, CA) following the temperature program: initially held at 10 min for 95 °C,
followed by 40 cycles of 15 s at 95 °C and 1 min at 60 °C. The relative abundance of each
inoculated strain was calculated as the percentage ratio of the specific dioxane degrading
gene number to the total cell number, which is equivalent to the 16S rRNA gene number
divided by 4.2 (i.e., average 16S rRNA gene copies per bacterial cell)246.
Table 5.3 Sequences of Primers and Probes used for qPCR
Target
Gene
Primer
Name Sequence (5’-3’) Reference
16S rRNA
341F CCTACGGGAGGCAGCAG 245 534R ATTACCGCGGCTGCTGG
806R GGACTACNNGGGTATCTAAT
tmoA
tmoA_F GGCGGATGGCTGTACTCAACAGAATG
229 tmoA_R AAATCGCCGGAAAGCTTGGGC
tmoA_prob
e
/FAM/CGACCTGGC/ZEN/CAGGAGTACG
AAC/IABkFQ/
prmA
prmA_F ACTGCGATGCTGGTTGAC
35 prmA_R TCAGGTACGCCTCCTGAT
prmA_prob
e
/FAM/TTCCTCGCG/ZEN/CAGATGATCGA
CG/IABkFQ/
thmA
thmA_F CTGTATGGGCATGCTTGT
30 thmA_R CCAGCGATACAGGTTCATC
thmA_prob
e
/FAM/ACGCCTATT/ZEN/ACATCCAGCTC
GA/IABkFQ/
5.2.4 Microbial Community Analysis
16S rRNA amplicon sequencing was employed to unveil the microbial communities in
original and biotreated water samples. Bacterial V3-V4 hypervariable regions of 16S rRNA
were amplified by PCR with the primers 341F (5’-CCTAYGGGRBGCASCAG-3’) and
806R (5’-GGACTACNNGGGTATCTAAT-3’)247 following the standard MetaVx™
library preparation process. PCR products were examined by gel electrophoresis on 2 %

93
agarose gel and recovered using the GeneJETTM Gel Extraction Kit (Thermo, Carlsbad,
CA). A second round PCR was run for limited cycles for the addition of sample-specific
barcodes for multiplexing. Final libraries were pooled together with concentrations
quantified by the Qubit® 2.0 Fluorometer (Thermo, Carlsbad, CA). Paired-end sequencing
(2×250 bp) was performed using Illumina MiSeq (Illumina, San Diego, CA) at GENEWIZ
(South Plainfield, NJ, USA). The raw sequencing data were filtered and analyzed using the
Cutadapt (v1.9.1)248, Vsearch (1.9.6)249, Qiime (1.9.1)250. The sequences after removing
the chimera sequences and > 200 bp in length were clustered when sequences’ similarity
is higher than 97%. Further, representative OTUs were assigned taxonomy based on the >
99% identity using the Ribosomal Database Project (RDP) Classifier251. Hierarchical
clustering was carried out with hclust of stats package in R252. the dendrogram to the left
is the species cluster and the dendrogram at the top of Figure 5.5 shows clusters of
community structures253.
5.2.5 Analytical Approaches
Low concentration (<1000 μg/L) of dioxane was detected by GC/MS by microfrozen
extraction method as described in Section 2.2.10. Propane in headspace was monitored by
GC/FID as described in 2.2.10. Concentrations of co-occurring volatilized organic
compounds (VOCs) in original water samples were measured at an external commercial
lab using the EPA Method 8260C254. This is a standard method for quantifying a wide span
of VOCs in aqueous samples using purge-and-trap gas chromatography/mass spectrometry
(GC/MS).

94
5.3 Results
5.3.1 Dioxane Degradation and Propane Utilization in Microcosms
Dioxane was detected in INF with an initial concentration of 34.3±1.1 µg/L. Due to the
high hydrophilicity of dioxane, it was marginally adsorbed by adsorption units. Dioxane,
thus, yet remains 27.4±0.4 µg/L in the effluent of the GWET facility. Bioaugmentation
with DD4 can effectively reduce trace dioxane contamination in both INF and EFF samples
collected at the GWET facility. In microcosms prepared with the INF sample (Figure 5.3A),
dioxane was degraded to 2.5±0.5 μg/L in 3 days, and subsequently to below the method
detection limit (MDL, i.e., 0.38 μg/L) within 6 days of incubation. Fast dioxane
degradation by DD4 was also observed in the microcosms prepared with the EFF sample
(Figure 5.3B). Dioxane was degraded from 27.4±0.5 μg/L to 0.5±0.1 μg/L within 3 days
of incubation. Eventually, dioxane concentration was then below our MDL on day 6. At
the same time, in both INF-DD4 and EFF-DD4 microcosms, over 300 μL of pure propane
was consumed within 6 days (Figure 5.4A and 5.4B). In the microcosm prepared with
MW1 field water, dioxane was effectively removed from 130.0±3.3 µg/L to below the
MDL within 6 days (Figure 5.3C). Whilst slow dioxane removal was observed in the DD4-
bioaugmentation microcosms prepared with MW2 samples (Figure 5.3D), in which
dioxane was degraded less than 30% of the initial dioxane concentration (83.2±2.3 μg/L)
within 30 days of incubation, leaving a residual concentration of 59.7±2.4 μg/L. The quick
propane depletion was observed in MW1 as in INF and EFF (Figure 5.4). Propane
consumption in MW2 was greatly decelerated in contrast with the other three types of water.
The initially amended propane was not fully consumed until Day 30 (Figure 5.4D).

95
Figure 5.3 Dioxane degradation in microcosms treated with propane, DD4, and
propanotrophic consortium in comparison with the abiotic control. Microcosms were
prepared with varying groundwater samples, including (A) the influent and (B) effluent of
the GWET facility and two monitoring wells (C) MW1 and (D) MW2. Arrows indicate
repeated propane amendments when over 90% of propane was consumed. The colors of
the arrows are corresponding to the treatment as indicated in the legend.

96
Figure 5.4 Propane consumption in microcosms prepared by (A) Influent, (B) Effluent, (C)
MW1, and (D) MW2.
In microcosm degradation assays, the mixed inoculum does not have a significant
difference with the corresponding microcosm bioaugmented with single DD4 inoculum in
four types of field groundwater samples (Figure 5.3). Dioxane in INF-Mix was degraded
from 34.34±1.13 μg/L to 1.59±0.35 μg/L in 6 days and depleted in 9 days; in EFF-Mix
dioxane was degraded from 27.42±0.45 μg/L to 0.85±0.10 μg/L in 3 days and completely
degraded in 6 days; in MW1-Mix dioxane was degraded from 130.04±3.31 μg/L to
11.77±0.91 μg/L in 3 days and disappeared in 6 days; in MW2-Mix dioxane remained
59.20±1.87 μg/L after 30-days incubation. Propane consumption in mixed inoculum
treatment is similar to the single DD4 treatment in all four types of water (Figure 5.4).

97
Interestingly, in the treatment prepared with INF water samples, without the
amendment of exogenous cultures, significant dioxane removal was observed in
comparison with the abiotic control. On day 30, dioxane concentration dropped from
34.34±1.13 μg/L to 6.3 ± 0.6 μg/L in the INF-propane treatment, while it remained as high
as 27.0 ± 0.6 μg/L in INF-control microcosms (Figure 5.3A). At the same time, propane
trends to degrade after 9 days in four types of water, particularly in INF-Propane sample.
Over 300 μL of pure propane was consumed (Figure 5.4A) in INF-Propane. Within 30 days,
propane was degraded from 3.5±0.0 mg/L to 2.4±0.6 mg/L, 1.7±0.9 mg/L, 2.71±0.7 in
EFF-Propane, MW1-Propane, and MW2-Propane, respectively. However, dioxane
degradation has not been observed yet within 30 days.
5.3.2 Community Structure Analysis by 16S rRNA Sequencing
Community structure analysis shows that Azoarcus is the most abundant genus in DD4 and
mixed culture inoculum prepared with INF, EFF, and MW1 (Figure 5.5). Based on the
sequences similarity, the representative OTU accommodated in Azoarcus genus (i.e., OTU
1) share nearly 100% identity to Azoarcus sp. DD4. Thus, according to the 16S rRNA
sequencing results, DD4 exhibits as the most abundant strains accounting for 39.6%, 38.3%,
51.4%, 52.4%, 32.9%, 34.9% in INF-DD4, INF-Mix, EFF-DD4, EFF-Mix, MW1-DD4,
MW1-Mix (Table 5.4) which agree with the high dioxane degradation in these treatments.
DD4 is relatively low in treatment prepared with MW2 with DD4 (3.7%) and mixed culture
(3.1%) comparing with the other three types of water. However, it still arises as one of the
most abundant ten genera in MW2-DD4 and MW2-Mix.

Table 5.4 The Relative Abundances of the Top 10 Most Abundant Genera in Various Field Samples (Continued)
in situ field sample
INF
Taxonomy INF Taxonomy INF-Propane Taxonomy INF-DD4 Taxonomy INF-Mix
Novosphingobium 22.6% Rhizobacter 32.6% Azoarcus 39.6% Azoarcus 38.3%
Nitrosomonas 9.2% Sulfuritalea 17.9% Rhodococcus 9.7% Pseudoxanthomonas 4.5%
Bradyrhizobium 5.2% unidentified_Hyphomonadaceae 4.1% unidentified_Hyphomonadaceae 4.8% Rhodococcus 4.1%
Sphingobium 2.8% Coxiella 3.7% Pseudoxanthomonas 3.6% Legionella 3.5%
Maritimimonas 2.7% Reyranella 2.9% Hirschia 1.9% unidentified_Hyphomonadaceae 3.3%
Methylotenera 2.3% Hirschia 1.9% Bryobacter 1.1% Hirschia 2.8%
Sulfuritalea 2.0% Sediminibacterium 1.1% Legionella 1.0% Coxiella 1.8%
Sediminibacterium 1.6% Legionella 1.0% Reyranella 1.0% Reyranella 1.1%
Parablastomonas 1.1% Bryobacter 1.0% Nordella 0.6% Sediminibacterium 0.6%
Legionella 0.8% Hyphomicrobium 0.8% unidentified_Alphaproteobacteria 0.5% Bradyrhizobium 0.5%
Others 50.7% Others 33.6% Others 36.7% Others 40.0%
EFF
Taxonomy EFF Taxonomy EFF-Propane Taxonomy EFF-DD4 Taxonomy EFF-Mix
Polaromonas 33.3% Azoarcus 51.4% Azoarcus 52.4%
Limnobacter 21.6% Zoogloea 17.7% Zoogloea 5.5%
Hyphomicrobium 10.1% Pseudoxanthomonas 4.2% Pseudoxanthomonas 4.0%
Sediminibacterium 7.1% Terrimonas 2.6% Ferribacterium 2.1%
Ferribacterium 2.2% Ferribacterium 1.9% Flavobacterium 2.1%
Limnohabitans 2.1% Cupriavidus 1.7% Bradyrhizobium 1.8%
Reyranella 1.7% unidentified_Nitrospiraceae 1.4% Terrimonas 1.3%
98

Table 5.4 The Relative Abundances of the Top 10 Most Abundant Genera in Various Field Samples (Continued)
in situ field sample
EFF
Taxonomy EFF Taxonomy EFF-Propane Taxonomy EFF-DD4 Taxonomy EFF-Mix
Curvibacter 1.1% Flavobacterium 1.4% unidentified_Nitrospiraceae 1.3%
Zoogloea 0.3% Terrimicrobium 0.9% Cupriavidus 1.1%
Brevundimonas 0.3% Brevundimonas 0.8% Sediminibacterium 1.1%
Others 20.4% Others 16.9% Others 28.4%
ex situ field sample
MW1
Taxonomy MW1 Taxonomy MW1-Propane Taxonomy MW1-DD4 Taxonomy MW1-Mix
Amphiplicatus 11.2% Hyphomicrobium 8.8% Azoarcus 32.9% Azoarcus 34.9%
unidentified_Gammaproteobacteria 4.0% Sulfuritalea 8.8% Nitrosomonas 2.8% unidentified_Cyanobacteria 2.9%
unidentified_Acidimicrobiia 3.3% Amphiplicatus 7.7% unidentified_Cyanobacteria 2.4% Amphiplicatus 2.5%
unidentified_Nitrospiraceae 3.2% Mycobacterium 7.3% Amphiplicatus 1.8% Rhodococcus 2.3%
Nitrosomonas 2.7% unidentified_Acidimicrobiia 3.7% Rhodococcus 1.7% Pseudoxanthomonas 1.9%
Hydrogenophaga 2.3% Pseudomonas 3.0% Cupriavidus 1.7% Bryobacter 1.5%
Bryobacter 1.4% Limnobacter 2.9% Bryobacter 1.6% unidentified_Acidobacteria 1.2%
Sulfuritalea 1.3% Reyranella 2.6% Pseudoxanthomonas 1.3% Reyranella 0.7%
Reyranella 1.2% unidentified_Gammaproteobacteria 1.9% unidentified_Acidobacteria 1.2% unidentified_Acidimicrobiia 0.6%
Hyphomicrobium 1.0% Hydrogenophaga 1.3% unidentified_Alphaproteobacteria 0.8% Nitrosomonas 0.6%
Others 69.4% Others 53.3% Others 52.8% Others 51.4%
99

Table 5.4 The Relative Abundances of the Top 10 Most Abundant Genera in Various Field Samples (Continued)
ex situ field sample
MW2
Taxonomy MW2 Taxonomy MW2-Propane Taxonomy MW2-DD4 Taxonomy MW2-Mix
unidentified_Nitrospiraceae 5.1% Caulobacter 11.6% Rhodococcus 13.6% Rhodococcus 13.2%
unidentified_Hyphomonadaceae 4.6% Azotobacter 11.5% Cupriavidus 5.0% Azotobacter 6.9%
Reyranella 4.6% Legionella 7.1% Pseudoxanthomonas 3.7% Legionella 4.6%
Acetobacterium 2.1% Sediminibacterium 3.9% Azoarcus 3.7% unidentified_Hyphomonadaceae 3.7%
Bradyrhizobium 2.0% Haliscomenobacter 3.1% Terrimicrobium 3.0% Hirschia 3.7%
Paludibaculum 1.3% Roseimicrobium 3.1% Hirschia 2.1% Azoarcus 3.1%
Legionella 1.3% Reyranella 3.0% Haliscomenobacter 2.0% unidentified_Gemmatimonadaceae 2.8%
Haliscomenobacter 0.9% unidentified_Hyphomonadaceae 2.9% Sphingopyxis 2.0% Pseudoxanthomonas 2.7%
unidentified_Gammaproteobacteria 0.8% Lacunisphaera 2.8% Reyranella 1.6% Cupriavidus 1.5%
Polynucleobacter 0.8% Terrimonas 1.9% Azotobacter 1.5% Pajaroellobacter 1.4%
Others 77.3% Others 50.9% Others 63.3% Others 57.9%
The total DNA extracted from EFF sample was insufficient for sequencing.
100

101
Figure 5.5 Dendrogram depicting the microbial community distribution at the genus level.
The columns represent groundwater microcosm treatments and the rows represent genera.
Color in the heat map is scaled in accordance with the relative sequence abundance of a
specific genus. Treatments that showed complete dioxane removal are highlighted in blue.
Treatments with no observable dioxane degradation are highlighted in red. Dioxane in INF-
propane (marked in green) was partially degraded by indigenous microorganisms.
Interestingly, Pesudocardia genus is absent in all treatments indicating the
vanishing of CB1190. While a potential propane and dioxane degrading genus,
Rhodococcus, was co-occurring with Azoarcus in the most abundant 10 genera in
treatments prepared with INF, MW1, and MW2 groundwater when augmented DD4 or
mixed culture, particularly in MW2. However, Rhodococcus was barely detected in the
original water samples from INF and MW1, as well as the treatments with propane
amendment. Two OTUs (i.e., OTU 5 and 187) accommodated in Rhodococcus were
102
classified into two sub-branch (Figure 5.6). OTU 187 is phylogenetically close to a dioxane
degrader Rhodococcus aetherivorans 10bc312 (10bc312=JCM 14343=DSMZ 44752)255
and a propane-utilizing bacteria Rhodococcus aetherivorans TPA256. It should be
emphasized that OTU 187 tends to correlate with prmA (Figure 5.6). However, it only
occupied 0.05%, 0.02%, and 0.77% of the total microbial communities in INF-Mix, EFF-
Mix, and MW1-Mix. While the other representative OTU (i.e., OTU 5) is abundant in INF-
DD4 (9.7%), INF-Mix (4.0%), MW1-DD4 (1.7%), MW1-Mix (1.5%), MW2-DD4
(13.6%), and MW2-Mix (13.2%). It was also detected in EFF-DD4 (0.5%), EFF-Mix
(0.1%), MW1 (0.2%), and MW1-Propane (0.1%). Both representative OTUs appeared not
related to dioxane degradation, but significantly correlated with OTU 1 which represents
DD4.
Another potential propane and dioxane degrading genus, Mycobacterium, accounts
for 0.5% of total biomass in both INF and MW1. It was detected at the range of 0.1% to
0.3% in the control and biological treatments prepared with INF. To be noted, the
abundance of Mycobacterium is high in MW1-Propane, which occupied 7.3% of the total
community. The representative taxa, OTU 52, shares 97.3% sequence identity with PH-06,
and has 100% similarity with a smmo containing strain NBB3106, 257 and 99.1% with a
dioxane degrading strain JOB5258-260 indicating it likely to be a propanotrophic
Mycobacterium (Figure 5.6).

103
Figure 5.6 Neighbor-joining phylogenetic trees including representative OTUs annotated
as Mycobacterium (shaded by blue), Rhodococcus (shaded by green), and Azoarcus
(shaded by red), and some known propanotrophs. Phylogeny is calculated in accordance
with the V3-V4 region of 16S rRNA sequences. E. coli DH5a and some known
propanotrophic strains are included as references. The numbers in the right table indicate
the occurrence frequency of representative OTUs in four types of water. The first column
indicates the occurrences in original water (maximum is 3 because of the missing EFF
sample), the second column represents the occurrences after propane inducement. The last
two columns indicate the treatments with DD4 and mixed culture augmentations.
5.3.3 TmoA, PrmA, and ThmA Abundances in Microcosms by qPCR Analysis
According to the qPCR analysis, it is plausible to see tmoA is found neither in original
water samples (i.e., INF, MW1, and MW2) nor propane amended treatments (i.e., INF-
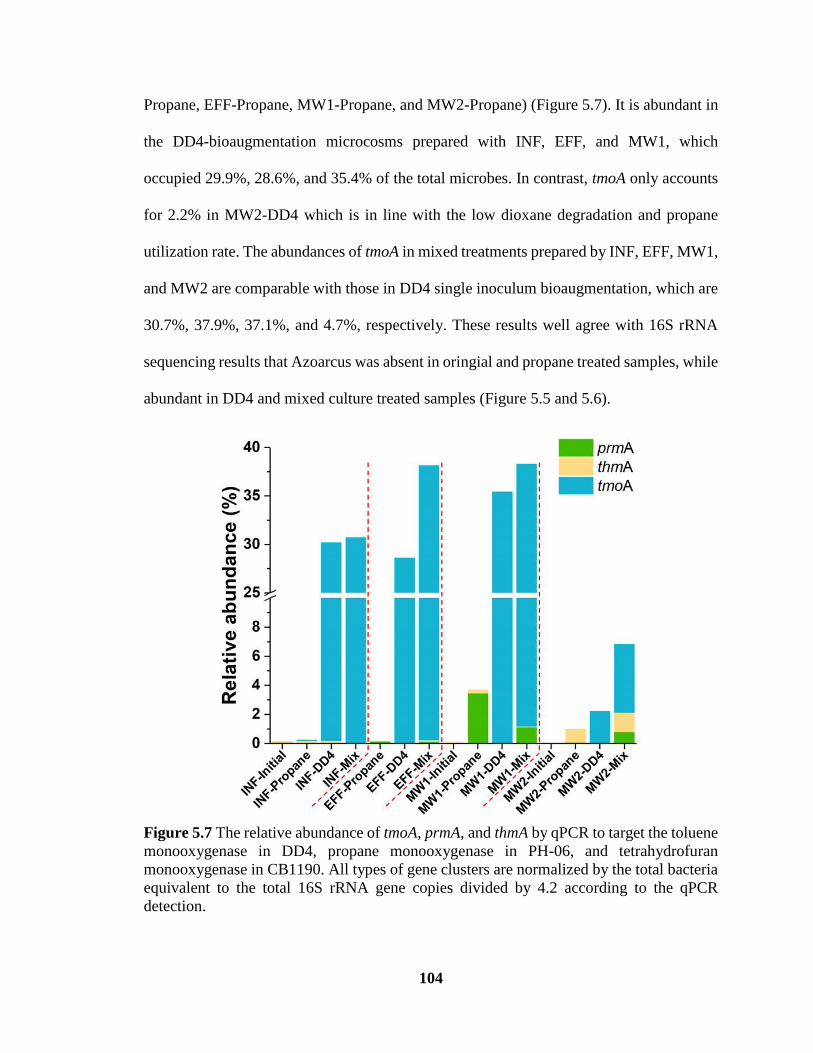
104
Propane, EFF-Propane, MW1-Propane, and MW2-Propane) (Figure 5.7). It is abundant in
the DD4-bioaugmentation microcosms prepared with INF, EFF, and MW1, which
occupied 29.9%, 28.6%, and 35.4% of the total microbes. In contrast, tmoA only accounts
for 2.2% in MW2-DD4 which is in line with the low dioxane degradation and propane
utilization rate. The abundances of tmoA in mixed treatments prepared by INF, EFF, MW1,
and MW2 are comparable with those in DD4 single inoculum bioaugmentation, which are
30.7%, 37.9%, 37.1%, and 4.7%, respectively. These results well agree with 16S rRNA
sequencing results that Azoarcus was absent in oringial and propane treated samples, while
abundant in DD4 and mixed culture treated samples (Figure 5.5 and 5.6).
Figure 5.7 The relative abundance of tmoA, prmA, and thmA by qPCR to target the toluene
monooxygenase in DD4, propane monooxygenase in PH-06, and tetrahydrofuran
monooxygenase in CB1190. All types of gene clusters are normalized by the total bacteria
equivalent to the total 16S rRNA gene copies divided by 4.2 according to the qPCR
detection.

105
The gene clusters of prm and thm were detected by qPCR with specific
probe/primers targeting the α oxygenase which is unique and conserved to each gene
cluster 96. The experiment was designed for evaluating the abundance of PH-06, CB1190
in the mixed culture treatments. However, the genes were surprisingly found not only in
mixed treatments, indicating the wide presence of these genes in the environment. prmA
was absent in most natural water samples except in INF (0.1%). With propane amendment,
prmA was detectable in EFF-Propane (0.1%), MW1-Propane (3.5%), and MW2-Propane
(0.1%). However, prmA was not detected in the treatments with single DD4 bioaugment
because DD4 became the dominant and occupied most of the communities. In the
treatments amended with mixed cutlture, the abundance of prmA is surprisingly low
comparing with the initial inoculation ratio to DD4 (i.e., DD4:PH-06 was 2:1), it is
undetectable in INF-Mix, 0.1% in EFF-Mix, 1.1% in MW1-Mix, and 0.8% in MW2-Mix,
this may also result from the competition from DD4.
thmA was only barely detected in the microcosm prepared with INF (0.03%) and
MW1 (0.05%) suggesting the abundance of thm gene cluster is low in natural water without
enrichment. With propane amendment, thmA abundances elevated to 0.2%, 0.2%, and 0.9%
in INF-Propane, MW1-Propane, and MW2-Propane. Like prmA, the thmA abundances in
the treatments with DD4 augmentation are relatively low: 0.2% in INF-DD4, 0.1% in
MW2-DD4, it was undetected in EFF-DD4 and MW1-DD4. The abundances of thmA in
the microcosms treated with mixed culture are not high either, it is absent in INF-Mix, 0.1%
in EFF-Mix, 0.1% in MW1-Mix, and 1.3% in MW2-Mix.

106
5.4 Discussion
5.4.1. Azoarcus sp. DD4 Bioaugmentation Is Effective for Dioxane Removal at ex situ
and in situ Superfund Site Samples
Results show that dioxane was completely degraded within 6 days in the microcosms
prepared with INF, EFF, and MW1 when amended with DD4 and propane. It reveals that
DD4 could exert its degradation capability in ex situ field samples (i.e., INF and EFF) as
well as some specific in situ field samples (i.e., MW1), depending on the adaptability to
chemical composition and indigenous bacterial community79. The field characterization
shows the presence of VOCs and metals (Table 5.1). To be noted that some VOCs exceed
the standard such as trichlorethlyene and vinyl chloride, it is nevertheless at μg/L level.
Although VOCs are reported as important inhibitors for dioxane degradation38, 62, 65, due to
the low concentrations, they may finitely contribute to incomplete degradation in MW2.
Some metals such as aluminum, iron and other uncharacterized chemicals existing in MW2
likely involve in inhibition of dioxane-degrading bacteria such as DD4. Furthermore, the
community diversity indicated by Shannon Index shows MW2 initially has the highest
value (6.00) among all the samples. It decreases to 5.55 after DD4 augmentation indicating
bacterial diversity slightly decreased but communities remain highly diverse in comparison
with other type of water (Table 5.5). On the contrary, EFF water exhibits the lowest
diversity of bacterial community, which is 3.50 for EFF-DD4 suggesting the simplest
bacterial community. A similar trend is observed by Simpson Index. There is a consensus
that microbial diversity is directly related to ecosystem stability, the high diversity
promotes community stability and functional resilience with external perturbation261. Thus,
the exogenous inoculum DD4 is easy to grow in the water has low diversity (i.e., EFF) than

107
the high diversity (i.e., MW2). Further, the simple community structure in EFF enabled
DD4 becoming the most predominant strain.
Table 5.5 The Community Diversity Analysis Including Shannon and Simpson Index
Sample Shannon Simpson
INF 4.81 0.93
INF-Propane 4.13 0.86
INF-DD4 4.17 0.85
INF-Mix 4.53 0.87
EFF-Propane 3.37 0.82
EFF-DD4 3.50 0.76
EFF-Mix 3.79 0.78
MW1 5.72 0.96
MW1-Propane 5.69 0.96
MW1-DD4 4.84 0.90
MW1-Mix 4.83 0.89
MW2 6.00 0.97
MW2-Propane 5.77 0.96
MW2-DD4 5.55 0.95
MW2-Mix 5.49 0.95
16S rRNA sequencing and qPCR analysis independently verified that DD4 is
abundant strain after the inoculation. These results well support the dioxane degradation
observed in the microcosms, confirming the significant role of DD4 in dioxane
biodegradation. It also suggests the adaptability and compatibility of DD4 in these dioxane-
impacted water samples. Therefore, single DD4 culture would be effective in treating
dioxane in either influent or effluent samples as an addendum to the GAC adsorption
system being operated at the site. This straightforward additional strategy renders pump-
and-treat technologies economically feasible at many sites for VOCs and dioxane
remediation. In addition, DD4 bioaugmentation with propane supplying could degrade the

108
low concentration of dioxane at some specific in situ sites. However, due to the specificity
and complexity of in situ conditions, feasibility tests are needed for different cases.
5.4.2 Exogenous Metabolizers Vanished but Dioxane-Degrading Gene Clusters
Retained in the Communities
With the addition of other two dioxane metabolizers (i.e., PH-06 and CB1190), dioxane
degradation did not significantly improve indicating the exogenous metabolizers barely
attribute to the degradation. From the genus level, the treatments with or without exegous
metabolizers have at least 6 out of 10 are the same genera (bolded in Table 5.4) suggesting
the addition of metabolizers has minor change to the main frame of bacterial communities.
The similar community structure in two biological treatments (bioaugmentated with DD4
or mixed culture) also embodies in the close cluster distance in Figure 5.8 and Figure 5.5
by the community similarity analysis. DD4 in both treatments appear as the dominant strain
owning a comparable abundance. This scenario suggests that DD4 outcompeted these two
exogenous dioxane metabolizers. A primary reason is because of DD4 as a co-metabolizer
exhibits a faster growth rate (1.95±0.01 day–1) on propane37 than CB1190 (0.74±0.06 day–
1) on dioxane69. The growth rate of PH-06 on dioxane is estimated at approximately 0.35
day-1 from its growth curve58, which is comparable with CB1190 (0.74±0.06 day–1)
meanwhile lower than DD4 growth rate (1.95±0.01 day–1). Such limit growth rate of
metabolizers scants contribution to dioxane degradation when together with co-
metabolizer, DD4. There are also some hindrances of metabolic dioxane degraders with
their applications. Due to the insufficient energy source in groundwater, propane supposes
to be supplied as an auxiliary substrate for dioxane degraders. However, propane is
preferentially utilized over dioxane in metabolic strains69.

109
Figure 5.8 The principal coordinates analysis (PCoA) biplot shows weighted-UniFrac
based on distances quantitative (i.e., phylogeny) measures of microbial community. PC1,
PC2, represent the first and second principal components, respectively. The percentage
represents the contribution rate of this component to sample difference. The distance
between samples indicates the similarity of the distribution of functional classifications in
the sample. The closer the distance, the higher similarity. INF (yellow), EFF (green), MW1
(blue), and MW2 (red).
Since the possible propanotrophic Mycobacterium, OTU 52, was frequently
detected in original, and propane induced treatments, it suggests that OTU 52 widely exists
in natural environment and it could induce by propane especially in MW1-Propane (7.3%).
Like 16S rRNA sequencing, qPCR results found the highest abundance of prm gene
presented in MW1-Propane achieved as high as 3.5% of total community. This suggests
that the representative OTU 52 is more likely to be an indigenous strain contining prm gene

110
cluster rather than the exogenous PH-06. Considering that Pesudocardia is absent in all
samples according to16S rRNA results, PH-06 and CB1190 likely vanished at the end of
incubation. However, it is interesting to be noted that the detectable prmA and thmA in
mixed inoculum treatments (EFF-Mix, MW1-Mix, particularly MW2-Mix) suggesting
these gene clusters retained in the communities. Given the important role of the plasmid in
HGT, prmA and thmA located on plasmids131, 262 likely transfer among the phylogenetically
close relatives in Actinomycetes96, 263. OTU 187 is unique to mixed culture augmented
treatments indicating it related with the inoculation of PH-06 and CB1190. It exhibits high
similarity with Rhodococcus aetherivorans 10bc312 which was isolated as a methyl tert-
butyl ether degrading strain264. Previous reports have been confirmed that this strain can
use dioxane as sole carbon source, although it appeared not to be an effective dioxane
degrader considering the low degradation rate (0.0073 mg-dioxane/mg-protein/h) and
affinity (59.2 mg/L). R. aetherivorans TPA is a propane-utilizing bacteria256 and R. RR1 is
a potential propanotroph because it harbors a propane monooxygenase homologous to
group 5 propane monooxygenase265. Although OTU 5’s phylogeny is relative distinct from
propanotrophic Rhodococcus, it is highly abundant in all mixed culture treatments. Thus,
OTU 5 and OTU 187 are likely to be potential catabolic gene recipients.
5.4.3 The Indigenous Propanotrophic Mycobacterium may Participate in Propane
Utilization
Propane tended to degrade after 9 days in all propane amending treatments indicating the
extensive existence of propanotrophs which in agreement with previous reports32, 70, 73.
However, no significant dioxane removal was observed in the propane fed treatment or
abiotic control prepared by EFF, MW1, and MW2 within the 30-days incubation period
except 82% of dioxane degraded in INF-Propane. Correspondingly, 16S rRNA results in

111
Figure 5.5 suggest that INF-Propane (printed in green) has a distinct microbial community
structure that diverges from the well-treated subgroup (printed in blue) and the poorly
treated subgroup (printed in red). Thus, INF-Propane posseses a unique indigenous
bacterial community associating with propane utilization and dioxane degradation. The
most abundant 10 genera in INF-Propane are Rhizobacter (32.6%), Sulfuritalea (17.9%),
unidentified Hyphomonadaceae (4.1%), Coxiella (3.7%), Reyranella (2.9%), Hirschia
(1.9%), Sediminibacterium (1.1%), Legionella (1.0%), Bryobacter (1.0%), and
Hyphomicrobium (0.8%). However, to our best knowledge, no relevant research reported
their degradation capacities related to dioxane or propane.
Although dioxane degradation was not observed in MW1-Propane, 52% of propane
in has been removed from day 9 to day 30. It suggests that indigenous strain may first
utilize the relatively high organic carbon (12000 μg/L) in MW1-Propane. After 9 days,
propane provided energy to expand the abundance of OTU 52. The co-occurring high
abundances of OTU 52 and prm gene in MW1-Propane suggest this strain may contain a
group 6 SDIMO, which is a group of enzyme could initiate dioxane degradation and
propane utilization. Due to the preference of propanotrophic dioxane-degrading strains,
propane more likely to be used over dioxane28, 69, dioxane degradation could be observed
if elongate the incubation time. Together with the phylogeny analysis, OTU 52 may involve
in propane and dioxane degradation in propane induced treatment. We intend to continue
the enrichment and make efforts to identify and isolate the indigenous dioxane degrading
propanotroph(s), which may be well suited for both in situ and ex situ treatments at this
site. However, the indigenous propanotroph(s) do not have obvious varies to the
degradation pattern and propane consumption comparing with other treatments.
112
The microcosm assay shows the Rhodococcus strain, OTU 5, existed in propane
amended treatments (i.e., MW1-Propane). According to the sequences, OTU 5 has over
99% identity in comparison with a polychlorinated biphenyls (PCBs) degrading species
Rhodococcus sp. YAZ54266 and a hexahydro-1,3,5-trinitro-1,3,5-triazine (RDX) degrading
species Rhodococcus sp. BL1267. The phylogenetic tree exhibits this OUT is relatively
away from the known propanotrophic Rhodococcus (Figure 5.6). However, it was enriched
in the treatments with DD4 and mixed culture augmented suggesting this Rhodococcus
may containing alcohol dehydrogenases268, 269, which could be stimulated by the
metabolites of propane. To our best knowledge, the other abundant OTUs in various genera
such as Pseudoxanthomonas, Legionella, and Zoogloea may have minor participation in
propane and dioxane oxidization, although Pseudoxanthomonas was found as the abundant
genus in all the DD4 and mixed treatments.
5.4.4. TmoA Is a Suitable Biomarker for the Rapid Assessment of DD4
Bioaugmentation Performance
In light of the correlation analysis in Figure 5.9, the molecular experiments are potent
evidence revealing the relation between DD4 and degradation capacity. The abundance of
Azoarcus is significantly correlated to the abundance of tmoA according to Spearman’s
coefficient270, which is 0.90. Their relative abundances are nearly fit a curve with the slope
of 0.75, and intersection of 0.01. The absolute copy number of Azoarcus and tmoA also
significantly correlated with the dioxane degradation rate, which are 0.81 and 0.85. It
indicates that the tmoA probe/primers specifically target to tmo gene cluster and can
accurately reflect the abundance of Azoarucs in the environmental samples. Also, the gene
cluster tmo primarily attributes to dioxane degradation as observed in the present

113
experiment. The probe/primers of tmoA, therefore, is an excellent biomarker for indicating
the abundance of Azoarcus and assess the performance of DD4 bioaugmentation.
Figure 5.9 Positive linear correlations between (A) dioxane degradation rate (μ/L/day) and
absolute copy number of Azoarcus (copy/sample), (B) dioxane degradation rate (μ/L/day)
and absolute copy number of tmoA (copy/sample), and (C) relative abundance of tmoA (%)
and relative abundance of Azoarcus (%). The Spearman’s R indicates the correlation of
two values.
5.5 Conclusions
Considering the low dioxane concentration at the contaminated plume and treated waters
(<100 µg/L), the co-metabolizer, Azoarcus sp. DD4 is a potent candidate for dioxane
cleanups at in situ or ex situ Superfund site samples. Results show that DD4 efficiently

114
removed the low concentration of dioxane at a relatively short incubation time (6-9 days)
except the groundwater near the source zone due to the complicated chemical and
biological compositions. DD4 became the most dominant strain in these microcosms with
a relatively high abundance of around 28-52% in light of qPCR and 16S rRNA sequencing
analysis. DD4 also exhibits its potent competitive capability to the artificially induced
dioxane metabolizers, PH-06 and CB1190. Interestingly, the gene cluster from these two
metabolizers have been retained in the communities through HGT. According to the
molecular results, two Rhodococcus OTU may involve in revieving catabolic genes. An
indigenous propanotrophic Mycobacteri OTU 52 was confirmed that related with propan
utilization and dioxane degradation. The significant correlation between the dioxane-
degrading gene cluster in DD4 and dioxane degradation rate indicates tmoA is a suitable
biomarker to evaluate the DD4 bioaugmentation in the future application.

115
CHAPTER 6
SEQUENTIAL ANAEROBIC AND AEROBIC BIOREMEDIATION OF THE
COMMINGLED GROUNDWATER CONTAMINATION OF
TRICHLOROETHENE AND 1,4-DIOXANE
6.1 Introduction
As introduced in Chapter 1, the co-occurrences of chlorinated solvents and dioxane were
widely detected over US. The current research underscoring an efficient removal of TCE
through applications of reductive dehalogenating consortia such as SDC-9 and KB-1 under
anaerobic condition271. However, two issues have been frequently reported at sites where
anaerobic bioremediation is implemented, underscoring the need for effective solutions.
First, once TCE is reduced, dehalogenation of cDCE and VC occurs in a slower pace in the
field, conducive to the accumulation of these toxic degradation byproducts141, 272-274.
Though the use of bioaugmentation with halorespiring cultures helps to mitigate daughter
product generation at many sites, there are often lingering daughter products. This possibly
pertains to the lack of bacteria that are efficient in reducing cDCE or VC to ethene275,
insufficiency of electron donors (e.g., hydrogen)276, 277, slow kinetic restricted by low
concentrations of these intermediate compounds278, and/or competition with indigenous
bacteria for electron acceptors (e.g., sulfate and iron (III))279, 280. The other concern is the
concurrence of trace levels (typically <1 mg/L) 1,4-dioxane (dioxane), an anthropogenic
cyclic ether used for stabilizing chlorinated solvents4, 8. Co-contamination of TCE and
dioxane has been reported across the US and globally8, 281. Anderson et al.4 unveiled that
93.5% (730 out of 781) of TCE-impacted sites was positively detected dioxane, and 1,1,1-
trichloroethane (TCA) co-exist in 29.3% (229 out of 781) of the dioxane-contaminated
wells based on the monitoring data from over 4196 United States Air Force (USAF) sites.

116
Similarly, Adamson et al.8 investigated > 2000 sites in California. Among the 605 sites
with positive detection of dioxane, 94% had TCE/TCA contamination. Though many
Actinomycetes, such as Pseudonocardia dioxanivorans CB119092 and Mycobacterium sp.
PH-0658, have been identified for their capability of metabolizing dioxane as the sole
carbon and energy source, their viability and activity are much restricted by the low
concentrations of dioxane prevailing in the field69, 282. Further, the presence of cVOCs can
negatively affect the performance of aerobic dioxane degradation given their potency to
inhibit key catalytic enzymes (e.g., soluble di-iron monooxygenases [SDIMOs])65, 283 and
trigger universal cellular stress67. Therefore, elimination of co-occurring cVOCs,
especially TCE, can be a prerequisite to achieving an efficient biotreatment of dioxane.
In present study, we design and demonstrate a sequential treatment strategy (Figure
6.1) that can effectively reduce TCE first by SDC-9 under anaerobic condition and then
oxidize dioxane and other hazardous cVOCs by Azoarcus sp. DD437 under aerobic
condition. Polasko et al. reported a consortium mixed with KB-1 and CB1190 can degrade
TCE and dioxane (at ~3.5 mg/L) in tandem with no accumulation of cDCE284. Unlike this
previous work, our treatment train is technologically distinctive, because (1) DD4 is
employed as a co-metabolic dioxane degrader that is efficient to remove dioxane at low
concentrations (e.g., <1 mg/L) relevant for many contaminated sites, (2) DD4 is inoculated
after the completion of the initial anaerobic treatment, in which microcosms are air sparged
without exposing DD4 to undesirable anaerobic conditions, and (3) DD4 exhibits superior
physiological properties suited for in situ applications (e.g., fast planktonic growth and
compatibility with aquifer environments)37 and expresses a diversity of SDIMOs that can
degrade cVOCs and other co-existing contaminants185, 229. The abundances of key

117
degraders are monitored using 16S rRNA gene amplicon sequencing and quantitative
polymerase chain reaction (qPCR). Collectively, our bioremediation treatment train
combining reductive dehalogenation and co-metabolic oxidation has broad application
potentials for the cleanup of many sites where TCE and trace concentrations of dioxane
co-occur without the concern of accumulating undesirable biotransformation byproducts.
6.2 Materials and Methods
6.2.1 Chemicals and Cultures
The neat TCE (> 99.5%), cDCE (> 99.5%), and dioxane (> 99.8%), as well as VC (2000
μg/mL in methanol), were purchased from Sigma-Aldrich (St. Louis, MO). Propane
(>99.5%) was provided by Airgas (Radnor, PA). Slow release substrate (SRS) emulsified
vegetable oil (EVO) and SDC-9 bioaugmentation culture commercially marketed as TSI
DCTM were supplied from Terra Systems Inc. (TSI, Claymont, DE). The culture has been
maintained on sodium lactate and PCE in reduced anaerobic mineral medium (RAMM)285.
Azoarcus sp. DD4 was isolated by our lab from an activated sludge sample from a local
wastewater treatment plant in Northern New Jersey37. DD4 was grown in nitrate mineral
salts (NMS) medium37 supplemented with propane (0.10 % v/v equivalents to 2 mg/L in
headspace) to stimulate dioxane degradation activity.
6.2.2 Anaerobic Microcosm Assays
Groundwater and rock core samples were collected from a site located in central New
Jersey in April 2017. This site was operated by a gas company and has been historically
impacted by TCE contamination in a deep bedrock aquifer up to 61 m below the ground
surface (BGS). Approximately 20 L of groundwater was collected in compliance with the
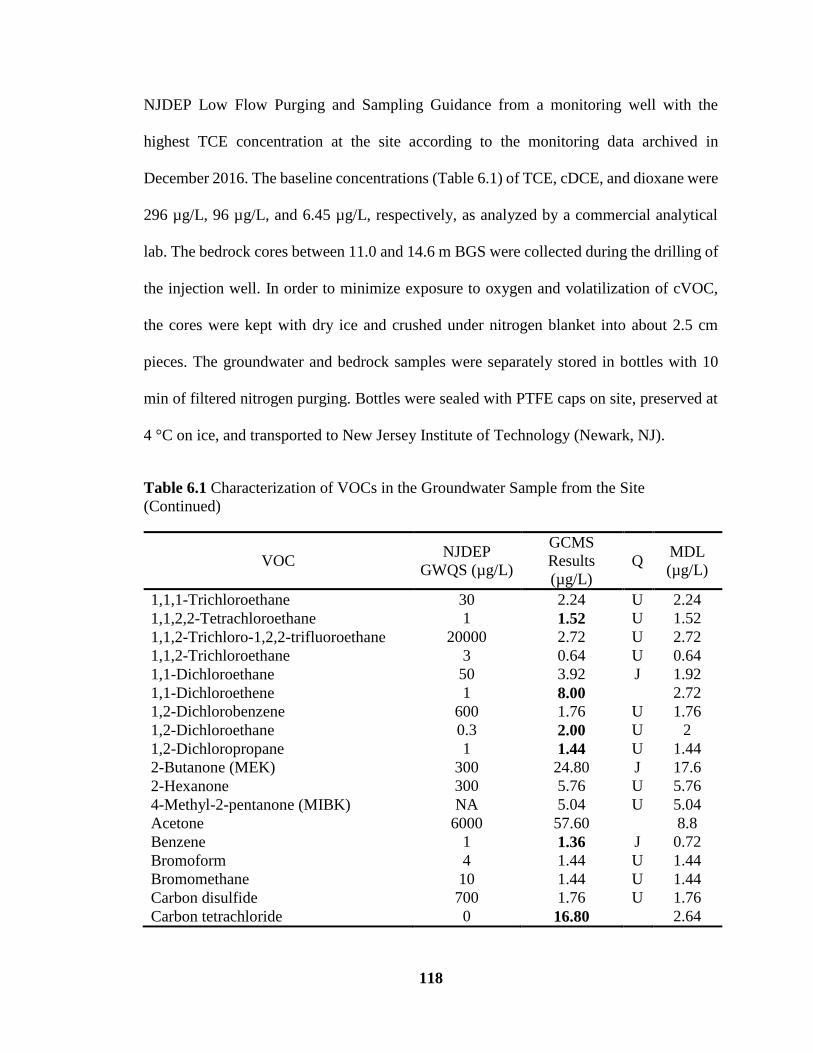
118
NJDEP Low Flow Purging and Sampling Guidance from a monitoring well with the
highest TCE concentration at the site according to the monitoring data archived in
December 2016. The baseline concentrations (Table 6.1) of TCE, cDCE, and dioxane were
296 µg/L, 96 µg/L, and 6.45 µg/L, respectively, as analyzed by a commercial analytical
lab. The bedrock cores between 11.0 and 14.6 m BGS were collected during the drilling of
the injection well. In order to minimize exposure to oxygen and volatilization of cVOC,
the cores were kept with dry ice and crushed under nitrogen blanket into about 2.5 cm
pieces. The groundwater and bedrock samples were separately stored in bottles with 10
min of filtered nitrogen purging. Bottles were sealed with PTFE caps on site, preserved at
4 °C on ice, and transported to New Jersey Institute of Technology (Newark, NJ).
Table 6.1 Characterization of VOCs in the Groundwater Sample from the Site
(Continued)
VOC NJDEP
GWQS (µg/L)
GCMS
Results
(µg/L)
Q MDL
(µg/L)
1,1,1-Trichloroethane 30 2.24 U 2.24
1,1,2,2-Tetrachloroethane 1 1.52 U 1.52
1,1,2-Trichloro-1,2,2-trifluoroethane 20000 2.72 U 2.72
1,1,2-Trichloroethane 3 0.64 U 0.64
1,1-Dichloroethane 50 3.92 J 1.92
1,1-Dichloroethene 1 8.00 2.72
1,2-Dichlorobenzene 600 1.76 U 1.76
1,2-Dichloroethane 0.3 2.00 U 2
1,2-Dichloropropane 1 1.44 U 1.44
2-Butanone (MEK) 300 24.80 J 17.6
2-Hexanone 300 5.76 U 5.76
4-Methyl-2-pentanone (MIBK) NA 5.04 U 5.04
Acetone 6000 57.60 8.8
Benzene 1 1.36 J 0.72
Bromoform 4 1.44 U 1.44
Bromomethane 10 1.44 U 1.44
Carbon disulfide 700 1.76 U 1.76
Carbon tetrachloride 0 16.80 2.64

119
Table 6.1 Characterization of VOCs in the Groundwater Sample from the Site
(Continued)
Chlorobenzene 50 1.92 U 1.92
VOC NJDEP
GWQS (µg/L)
GCMS
Results
(µg/L)
Q MDL
(µg/L)
Chlorodibromomethane 0.4 1.76 U 1.76
Chloroethane 5 2.96 U 2.96
Chloroform 70 62.40 1.76
Chloromethane NA 1.76 U 1.76
cis-1,2-Dichloroethene 70 96.00 2.08
cis-1,3-Dichloropropene NA 1.28 U 1.28
Dichlorobromomethane 1 1.20 U 1.2
Ethylbenzene 700 2.40 U 2.4
Methyl tert-butyl ether 70 1.04 U 1.04
Methylene Chloride 3 51.20 1.68
m-Xylene & p-Xylene NA 2.24 U 2.24
o-Xylene NA 2.56 U 2.56
Styrene 100 1.36 U 1.36
TBA 100 80.00 * 9.6
Tert-amyl methyl ether NA 1.28 U 1.28
Tetrachloroethene 1 0.96 U 0.96
Toluene 600 2.00 U 2
trans-1,2-Dichloroethene 100 1.44 U 1.44
trans-1,3-Dichloropropene NA 1.52 U 1.52
Trichloroethene 0.4 296.00 1.76
Vinyl chloride 0.08 7.60 J 0.48 Notes:
Sample was collected from the aqueous phase of microcosm bottle within 24 hours of setup.
NJDEP GWQS - New Jersey Department of Environmental Protection Groundwater Quality Standard
Q - Qualifier
MDL - Method Detection Limit
J: Result is less than the RL but greater than or equal to the MDL and the concentration is an approximate
value.
U: The analyte was analyzed but not detected.
Bold values are in exceedance of the corresponding NJDEP GWQS values.
Four anaerobic treatments were prepared as Figure 6.1 and Table 6.2, including (1)
killed control (I-KC), (2) live control (I-LC), (3) bioaugmentation with SDC-9 (I-SDC),
and (4) bioaugmentation with SDC-9 and sulfate amended (I-SDC-SO4). Considering the
iron mineral is rich in the northeast of US, especially in New Jersey286, we initially

120
postulate the addition of sulfate may enhance or accelerate the total TCE removal since
sulfate can be reduced to sulfide by sulfate-reducing bacteria (SRB) in SDC-9, which
couple with ferrous ions leached from the iron-rich bedrocks to form FeS minerals that
abiotically react with TCE287. Each treatment was prepared in triplicate. TCE concentration
in the aqueous phase was spiked to around 20 µM in 410 mL of groundwater and 275 g of
bedrock sample, leaving approximately 50 mL of headspace. EVO (1,000 mg/L) and
magnesium hydroxide (60 mg/L) were added as the exogenous carbon source and the
alkaline reagent to maintain the neutral or slightly basic pH (7.3-7.6), respectively. SDC-9
was inoculated to a final cell density of 2×10⁸ CFUs/mL. A high concentration (3,000 mg/L)
of sodium azide was added as a biocide in the killed control. Magnesium sulfate
heptahydrate (sulfate concentration equivalent to 584 mg/L) was added to investigate the
interference of sulfate on TCE degradation. Microcosms were set quiescently at room
temperature (i.e., 24±3 °C). Concentrations of TCE, cDCE, and VC in microcosm bottles
were analyzed at a commercial lab using the EPA Method 8260C. This is a standard method
for quantifying a wide span of VOCs in aqueous samples using purge-and-trap gas
chromatography/mass spectrometry (GC/MS). cDCE concentrations in one of the triplicate
microcosms were not in good consensus with the others since Week 11 in Treatments I-
SDC and I-SDC-SO4, probably due to variance in bedrock samples. These data were
excluded from the analysis.

121
Table 6.2 Compositions of Anaerobic Microcosms
Amendment Target amount
or concentration
Killed
control
Live
control
Bioaugmentat
ion
Bioaugmentat
ion + sulfate
Groundwater 410 mL √ √ √ √
Bedrock 275 g √ √ √ √
TCE 8,500 µg/L √ √ √ √
Sodium
azide 3,000 mg/L √
EVO 1,000 mg/La √ √
SDC-9 2 × 10⁸
CFUs/mL √ √
Magnesium
hydroxide 60 mg/L √ √
Magnesium
sulfate
heptahydrate
1,500 mg/L √
aAmended as TOC concentration
Figure 6.1 Experimental scheme of the sequential anaerobic-aerobic treatment in this
microcosm study. Killed control (KC) and live control (LC) were designed for both
anaerobic (stage I) and aerobic (stage II) treatments. After the anaerobic treatment, samples
from I-SDC or I-SDC-SO4 were aerated, pooled, and split to prepare the stage II aerobic
treatments.

122
6.2.3 Bacterial Community Analysis after the Anaerobic Treatment
When the anaerobic treatments are terminated, total DNA from treatments I-SDC and I-
SDC-SO4 was extracted for 16S rRNA sequencing and taxonomic analysis using the
PowerSoil® DNA Isolation Kit (Qiagen, Hilden, Germany) following the manufacture user
protocol. V3-V4 hypervariable region of 16S rRNA was amplified and sequenced as the
method in Section 5.1.4.
6.2.4 Aerobic Microcosm Assays
After the removal of TCE, two sets of anaerobic treatments, bioaugmentation of SDC-9
without amendment of sulfate (I-SDC) and bioaugmentation of SDC-9 with amendment of
sulfate (I-SDC-SO4), were selected for sequential treatment of dioxane via aerobic co-
metabolism by DD4 (Figure 6.1). First, anaerobic bottles were uncapped and exposed to
air for 30 min to induce aerobic conditions. Positive oxidation reduction potential (ORP)
(> 50 mV) and high dissolved oxygen (DO) (> 8.0 mg/L) were achieved as measured by
Xplorer GLX datalogger (PASCO scientific, Roseville, CA). For either anaerobic
treatment (I-SDC or I-SDC-SO4), groundwater and bedrock samples were removed from
these triplicated anaerobic microcosms and pooled to result in approximately 700 mL of
anaerobically treated groundwater and 750 g of bedrock.
Each aerobic microcosm was prepared in the 160-mL serum bottle containing 50
mL of water sample and 25 g of bedrock that have been previously treated under anaerobic
condition. The aqueous samples were re-spiked with dioxane to achieve an initial
concentration of 20 µg/L. As shown in Figure 6.1 and Table 6.3, four treatments were
prepared, including killed control (II-KC), live control (II-LC), and DD4 bioaugmentation
with (II-DD4-Propane) or without propane (II-DD4) amendment. All treatments were

123
conducted in triplicate. DD4 was harvested at the exponential phase after being cultured in
NMS medium with propane as the sole carbon source. Cells were washed with phosphate-
buffered saline (PBS) buffer twice and resuspended to an OD600nm of 2.0. For the two sets
of DD4 bioaugmentation microcosms (II-DD4-Propane and II-DD4), 0.5 mL of the
harvested cell were inoculated, resulting in an initial protein concentration of 0.17 mg per
vial (equivalent to 1.5 × 10⁶ CFU/mL). Propane (0.10 % v/v equivalent to 2.00 mg/L in
headspace) was amended to one set of DD4 bioaugmentation microcosms (II-DD4-
Propane) as the carbon supplement, while no additional substrates were added to the other
bioaugmentation set (II-DD4). Microcosms were incubated at room temperature (i.e.,
24±3 °C) while being shaken at 150 rpm. At selected intervals, liquid and headspace
samples were collected for the analysis of dioxane and propane by gas chromatography
(see supplementary data), respectively. The relative abundance of DD4 was enumerated by
quantitative PCR (qPCR) analysis as detailed in supplementary data.
Table 6.3 Compositions of Aerobic Microcosms
Treatment
Target
amount or
concentration
Killed
control
Live
control Bioaugmentation
Bioaugmentation
+ propane
Autoclave √
Pre-
treated
water
sample
50 mL √ √ √ √
Bedrock 25 g √ √ √ √
Dioxane 20 mg/L √ √ √ √
DD4 1.5 × 10⁶
CFUs/mL √ √
Propane 0.10% v/v √

124
6.2.5 qPCR Analysis to Enumerate the Relative Abundance of DD4 after Aerobic
Treatment
After aerobic treatments, total DNA in microcosms bioaugmented with DD4 (II-DD4 and
II-DD4-Propane) or without amendments (II-LC) were extracted using the PowerSoil®
DNA Isolation Kit (Qiagen, Hilden, Germany). qPCR technique was employed to evaluate
the abundances of DD4 by targeting the tmoA gene using primers, DD4 tmo_F 5’-
GGCGGATGGCTGTACTCAACAGAATG -3’ and DD4 tmo_R 5’- AAATCGCCGG
AAAGCTTGGGC-3’, and a TaqManTM probe 5’-/FAM/CGACCTGGC/ZEN/CAGG
AGTACGAAC/IABkFQ/-3’. The detailed method has been described in Section 5.2.3.
6.2.6 Biotransformation of VC and cDCE by DD4 and their Inhibitory Effects to
Dioxane Degradation in DD4
Given the observation of cDCE and VC being generated from the anaerobic treatment of
TCE, growing and resting cells of DD4 were used to (1) investigate the degradation
capability of DD4 on VC and cDCE and (2) assess their impacts on dioxane degradation.
DD4 cells were prepared in 20 mL NMS medium in a 160-mL serum bottle with 4 mL
propane amended. Cells were harvested and resuspended with fresh NMS medium to an
OD600nm of ~2.0. Growing cell assays were prepared with 0.1 mL of resuspended DD4,
inoculated to 10 mL groundwater sample spiked with 10 mg/L of dioxane, 1 mg/L of cDCE,
and 1 mg/L of VC. As an auxiliary substrate, 150 μL of propane (0.10 % of volume
equivalent to 2.0 mg/L in the headspace) was amended at the beginning and when propane
concentration was lower than 0.20 mg/L in headspace. In parallel, for resting cell assays,
resuspended DD4 with an OD600nm of 2.0 was exposed to dioxane of an initial concentration
of 10 mg/L in 5 mL of NMS medium in 30-mL serum bottle. cDCE or VC was amended
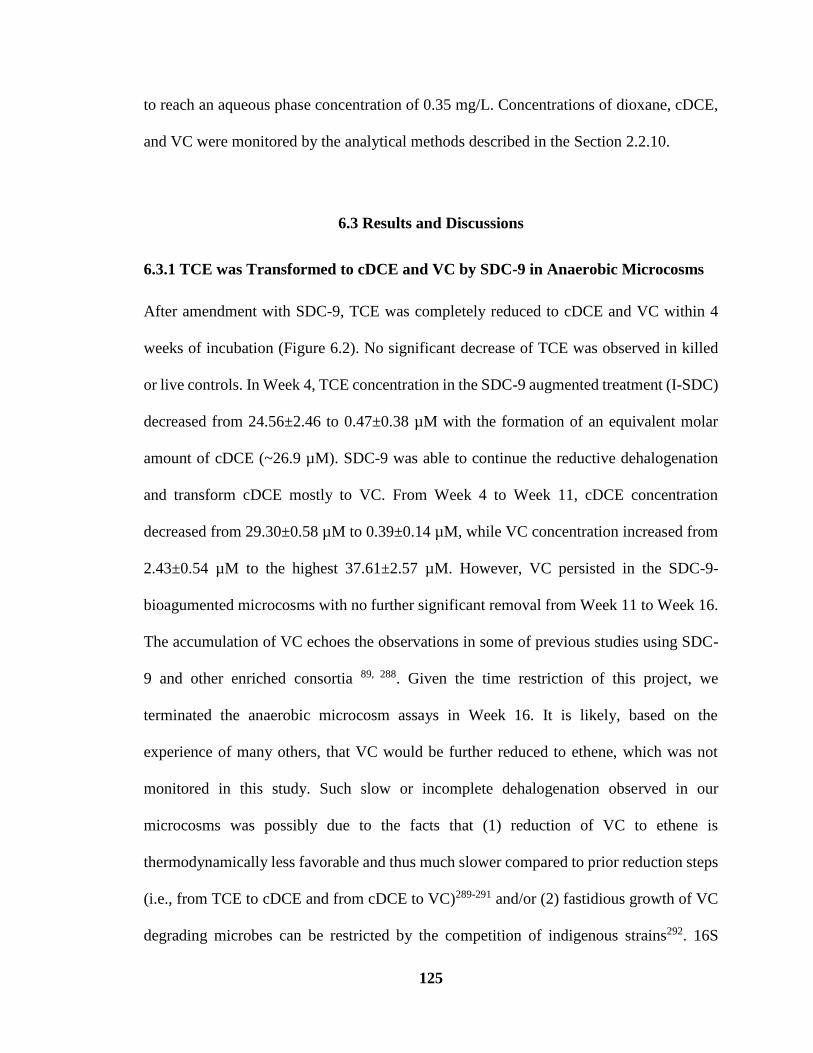
125
to reach an aqueous phase concentration of 0.35 mg/L. Concentrations of dioxane, cDCE,
and VC were monitored by the analytical methods described in the Section 2.2.10.
6.3 Results and Discussions
6.3.1 TCE was Transformed to cDCE and VC by SDC-9 in Anaerobic Microcosms
After amendment with SDC-9, TCE was completely reduced to cDCE and VC within 4
weeks of incubation (Figure 6.2). No significant decrease of TCE was observed in killed
or live controls. In Week 4, TCE concentration in the SDC-9 augmented treatment (I-SDC)
decreased from 24.56±2.46 to 0.47±0.38 µM with the formation of an equivalent molar
amount of cDCE (~26.9 µM). SDC-9 was able to continue the reductive dehalogenation
and transform cDCE mostly to VC. From Week 4 to Week 11, cDCE concentration
decreased from 29.30±0.58 µM to 0.39±0.14 µM, while VC concentration increased from
2.43±0.54 µM to the highest 37.61±2.57 µM. However, VC persisted in the SDC-9-
bioagumented microcosms with no further significant removal from Week 11 to Week 16.
The accumulation of VC echoes the observations in some of previous studies using SDC-
9 and other enriched consortia 89, 288. Given the time restriction of this project, we
terminated the anaerobic microcosm assays in Week 16. It is likely, based on the
experience of many others, that VC would be further reduced to ethene, which was not
monitored in this study. Such slow or incomplete dehalogenation observed in our
microcosms was possibly due to the facts that (1) reduction of VC to ethene is
thermodynamically less favorable and thus much slower compared to prior reduction steps
(i.e., from TCE to cDCE and from cDCE to VC)289-291 and/or (2) fastidious growth of VC
degrading microbes can be restricted by the competition of indigenous strains292. 16S

126
rRNA gene amplicon sequencing analysis (Figure 6.3) revealed the existence of two well-
known halorespiring bacteria, Dehalococcoides and Desulfuromonas, reflecting their
essential roles in reductive dechlorination of TCE to cDCE or VC86.
Figure 6.2 cVOCs monitoring during the anaerobic treatments in killed control (I-KC),
live control (I-LC), and bioaugmentation microcosms amended with SDC-9 (I-SDC), and
with both SDC-9 and sulfate (I-SDC-SO4), respectively. Blue, green, and yellow bars
represent the concentration of TCE, cDCE, and VC in µM, respectively.
6.3.2 Halorespiring Bacteria Prevailed after the Anaerobic Bioaugmentation
16S rRNA gene amplicon sequencing analysis (Figure 6.3) revealed the existence of
Dehalococcoides and Desulfuromonas, two genera well known for their capability of
reductive dehalogenation, in SDC-9-bioaugmented microcosms (I-SDC). Genus of
Dehalococcoides embraces obligatory organohalide-respiring bacteria that are able to

127
sequentially reduce TCE to cDCE, VC, and ethene 288, 293. In contrast, Desulfuromonas can
only catalyze the first dehalogenation step (i.e., TCE to cDCE)294, rather than
transformation of low-chlorinated compounds such as cDCE and VC. Prevalence of these
two dehalogenation bacteria have been reported at sites previously treated via
bioaugmentation with SDC-986. Despite their relatively low abundance (Figure 6.3),
Dehalococcoides and Desulfuromonas are plausibly pivotal for dehalogenation of TCE to
cDCE/VC as observed in the microcosms.
Figure 6.3 Relative abundance (%) of dehalogenation bacteria, sulfate-reducing bacteria,
and other genera associated with dehalogenation in anaerobic microcosms after
bioaugmention with SDC-9 consortia. Red bars denote the genera relative abundance (%)
in anaerobic treatment that was bioaugmented with SDC-9 (I-SDC). Blue bars represent
genera relative abundance (%) in the anaerobic treatment which was augmented with both
SDC-9 and sulfate (I-SDC-SO4).

128
In addition to these organohalide-respiring bacteria, some other microorganisms
may also assist in the dehalogenation of TCE observed in the I-SDC microcosms (Figure
6.3). The presence of Geobacter species (1.04% in I-SDC) potentially facilitates TCE
dehalogenation directly or indirectly. Geobacter, a ubiquitous Fe(III)-reducing genus in
soil and sediment, has been applied in the anaerobic degradation of aromatic hydrocarbons
such as benzene, toluene, and xylene295. Some species, such as Geobacter lovleyi SZ,
exhibit the capability of reducing PCE to cDCE296. Further studies showed that Geobacter
can enhance the dechlorination by Dehalococcoides by providing interspecies cobamide as
a nutritional supplement297. Also known as a halo-respiring genus, Anaeromyxobacter
accounts for 0.04% in the I-SDC microcosm298. Anaeromyxobacter has been frequently
detected at sites impacted by cVOCs299. Based on many previous studies300, 301, some other
bacteria detected in the I-SDC microcosms may act as a supportive role to dehalogenation,
such as Desulfovibrio (0.04%) and Bacteroides (0.02%). It was reported that the production
of acetate, hydrogen, and corrinoid cofactors by Desulfovibrio can support the reductive
dehalogenation by Dehalococcoides300. Frequent detection of Bacteroides implied its
association with the reductive dehalogenation process observed in the field301.
Though successive dehalogenation of TCE to cDCE and then VC was evident in
the SDC-9 bioaugmented microcosms, relative abundance of these key dehalogenation
bacteria and other contributing bacteria were relatively low. It may result from a number
of technical difficulties we have experienced. First, samples were collected at the end of
the active dehalogenation treatment without replenishing of EVO or other substrates. Thus,
active players for dehalogenation may have decayed to some extent. Second, isolation of
genomic DNA from the bedrock samples was challenging. We used the PowerSoil® DNA

129
Isolation Kit (Qiagen, Hilden, Germany) for DNA extraction, which may cause biased
recoveries among different bacteria. Third, specific primers targeting the V3-V4 region of
16S rRNA was amplified by PCR, introducing potential bias for the 16S rRNA gene
amplicon sequencing302. Fourth, a portion (16.7%) of the sequences were assigned as
“unknown” bacteria as no significant homologs were identified within the database (Silva)
utilized for annotation. The missing assignment of these sequences may have undermined
the roles of bacteria that have been sparsely studied303.
6.3.3 Contribution of Abiotic Reactions to the TCE Removal was Minimal
In the anaerobic treatment I-SDC-SO4 that received both SDC-9 and sulfate (584 mg/L),
TCE was rapidly transformed from 21.92±1.61 to 0.14±0.03 µM within the first four weeks.
Concurrently, cDCE increased from the initial of 1.57±0.50 µM to 32.46±1.26 µM.
However, neither reduction of cDCE nor generation of VC was significantly observed after
Week 4. Therefore, the addition of sulfate may interfere with the sequential reduction of
cDCE to VC, probably due to the outcompetition of halorespiring bacteria by sulfate
reducing bacteria (SRB). After the addition of sulfate, the total SRB increased to nearly 7%
of the total bacteria (Figure 6.3), including Desulfoprunum (6.38%), Desulfovirga (0.33%),
Desulfovibrio (0.16%), Desulfbulbus (0.03%), Desulfatiferula (0.03%). In contrast, in the
I-SDC microcosms where sulfate was not amended, the relative abundance of total SRB
was as low as 0.05%. Furthermore, amendment of sulfate also greatly reduced the
abundance of Dehalococcoides from 0.020% (in I-SDC) to 0.007% (in I-SDC-SO4) (Figure
6.3). As Dehalococcoides are key contributors to the reduction of cDCE to VC304, the
decrease of their abundance could be conducive to the absence of cDCE reduction or VC
formation as observed in the I-SDC-SO4 treatment. In our microcosms, the presence of

130
sulfate as an alternative electron acceptor exerted a significant selection on SRB,
prohibiting reductive dechlorination due to their rapid and competitive utilization of
electron donors305, 306.
The formation of FeS minerals was evident as dark precipitates formed in the I-
SDC-SO4 treatment (Figure 6.4). However, the contribution of abiotic degradation might
be minimal to the total TCE removal according to the given evidence. First, there is no
significant loss in total molar concentration of cVOCs over the treatment, suggesting little
production of dissolved gases including acetylene, which is a dominant abiotic
dehalogenation product of TCE. Reports previously found acetylene generated as the
primary product (73-78%) of TCE abiotic degradation via reductive β-elimination. Only
approximately 7% of the removed TCE was transformed to cDCE and 15-20% was
converted to ethene or ethane and other hydrocarbons through hydrogenolysis 287. Second,
the microcosms contained groundwater and rock samples at a ratio of 1.5, while the actual
bedrock aquifer could contain groundwater and bedrock at a ratio of 0.02. Therefore, the
high water ratio in the microcosms could result in low iron concentrations (due to dilution,
Table 6.4) when compared with the concentrations in the Passaic Formation during the
field anaerobic treatment. Further, the iron leached from the bedrock typically peaked at
6 to 9 months during the anaerobic treatment (data not shown). Considering that our
anaerobic study lasted for less than 4 months, the ferrous iron availability may not reach
peak prior to the termination of the study. Therefore, the potential low availability of
ferrous iron in the microcosm could limit the formation of FeS at the concentrations that
can effectively stimulate abiotic dehalogenation. All these lines of evidence suggest that

131
dechlorination of TCE to cDCE in the I-SDC-SO4 treatment was mainly contributed by
microbial reduction, rather than the abiotic transformation.
Figure 6.4 Dark particles formed in the anaerobic treatments bioaugmented with SDC-9
and sulfate (I-SDC-SO4).
Table 6.4 Monitoring of Dissolved Iron During the Anaerobic Treatments
Incubation time
(week)
Dissolved iron (mg/L)
Killed
control
Live
control Bioaugmentation SDC-9 + sulfate
0 0.2 0.2 0.2 0.7
4 0.2 0.2 0.2 1.4
7 0.2 0.2 0.3 1.4
11 0.2 0.2 0.3 1.4
Dioxane was persistent over the course of anaerobic treatments as no significant
dioxane concentration change was observed in all anaerobic microcosms (data not shown).
To date, anaerobic treatment of dioxane remains elusive. Thus, a subsequent aerobic

132
treatment by DD4 was conducted to mitigate dioxane residual after the anaerobic treatment
of TCE.
6.3.4 DD4 Effectively Eliminated Dioxane and Sustained its Abundance in Aerobic
Microcosms
Dioxane in the field groundwater previously treated anaerobically with SDC-9 was
efficiently removed by DD4 when propane was initially supplemented. Within 32 days of
incubation, dioxane was degraded from 20.9±0.1 µg/L to below our MDL (i.e., 0.4 µg/L),
meeting stringent groundwater cleanup guidance in NJ. Propane (300 µL) was
supplemented twice to achieve a complete dioxane removal (Figure 6.5A and 6.6).
Absolute qPCR analysis (Figure 6.7) revealed high abundance (6.7%) of DD4 over the
course of bioaugmentation treatment with propane supplement.
Figure 6.5 Dioxane depletion in the aerobic treatments, including killed control (II-KC),
live control (II-LC), bioaugmentation with DD4 (II-DD4), and bioaugmentation with DD4
and propane (II-DD4-Propane). The aerobic microcosms were prepared with samples from
the previous anaerobic treatment of (A) SDC-9 without sulfate (I-SDC) and (B) SDC-9
with sulfate amended (I-SDC-SO4). Green arrows indicate the addition of propane.

133
Figure 6.6 Propane consumption (mg/L in headspace) in aerobic treatment (II-DD4-
Propane) after anaerobic treatment by SDC-9 bioaugmentation (I-SDC) or SDC-9 with
sulfate addition (I-SDC-SO4).
Figure 6.7 Relative abundance of DD4 estimated by qPCR in microcosms at the beginning
and end of the aerobic treatments by DD4 and DD4 with propane. The x-axis indicates the
samples were previously anaerobically treated by SDC-9 without sulfate (I-SDC) or with
sulfate (I-SDC-SO4).

134
Though at a slowed degradation rate, complete dioxane was also achieved by
propane-fed DD4 in the microcosms prepared with aquifer samples previously treated with
both SDC-9 and sulfate (I-SDC-SO4) (Figure 6.5B). Interestingly, the initial propane
consumption was unexpectedly fast. Around 77% of the initially dosed propane was
quickly removed in the first 2 days of incubation (Figure 6.6). Later, propane consumption
was markedly slowed down, taking 21 days for DD4 to completely degrade the rest of
propane that was amended at the beginning (Figure 6.6). Concurrently, dioxane was
degraded from 22.5±0.4 µg/L to 8.1±0.1 µg/L (Figure 6.5B). In contrast, in aerobic
microcosms prepared with the samples treated with SDC-9 but no sulfate (I-SDC), only 12
days were spent to fully deplete the initial propane, while a similar dioxane removal to
8.4±1.0 µg/L was concurrently achieved (Figure 6.5A). The reason for the transient and
fast depletion of propane observed in microcosms prepared with I-SDC-SO4 samples was
unclear. However, the slowed propane consumption and dioxane degradation between Day
2 and Day 18 may be due to some inhibitory factors to DD4 that were derived from
previous anaerobic treatment with sulfate supplement (e.g. sulfur chemicals). Within 28
days of active treatment in the aerobic microcosms prepared with the I-SDC-SO4 samples,
propane was added three times resulting in a total amendment of 450 µL (Figure 6.6). This
third amendment of propane also greatly accelerated dioxane degradation from Day 25
(Figure 6.5B) and enriched a higher abundance of DD4 is 30.4% in I-SDC-SO4 in
comparison with that in I-SDC (Figure 6.7).
Interestingly, even without the amendment of propane as the exogenous carbon
source, there was over 25% disappearance of dioxane in DD4 bioaugmented treatments
(II-DD4) within the first 2 weeks of incubation (Figure 6.5). However, dioxane degradation
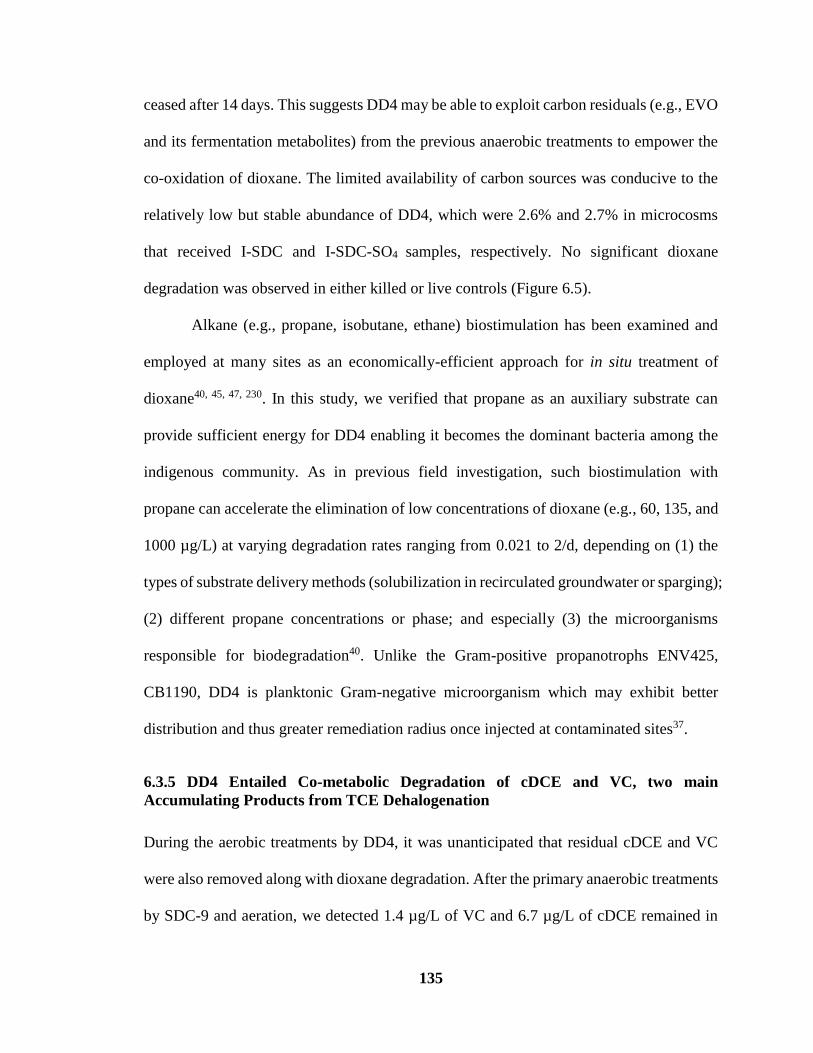
135
ceased after 14 days. This suggests DD4 may be able to exploit carbon residuals (e.g., EVO
and its fermentation metabolites) from the previous anaerobic treatments to empower the
co-oxidation of dioxane. The limited availability of carbon sources was conducive to the
relatively low but stable abundance of DD4, which were 2.6% and 2.7% in microcosms
that received I-SDC and I-SDC-SO4 samples, respectively. No significant dioxane
degradation was observed in either killed or live controls (Figure 6.5).
Alkane (e.g., propane, isobutane, ethane) biostimulation has been examined and
employed at many sites as an economically-efficient approach for in situ treatment of
dioxane40, 45, 47, 230. In this study, we verified that propane as an auxiliary substrate can
provide sufficient energy for DD4 enabling it becomes the dominant bacteria among the
indigenous community. As in previous field investigation, such biostimulation with
propane can accelerate the elimination of low concentrations of dioxane (e.g., 60, 135, and
1000 µg/L) at varying degradation rates ranging from 0.021 to 2/d, depending on (1) the
types of substrate delivery methods (solubilization in recirculated groundwater or sparging);
(2) different propane concentrations or phase; and especially (3) the microorganisms
responsible for biodegradation40. Unlike the Gram-positive propanotrophs ENV425,
CB1190, DD4 is planktonic Gram-negative microorganism which may exhibit better
distribution and thus greater remediation radius once injected at contaminated sites37.
6.3.5 DD4 Entailed Co-metabolic Degradation of cDCE and VC, two main
Accumulating Products from TCE Dehalogenation
During the aerobic treatments by DD4, it was unanticipated that residual cDCE and VC
were also removed along with dioxane degradation. After the primary anaerobic treatments
by SDC-9 and aeration, we detected 1.4 µg/L of VC and 6.7 µg/L of cDCE remained in

136
the aqueous phase of the aerobic microcosms prepared with treated samples from I-SDC
and I-SDC-SO4, respectively. Notably, neither VC nor cDCE was detectable after the II-
DD4-Propane treatment. Thus, biotransformation assays with resting cells of DD4 were
further conducted to verify the ability of DD4 to co-metabolize cDCE or VC. Notably,
cDCE and VC were both fully degraded by DD4 within 20 h and 5 h, respectively, when
their initial concentrations were dosed at around 0.35 mg/L (Figure 6.8A). No significant
loss of cDCE or VC was observed in the abiotic control treatments. Additional
biotransformation assays revealed propane-fed DD4 was not able to co-metabolize TCE
(data not shown).
Figure 6.8 Degradation of dioxane by DD4 resting cells with or without the presence of
VC and cDCE. The concentrations of cDCE and VC were shown in (A) and dioxane
concentration was shown in (B).
To further mimic the commingled contamination observed in the field, microcosms
were further prepared with the presence of co-contaminants, VC (1 mg/L), cDCE (1 mg/L),
and dioxane (10 mg/L). DD4 was inoculated at a relatively low concentration (0.0034 mg

137
protein/mL) of DD4 and fed with 2 mg/L propane. Within the first 9 days of incubation,
VC was primarily degraded from 1.11±0.02 mg/L to 0.13±0.08 mg/L, achieving 88.3%
removal (Figure 6.9A). VC was fully depleted on Day 15. Concurrently, cDCE and dioxane
were degraded much slower than VC. cDCE was degraded from 1.06±0.02 mg/L to
0.80±0.02 mg/L on Day 9, and 0.39±0.11 mg/L on Day 15. Only 18.1% of dioxane was
removed in the first 15 days. After cDCE was degraded to as low as 0.03±0.01 mg/L on
Day 18, dioxane degradation greatly accelerated. Dioxane was then degraded to below 0.1
mg/L on Day 30. This is the first report of a gram-negative propanotroph that can
synchronize the removal of dioxane, cDCE, and VC.
Figure 6.9 Co-metabolic degradation of dioxane (10 mg/L) by DD4 in anaerobically
pretreated groundwater with (A) or without (B) the presence of VC (1 mg/L) and cDCE (1
mg/L).
A parallel treatment was dosed only with dioxane. Without the presence of cDCE
or VC, complete dioxane removal was achieved within 5 days (Figure 6.9A). The

138
consumption of propane was also much faster, suggesting a greater growth of DD4 and
steady enzyme expression. The initial dose of propane was fully depleted in 2 days when
DD4 was not exposed to cDCE or VC. However, when both cDCE and VC were present,
it took 15 days for the complete consumption of the same amount of propane. The
prolonged propane consumption and dioxane degradation reflect the potential inhibitory
efforts of cDCE and VC to DD4, even though both cVOCs can be fortuitously degraded
by this propanotrophic bacterium.
According to previous studies, the observed VC and cDCE co-metabolism in DD4
may be attributed to the catalysis of SDIMOs307. There exist five putative SDIMO-
encoding genes in DD4185, 229. Contributions of these SDIMOs to cDCE and VC oxidation
underscores further molecular characterization. It is also interesting to observe VC
degradation occurred prior to cDCE degradation. This tandem degradation order for VC
and cDCE may be attributed to their difference in enzyme affinity as reported in some
previous studies308, 309. For instance, Pseudomonas aeruginosa MF1 degraded VC faster
than cDCE as it exhibited a much smaller half-saturation coefficient (Km) of 0.26±0.037
µM for VC310 than 22.0±0.8 µM for cDCE309.
6.3.6 cDCE was More Potent in Inhibiting Dioxane Degradation by DD4 than VC
To assess the inhibitory effects of cDCE and VC, either compound was exposed to DD4
resting cells at an initial dosage of 0.35 mg/L. Significant inhibition to dioxane degradation
was observed for both compounds in comparison with the control that received no cVOCs
(Figure 6.8B). Without the presence of VC or cDCE, the resting cells of DD4 completely
degraded 10.0±0.3 mg/L of dioxane in 20 h. However, in 24 h of incubation, dioxane
concentration remained as high as 4.7±0.6 mg/L and 7.0±1.0 mg/L for VC-exposed and

139
cDCE-exposed DD4 cells, respectively. Thus, cDCE posed a more potent inhibition to
DD4 since the dioxane degradation rate was significantly slower (p < 0.05) than that
observed in VC-exposed cells.
A number of previous investigations have reported the inhibitory effects of cDCE
and VC on aerobic biodegradation of dioxane or other groundwater contaminants. It was
reported that 5 mg/L of cDCE showed significant inhibition to dioxane degradation by
CB1190, and dioxane degradation completely halted at 50 mg/L of cDCE. Inhibitory
effects of cDCE may be attributed to universal stress triggered by this compound 67. To
date, no previous studies have reported the inhibitory effects of VC on dioxane
biodegradation. As a mutagen, VC can disrupt bacterial metabolism and their abilities to
degrade cVOCs. A prior microcosm study observed reversible and irreversible inhibitions
by VC (~5.0 mg/L) to aerobic co-metabolism of TCE and cDCE, respectively311. Similarly,
Zhao et al. reported that the rate of cDCE (60 µM) degradation decreased with the increase
of VC concentrations (from 10 to 110 µM)312. Collectively, degradation of VC that
occurred prior to cDCE and dioxane as observed in our microcosms may result from the
combination of high affinity to its degrading enzyme in DD4 and potent inhibitory effects
(so the cells need to overcome first via co-metabolic decomposition).
6.4 Conclusions
Co-contamination of TCE (~ ppm level) and dioxane (~ ppb level) in groundwater is
prevailing at sites in the US and globally. This study demonstrates an anaerobic and aerobic
treatment train as a feasible and economical solution to mitigate this challenging co-
contamination issue. Subsequent to the primary anaerobic treatment using reductive

140
dehalogenation by SDC-9, aerobic co-metabolism by DD4 can not only remove trace levels
of dioxane but also eliminate undesirable metabolites (e.g., cDCE and VC) commonly
generated from reductive dehalogenation. As indicated in our previous work, DD4 has also
demonstrated a spectrum of properties compatible with in situ remediation technologies
(e.g., biosparging), spanning fast planktonic growth, and the ability to exploit trace
nutrients and adapt to diverse aquifer environments. The endured viability and activity of
this strain in environmental samples pretreated with anaerobic procedures was also
validated in this study. Though significant inhibition was observed by cDCE and VC,
DD4’s versatile catalytic capability allowed it to decompose these inhibiting compounds.
This aerobic decomposition of cDCE and VC also avoids the undesired competition of
electron acceptor in anaerobic degradation. Through engineering approaches (e.g.,
recirculation and air injection), the ability of DD4 to conquer field inhibitory factors can
be reinforced to accelerate the site remediation and meet stringent cleanup goals for both
cVOCs and dioxane.
At many bedrock formations like the one tested in this study, iron can be leached
to the aqueous phase in the aquifer to supplement biotic and abiotic processes. Previous
studies have demonstrated FeS can mediate abiotic transformation of TCE, contributing to
the removal of this resistant compound. Through the addition of excessive sulfate, we
intend to integrate this abiotic TCE removal into the anaerobic treatment. Unfortunately,
our bench-scale tests revealed that benefits from sulfate amendment might be minimal for
this bedrock formation. First, sulfate stimulated the growth of SRB in SDC-9. The
dominated SRB outcompeted the halorespiring bacteria, especially those in charge of
reducing cDCE to VC. Second, the production of reducing minerals may also hinder the

141
growth and activity of DD4 in the subsequent aerobic treatment. Combining these lines,
SDC-9 without sulfate is suggested in the sequential treatment for TCE and dioxane
bioremediation.

142
CHAPTER 7
CONCLUSIONS AND FUTURE WORK
This dissertation presents five parts oriented to innovate bioremediation for an
environment-recalcitrant contaminant, dioxane, from the molecular foundation to two field
applications.
Firstly, two dioxane degrading enzymes, PRM and THM, were compared based on
their degradation kinetics, susceptibility to inhibition, substrate range. Our results reveal
PRM may be more advantageous than THM particullary when dioxane concentration is
low (xx µg/L) in the field. PRM also exhibits higher resistance to chlorinated solvents’
inhibition and broader substrate range. However, due to the scarcity of previous research
about PRM, its contribution to dioxane biodegradation has been long underestimated in the
field. Thus, a comprehensive detection covering both PRM and THM could be more
accurate for the assessment of dioxane MNA occurring at impacted sites. On the other hand,
the extensive substrate range of PRM provides more options for stimulating the PRM-
expressing bacteria native in the field. Thus, both MNA and biostimulation will benefit
greatly from this study which extends our fundamental understanding of key enzymes that
can degrade dioxane.
This dissertation also investigates the SDIMO enzyme family including phylogeny,
evolution, substrate range, and regulation mechanisms using bioinformatics analysis.
According to the amino acid sequences, operon arrangement, and physiological roles,
SDIMOs are distinctly catagorized into 6 groups. Catalytic function of SDIMOs evolves
from unsaturated compounds to saturated compounds, ultimately, to methane. According
to the dissociation energy of C-H bonds in alkanes, SDIMOs exhibit an evolution direction

143
of oxidizing bonds with low energy toward high energy. Unlike, group-1,2, and 3 SDIMOs,
whose transcription is regulated by the σ54-dependent promoter, group-6 SDIMOs are
regulated by the σ70-dependent promoter, suggesting an activator is not essential to initiate
the transcription of group-6 SDIMO genes. The profiling of the SDIMO family allows the
bioprospecting of new SDIMOs recovered from the environment.
Driven by the necessity to complete the dioxane biodegradation pathway, a study
that unravels the genomic differences between metabolic and co-metabolic degraders is
conducted. Although it fails to figure out the key enzymes in charge of the HEAA oxidation,
several downstream enzymes involved in glycolate transformation are unique to metabolic
strains. This indicates that the downstream degradation pathway is also necessary for
metabolic strains to obtain energy and carbon source form dioxane. We recommend some
further transcriptomic and genomic analysis embracing additional dioxane degraders so
that the gene library and analysis can be constructed in a more comprehensive and accurate
fashion, which will facilitate the discovery of HEAA degrading gene(s) in the future.
In addition, we investigate the practical application of a new isolate, Azoarcus sp.
DD4, with two sets of microcosm assays mimicking different in situ and ex situ treatment
strategies. The first microcosm was set up with groundwater from a Superfund site located
in the Northern New Jersey, where dioxane is prevailing low at concentrations ranging
from 30 to 130 μg/L. After bioaugmentation with DD4 and propane, DD4 outcompetes
other indigenous bacteria and becomes dominant in communities in tested groundwater,
suggesting its robust adaptability for field application. However, the artificially inoculated
dioxane metabolizers (i.e., PH-06 and CB1190) disappeared according to the qPCR and
16S rRNA sequencing analysis. Further analysis also confirmed that the gene encoding

144
the α subunit of dioxane degrading toluene monooxygenase in DD4, tmoA, is a suitable
biomarker to monitor and assess the DD4 bioaugmentation as its abudance is positively
correlated with the dioxane removal rates observed in the microcosms.
The other microcosm assay is conducted using samples from a site with
commingled contamination of TCE and trace dioxane. An anaerobic-aerobic sequential
treatment is employed to eliminate TCE by SDC-9 and remove dioxane by DD4. Though
TCE was effectively removed, less-chlorinated products, vinyl chloride (VC) and cis-
dichloroethene (cDCE), were generated over 16 weeks of incubation. During this anaerobic
biotreatment, no significant dioxane degradation was observed. Subsequently, the
microcosm materials were exposed to air and inoculated with Azoarcus sp. DD4, a
cometabolic dioxane degrader. When fed with propane as the auxiliary substrate, DD4 was
able to sustain its activity to degrade dioxane. After the course of aerobic bioaugmentation,
the dominance of DD4 (~ 6%) in the microbial community was revealed by our qPCR
assay using the biomarker specific to the toluene monooxygenase gene responsible for
dioxane degradation in DD4. Even better, DD4 can also entail a concurrent
biotransformation of both cDCE and VC and eliminate residuals of these undesirable
products from the preceding reductive dehalogenation process. Presence of relatively high
concentrations of cDCE and VC (e.g., 1 mg/L as in the aqueous phase) greatly inhibited
the propane assimilation and growth of DD4. However, DD4 was able to overcome the
hindrance and cometabolize VC and cDCE in sequence. Dioxane degradation was resumed
once cDCE and VC were mostly depleted. This is the first report to demonstrate the
feasibility of a treatment train combining reductive dehalogenation and aerobic co-
oxidation processes in tandem to not only effectively clean up prevalent co-contamination

145
of TCE and dioxane but also mitigate less-chlorinated products (e.g., cDCE and VC) when
reductive dehalogenation is incomplete.
146
REFERENCES
1. Lourenco, A., Research on polyatomic compounds. Annals of Chemistry and of Physics
1863, 3, (67), 257-339.
2. Mohr, T. K.; Stickney, J. A.; DiGuiseppi, W. H., Environmental investigation and
remediation: 1, 4-dioxane and other solvent stabilizers. CRC Press: Boca Raton, FL,
2016.
3. Burrill, A. B.; Johnson, P. M., The ionization potential and ground state cation vibrational
structure of 1, 4-dioxane. Chemical Physics Letters 2001, 350, (5-6), 473-478.
4. Anderson, R. H.; Anderson, J. K.; Bower, P. A., Co‐occurrence of 1, 4‐dioxane with
trichloroethylene in chlorinated solvent groundwater plumes at US Air Force
installations: Fact or fiction. Integrated Environmental Assessment and Management
2012, 8, (4), 731-737.
5. Toxicological Profile for 1, 4-dioxane. In Agency for Toxic Substances and Disease
Registry Ed. Division of Toxicology and Environmental Medicine/Applied Toxicology
Branch: Atlanta, Georgia, April 2012.
6. Abe, A., Distribution of 1,4-dioxane in relation to possible sources in the water
environment. Science of The Total Environment 1999, 227, (1), 41-47.
7. Adamson, D. T.; Piña, E. A.; Cartwright, A. E.; Rauch, S. R.; Hunter Anderson, R.;
Mohr, T.; Connor, J. A., 1,4-Dioxane drinking water occurrence data from the third
unregulated contaminant monitoring rule. Science of The Total Environment 2017, 596-
597, 236-245.
8. Adamson, D. T.; Mahendra, S.; Walker Jr, K. L.; Rauch, S. R.; Sengupta, S.; Newell, C.
J., A multisite survey to identify the scale of the 1, 4-dioxane problem at contaminated
groundwater sites. Environmental Science and Technology Letters 2014, 1, (5), 254-258.
9. Adamson, D. T.; de Blanc, P. C.; Farhat, S. K.; Newell, C. J., Implications of matrix
diffusion on 1, 4-dioxane persistence at contaminated groundwater sites. Science of the
Total Environment 2016, 562, 98-107.
10. Stepien, D. K.; Diehl, P.; Helm, J.; Thoms, A.; Püttmann, W., Fate of 1,4-dioxane in the
aquatic environment: From sewage to drinking water. Water Research 2014, 48, 406-419.
11. The third unregulated contaminant monitoring rule (UCMR 3): data summary, January
2017. In United States Environmental Protection Agency, Ed. Office of Water, United
States Environmental Protection Agency: 2017.
12. Adamson, D. T.; Anderson, R. H.; Mahendra, S.; Newell, C. J., Evidence of 1, 4-dioxane
attenuation at groundwater sites contaminated with chlorinated solvents and 1, 4-dioxane.
Environmental Science and Technology 2015, 49, (11), 6510-6518.

147
13. The drinking water standards and health advisories. In 2012 edition ed.; United States
Environmental Protection Agency, Ed. Washington, DC, 2012.
14. European Union Risk Assessment Report. In European Commission, Institute for Health
and Consumer Protection, European Chemicals Bureau, European Chemicals Bureau Ed.
Office for Official Publications of the European Communities: Luxembourg, 2002; Vol.
21.
15. Criteria for a recommended standard occupational exposure to dioxane. In U.S.
Department of Health Education and Welfare Center for Disease Control, Ed. National
Institute for Occupational Safety and Health: Cincinnati, 1977.
16. Frank R. Lautenberg chemical safety for the 21st century act. In the United States of
America, 2016.
17. 1,4-Dioxane in Drinking-water: Background document for development of WHO
Guidelines for Drinking-water Quality. In World Health Organization Water Sanitation
and Health: Irvine, CA, 2005.
18. 1,4-Dioxane (CASRN 123-91-1). In United States Environmental Protection Agency:
2013.
19. Protection, T. N. J. D. o. E., Ground Water Quality Standard 1,4‐Dioxane. In New Jersey
Department of Environmental Protection, Ed. Trenton, NJ, 2015.
20. Stroo, H.; Ward, C., Future directions and research needs for chlorinated solvent plumes.
In In Situ Remediation of Chlorinated Solvent Plumes, Springer: 2010; pp 699-725.
21. Adamson, D. T.; Mahendra, S.; Walker, K. L.; Rauch, S. R.; Sengupta, S.; Newell, C. J.,
A multisite survey to identify the scale of the 1,4-dioxane problem at contaminated
groundwater sites. Environmental Science & Technology Letters 2014, 1, (5), 254-258.
22. Technical fact sheet-1,4-dioxane. In USEPA, Ed. Office of Land and Emergency, United
States Environmental Protection Agency: 2017.
23. Woodard, S.; Mohr, T.; Nickelsen, M. G., Synthetic Media: A Promising New Treatment
Technology for 1, 4‐Dioxane. Remediation Journal 2014, 24, (4), 27-40.
24. Li, W.; Patton, S.; Gleason, J. M.; Mezyk, S. P.; Ishida, K. P.; Liu, H., UV Photolysis of
Chloramine and Persulfate for 1, 4-Dioxane Removal in Reverse-Osmosis Permeate for
Potable Water Reuse. Environmental Science and Technology 2018.
25. Nyer, E. K., Groundwater treatment technology. John Wiley & Sons: Hoboken, NJ,
1992.
26. Corin, N.; Backlund, P.; Kulovaara, M., Degradation products formed during UV-
irradiation of humic waters. Chemosphere 1996, 33, (2), 245-255.

148
27. Andaluri, G.; Suri, R., Removal of 1, 4-dioxane and volatile organic compounds from
groundwater using ozone-based advanced oxidation process. Ozone: Science and
Engineering 2017, 39, (6), 423-434.
28. Li, M.; Liu, Y.; He, Y.; Mathieu, J.; Hatton, J.; DiGuiseppi, W.; Alvarez, P. J. J.,
Hindrance of 1,4-dioxane biodegradation in microcosms biostimulated with inducing or
non-inducing auxiliary substrates. Water Research 2017, 112, 217-225.
29. Li, W.; Xu, E.; Schlenk, D.; Liu, H., Cyto-and Geno-Toxicity of 1, 4-Dioxane and Its
Transformation Products during Ultraviolet-Driven Advanced Oxidation Processes.
Environmental Science: Water Research and Technology 2018.
30. Li, M.; Mathieu, J.; Liu, Y.; Van Orden, E. T.; Yang, Y.; Fiorenza, S.; Alvarez, P. J. J.,
The abundance of tetrahydrofuran/dioxane monooxygenase genes (thmA/dxmA) and 1,4-
dioxane degradation activity are significantly correlated at various impacted aquifers.
Environmental Science and Technology Letters 2014, 1, (1), 122-127.
31. Li, M.; Van Orden, E. T.; DeVries, D. J.; Xiong, Z.; Hinchee, R.; Alvarez, P. J., Bench-
scale biodegradation tests to assess natural attenuation potential of 1, 4-dioxane at three
sites in California. Biodegradation 2015, 26, (1), 39-50.
32. Li, M.; Mathieu, J.; Yang, Y.; Fiorenza, S.; Deng, Y.; He, Z.; Zhou, J.; Alvarez, P. J. J.,
Widespread distribution of soluble di-iron monooxygenase (SDIMO) genes in arctic
groundwater impacted by 1,4-dioxane. Environmental Science and Technology 2013, 47,
(17), 9950-9958.
33. Favara, P.; Tunks, J.; Hatton, J.; DiGuiseppi, W., Sustainable Remediation
Considerations for Treatment of 1, 4‐Dioxane in Groundwater. Remediation Journal
2016, 27, (1), 133-158.
34. Orden, E. T. V. Microcosm Assessment of Aerobic Intrinsic Bioremediation and
Mineralization Potential for three 1,4 Dioxane-Impacted Sites. Rice University, Houston,
TX, 2013.
35. He, Y.; Mathieu, J.; Yang, Y.; Yu, P.; da Silva, M. L.; Alvarez, P. J., 1, 4-Dioxane
biodegradation by Mycobacterium dioxanotrophicus PH-06 is associated with a group-6
soluble di-iron monooxygenase. Environmental Science and Technology Letters 2017, 4,
(11), 494-499.
36. Deng, D.; Li, F.; Li, M., A novel propane monooxygenase initiating degradation of 1, 4-
dioxane by Mycobacterium dioxanotrophicus PH-06. Environmental Science and
Technology Letters 2017, 5, (2), 86-91.
37. Deng, D.; Li, F.; Wu, C.; Li, M., Synchronic Biotransformation of 1, 4-Dioxane and 1, 1-
Dichloroethylene by a Gram-Negative Propanotroph Azoarcus sp. DD4. Environmental
Science and Technology Letters 2018, 5, (8), 526-532.

149
38. Li, F.; Deng, D.; Li, M., Distinct Catalytic Behaviors between Two 1,4-Dioxane-
Degrading Monooxygenases: Kinetics, Inhibition, and Substrate Range. Environmental
Science and Technology 2020, 54, (3), 1898-1908.
39. Bennett, P.; Hyman, M.; Smith, C.; El Mugammar, H.; Chu, M.-Y.; Nickelsen, M.;
Aravena, R., Enrichment with carbon-13 and deuterium during monooxygenase-mediated
biodegradation of 1, 4-dioxane. Environmental Science and Technology Letters 2018, 5,
(3), 148-153.
40. Chu, M. Y. J.; Bennett, P. J.; Dolan, M. E.; Hyman, M. R.; Peacock, A. D.; Bodour, A.;
Anderson, R. H.; Mackay, D. M.; Goltz, M. N., Concurrent treatment of 1, 4‐dioxane and
chlorinated aliphatics in a groundwater recirculation system via aerobic cometabolism.
Groundwater Monitoring and Remediation 2018, 38, (3), 53-64.
41. Li, M.; Fiorenza, S.; Chatham, J. R.; Mahendra, S.; Alvarez, P. J., 1, 4-Dioxane
biodegradation at low temperatures in Arctic groundwater samples. Water Research
2010, 44, (9), 2894-2900.
42. Bell, C.; McDonough, J.; Houston, K. S.; Gerber, K., Stable Isotope Probing to Confirm
Field‐Scale Co‐Metabolic Biodegradation of 1, 4‐Dioxane. Remediation Journal 2016,
27, (1), 47-59.
43. Renn, T. In Field-Scale In Situ Biostimulation Pilot Study for 1, 4-Dioxane Groundwater
Plume Source Area, Remediation of Chlorinated and Recalcitrant Compounds, Monterey,
CA, 2012; Monterey, CA, 2012.
44. Rolston, H. M. Experimental demonstration and modeling of aerobic cometabolism of
1,4-dioxane by isobutane-utilizing microorganisms in aquifer microcosms. Oregon State
University, 2018.
45. Rolston, H. M.; Hyman, M. R.; Semprini, L., Aerobic cometabolism of 1,4-dioxane by
isobutane-utilizing microorganisms including Rhodococcus rhodochrous strain 21198 in
aquifer microcosms: Experimental and modeling study. Science of The Total
Environment 2019, 133688.
46. DiGuiseppi, W.; Walecka‐Hutchison, C.; Hatton, J., 1, 4‐dioxane treatment technologies.
Remediation Journal 2016, 27, (1), 71-92.
47. Lippincott, D.; Streger, S. H.; Schaefer, C. E.; Hinkle, J.; Stormo, J.; Steffan, R. J.,
Bioaugmentation and propane biosparging for in situ biodegradation of 1, 4‐dioxane.
Groundwater Monitoring and Remediation 2015, 35, (2), 81-92.
48. Isaka, K.; Udagawa, M.; Sei, K.; Ike, M., Pilot test of biological removal of 1, 4-dioxane
from a chemical factory wastewater by gel carrier entrapping Afipia sp. strain D1.
Journal of Hazardous Materials 2016, 304, 251-258.

150
49. Isaka, K.; Udagawa, M.; Kimura, Y.; Sei, K.; Ike, M., Biological wastewater treatment of
1, 4-dioxane using polyethylene glycol gel carriers entrapping Afipia sp. D1. Journal of
Bioscience and Bioengineering 2016, 121, (2), 203-208.
50. Isaka, K.; Udagawa, M.; Kimura, Y.; Sei, K.; Ike, M., Biological 1, 4-dioxane wastewater
treatment by immobilized Pseudonocardia sp. D17 on lower 1, 4-dioxane concentration.
Journal of Water and Environment Technology 2016, 14, (4), 289-301.
51. Han, T.-H.; Han, J.-S.; So, M.-H.; Seo, J.-W.; Ahn, C.-M.; Min, D. H.; Yoo, Y. S.; Cha,
D. K.; Kim, C. G., The removal of 1, 4-dioxane from polyester manufacturing process
wastewater using an up-flow biological aerated filter (UBAF) packed with tire chips.
Journal of Environmental Science and Health, Part A 2012, 47, (1), 117-129.
52. Plaehn, W. In Full-Scale Treatment of 1, 4-Dioxane Using a Bioreactor: Progress
Report, Sixth International Conference on Remediation of Chlorinated and Recalcitrant
Compounds, Monterey, CA, 2008; Monterey, CA, 2008.
53. Cordone, L.; Carlson, C.; Plaehn, W.; Shangraw, T.; Wilmoth, D., Case Study and
Retrospective: Aerobic Fixed Film Biological Treatment Process for 1,4-Dioxane at the
Lowry Landfill Superfund Site. Remediation Journal 2016, 27, (1), 159-172.
54. Mackay, D. M.; Cherry, J. A., Groundwater contamination: pump-and-treat remediation.
Environmental Science and Technology 1989, 23, (6), 630-636.
55. Grostern, A.; Sales, C. M.; Zhuang, W.-Q.; Erbilgin, O.; Alvarez-Cohen, L., Glyoxylate
metabolism is a key feature of the metabolic degradation of 1, 4-dioxane by
Pseudonocardia dioxanivorans strain CB1190. Applied and Environmental Microbiology
2012, 78, (9), 3298-3308.
56. Mahendra, S.; Petzold, C. J.; Baidoo, E. E.; Keasling, J. D.; Alvarez-Cohen, L.,
Identification of the intermediates of in vivo oxidation of 1, 4-dioxane by
monooxygenase-containing bacteria. Environmental Science and Technology 2007, 41,
(21), 7330-7336.
57. Sales, C. M.; Grostern, A.; Parales, J. V.; Parales, R. E.; Alvarez-Cohen, L., Oxidation of
the cyclic ethers 1, 4-dioxane and tetrahydrofuran by a monooxygenase in two
Pseudonocardia species. Applied and Environmental Microbiology 2013, 79, (24), 7702-
7708.
58. Kim, Y.-M.; Jeon, J.-R.; Murugesan, K.; Kim, E.-J.; Chang, Y.-S., Biodegradation of 1,
4-dioxane and transformation of related cyclic compounds by a newly isolated
Mycobacterium sp. PH-06. Biodegradation 2009, 20, (4), 511.
59. Huang, H.; Shen, D.; Li, N.; Shan, D.; Shentu, J.; Zhou, Y., Biodegradation of 1, 4-
dioxane by a novel strain and its biodegradation pathway. Water, Air, and Soil Pollution
2014, 225, (9), 2135.

151
60. Vainberg, S.; McClay, K.; Masuda, H.; Root, D.; Condee, C.; Zylstra, G. J.; Steffan, R.
J., Biodegradation of ether pollutants by Pseudonocardia sp. strain ENV478. Applied and
Environmental Microbiology 2006, 72, (8), 5218-5224.
61. Sei, K.; Oyama, M.; Kakinoki, T.; Inoue, D.; Ike, M., Isolation and characterization of
tetrahydrofuran-degrading bacteria for 1, 4-dioxane-containing wastewater treatment by
co-metabolic degradation. Journal of Water and Environment Technology 2013, 11, (1),
11-19.
62. Zhang, S.; Gedalanga, P. B.; Mahendra, S., Advances in bioremediation of 1, 4-dioxane-
contaminated waters. Journal of Environmental Management 2017, 204, 765-774.
63. Coleman, N. V.; Bui, N. B.; Holmes, A. J., Soluble di‐iron monooxygenase gene
diversity in soils, sediments and ethene enrichments. Environmental Microbiology 2006,
8, (7), 1228-1239.
64. Mahendra, S.; Alvarez-Cohen, L., Kinetics of 1, 4-dioxane biodegradation by
monooxygenase-expressing bacteria. Environmental Science and Technology 2006, 40,
(17), 5435-5442.
65. Mahendra, S.; Grostern, A.; Alvarez-Cohen, L., The impact of chlorinated solvent co-
contaminants on the biodegradation kinetics of 1, 4-dioxane. Chemosphere 2013, 91, (1),
88-92.
66. Grostern, A.; Alvarez‐Cohen, L., RubisCO‐based CO2 fixation and C1 metabolism in the
actinobacterium P seudonocardia dioxanivorans CB 1190. Environmental Microbiology
2013, 15, (11), 3040-3053.
67. Zhang, S.; Gedalanga, P. B.; Mahendra, S., Biodegradation kinetics of 1, 4-dioxane in
chlorinated solvent mixtures. Environmental Science and Technology 2016, 50, (17),
9599-9607.
68. Wilson, J. T.; Mills, J. C.; Wilson, B. H.; Ferrey, M. L.; Freedman, D. L.; Taggart, D.,
Using qPCR Assays to Predict Rates of Cometabolism of TCE in Aerobic Groundwater.
Groundwater Monitoring and Remediation 2019, 39, (2), 53-63.
69. Barajas-Rodriguez, F. J.; Freedman, D. L., Aerobic biodegradation kinetics for 1, 4-
dioxane under metabolic and cometabolic conditions. Journal of Hazardous Materials
2018, 350, 180-188.
70. Kotani, T.; Kawashima, Y.; Yurimoto, H.; Kato, N.; Sakai, Y., Gene structure and
regulation of alkane monooxygenases in propane-utilizing Mycobacterium sp. TY-6 and
Pseudonocardia sp. TY-7. Journal of Bioscience and Bioengineering 2006, 102, (3), 184-
192.
71. Deng, D.; Li, F.; Li, M., A Novel Propane Monooxygenase Initiating Degradation of 1,4-
Dioxane by Mycobacterium dioxanotrophicus PH-06. Environmental Science &
Technology Letters 2018, 5, (2), 86-91.

152
72. Tupa, P. R.; Masuda, H., Genomic analysis of propane metabolism in methyl tert-butyl
ether-degrading Mycobacterium sp. strain ENV421. Journal of Genomics 2018, 6, 24-29.
73. Tupa, P. R.; Masuda, H., Comparative proteomic analysis of propane metabolism in
Mycobacterium sp. strain ENV421 and Rhodococcus sp. strain ENV425. Journal of
Molecular Microbiology and Biotechnology 2018, 28, (3), 107-115.
74. Masuda, H.; McClay, K.; Steffan, R. J.; Zylstra, G. J., Characterization of three propane-
inducible oxygenases in Mycobacterium sp. strain ENV421. Letters in Applied
Microbiology 2012, 55, (3), 175-181.
75. Young, J.; Braun, W.; Gehring, P.; Horvath, B.; Daniel, R., 1, 4-Dioxane and β-
hydroxyethoxyacetic acid excretion in urine of humans exposed to dioxane vapors.
Toxicology and Applied Pharmacology 1976, 38, (3), 643-646.
76. Young, J.; Braun, W.; Gehring, P., Dose‐dependent fate of 1, 4‐dioxane in rats. Journal
of Toxicology and Environmental Health, 1978, 4, (5-6), 709-726.
77. Braun, W.; Young, J., Identification of β-hydroxyethoxyacetic acid as the major urinary
metabolite of 1, 4-dioxane in the rat. Toxicology and Applied Pharmacology 1977, 39,
(1), 33-38.
78. Woo, Y.-t.; Arcos, J. C.; Argus, M. F.; Griffin, G. W.; Nishiyama, K., Metabolism in
vivo of dioxane: identification of p-dioxane-2-one as the major urinary metabolite.
Biochemical Pharmacology 1977, 26, (16), 1535-1538.
79. Wenderoth, D.; Rosenbrock, P.; Abraham, W.-R.; Pieper, D.; Höfle, M., Bacterial
community dynamics during biostimulation and bioaugmentation experiments aiming at
chlorobenzene degradation in groundwater. Microbial Ecology 2003, 46, (2), 161-176.
80. Dalton, H.; Stirling, D., Co-metabolism. Philosophical Transactions of the Royal Society
of London. B, Biological Sciences 1982, 297, (1088), 481-496.
81. Soil Screening Guidance: Technical background document. In Second Edition ed.;
Agency, E. P., Ed. Office of Solid Waste and Emergency Response, United States
Environmental Protection Agency: Washington, DC, 1996.
82. McCarty, P. L., In situ bioremediation of chlorinated solvents. Current Opinion in
Biotechnology 1993, 4, (3), 323-330.
83. The drinking water standards and health advisories. In 2004 ed..; Office of Water, Ed.
United States Environmental Protection Agency: Washington, DC, 2004.
84. Maymó-Gatell, X.; Chien, Y.-t.; Gossett, J. M.; Zinder, S. H., Isolation of a bacterium
that reductively dechlorinates tetrachloroethene to ethene. Science 1997, 276, (5318),
1568-1571.

153
85. Vogel, T. M.; McCARTY, P. L., Biotransformation of tetrachloroethylene to
trichloroethylene, dichloroethylene, vinyl chloride, and carbon dioxide under
methanogenic conditions. Applied Environmental Microbiology 1985, 49, (5), 1080-
1083.
86. Dang, H.; Kanitkar, Y. H.; Stedtfeld, R. D.; Hatzinger, P. B.; Hashsham, S. A.; Cupples,
A. M., Abundance of Chlorinated Solvent and 1, 4-Dioxane Degrading Microorganisms
at Five Chlorinated Solvent Contaminated Sites Determined via Shotgun Sequencing.
Environmental Science and Technology 2018, 52, (23), 13914-13924.
87. Mattes, T. E.; Alexander, A. K.; Coleman, N. V., Aerobic biodegradation of the
chloroethenes: pathways, enzymes, ecology, and evolution. FEMS Microbiology Reviews
2010, 34, (4), 445-475.
88. He, J.; Ritalahti, K. M.; Yang, K.-L.; Koenigsberg, S. S.; Löffler, F. E., Detoxification of
vinyl chloride to ethene coupled to growth of an anaerobic bacterium. Nature 2003, 424,
(6944), 62.
89. Vainberg, S.; Condee, C. W.; Steffan, R. J., Large-scale production of bacterial consortia
for remediation of chlorinated solvent-contaminated groundwater. Journal of Industrial
Microbiology and Biotechnology 2009, 36, (9), 1189-1197.
90. Schaefer, C. E.; Towne, R. M.; Vainberg, S.; McCray, J. E.; Steffan, R. J.,
Bioaugmentation for treatment of dense non-aqueous phase liquid in fractured sandstone
blocks. Environmental Science and Technology 2010, 44, (13), 4958-4964.
91. Shen, W.; Chen, H.; Pan, S., Anaerobic biodegradation of 1,4-dioxane by sludge enriched
with iron-reducing microorganisms. Bioresource Technology 2008, 99, (7), 2483-2487.
92. Parales, R. E.; Adamus, J. E.; White, N.; May, H. D., Degradation of 1,4-dioxane by an
actinomycete in pure culture. Applied and Environmental Microbiology 1994, 60, (12),
4527-4530.
93. Li, M.; Yang, Y.; He, Y.; Mathieu, J.; Yu, C.; Li, Q.; Alvarez, P. J. J., Detection and cell
sorting of Pseudonocardia species by fluorescence in situ hybridization and flow
cytometry using 16S rRNA-targeted oligonucleotide probes. Applied Microbiology and
Biotechnology 2018, 102, (7), 3375-3386.
94. Mahendra, S.; Alvarez-Cohen, L., Pseudonocardia dioxanivorans sp. nov., a novel
actinomycete that grows on 1, 4-dioxane. International Journal of Systematic and
Evolutionary Microbiology 2005, 55, (2), 593-598.
95. He, Y.; Wei, K.; Si, K.; Mathieu, J.; Li, M.; Alvarez, P. J., Whole-Genome Sequence of
the 1, 4-Dioxane-Degrading Bacterium Mycobacterium dioxanotrophicus PH-06.
Genome Announcements 2017, 5, (35), e00625-17.
96. Leahy, J. G.; Batchelor, P. J.; Morcomb, S. M., Evolution of the soluble diiron
monooxygenases. FEMS Microbiology Reviews 2003, 27, (4), 449-479.

154
97. Holmes, A. J.; Coleman, N. V., Evolutionary ecology and multidisciplinary approaches to
prospecting for monooxygenases as biocatalysts. Antonie Van Leeuwenhoek 2008, 94,
(1), 75-84.
98. Gedalanga, P.; Madison, A.; Miao, Y. R.; Richards, T.; Hatton, J.; DiGuiseppi, W. H.;
Wilson, J.; Mahendra, S., A Multiple Lines of Evidence Framework to Evaluate Intrinsic
Biodegradation of 1, 4‐Dioxane. Remediation Journal 2016, 27, (1), 93-114.
99. Li, M.; Liu, Y.; He, Y.; Mathieu, J.; Hatton, J.; DiGuiseppi, W.; Alvarez, P. J., Hindrance
of 1, 4-dioxane biodegradation in microcosms biostimulated with inducing or non-
inducing auxiliary substrates. Water Research 2017, 112, 217-225.
100. He, Y.; Mathieu, J.; da Silva, M. L. B.; Li, M.; Alvarez, P. J. J., 1,4-Dioxane-degrading
consortia can be enriched from uncontaminated soils: prevalence of Mycobacterium and
soluble di-iron monooxygenase genes. Microbial Biotechnology 2018, 11, (1), 189-198.
101. Furuya, T.; Hayashi, M.; Semba, H.; Kino, K., The mycobacterial binuclear iron
monooxygenases require a specific chaperonin‐like protein for functional expression in a
heterologous host. The FEBS Journal 2013, 280, (3), 817-826.
102. Ly, M. A.; Liew, E. F.; Le, N. B.; Coleman, N. V., Construction and evaluation of
pMycoFos, a fosmid shuttle vector for Mycobacterium spp. with inducible gene
expression and copy number control. Journal of Microbiological Methods 2011, 86, (3),
320-326.
103. Cheung, S.; McCarl, V.; Holmes, A. J.; Coleman, N. V.; Rutledge, P. J., Substrate range
and enantioselectivity of epoxidation reactions mediated by the ethene-oxidising
Mycobacterium strain NBB4. Applied Microbiology and Biotechnology 2013, 97, (3),
1131-1140.
104. Laemmli, U. K., Cleavage of structural proteins during the assembly of the head of
bacteriophage T4. Nature 1970, 227, (5259), 680-685.
105. Furuya, T.; Hirose, S.; Osanai, H.; Semba, H.; Kino, K., Identification of the
monooxygenase gene clusters responsible for the regioselective oxidation of phenol to
hydroquinone in mycobacteria. Applied and Environmental Microbiology 2011, 77, (4),
1214-1220.
106. Martin, K. E.; Ozsvar, J.; Coleman, N. V., SmoXYB1C1Z of Mycobacterium sp. strain
NBB4: a soluble methane monooxygenase (sMMO)-like enzyme, active on C2 to C4
alkanes and alkenes. Applied and Environmental Microbiology 2014, 80, (18), 5801-
5806.
107. Cheung, S.; McCarl, V.; Holmes, A. J.; Coleman, N. V.; Rutledge, P. J., Substrate range
and enantioselectivity of epoxidation reactions mediated by the ethene-oxidising
Mycobacterium strain NBB4. Applied Microbiology Biotechnology 2013, 97, (3), 1131-
1140.
155
108. Kim, Y.; Arp, D. J.; Semprini, L., Kinetic and inhibition studies for the aerobic
cometabolism of 1, 1, 1‐trichloroethane, 1, 1‐dichloroethylene, and 1, 1‐dichloroethane
by a butane‐grown mixed culture. Biotechnology and Bioengineering 2002, 80, (5), 498-
508.
109. Kim, Y.; Arp, D. J.; Semprini, L., A combined method for determining inhibition type,
kinetic parameters, and inhibition coefficients for aerobic cometabolism of 1, 1, 1‐
trichloroethane by a butane‐grown mixed culture. Biotechnology and Bioengineering
2002, 77, (5), 564-576.
110. Bradford, M. M., A rapid and sensitive method for the quantitation of microgram
quantities of protein utilizing the principle of protein-dye binding. Analytical
Biochemistry 1976, 72, (1-2), 248-254.
111. Gossett, J. M., Measurement of Henry's law constants for C1 and C2 chlorinated
hydrocarbons. Environmental Science and Technology 1987, 21, (2), 202-208.
112. Darling, A. C.; Mau, B.; Blattner, F. R.; Perna, N. T., Mauve: multiple alignment of
conserved genomic sequence with rearrangements. Genome Research 2004, 14, (7),
1394-1403.
113. Li, M.; Conlon, P.; Fiorenza, S.; Vitale, R. J.; Alvarez, P. J., Rapid analysis of 1, 4‐
dioxane in groundwater by frozen micro‐extraction with gas chromatography/mass
spectrometry. Groundwater Monitoring and Remediation 2011, 31, (4), 70-76.
114. Grady Jr, C. L.; Smets, B. F.; Barbeau, D. S., Variability in kinetic parameter estimates: a
review of possible causes and a proposed terminology. Water Research 1996, 30, (3),
742-748.
115. Dolan, M. E.; McCarty, P. L., Methanotrophic chloroethene transformation capacities
and 1,1-dichloroethene transformation product toxicity. Environmental Science and
Technology 1995, 29, (11), 2741-2747.
116. Anderson, J. E.; McCarty, P. L., Effect of three chlorinated ethenes on growth rates for a
methanotrophic mixed culture. Environmental Science and Technology 1996, 30, (12),
3517-3524.
117. Doughty, D. M.; Sayavedra-Soto, L. A.; Arp, D. J.; Bottomley, P. J., Effects of
dichloroethene isomers on the induction and activity of butane monooxygenase in the
alkane-oxidizing bacterium “Pseudomonas butanovora”. Applied and Environmental
Microbiology 2005, 71, (10), 6054-6059.
118. Ely, R. L.; Williamson, K. J.; Hyman, M. R.; Arp, D. J., Cometabolism of chlorinated
solvents by nitrifying bacteria: kinetics, substrate interactions, toxicity effects, and
bacterial response. Biotechnology and Bioengineering 1997, 54, (6), 520-534.

156
119. Arias, H. R.; Bhumireddy, P.; Bouzat, C., Molecular mechanisms and binding site
locations for noncompetitive antagonists of nicotinic acetylcholine receptors. The
International Journal of Biochemistry and Cell Biology 2006, 38, (8), 1254-1276.
120. Keenan, J.; Strand, S.; Stensel, H., Degradation kinetics of chlorinated solvents by a
propane-oxidizing enrichment culture. In Bioremediation of Chlorinated and Polycyclic
Aromatic Hydrocarbon Compunds, Lewis Publishers: 1994; pp 1-11.
121. Grostern, A.; Chan, W. W. M.; Edwards, E. A., 1,1,1-Trichloroethane and 1,1-
dichloroethane reductive dechlorination kinetics and co-contaminant effects in a
Dehalobacter-containing mixed culture. Environmental Science and Technology 2009,
43, (17), 6799-6807.
122. Halsey, K. H.; Sayavedra-Soto, L. A.; Bottomley, P. J.; Arp, D. J., Trichloroethylene
degradation by butane-oxidizing bacteria causes a spectrum of toxic effects. Applied
Microbiology and Biotechnology 2005, 68, (6), 794-801.
123. Lontoh, S.; Semrau, J. D., Methane and trichloroethylene degradation by Methylosinus
trichosporium OB3b dxpressing particulate methane monooxygenase. Applied and
Environmental Microbiology 1998, 64, (3), 1106-1114.
124. Atkins, G. L.; Nimmo, I. A., Current trends in the estimation of Michaelis-Menten
parameters. Analytical Biochemistry 1980, 104, (1), 1-9.
125. Belpoggi, F.; Soffritti, M.; Maltoni, C., Methyl-tertiary-butyl ether (MTBE)—a gasoline
additive—causes testicular and lympho haematopoietic cancers in rats. Toxicology and
Industrial Health 1995, 11, (2), 119-149.
126. Coleman, N. V.; Yau, S.; Wilson, N. L.; Nolan, L. M.; Migocki, M. D.; Ly, M.-a.;
Crossett, B.; Holmes, A. J., Untangling the multiple monooxygenases of Mycobacterium
chubuense strain NBB4, a versatile hydrocarbon degrader. Environmental Microbiology
Reports 2011, 3, (3), 297-307.
127. Steffan, R. J.; McClay, K.; Vainberg, S.; Condee, C. W.; Zhang, D., Biodegradation of
the gasoline oxygenates methyl tert-butyl ether, ethyl tert-butyl ether, and tert-amyl
methyl ether by propane-oxidizing bacteria. Applied and Environmental Microbiology
1997, 63, (11), 4216-4222.
128. Shields-Menard, S. A.; Brown, S. D.; Klingeman, D. M.; Indest, K.; Hancock, D.;
Wewalwela, J. J.; French, W. T.; Donaldson, J. R., Draft genome sequence of
Rhodococcus rhodochrous strain ATCC 21198. Genome Announcements 2014, 2, (1),
e00054-14.
129. Cappelletti, M.; Presentato, A.; Milazzo, G.; Turner, R. J.; Fedi, S.; Frascari, D.; Zannoni,
D., Growth of Rhodococcus sp. strain BCP1 on gaseous n-alkanes: new metabolic
insights and transcriptional analysis of two soluble di-iron monooxygenase genes.
Frontiers in Microbiology 2015, 6, 393.

157
130. Frascari, D.; Pinelli, D.; Nocentini, M.; Fedi, S.; Pii, Y.; Zannoni, D., Chloroform
degradation by butane-grown cells of Rhodococcus aetherovorans BCP1. Applied
Microbiology and Biotechnology 2006, 73, (2), 421-428.
131. Sales, C. M.; Mahendra, S.; Grostern, A.; Parales, R. E.; Goodwin, L. A.; Woyke, T.;
Nolan, M.; Lapidus, A.; Chertkov, O.; Ovchinnikova, G., Genome Sequence of the 1, 4-
Dioxane-Degrading Pseudonocardia dioxanivorans Strain CB1190. Journal of
Bacteriology 2011, 193, (17), 4549-4550.
132. Yamamoto, N.; Saito, Y.; Inoue, D.; Sei, K.; Ike, M., Characterization of newly isolated
Pseudonocardia sp. N23 with high 1, 4-dioxane-degrading ability. Journal of Bioscience
and Bioengineering 2018, 125, (5), 552-558.
133. Kohlweyer, U.; Thiemer, B.; Schräder, T.; Andreesen, J. R., Tetrahydrofuran degradation
by a newly isolated culture of Pseudonocardia sp. strain K1. FEMS Microbiology Letters
2000, 186, (2), 301-306.
134. Thiemer, B.; Andreesen, J. R.; Schräder, T., Cloning and characterization of a gene
cluster involved in tetrahydrofuran degradation in Pseudonocardia sp. strain K1.
Archives of Microbiology 2003, 179, (4), 266-277.
135. Masuda, H.; McClay, K.; Steffan, R. J.; Zylstra, G. J., Biodegradation of tetrahydrofuran
and 1, 4-dioxane by soluble diiron monooxygenase in Pseudonocardia sp. strain
ENV478. Journal of Molecular Microbiology and Biotechnology 2012, 22, (5), 312-316.
136. Yao, Y.; Lv, Z.; Min, H.; Lv, Z.; Jiao, H., Isolation, identification and characterization of
a novel Rhodococcus sp. strain in biodegradation of tetrahydrofuran and its medium
optimization using sequential statistics-based experimental designs. Bioresource
Technology 2009, 100, (11), 2762-2769.
137. Rojo, F., Enzymes for aerobic degradation of alkanes. In Handbook of hydrocarbon and
lipid microbiology, 2010; pp 781-797.
138. Zhou, Y.; Huang, H.; Shen, D., Multi-substrate biodegradation interaction of 1, 4-dioxane
and BTEX mixtures by Acinetobacter baumannii DD1. Biodegradation 2016, 27, (1), 37-
46.
139. Paul Hare, M. H. In Aerobic degradation of 1,4-dioxane in a fixed-film bioreactor with
toluene, other volatiles and phenolics as co-contaminants, Eleventh (11th) International
Conference on the Remediation of Chlorinated and Recalcitrant Compounds, Palm
Springs, California, 2018; Palm Springs, California, 2018.
140. Bartsch, H.; Montesano, R., Mutagenic and carcinogenic effects of vinyl chloride.
Mutation Research/Reviews in Genetic Toxicology 1975, 32, (2), 93-113.
141. Griffin, B. M.; Tiedje, J. M.; Löffler, F. E., Anaerobic microbial reductive dechlorination
of tetrachloroethene to predominately trans-1,2-dichloroethene. Environmental Science
and Technology 2004, 38, (16), 4300-4303.

158
142. Toxicological profile for benzene. In Services, U. S. D. o. H. a. H., Ed. Atlanta, Georgia,
2007.
143. Alvarez, P. J.; Illman, W. A., Bioremediation and natural attenuation: process
fundamentals and mathematical models. John Wiley & Sons: 2005; Vol. 27.
144. Holmes, A. J., The diversity of soluble di-iron monooxygenases with bioremediation
applications. In Advances in Applied Bioremediation, Singh, A.; Kuhad, R. C.; Ward, O.
P., Eds. Springer Berlin Heidelberg: Berlin, Heidelberg, 2009; pp 91-102.
145. Gaze, W. H.; Zhang, L.; Abdouslam, N. A.; Hawkey, P. M.; Calvo-Bado, L.; Royle, J.;
Brown, H.; Davis, S.; Kay, P.; Boxall, A. B., Impacts of anthropogenic activity on the
ecology of class 1 integrons and integron-associated genes in the environment. The ISME
Journal 2011, 5, (8), 1253.
146. Gaze, W. H.; Krone, S. M.; Larsson, D. J.; Li, X.-Z.; Robinson, J. A.; Simonet, P.;
Smalla, K.; Timinouni, M., Influence of humans on evolution and mobilization of
environmental antibiotic resistome. Emerging Infectious Diseases 2013, 19, (7).
147. Hatzinger, P. B.; Banerjee, R.; Rezes, R.; Streger, S. H.; McClay, K.; Schaefer, C. E.,
Potential for cometabolic biodegradation of 1,4-dioxane in aquifers with methane or
ethane as primary substrates. Biodegradation 2017, 28, (5), 453-468.
148. Notomista, E.; Lahm, A.; Di Donato, A.; Tramontano, A., Evolution of bacterial and
archaeal multicomponent monooxygenases. Journal of Molecular Evolution 2003, 56,
(4), 435-445.
149. Osborne, C. D.; Haritos, V. S., Beneath the surface: Evolution of methane activity in the
bacterial multicomponent monooxygenases. Molecular Phylogenetics and Evolution
2019, 139, 106527.
150. Madhavan, A.; Sindhu, R.; Parameswaran, B.; Sukumaran, R. K.; Pandey, A.,
Metagenome Analysis: a Powerful Tool for Enzyme Bioprospecting. Applied
Biochemistry and Biotechnology 2017, 183, (2), 636-651.
151. Rosenzweig, A. C.; Frederick, C. A.; Lippard, S. J., Crystal structure of a bacterial non-
haem iron hydroxylase that catalyses the biological oxidation of methane. Nature 1993,
366, (6455), 537-543.
152. Edgar, R. C., MUSCLE: multiple sequence alignment with high accuracy and high
throughput. Nucleic Acids Research 2004, 32, (5), 1792-1797.
153. Guindon, S.; Dufayard, J.-F.; Lefort, V.; Anisimova, M.; Hordijk, W.; Gascuel, O., New
algorithms and methods to estimate maximum-likelihood phylogenies: assessing the
performance of PhyML 3.0. Systematic Biology 2010, 59, (3), 307-321.
154. Darriba, D.; Taboada, G. L.; Doallo, R.; Posada, D., ProtTest 3: fast selection of best-fit
models of protein evolution. Bioinformatics 2011, 27, (8), 1164-1165.

159
155. Letunic, I.; Bork, P., Interactive tree of life (iTOL) v3: an online tool for the display and
annotation of phylogenetic and other trees. Nucleic Acids Research 2016, 44, (W1),
W242-W245.
156. Kotani, T.; Yamamoto, T.; Yurimoto, H.; Sakai, Y.; Kato, N., Propane monooxygenase
and NAD+-dependent secondary alcohol dehydrogenase in propane metabolism by
Gordonia sp. strain TY-5. Journal of Bacteriology 2003, 185, (24), 7120-7128.
157. Sharp, J. O.; Sales, C. M.; Alvarez-Cohen, L., Functional characterization of propane-
enhanced N-nitrosodimethylamine degradation by two actinomycetales. Biotechnology
and Bioengineering 2010, 107, (6), 924-932.
158. Robrock, K. R.; Mohn, W. W.; Eltis, L. D.; Alvarez-Cohen, L., Biphenyl and
ethylbenzene dioxygenases of Rhodococcus jostii RHA1 transform PBDEs.
Biotechnology and Bioengineering 2011, 108, (2), 313-321.
159. Weerdenburg, E. M.; Abdallah, A. M.; Rangkuti, F.; Otto, T. D.; El Ghany, M. A.;
Adroub, S. A.; Molenaar, D.; Ummels, R.; ter Veen, K.; van Stempvoort, G., Pathogenic
mycobacteria customize their virulence mechanisms for intracellular replication in
different hosts. In 2014; pp 115-143.
160. Amábile-Cuevas, C. F.; Chicurel, M. E., Bacterial plasmids and gene flux. Cell 1992, 70,
(2), 189-199.
161. Ochman, H.; Lawrence, J. G.; Groisman, E. A., Lateral gene transfer and the nature of
bacterial innovation. Nature 2000, 405, (6784), 299.
162. Nordlund, I.; Powlowski, J.; Shingler, V., Complete nucleotide sequence and polypeptide
analysis of multicomponent phenol hydroxylase from Pseudomonas sp. strain CF600.
Journal of Bacteriology 1990, 172, (12), 6826-6833.
163. Shingler, V.; Franklin, F. C. H.; Tsuda, M.; Holroyd, D.; Bagdasarian, M., Molecular
analysis of a plasmid-encoded phenol hydroxylase from Pseudomonas CF600.
Microbiology 1989, 135, (5), 1083-1092.
164. Herrmann, H.; Janke, D.; Krejsa, S.; Kunze, I., Involvement of the plasmid pPGH1 in the
phenol degradation of Pseudomonas putida strain H. FEMS Microbiology Letters 1987,
43, (2), 133-137.
165. Herrmann, H.; Müller, C.; Schmidt, I.; Mahnke, J.; Petruschka, L.; Hahnke, K.,
Localization and organization of phenol degradation genes of Pseudomonas putida strain
H. Molecular and General Genetics MGG 1995, 247, (2), 240-246.
166. Ng, L. C.; Shingle, V.; Sze, C. C.; Poh, C. L., Cloning and sequences of the first eight
genes of the chromosomally encoded (methyl) phenol degradation pathway from
Pseudomonas putida P35X. Gene 1994, 151, (1-2), 29-36.

160
167. Ehrt, S.; Schirmer, F.; Hillen, W., Genetic organization, nucleotide sequence and
regulation of expression of genes encoding phenol hydroxylase and catechol 1, 2‐dioxygenase in Acinetobacter calcoaceticus NCIB8250. Molecular Microbiology 1995,
18, (1), 13-20.
168. Horinouchi, M.; Kasuga, K.; Nojiri, H.; Yamane, H.; Omori, T., Cloning and
characterization of genes encoding an enzyme which oxidizes dimethyl sulfide in
Acinetobacter sp. strain 20B. FEMS Microbiology Letters 1997, 155, (1), 99-105.
169. Iwashita, S.; Shim, H.; Wood, T. K., Directed evolution of toluene ortho-monooxygenase
for enhanced 1-naphthol synthesis and chlorinated ethene degradation. Journal of
Bacteriology 2002, 184, (2), 344-349.
170. Shields, M.; Reagin, M.; Gerger, R.; Campbell, R.; Somerville, C., TOM, a new aromatic
degradative plasmid from Burkholderia (Pseudomonas) cepacia G4. Applied and
Environmental Microbiology 1995, 61, (4), 1352-1356.
171. Johnson, G. R.; Olsen, R. H., Nucleotide sequence analysis of genes encoding a
toluene/benzene-2-monooxygenase from Pseudomonas sp. strain JS150. Applied and
Environmental Microbiology 1995, 61, (9), 3336-3346.
172. Arai, H.; Akahira, S.; Ohishi, T.; Maeda, M.; Kudo, T., Adaptation of Cornamonas
testosteroni TAM1 to utilize phenol: organization and regulation of the genes involved in
phenol degradatio. Microbiology 1998, 144, (10), 2895-2903.
173. Teramoto, M.; Futamata, H.; Harayama, S.; Watanabe, K., Characterization of a high-
affinity phenol hydroxylase from Comamonas testosteroni R5 by gene cloning, and
expression in Pseudomonas aeruginosa PAO1c. Molecular and General Genetics MGG
1999, 262, (3), 552-558.
174. Hino, S.; Watanabe, K.; Takahashi, N., Phenol hydroxylase cloned from Ralstonia
eutropha strain E2 exhibits novel kinetic properties. Microbiology 1998, 144, (7), 1765-
1772.
175. Yen, K.-M.; Karl, M. R.; Blatt, L. M.; Simon, M. J.; Winter, R. B.; Fausset, P. R.; Lu, H.
S.; Harcourt, A. A.; Chen, K. K., Cloning and characterization of a Pseudomonas
mendocina KR1 gene cluster encoding toluene-4-monooxygenase. Journal of
Bacteriology 1991, 173, (17), 5315-5327.
176. Yen, K.; Karl, M. R., Identification of a new gene, tmoF, in the Pseudomonas mendocina
KR1 gene cluster encoding toluene-4-monooxygenase. Journal of Bacteriology 1992,
174, (22), 7253-7261.
177. Bertoni, G.; Martino, M.; Galli, E.; Barbieri, P., Analysis of the gene cluster encoding
toluene/o-xylene monooxygenase from Pseudomonas stutzeri OX1. Applied and
Environmental Microbiology 1998, 64, (10), 3626-3632.
161
178. Byrne, A. M.; Olsen, R. H., Cascade regulation of the toluene-3-monooxygenase operon
(tbuA1UBVA2C) of Burkholderia pickettii PKO1: role of the tbuA1 promoter (PtbuA1) in
the expression of its cognate activator, TbuT. Journal of Bacteriology 1996, 178, (21),
6327-6337.
179. Zhou, N.-Y.; Jenkins, A.; Chion, C. K. C. K.; Leak, D. J., The alkene monooxygenase
from Xanthobacter strain Py2 is closely related to aromatic monooxygenases and
catalyzes aromatic monohydroxylation of benzene, toluene, and phenol. Applied and
Environmental Microbiology 1999, 65, (4), 1589-1595.
180. Krum, J. G.; Ensign, S. A., Evidence that a Linear Megaplasmid Encodes Enzymes of
Aliphatic Alkene and Epoxide Metabolism and Coenzyme M (2-
Mercaptoethanesulfonate) Biosynthesis in Xanthobacter Strain Py2. Journal of
Bacteriology 2001, 183, (7), 2172-2177.
181. Ayoubi, P. J.; Harker, A. R., Whole-cell kinetics of trichloroethylene degradation by
phenol hydroxylase in a Ralstonia eutropha JMP134 derivative. Applied and
Environmental Microbiology 1998, 64, (11), 4353-4356.
182. van Hylckama Vlieg, J. E.; Leemhuis, H.; Spelberg, J. H. L.; Janssen, D. B.,
Characterization of the gene cluster involved in isoprene metabolism in Rhodococcus sp.
strain AD45. Journal of Bacteriology 2000, 182, (7), 1956-1963.
183. Millacura, F. A.; Cardenas, F.; Mendez, V.; Seeger, M.; Rojas, L. A., Degradation of
benzene by the heavy-metal resistant bacterium Cupriavidus metallidurans CH34 reveals
its catabolic potential for aromatic compounds. bioRxiv 2017, 164517.
184. Bouhajja, E.; McGuire, M.; Liles, M. R.; Bataille, G.; Agathos, S. N.; George, I. F.,
Identification of novel toluene monooxygenase genes in a hydrocarbon-polluted sediment
using sequence-and function-based screening of metagenomic libraries. Applied
Microbiology and Biotechnology 2017, 101, (2), 797-808.
185. Deng, D.; Li, F.; Ye, L.; Li, M., Complete Genome Sequence of Azoarcus sp. Strain
DD4, a Gram-Negative Propanotroph That Degrades 1,4-Dioxane and 1,1-
Dichloroethylene. Microbiology Resource Announcements 2019, 8, (33), e00775-19.
186. Stainthorpe, A.; Lees, V.; Salmond, G. P.; Dalton, H.; Murrell, J. C., The methane
monooxygenase gene cluster of Methylococcus capsulatus (Bath). Gene 1990, 91, (1),
27-34.
187. Stainthorpe, A. C.; Murrell, J. C.; Salmond, G. P.; Dalton, H.; Lees, V., Molecular
analysis of methane monooxygenase from Methylococcus capsulatus (Bath). Archives of
Microbiology 1989, 152, (2), 154-159.
188. Shigematsu, T.; Hanada, S.; Eguchi, M.; Kamagata, Y.; Kanagawa, T.; Kurane, R.,
Soluble methane monooxygenase gene clusters from trichloroethylene-degrading
Methylomonas sp. strains and detection of methanotrophs during in situ bioremediation.
Applied and Environmental Microbiology 1999, 65, (12), 5198-5206.

162
189. Cardy, D.; Laidler, V.; Salmond, G.; Murrell, J., Molecular analysis of the methane
monooxygenase (MMO) gene cluster of Methylosinus trichosporium OB3b. Molecular
Microbiology 1991, 5, (2), 335-342.
190. Cardy, D.; Laidler, V.; Salmond, G.; Murrell, J., The methane monooxygenase gene
cluster of Methylosinus trichosporium: cloning and sequencing of the mmoC gene.
Microbiology 1991, 156, (6), 477-483.
191. McDonald, I.; Uchiyama, H.; Kambe, S.; Yagi, O.; Murrell, J., The soluble methane
monooxygenase gene cluster of the trichloroethylene-degrading methanotroph
Methylocystis sp. strain M. Applied and Environmental Microbiology 1997, 63, (5), 1898-
1904.
192. Grosse, S.; Laramee, L.; Wendlandt, K.-D.; McDonald, I. R.; Miguez, C. B.; Kleber, H.-
P., Purification and Characterization of the Soluble Methane Monooxygenase of the Type
II Methanotrophic Bacterium Methylocystis sp. Strain WI 14. Applied and Environmental
Microbiology 1999, 65, (9), 3929-3935.
193. Saitoh, S.; Aoyama, H.; Akutsu, M.; Nakano, K.; Shinzato, N.; Matsui, T., Genomic
sequencing-based detection of large deletions in Rhodococcus rhodochrous strain B-276.
Journal of Bioscience and Bioengineering 2013, 116, (3), 309-312.
194. Garcia, M. J.; Gola, S., Gene and whole genome analyses reveal that the mycobacterial
strain JS 623 is not a member of the species Mycobacterium smegmatis. Microbial
Biotechnology 2016, 9, (2), 269-274.
195. Mattes, T. E.; Coleman, N. V.; Spain, J. C.; Gossett, J. M., Physiological and molecular
genetic analyses of vinyl chloride and ethene biodegradation in Nocardioides sp. strain
JS614. Archives of Microbiology 2005, 183, (2), 95-106.
196. Kurokawa, S.; Kabayama, J.; Hwang, S. D.; Nho, S. W.; Hikima, J.-i.; Jung, T. S.;
Kondo, H.; Hirono, I.; Takeyama, H.; Mori, T., Whole genome analyses of marine fish
pathogenic isolate, Mycobacterium sp. 012931. Marine Biotechnology 2014, 16, (5), 572-
579.
197. Rhodes, M. W.; Kator, H.; McNabb, A.; Deshayes, C.; Reyrat, J.-M.; Brown-Elliott, B.
A.; Wallace Jr, R.; Trott, K. A.; Parker, J. M.; Lifland, B., Mycobacterium pseudoshottsii
sp. nov., a slowly growing chromogenic species isolated from Chesapeake Bay striped
bass (Morone saxatilis). International Journal of Systematic and Evolutionary
Microbiology 2005, 55, (3), 1139-1147.
198. Das, S.; Pettersson, B. F.; Behra, P. R. K.; Mallick, A.; Cheramie, M.; Ramesh, M.;
Shirreff, L.; DuCote, T.; Dasgupta, S.; Ennis, D. G., Extensive genomic diversity among
Mycobacterium marinum strains revealed by whole genome sequencing. Scientific
Reports 2018, 8, (1), 1-15.

163
199. Saad, J.; Combe, M.; Hammoudi, N.; Couppié, P.; Blaizot, R.; Jedir, F.; Gozlan, R. E.;
Drancourt, M.; Bouam, A., Whole-Genome Sequence of <span class="named-
content genus-species" id="named-content-1">Mycobacterium
ulcerans</span> CSURP7741, a French Guianan Clinical Isolate. Microbiology
Resource Announcements 2019, 8, (29), e00215-19.
200. Phelippeau, M.; Croce, O.; Robert, C.; Raoult, D.; Drancourt, M., Draft Genome
Sequence of Mycobacterium lentiflavum CSUR P1491. Genome Announcements 2015, 3,
(4), e00817-15.
201. Guéret, C.; Daroux, M.; Billaud, F., Methane pyrolysis: thermodynamics. Chemical
Engineering Science 1997, 52, (5), 815-827.
202. Kopp, D. A.; Lippard, S. J., Soluble methane monooxygenase: activation of dioxygen and
methane. Current Opinion in Chemical Biology 2002, 6, (5), 568-576.
203. Rosenzweig, A. C., Breaking methane. Nature 2015, 518, (7539), 309-310.
204. Dean, J. A., Lange's handbook of chemistry. Sixteenth Edition ed.; New york; London:
McGraw-Hill, Inc.: New York, 1999.
205. Kerr, J., Bond dissociation energies by kinetic methods. Chemical Reviews 1966, 66, (5),
465-500.
206. Gurvich, L.; Karachevtsev, G.; Kondrat’ev, V.; Lebedev, Y. A.; Medvedev, V.; Potapov,
V.; Khodeev, Y. S., Ionization potentials and electron affinity. In Breaking Energy of
Chemical Bonds, Nauka, Moscow, 1974.
207. Gribov, L.; Novakov, I.; Pavlyuchko, A.; Kulago, I.; Orlinson, B., “Spectroscopic”
Calculations of CH Bond Dissociation Energies for Ethane, Propane, Butane, Isobutane,
Pentane, Hexane, and Neopentane Using Fundamental Vibration Frequencies. Journal of
Structural Chemistry 2003, 44, (6), 961-969.
208. Battin, F.; Marquaire, P.; Baronnet, F.; Come, G., Products of the gas-phase pyrolysis of
1, 4-dioxane. Journal of Analytical and Applied Pyrolysis 1989, 16, (4), 345-354.
209. Cruickshank, F. R.; Benson, S. W., Kinetics and mechanism of the reaction of iodine
with tetrahydrofuran. Carbon-hydrogen bond dissociation energy in tetrahydrofuran.
Journal of the American Chemical Society 1969, 91, (6), 1289-1292.
210. Harley, C. B.; Reynolds, R. P., Analysis of E. coli pormoter sequences. Nucleic Acids
Research 1987, 15, (5), 2343-2361.
211. Schumacher, J.; Zhang, X.; Jones, S.; Bordes, P.; Buck, M., ATP-dependent
transcriptional activation by bacterial PspF AAA+ protein. Journal of Molecular Biology
2004, 338, (5), 863-875.

164
212. Neuwald, A. F.; Aravind, L.; Spouge, J. L.; Koonin, E. V., AAA+: A class of chaperone-
like ATPases associated with the assembly, operation, and disassembly of protein
complexes. Genome Research 1999, 9, (1), 27-43.
213. Bush, M.; Dixon, R., The role of bacterial enhancer binding proteins as specialized
activators of σ54-dependent transcription. Microbiology and Molecular Biology Reviews
2012, 76, (3), 497-529.
214. Csaki, R.; Bodrossy, L.; Klem, J.; Murrell, J. C.; Kovacs, K. L., Genes involved in the
copper-dependent regulation of soluble methane monooxygenase of Methylococcus
capsulatus (Bath): cloning, sequencing and mutational analysis. Microbiology 2003, 149,
(7), 1785-1795.
215. Stafford, G. P.; Scanlan, J.; McDonald, I. R.; Murrell, J. C., rpoN, mmoR and mmoG,
genes involved in regulating the expression of soluble methane monooxygenase in
Methylosinus trichosporium OB3b. Microbiology 2003, 149, (7), 1771-1784.
216. Rippe, K.; Guthold, M.; von Hippel, P. H.; Bustamante, C., Transcriptional activation via
DNA-looping: visualization of intermediates in the activation pathway of E. coli RNA
polymerase· σ54 holoenzyme by scanning force microscopy. Journal of Molecular
Biology 1997, 270, (2), 125-138.
217. Su, W.; Porter, S.; Kustu, S.; Echols, H., DNA-looping and enhancer activity: association
between DNA-bound NtrC activator and RNA polymerase at the bacterial glnA
promoter. Proceedings of the National Academy of Sciences 1990, 87, (14), 5504-5508.
218. Claverie-Martin, F.; Magasanik, B., Positive and negative effects of DNA bending on
activation of transcription from a distant site. Journal of molecular biology 1992, 227,
(4), 996-1008.
219. Perez-Martin, J.; De Lorenzo, V., Integration host factor suppresses promiscuous
activation of the sigma 54-dependent promoter Pu of Pseudomonas putida. Proceedings
of the National Academy of Sciences 1995, 92, (16), 7277-7281.
220. Swanberg, S. L.; Wang, J. C., Cloning and sequencing of the Escherichia coli gyrA gene
coding for the a subunit of DNA gyrase. Journal of Molecular Biology 1987, 197, (4),
729-736.
221. Shingler, V.; Bartilson, M.; Moore, T., Cloning and nucleotide sequence of the gene
encoding the positive regulator (DmpR) of the phenol catabolic pathway encoded by
pVI150 and identification of DmpR as a member of the NtrC family of transcriptional
activators. Journal of Bacteriology 1993, 175, (6), 1596-1604.
222. Ng, L. C.; Poh, C. L.; Shingler, V., Aromatic effector activation of the NtrC-like
transcriptional regulator PhhR limits the catabolic potential of the (methyl) phenol
degradative pathway it controls. Journal of bacteriology 1995, 177, (6), 1485-1490.

165
223. Arenghi, F. L.; Pinti, M.; Galli, E.; Barbieri, P., Identification of the Pseudomonas
stutzeri OX1 toluene–o-xylene monooxygenase regulatory gene (touR) and of its cognate
promoter. Applied and Environmental Microbiology 1999, 65, (9), 4057-4063.
224. Murrell, J. C.; McDonald, I. R.; Gilbert, B., Regulation of expression of methane
monooxygenases by copper ions. Trends in Microbiology 2000, 8, (5), 221-225.
225. Bock, C.; Kroppenstedt, R.; Diekmann, H., Degradation and bioconversion of aliphatic
and aromatic hydrocarbons by Rhodococcus ruber 219. Applied Microbiology and
Biotechnology 1996, 45, (3), 408-410.
226. Inoue, D.; Tsunoda, T.; Sawada, K.; Yamamoto, N.; Saito, Y.; Sei, K.; Ike, M., 1, 4-
Dioxane degradation potential of members of the genera Pseudonocardia and
Rhodococcus. Biodegradation 2016, 27, (4-6), 277-286.
227. van Beilen, J. B.; Holtackers, R.; Lüscher, D.; Bauer, U.; Witholt, B.; Duetz, W. A.,
Biocatalytic production of perillyl alcohol from limonene by using a novel
Mycobacterium sp. cytochrome P450 alkane hydroxylase expressed in Pseudomonas
putida. Applied and Environmental Microbiology 2005, 71, (4), 1737-1744.
228. Deng, D.; Li, F.; Wu, C.; Li, M., Synchronic Biotransformation of 1, 4-Dioxane and 1, 1-
Dichloroethylene by a Gram-Negative Propanotroph Azoarcus sp. DD4. Environmental
Science & Technology Letters 2018.
229. Deng, D.; Pham, D. N.; Li, F.; Li, M., Discovery of an Inducible Toluene
Monooxygenase that Co-oxidizes 1, 4-Dioxane and 1, 1-Dichloroethylene in
Propanotrophic Azoarcus sp. DD4. Applied and Environmental Microbiology 2020.
230. Hatzinger, P. B.; Banerjee, R.; Rezes, R.; Streger, S. H.; McClay, K.; Schaefer, C. E.,
Potential for cometabolic biodegradation of 1, 4-dioxane in aquifers with methane or
ethane as primary substrates. Biodegradation 2017, 28, (5-6), 453-468.
231. Li, W.; Jaroszewski, L.; Godzik, A., Clustering of highly homologous sequences to
reduce the size of large protein databases. Bioinformatics 2001, 17, (3), 282-283.
232. Li, W.; Godzik, A., Cd-hit: a fast program for clustering and comparing large sets of
protein or nucleotide sequences. Bioinformatics 2006, 22, (13), 1658-1659.
233. Moriya, Y.; Itoh, M.; Okuda, S.; Yoshizawa, A. C.; Kanehisa, M., KAAS: an automatic
genome annotation and pathway reconstruction server. Nucleic Acids Research 2007, 35,
W182-5.
234. Ricken, B.; Kolvenbach, B. A.; Bergesch, C.; Benndorf, D.; Kroll, K.; Strnad, H.; Vlček,
Č.; Adaixo, R.; Hammes, F.; Shahgaldian, P.; Schäffer, A.; Kohler, H.-P. E.; Corvini, P.
F. X., FMNH2-dependent monooxygenases initiate catabolism of sulfonamides in
Microbacterium sp. strain BR1 subsisting on sulfonamide antibiotics. Scientific Reports
2017, 7, (1), 15783.

166
235. Valton, J.; Filisetti, L.; Fontecave, M.; Nivière, V., A Two-component Flavin-dependent
Monooxygenase Involved in Actinorhodin Biosynthesis in Streptomyces coelicolor.
Journal of Biological Chemistry 2004, 279, (43), 44362-44369.
236. Singh, R.; Lemire, J.; Mailloux, R. J.; Chénier, D.; Hamel, R.; Appanna, V. D., An ATP
and oxalate generating variant tricarboxylic acid cycle counters aluminum toxicity in
Pseudomonas fluorescens. PLoS one 2009, 4, (10), e7344.
237. Chang, Y.-Y.; Wang, A.-Y.; Cronan, J. E., Molecular cloning, DNA sequencing, and
biochemical analyses of Escherichia coli glyoxylate carboligase. An enzyme of the
acetohydroxy acid synthase-pyruvate oxidase family. Journal of Biological Chemistry
1993, 268, (6), 3911-3919.
238. Pellicer, M. T.; Badía, J.; Aguilar, J.; Baldomà, L., glc locus of Escherichia coli:
characterization of genes encoding the subunits of glycolate oxidase and the glc regulator
protein. Journal of Bacteriology 1996, 178, (7), 2051.
239. Gedalanga, P. B.; Pornwongthong, P.; Mora, R.; Chiang, S.-Y. D.; Baldwin, B.; Ogles,
D.; Mahendra, S., Identification of Biomarker Genes To Predict Biodegradation of 1,4-
Dioxane. Applied and Environmental Microbiology 2014, 80, (10), 3209.
240. Kelley, S. L.; Aitchison, E. W.; Deshpande, M.; Schnoor, J. L.; Alvarez, P. J.,
Biodegradation of 1, 4-dioxane in planted and unplanted soil: effect of bioaugmentation
with Amycolata sp. CB1190. Water Research 2001, 35, (16), 3791-3800.
241. Masuda, H. Identification and characterization of monooxygenase enzymes involved in 1,
4-dioxane degradation in Pseudonocardia sp. strain ENV478, Mycobacterium sp. strain
ENV421, and Nocardia sp. strain ENV425. Rutgers University, New Brunswick, 2009.
242. Newman, L. M.; Wackett, L. P., Purification and characterization of toluene 2-
monooxygenase from Burkholderia cepacia G4. Biochemistry 1995, 34, (43), 14066-
14076.
243. Paune, F.; Caixach, J.; Espadaler, I.; Om, J.; Rivera, J., Assessment on the removal of
organic chemicals from raw and drinking water at a Llobregat river water works plant
using GAC. Water Research 1998, 32, (11), 3313-3324.
244. Kim, Y. M.; Jeon, J. R.; Murugesan, K.; Kim, E. J.; Chang, Y. S., Biodegradation of 1,4-
dioxane and transformation of related cyclic compounds by a newly isolated
Mycobacterium sp. PH-06. Biodegradation 2009, 20, (4), 511-519.
245. Park, J.-W.; Krumins, V.; Kjellerup, B. V.; Fennell, D. E.; Rodenburg, L. A.; Sowers, K.
R.; Kerkhof, L. J.; Häggblom, M. M., The effect of co-substrate activation on indigenous
and bioaugmented PCB dechlorinating bacterial communities in sediment microcosms.
Applied Microbiology and Biotechnology 2011, 89, (6), 2005-2017.
246. Větrovský, T.; Baldrian, P., The variability of the 16S rRNA gene in bacterial genomes
and its consequences for bacterial community analyses. PloS one 2013, 8, (2).

167
247. Yu, Y.; Lee, C.; Kim, J.; Hwang, S., Group‐specific primer and probe sets to detect
methanogenic communities using quantitative real‐time polymerase chain reaction.
Biotechnology and Bioengineering 2005, 89, (6), 670-679.
248. Martin, M., Cutadapt removes adapter sequences from high-throughput sequencing reads.
EMBnet. Journal 2011, 17, (1), 10-12.
249. Rognes, T.; Flouri, T.; Nichols, B.; Quince, C.; Mahé, F., VSEARCH: a versatile open
source tool for metagenomics. PeerJ 2016, 4, e2584.
250. Caporaso, J. G.; Kuczynski, J.; Stombaugh, J.; Bittinger, K.; Bushman, F. D.; Costello, E.
K.; Fierer, N.; Pena, A. G.; Goodrich, J. K.; Gordon, J. I., QIIME allows analysis of high-
throughput community sequencing data. Nature Methods 2010, 7, (5), 335.
251. Wang, Q.; Garrity, G. M.; Tiedje, J. M.; Cole, J. R., Naive Bayesian classifier for rapid
assignment of rRNA sequences into the new bacterial taxonomy. Applied and
Environmental Microbiology 2007, 73, (16), 5261-5267.
252. Müllner, D., fastcluster: Fast hierarchical, agglomerative clustering routines for R and
Python. Journal of Statistical Software 2013, 53, (9), 1-18.
253. Wilkinson, L.; Friendly, M., The history of the cluster heat map. The American
Statistician 2009, 63, (2), 179-184.
254. Volatile organic compounds by gas chromatography/mass spectrometry (GC/MS). In
United States Environmental Protection Agency: 2006.
255. Inoue, D.; Tsunoda, T.; Yamamoto, N.; Ike, M.; Sei, K., 1, 4-Dioxane degradation
characteristics of Rhodococcus aetherivorans JCM 14343. Biodegradation 2018, 29, (3),
301-310.
256. Cappelletti, M.; Pinelli, D.; Fedi, S.; Zannoni, D.; Frascari, D., Aerobic co‐metabolism of
1, 1, 2, 2‐tetrachloroethane by Rhodococcus aetherivorans TPA grown on propane:
kinetic study and bioreactor configuration analysis. Journal of Chemical Technology &
Biotechnology 2018, 93, (1), 155-165.
257. Coleman, N. V.; Le, N. B.; Ly, M. A.; Ogawa, H. E.; McCarl, V.; Wilson, N. L.; Holmes,
A. J., Hydrocarbon monooxygenase in Mycobacterium: recombinant expression of a
member of the ammonia monooxygenase superfamily. The ISME Journal 2012, 6, (1),
171-182.
258. Vestal, J.; Perry, J. J., Divergent metabolic pathways for propane and propionate
utilization by a soil isolate. Journal of Bacteriology 1969, 99, (1), 216-221.
259. Vanderberg, L. A.; Perry, J. J., Dehalogenation by Mycobacterium vaccae JOB-5: role of
the propane monooxygenase. Canadian Journal of Microbiology 1994, 40, (3), 169-172.

168
260. Coleman, J.; Perry, J., Purification and characterization of the secondary alcohol
dehydrogenase from propane-utilizing Mycobacterium vaccae strain JOB-5.
Microbiology 1985, 131, (11), 2901-2907.
261. Girvan, M.; Campbell, C.; Killham, K.; Prosser, J. I.; Glover, L. A., Bacterial diversity
promotes community stability and functional resilience after perturbation. Environmental
Microbiology 2005, 7, (3), 301-313.
262. Garbisu, C.; Garaiyurrebaso, O.; Epelde, L.; Grohmann, E.; Alkorta, I., Plasmid-mediated
bioaugmentation for the bioremediation of contaminated soils. Frontiers in Microbiology
2017, 8, 1966.
263. Popa, O.; Hazkani-Covo, E.; Landan, G.; Martin, W.; Dagan, T., Directed networks
reveal genomic barriers and DNA repair bypasses to lateral gene transfer among
prokaryotes. Genome Research 2011, 21, (4), 599-609.
264. Goodfellow, M.; Jones, A. L.; Maldonado, L. A.; Salanitro, J., Rhodococcus
aetherivorans sp. nov., a new species that contains methyl t-butyl ether-degrading
actinomycetes. Systematic and Applied Microbiology 2004, 27, (1), 61-65.
265. He, Z.; Zhang, K.; Wang, H.; Lv, Z., Trehalose promotes Rhodococcus sp. strain YYL
colonization in activated sludge under tetrahydrofuran (THF) stress. Frontiers in
Microbiology 2015, 6, 438.
266. Hara, T.; Takatsuka, Y.; Niikuni, T., Polychlorinated biphenyl detoxifying complex
composition and method for manufacturing same. In Google Patents: 2016.
267. Chong, C. S.; Sabir, D. K.; Lorenz, A.; Bontemps, C.; Andeer, P.; Stahl, D. A.; Strand, S.
E.; Rylott, E. L.; Bruce, N. C., Analysis of the xplAB-containing gene cluster involved in
the bacterial degradation of the explosive hexahydro-1, 3, 5-trinitro-1, 3, 5-triazine.
Applied and Environmental Microbiology 2014, 80, (21), 6601-6610.
268. Ludwig, B.; Akundi, A.; Kendall, K., A long-chain secondary alcohol dehydrogenase
from Rhodococcus erythropolis ATCC 4277. Applied and Environmental Microbiology
1995, 61, (10), 3729-3733.
269. Kulikova, A.; Bezborodov, A., Assimilation of Propane and Characterization of Propane
Monooxygenase from Rhodococcus erythropolis3/89. Applied Biochemistry and
Microbiology 2001, 37, (2), 164-167.
270. Spearman, C., The Proof and Measurement of Association between Two Things. The
American Journal of Psychology 1904, 15, (1), 72-101.
271. Kanitkar, Y. H.; Stedtfeld, R. D.; Steffan, R. J.; Hashsham, S. A.; Cupples, A. M., Loop-
mediated isothermal amplification (LAMP) for rapid detection and quantification of
Dehalococcoides biomarker genes in commercial reductive dechlorinating cultures KB-1
and SDC-9. Applied and Environmental Microbiology 2016, 82, (6), 1799-1806.
169
272. Kittelmann, S.; Friedrich, M. W., Novel uncultured Chloroflexi dechlorinate
perchloroethene to trans‐dichloroethene in tidal flat sediments. Environmental
Microbiology 2008, 10, (6), 1557-1570.
273. MacFarlane, K. D.; Cacciatore, D. A.; Leigh, D. P.; Yurovsky, M. G.; Atta, A., Field‐scale evaluation of a biobarrier for the treatment of a trichloroethene plume. Remediation
Journal 2011, 22, (1), 29-41.
274. Abe, Y.; Aravena, R.; Zopfi, J.; Parker, B.; Hunkeler, D., Evaluating the fate of
chlorinated ethenes in streambed sediments by combining stable isotope, geochemical
and microbial methods. Journal of Contaminant Hydrology 2009, 107, (1-2), 10-21.
275. Ellis, D. E.; Lutz, E. J.; Odom, J. M.; Buchanan, R. J.; Bartlett, C. L.; Lee, M. D.;
Harkness, M. R.; DeWeerd, K. A., Bioaugmentation for Accelerated In Situ Anaerobic
Bioremediation. Environmental Science and Technology 2000, 34, (11), 2254-2260.
276. Conrad, M. E.; Brodie, E. L.; Radtke, C. W.; Bill, M.; Delwiche, M. E.; Lee, M. H.;
Swift, D. L.; Colwell, F. S., Field evidence for co-metabolism of trichloroethene
stimulated by addition of electron donor to groundwater. Environmental Science and
Technology 2010, 44, (12), 4697-4704.
277. Panagiotakis, I.; Mamais, D.; Pantazidou, M.; Marneri, M.; Parapouli, M.; Hatziloukas,
E.; Tandoi, V., Dechlorinating ability of TCE-fed microcosms with different electron
donors. Journal of Hazardous Materials 2007, 149, (3), 582-589.
278. Cupples, A. M.; Spormann, A. M.; McCarty, P. L., Vinyl chloride and cis-dichloroethene
dechlorination kinetics and microorganism growth under substrate limiting conditions.
Environmental Science and Technology 2004, 38, (4), 1102-1107.
279. Lovley, D. R.; Phillips, E.; Lonergan, D. J.; Widman, P. K., Fe (III) and S0 reduction by
Pelobacter carbinolicus. Applied and Environmental Microbiology 1995, 61, (6), 2132-
2138.
280. Pfennig, N.; Widdel, F.; Trüper, H. G., The dissimilatory sulfate-reducing bacteria. In
The prokaryotes, Springer: 1981; pp 926-940.
281. Mohr, T. In 1, 4-dioxane and other solvent stabilizers-a ROD re-opener, Presentation to:
United States Environmental Protection Agency Technical Support Project Meeting
Sacramento, 2004; 2004.
282. Barajas-Rodriguez, F. J.; Murdoch, L. C.; Falta, R. W.; Freedman, D. L., Simulation of in
situ biodegradation of 1, 4-dioxane under metabolic and cometabolic conditions. Journal
of Contaminant Hydrology 2019, 223, 103464.
283. Li, F.; Deng, D.; Li, M., Distinct Catalytic Behaviors between Two 1,4-Dioxane
Degrading Monooxygenases: Kinetics, Inhibition, and Substrate Range. Environmental
Science and Technology 2019.

170
284. Polasko, A. L.; Zulli, A.; Gedalanga, P. B.; Pornwongthong, P.; Mahendra, S., A Mixed
Microbial Community for the Biodegradation of Chlorinated Ethenes and 1,4-Dioxane.
Environmental Science and Technology Letters 2019, 6, (1), 49-54.
285. Shelton, D. R.; Tiedje, J. M., General method for determining anaerobic biodegradation
potential. Applied and Environmental Microbiology 1984, 47, (4), 850-857.
286. Tedrow, J.; Krieger, R. E., Soils of New Jersey. 1986; Vol. 142, p 322.
287. He, Y. T.; Wilson, J. T.; Wilkin, R. T., Impact of iron sulfide transformation on
trichloroethylene degradation. Geochimica et Cosmochimica Acta 2010, 74, (7), 2025-
2039.
288. He, J.; Sung, Y.; Krajmalnik‐Brown, R.; Ritalahti, K. M.; Löffler, F. E., Isolation and
characterization of Dehalococcoides sp. strain FL2, a trichloroethene (TCE)‐and 1, 2‐
dichloroethene‐respiring anaerobe. Environmental Microbiology 2005, 7, (9), 1442-1450.
289. Smidt, H.; de Vos, W. M., Anaerobic microbial dehalogenation. Annual Review of
Microbiology 2004, 58, 43-73.
290. Futagami, T.; Goto, M.; Furukawa, K., Biochemical and genetic bases of
dehalorespiration. The Chemical Record 2008, 8, (1), 1-12.
291. Marcus, D. L.; Bonds, C., Results of the reactant sand-fracking pilot test and implications
for the in situ remediation of chlorinated VOCs and metals in deep and fractured bedrock
aquifers. Journal of Hazardous Materials 1999, 68, (1), 125-153.
292. Maymó-Gatell, X.; Nijenhuis, I.; Zinder, S. H., Reductive dechlorination of cis-1, 2-
dichloroethene and vinyl chloride by “Dehalococcoides ethenogenes”. Environmental
Science and Technology 2001, 35, (3), 516-521.
293. Löffler, F. E.; Sun, Q.; Li, J.; Tiedje, J. M., 16S rRNA Gene-Based Detection of
Tetrachloroethene-Dechlorinating Desulfuromonas and Dehalococcoides Species.
Applied and Environmental Microbiology 2000, 66, (4), 1369-1374.
294. Sung, Y.; Ritalahti, K. M.; Sanford, R. A.; Urbance, J. W.; Flynn, S. J.; Tiedje, J. M.;
Löffler, F. E., Characterization of two tetrachloroethene-reducing, acetate-oxidizing
anaerobic bacteria and their description as Desulfuromonas michiganensis sp. nov.
Applied and Environmental Microbiology 2003, 69, (5), 2964-2974.
295. Zhang, T.; Bain, T. S.; Nevin, K. P.; Barlett, M. A.; Lovley, D. R., Anaerobic benzene
oxidation by Geobacter species. Applied and Environmental Microbiology 2012, 78, (23),
8304-8310.

171
296. Sung, Y.; Fletcher, K. E.; Ritalahti, K. M.; Apkarian, R. P.; Ramos-Hernández, N.;
Sanford, R. A.; Mesbah, N. M.; Löffler, F. E., Geobacter lovleyi sp. nov. Strain SZ, a
Novel Metal-Reducing and Tetrachloroethene-Dechlorinating Bacterium. Applied and
Environmental Microbiology 2006, 72, (4), 2775-2782.
297. Yan, J.; Ritalahti, K. M.; Wagner, D. D.; Löffler, F. E., Unexpected specificity of
interspecies cobamide transfer from Geobacter spp. to organohalide-respiring
Dehalococcoides mccartyi strains. Applied and Environmental Microbiology 2012, 78,
(18), 6630-6636.
298. Löffler, F. E.; Sanford, R. A.; Ritalahti, K. M., Enrichment, cultivation, and detection of
reductively dechlorinating bacteria. Methods in Enzymology 2005, 397, 77-111.
299. Kotik, M.; Davidová, A.; Voříšková, J.; Baldrian, P., Bacterial communities in
tetrachloroethene-polluted groundwaters: a case study. Science of the Total Environment
2013, 454, 517-527.
300. Men, Y.; Feil, H.; VerBerkmoes, N. C.; Shah, M. B.; Johnson, D. R.; Lee, P. K.; West, K.
A.; Zinder, S. H.; Andersen, G. L.; Alvarez-Cohen, L., Sustainable syntrophic growth of
Dehalococcoides ethenogenes strain 195 with Desulfovibrio vulgaris Hildenborough and
Methanobacterium congolense: global transcriptomic and proteomic analyses. The ISME
journal 2012, 6, (2), 410.
301. Němeček, J.; Dolinová, I.; Macháčková, J.; Špánek, R.; Ševců, A.; Lederer, T.; Černík,
M., Stratification of chlorinated ethenes natural attenuation in an alluvial aquifer assessed
by hydrochemical and biomolecular tools. Chemosphere 2017, 184, 1157-1167.
302. Acinas, S. G.; Sarma-Rupavtarm, R.; Klepac-Ceraj, V.; Polz, M. F., PCR-induced
sequence artifacts and bias: insights from comparison of two 16S rRNA clone libraries
constructed from the same sample. Applied and Environmental Microbiology 2005, 71,
(12), 8966-8969.
303. Hug, L. A.; Beiko, R. G.; Rowe, A. R.; Richardson, R. E.; Edwards, E. A., Comparative
metagenomics of three Dehalococcoides-containing enrichment cultures: the role of the
non-dechlorinating community. BMC Genomics 2012, 13, (1), 327.
304. Becker, J. G., A modeling study and implications of competition between
Dehalococcoides ethenogenes and other tetrachloroethene-respiring bacteria.
Environmental Science and Technology 2006, 40, (14), 4473-4480.
305. Aulenta, F.; Beccari, M.; Majone, M.; Papini, M. P.; Tandoi, V., Competition for H2
between sulfate reduction and dechlorination in butyrate-fed anaerobic cultures. Process
Biochemistry 2008, 43, (2), 161-168.
306. Drzyzga, O.; Gerritse, J.; Dijk, J. A.; Elissen, H.; Gottschal, J. C., Coexistence of a
sulphate‐reducing Desulfovibrio species and the dehalorespiring Desulfitobacterium
frappieri TCE1 in defined chemostat cultures grown with various combinations of
sulphate and tetrachloroethene. Environmental Microbiology 2001, 3, (2), 92-99.

172
307. Fathepure, B. Z.; Elango, V. K.; Singh, H.; Bruner, M. A., Bioaugmentation potential of a
vinyl chloride-assimilating Mycobacterium sp., isolated from a chloroethene-
contaminated aquifer. FEMS Microbiology Letters 2005, 248, (2), 227-234.
308. Tiehm, A.; Schmidt, K. R.; Pfeifer, B.; Heidinger, M.; Ertl, S., Growth kinetics and stable
carbon isotope fractionation during aerobic degradation of cis-1,2-dichloroethene and
vinyl chloride. Water Research 2008, 42, (10), 2431-2438.
309. Verce, M. F.; Gunsch, C. K.; Danko, A. S.; Freedman, D. L., Cometabolism of cis-1,2-
Dichloroethene by Aerobic Cultures Grown on Vinyl Chloride as the Primary Substrate.
Environmental Science and Technology 2002, 36, (10), 2171-2177.
310. Verce, M. F.; Ulrich, R. L.; Freedman, D. L., Characterization of an isolate that uses
vinyl chloride as a growth substrate under aerobic conditions. Applied and Environmental
Microbiology 2000, 66, (8), 3535-3542.
311. Schmidt, K. R.; Gaza, S.; Voropaev, A.; Ertl, S.; Tiehm, A., Aerobic biodegradation of
trichloroethene without auxiliary substrates. Water Research 2014, 59, 112-118.
312. Zhao, H.-P.; Schmidt, K. R.; Tiehm, A., Inhibition of aerobic metabolic cis-1, 2-di-
chloroethene biodegradation by other chloroethenes. Water Research 2010, 44, (7), 2276-
2282.
Copyright © 2022 FDOKUMEN


![Aqua(4,4'-bipyridine-[kappa]N)bis(1,4-dioxo-1 ... - ScienceOpen](https://static.fdokumen.com/doc/165x107/63262349e491bcb36c0aa51f/aqua44-bipyridine-kappanbis14-dioxo-1-scienceopen.jpg)