Electrochemical Reduction of Sodium 1,4-dihydroxy-9,10
13
Int. J. Electrochem. Sci., 3 (2008) 1016 - 1028 International Journal of ELECTROCHEMICAL SCIENCE www.electrochemsci.org Electrochemical Reduction of Sodium 1,4-dihydroxy-9,10- anthraquinone-2-sulphonate in Aqueous and Aqueous Dimethyl Formamide Mixed Solvent: A Cyclic Voltammetric Study Partha Sarathi Guin 1 , Saurabh Das 2 , P. C. Mandal 1,* 1 Chemical Sciences Division, Saha Institute of Nuclear Physics, 1/AF-Bidhannagar, Kolkata- 700064, India 2 Department of Chemistry, Jadavpur University, Raja S. C. Mullick Road, Kolkata- 700032, India * E-mail: [email protected] Received: 20 March 2008 / Accepted: 30 June 2008 / Published: 4 August 2008 The electrochemical behavior of sodium 1,4-dihydroxy-9,10-anthraquinone-2- sulphonate (sodium quinizarin-2-sulphonate), an analogue of the core molecule of anthracycline antibiotics, was studied using cyclic voltammetry. In pure and aqueous dimethyl formamide quinizarin-2-sulphonate undergoes successive two one- electron reductions and there is comproportionation between the quinone and its dianion to form a semiquinone radical. The apparent comproportionation constants in pure and aqueous dimethyl formamide mixtures were calculated. It was found at acidic, neutral and alkaline pH, when cyclic voltammetry is carried out in pure aqueous buffer the reduction of sodium quinizarin-2- sulphonate follows a one step two- electron reduction. In acidic buffer, it was found that the reduction involves two protons along with two electrons but at neutral and alkaline pH it is free from protons. It was found that at pH 9.0 there is also a comproportionation reaction. Keywords: Sodium quinizarin-2-sulphonate; cyclic voltammetry; formal reduction potential; pH dependence; DMF, comproportonation reaction 1. INTRODUCTION Adriamycin and daunorubicin are anthracycline drugs widely used in the treatment of various human cancers. Since their discovery, studies on anthracycline antibiotics have been actively pursued for their anticancer activity and mechanism of drug action. Most of these studies on anthracyclines and its metal complexes concentrate on interaction with DNA [1-8]. The major limitations of the use of anthracycline drugs include their acute and chronic toxicities. The chronic total dose limiting toxicity is cardiotoxicity [9,10] and these drugs may also cause chromosomal damage. Cardiotoxicity [11] and chromosomal damage [12] are associated with
-
Upload
khangminh22 -
Category
Documents
-
view
4 -
download
0
Transcript of Electrochemical Reduction of Sodium 1,4-dihydroxy-9,10
Int. J. Electrochem. Sci., 3 (2008) 1016 - 1028
International Journal of
ELECTROCHEMICAL
SCIENCE www.electrochemsci.org
Electrochemical Reduction of Sodium 1,4-dihydroxy-9,10-
anthraquinone-2-sulphonate in Aqueous and Aqueous Dimethyl
Formamide Mixed Solvent: A Cyclic Voltammetric Study
Partha Sarathi Guin1, Saurabh Das
2, P. C. Mandal
1,*
1 Chemical Sciences Division, Saha Institute of Nuclear Physics, 1/AF-Bidhannagar, Kolkata- 700064,
India 2 Department of Chemistry, Jadavpur University, Raja S. C. Mullick Road, Kolkata- 700032, India
*E-mail: [email protected]
Received: 20 March 2008 / Accepted: 30 June 2008 / Published: 4 August 2008
The electrochemical behavior of sodium 1,4-dihydroxy-9,10-anthraquinone-2- sulphonate (sodium
quinizarin-2-sulphonate), an analogue of the core molecule of anthracycline antibiotics, was studied
using cyclic voltammetry. In pure and aqueous dimethyl formamide quinizarin-2-sulphonate undergoes
successive two one- electron reductions and there is comproportionation between the quinone and its
dianion to form a semiquinone radical. The apparent comproportionation constants in pure and
aqueous dimethyl formamide mixtures were calculated. It was found at acidic, neutral and alkaline pH,
when cyclic voltammetry is carried out in pure aqueous buffer the reduction of sodium quinizarin-2-
sulphonate follows a one step two- electron reduction. In acidic buffer, it was found that the reduction
involves two protons along with two electrons but at neutral and alkaline pH it is free from protons. It
was found that at pH 9.0 there is also a comproportionation reaction.
Keywords: Sodium quinizarin-2-sulphonate; cyclic voltammetry; formal reduction potential; pH
dependence; DMF, comproportonation reaction
1. INTRODUCTION
Adriamycin and daunorubicin are anthracycline drugs widely used in the treatment of various
human cancers. Since their discovery, studies on anthracycline antibiotics have been actively pursued
for their anticancer activity and mechanism of drug action. Most of these studies on anthracyclines and
its metal complexes concentrate on interaction with DNA [1-8].
The major limitations of the use of anthracycline drugs include their acute and chronic
toxicities. The chronic total dose limiting toxicity is cardiotoxicity [9,10] and these drugs may also
cause chromosomal damage. Cardiotoxicity [11] and chromosomal damage [12] are associated with
Int. J. Electrochem. Sci., Vol. 3, 2008
1017
several electron transfer processes involving the respiratory chain generating H2O2/O2·-/OH
-, oxidative
phosphorylation, complexation of phospholipid and may even initiate peroxidation of lipid, [13-18].
The behavior of these drugs have a good correlation with redox properties [19-22]. The quinone
moiety present in these drugs after one electron reduction forms a semiquinone, which plays a major
role in determining toxicities of these drugs in cellular systems [23, 24]. It is therefore, important to
study the reduction behavior of such molecules under different conditions. Semiquinone radicals are
short lived and readily undergo disproportionation [25, 26] generating a quinone and its corresponding
dianion. Pulse radiolysis techniques [27-31] and electrochemical methods like cyclic voltammetry
have been used to investigate redox behaviors of different quinone systems [32-39].
In aprotic media, the reductions of quinones take place by two successive one- electron
reduction steps forming Q- and then Q
2-. The formal potentials for these reduction steps depend upon
the polarity of the solvent [32- 34]. In aprotic media the cation of the supporting electrolyte plays a
vital role whether the reduction is two steps or one step [35,36]. The electrochemical behavior of the
quinones may be altered significantly in presence of acidic additives [37]. Hydrogen bonding is also
known to play an important role in determining redox behaviors of hydroxy quinone systems [38, 39].
The present study concentrates on the detailed electrochemical behavior of sodium 1,4-
dihydroxy-9,10-anthraquinone-2-sulphonate (sodium quinizarin-2-sulphonate), an analogue of the core
unit of anthracycline drugs using cyclic voltammetry. Sodium quinizarin-2-sulphonate is highly
soluble in water and may therefore be used under physiological conditions. It was found that sodium
quinizarin-2-sulphonate exhibits a wide range of phenomena, which are of interest both from the
standpoint of contemporary electrochemistry as also from a biological point of view. Cyclic
voltammetry study of sodium quinizarin-2-sulphonate was carried out both in aqueous and mixed
aqueous dimethyl formamide solution at different pH. Several electrochemical parameters have been
obtained under different conditions of experiment with the help of which a possible mechanism of the
chemical processes taking place have been attempted.
2. EXPERIMENTAL PART
Sodium quinizarin-2-sulphonate was prepared by sulphonation of Quinizarin (Sigma-Aldrich)
with aqueous sodium sulphite in the presence of cupric oxide [40]. Sodium quinizarin-2-sulphonate
obtained was recrystalized from ethanol water mixtures. The quinone moiety being sensitive to light
solutions were prepared just before the experiment and kept in dark. Tetrabutylammonium bromide
(TBAB) (AR grade) obtained from Spectrochem, India and sodium chloride (AR grade) obtained from
Merck, were used as supporting electrolyte in DMF-water and aqueous media respectively. All other
reagents used were of AR grade. Acetate buffer and Britton- Robinson buffer was used to maintain pH.
All solutions were prepared in triple distilled water. Cyclic voltammetry experiments were carried out
using the conventional three- electrode system at 250C. The temperature was maintained at 25
0C using
circulating water bath. A glassy carbon electrode of surface area 0.1257cm2
served as the working
electrode, a platinum wire acted as the counter electrode while Ag/AgCl was the reference electrode.
Experiments were done using EG & G Potentiostat Model 263A. Cyclic voltammetric experiments of
Int. J. Electrochem. Sci., Vol. 3, 2008
1018
quinizarin- 2- sulphonate were done in pure aqueous buffer, pure and aqueous dimethyl formamide
mixtures at different pH. In aqueous dimethyl formamide mixtures, the required pH was adjusted
according to equation pH = -log CH
+- log γH [41]. Concentrations of experimental solutions were in the
range 5 × 10⁻⁴
moldm-3
to 1.5× 10⁻³
moldm-3
. All experimental solutions were degassed for 30 mins
with high- purity argon gas, before any cyclic voltammetry of a sample was done. Simulation study
was carried out using esp24b software.
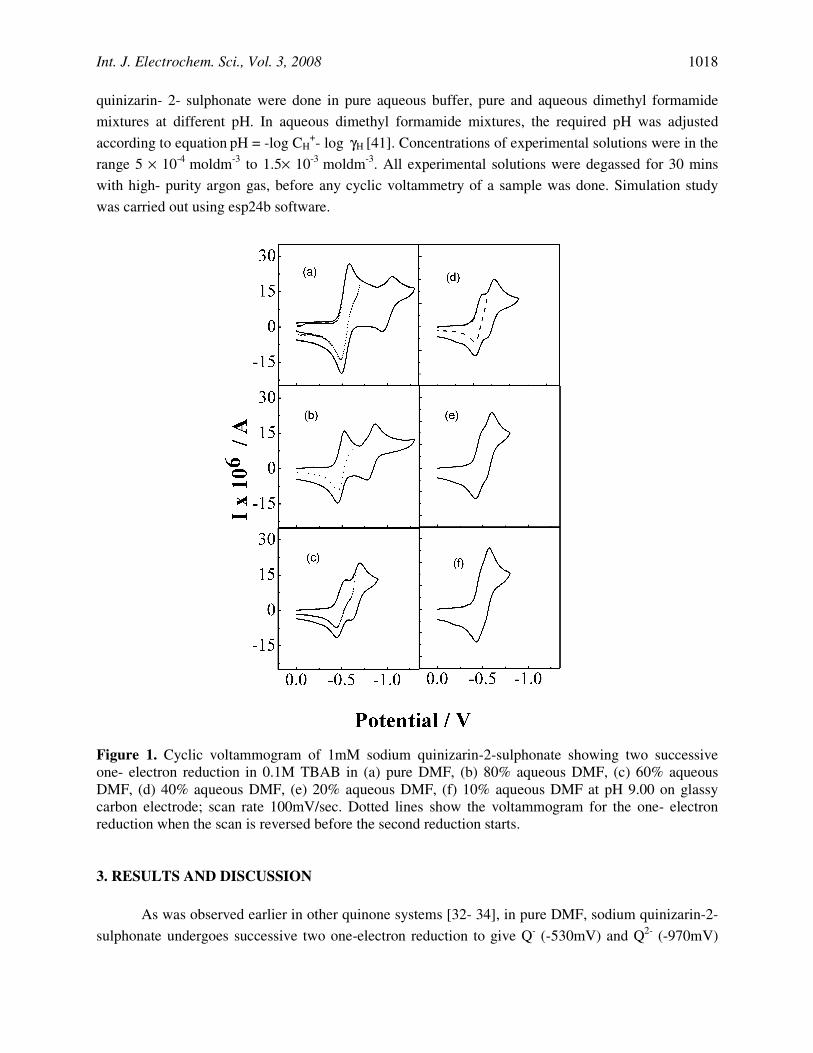
Figure 1. Cyclic voltammogram of 1mM sodium quinizarin-2-sulphonate showing two successive
one- electron reduction in 0.1M TBAB in (a) pure DMF, (b) 80% aqueous DMF, (c) 60% aqueous
DMF, (d) 40% aqueous DMF, (e) 20% aqueous DMF, (f) 10% aqueous DMF at pH 9.00 on glassy
carbon electrode; scan rate 100mV/sec. Dotted lines show the voltammogram for the one- electron
reduction when the scan is reversed before the second reduction starts.
3. RESULTS AND DISCUSSION
As was observed earlier in other quinone systems [32- 34], in pure DMF, sodium quinizarin-2-
sulphonate undergoes successive two one-electron reduction to give Q- (-530mV) and Q
2- (-970mV)
Int. J. Electrochem. Sci., Vol. 3, 2008
1019
showing two peaks which are well separated by 440mV. The first step is completely reversible while
the second step is quasi- reversible at customary scan rates. When the scan is reversed at a potential
well before the second reduction, the peak current of the anodic wave for the oxidation of Q-. is
comparatively less than that observed when the scan is reversed after the second reduction generating
Q2-
. A typical cyclic voltammogram for sodium quinizarin-2-sulphonate in pure DMF is shown in Fig.
1(a). The formal potential, E1/2 values of the respective reduction steps were calculated from the
average of cathodic and anodic peak potentials and results are shown in Table-1.
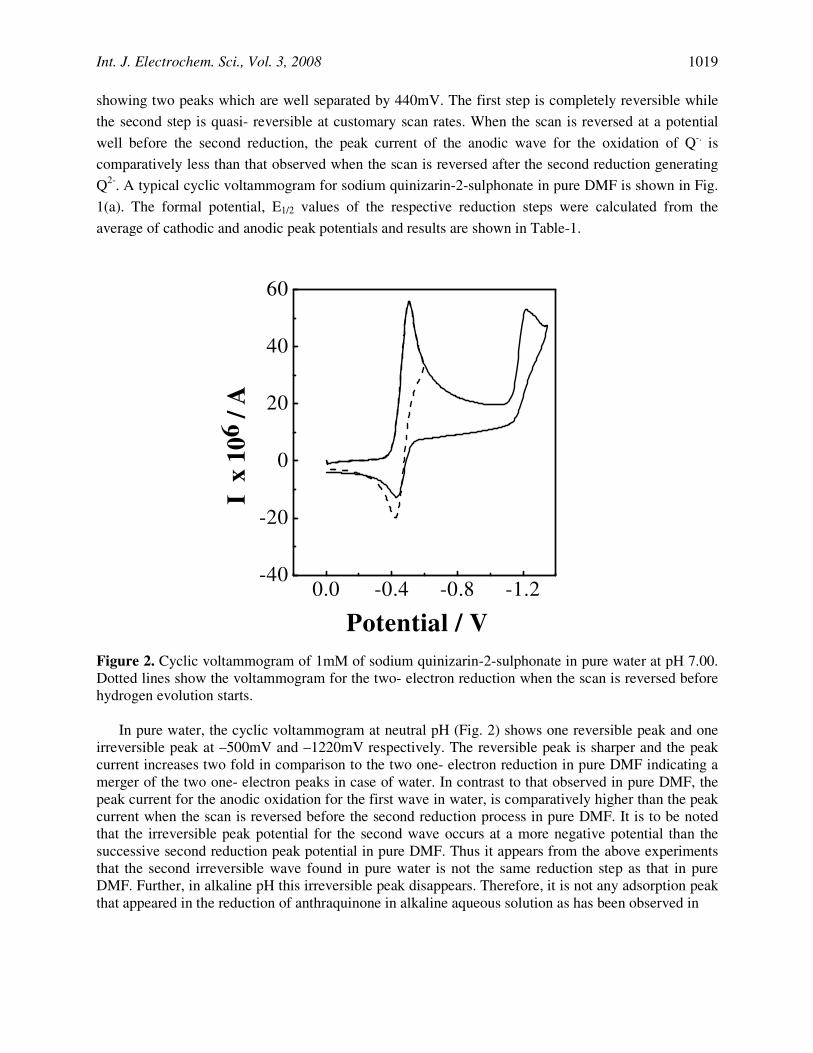
Figure 2. Cyclic voltammogram of 1mM of sodium quinizarin-2-sulphonate in pure water at pH 7.00.
Dotted lines show the voltammogram for the two- electron reduction when the scan is reversed before
hydrogen evolution starts.
In pure water, the cyclic voltammogram at neutral pH (Fig. 2) shows one reversible peak and one
irreversible peak at –500mV and –1220mV respectively. The reversible peak is sharper and the peak
current increases two fold in comparison to the two one- electron reduction in pure DMF indicating a
merger of the two one- electron peaks in case of water. In contrast to that observed in pure DMF, the
peak current for the anodic oxidation for the first wave in water, is comparatively higher than the peak
current when the scan is reversed before the second reduction process in pure DMF. It is to be noted
that the irreversible peak potential for the second wave occurs at a more negative potential than the
successive second reduction peak potential in pure DMF. Thus it appears from the above experiments
that the second irreversible wave found in pure water is not the same reduction step as that in pure
DMF. Further, in alkaline pH this irreversible peak disappears. Therefore, it is not any adsorption peak
that appeared in the reduction of anthraquinone in alkaline aqueous solution as has been observed in
0.0 -0.4 -0.8 -1.2-40
-20
0
20
40
60
I x 1
06 /
A
Potential / V
Int. J. Electrochem. Sci., Vol. 3, 2008
1020
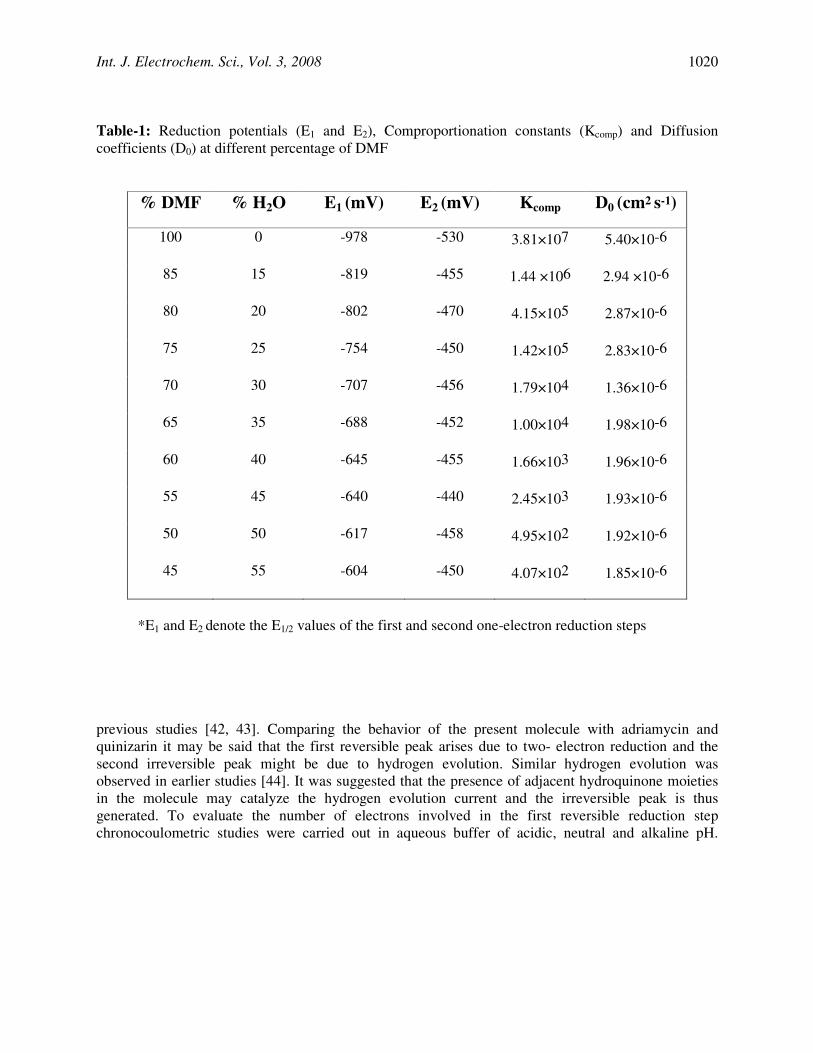
Table-1: Reduction potentials (E1 and E2), Comproportionation constants (Kcomp) and Diffusion
coefficients (D0) at different percentage of DMF
% DMF % H2O E1 (mV)
E2 (mV) Kcomp D0 (cm2 s-1)
100 0 -978 -530 3.81×10⁷ 5.40×10⁻⁶
85 15 -819 -455 1.44 ×10⁶ 2.94 ×10⁻⁶
80 20 -802 -470 4.15×10⁵ 2.87×10⁻⁶
75 25 -754 -450 1.42×10⁵ 2.83×10⁻⁶
70 30 -707 -456 1.79×10⁴ 1.36×10⁻⁶
65 35 -688 -452 1.00×10⁴ 1.98×10⁻⁶
60 40 -645 -455 1.66×10³ 1.96×10⁻⁶
55 45 -640 -440 2.45×10³ 1.93×10⁻⁶
50 50 -617 -458 4.95×10² 1.92×10⁻⁶
45 55 -604 -450 4.07×10² 1.85×10⁻⁶
*E1 and E2 denote the E1/2 values of the first and second one-electron reduction steps
previous studies [42, 43]. Comparing the behavior of the present molecule with adriamycin and
quinizarin it may be said that the first reversible peak arises due to two- electron reduction and the
second irreversible peak might be due to hydrogen evolution. Similar hydrogen evolution was
observed in earlier studies [44]. It was suggested that the presence of adjacent hydroquinone moieties
in the molecule may catalyze the hydrogen evolution current and the irreversible peak is thus
generated. To evaluate the number of electrons involved in the first reversible reduction step
chronocoulometric studies were carried out in aqueous buffer of acidic, neutral and alkaline pH.

Int. J. Electrochem. Sci., Vol. 3, 2008
1021
Results have shown that two electrons are involved in such reduction whatever be the pH of the
solution. Results therefore suggest that the electrochemical reduction in protic and aprotic solvents
differ appreciably.
O
O
SO3Na-
OH
OH
+
+SO3Na
-
OH
OH
O
O
+
-
SO3Na-
OH
OH
O
O
+
-
- .
2
Scheme I
To see the role of protic solvents studies were therefore extended to mixed aqueous DMF
solutions at different pH. At neutral pH in 95% DMF, the two successive reduction waves observed in
pure DMF did not appear and a single two- electron wave was observed. When pH was gradually
increased the two separate waves did not appear until pH 9.0. At pH 9.0 two successive one-electron
reduction waves were observed upto 40% DMF [Fig. 1a-d]. On further increasing concentration of
water the two reduction peaks come closer and finally merge. The cyclic voltammograms are shown in
Fig.1. The formal electrode potentials for the successive one- electron reduction of sodium quinizarin-
2-sulphonate in different aqueous DMF buffer are shown in Table-1. The apparent comproportionation
constants corresponding to the equilibrium, Q2-
+ Q 2Q-. [Scheme- I], may be determined by
equation (1) in pure and aqueous DMF and they are shown in Table- 1.
Kcomp = exp [-F/ RT (E2-E1)] (1)
F = Faraday
R = Molar gas constant
T = Temperature
E1 = Formal potential of first reduction
E2 = Formal potential of second reduction
It is found that as water concentration increases Kcomp decreases. This is an indication in favour of
the fact that as water concentration increases there is some sort of a stability rendered to the Q2-
species
by water as a result of which rate of comproportionation falls off. The comproportionation
Int. J. Electrochem. Sci., Vol. 3, 2008
1022
reaction is supported by the cyclic voltammogram in DMF and different aqueous DMF solutions
[Fig.1a-d]. When the scan is reversed well after the second reduction then the anodic peak current is
markedly increased than when the scan is reversed before the second reduction.
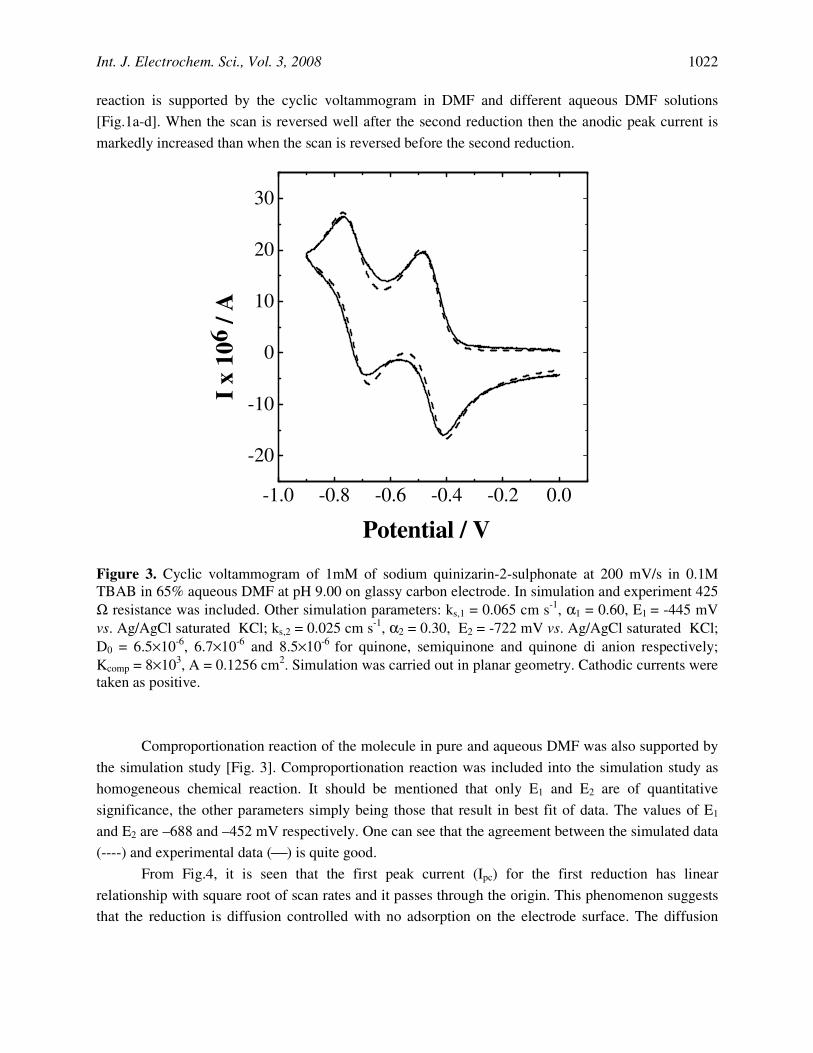
Figure 3. Cyclic voltammogram of 1mM of sodium quinizarin-2-sulphonate at 200 mV/s in 0.1M
TBAB in 65% aqueous DMF at pH 9.00 on glassy carbon electrode. In simulation and experiment 425
Ω resistance was included. Other simulation parameters: ks,1 = 0.065 cm s-1
, α1 = 0.60, E1 = -445 mV
vs. Ag/AgCl saturated KCl; ks,2 = 0.025 cm s-1
, α2 = 0.30, E2 = -722 mV vs. Ag/AgCl saturated KCl;
D0 = 6.5×10⁻⁶
, 6.7×10⁻⁶
and 8.5×10⁻⁶
for quinone, semiquinone and quinone di anion respectively;
Kcomp = 8×10³, A = 0.1256 cm
2. Simulation was carried out in planar geometry. Cathodic currents were
taken as positive.
Comproportionation reaction of the molecule in pure and aqueous DMF was also supported by
the simulation study [Fig. 3]. Comproportionation reaction was included into the simulation study as
homogeneous chemical reaction. It should be mentioned that only E1 and E2 are of quantitative
significance, the other parameters simply being those that result in best fit of data. The values of E1
and E2 are –688 and –452 mV respectively. One can see that the agreement between the simulated data
(----) and experimental data () is quite good.
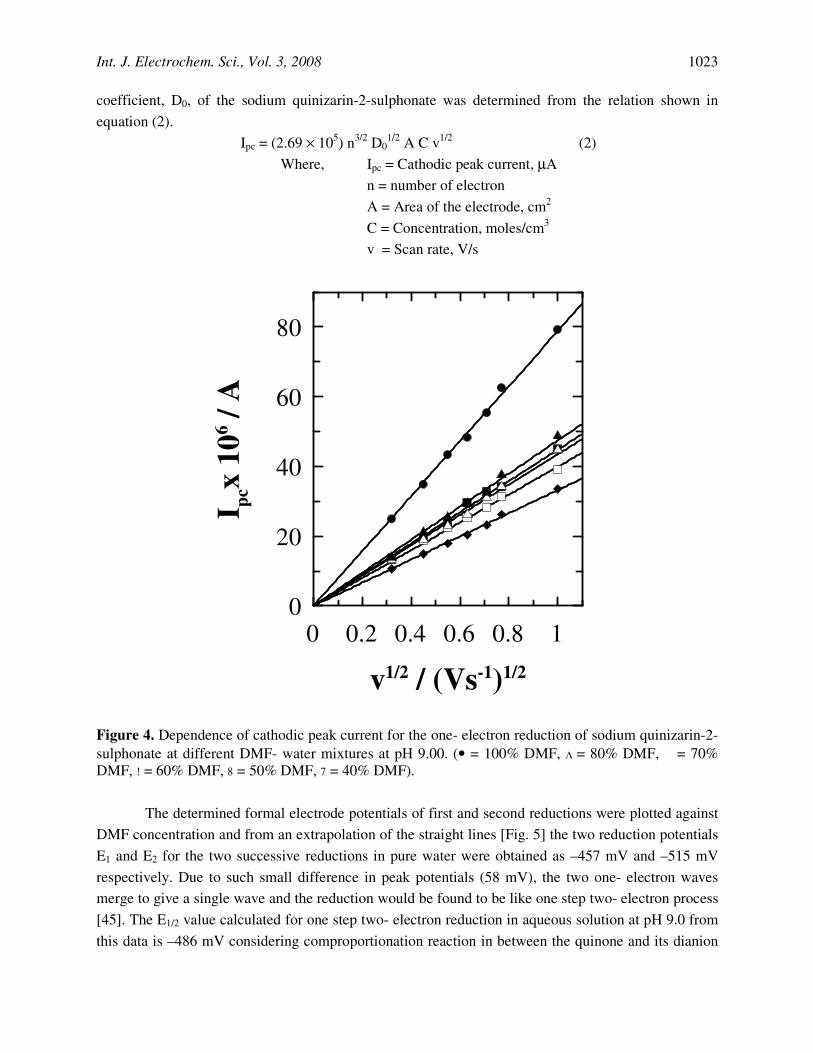
From Fig.4, it is seen that the first peak current (Ipc) for the first reduction has linear
relationship with square root of scan rates and it passes through the origin. This phenomenon suggests
that the reduction is diffusion controlled with no adsorption on the electrode surface. The diffusion
-1.0 -0.8 -0.6 -0.4 -0.2 0.0
-20
-10
0
10
20
30
I
x 1
06
/ A
Potential / V
Int. J. Electrochem. Sci., Vol. 3, 2008
1023
coefficient, D0, of the sodium quinizarin-2-sulphonate was determined from the relation shown in
equation (2).
Ipc = (2.69 × 10⁵) n
3/2 D0
1/2 A C v
1/2 (2)
Where, Ipc = Cathodic peak current, µA
n = number of electron
A = Area of the electrode, cm2
C = Concentration, moles/cm3
v = Scan rate, V/s
Figure 4. Dependence of cathodic peak current for the one- electron reduction of sodium quinizarin-2-
sulphonate at different DMF- water mixtures at pH 9.00. (• = 100% DMF, Λ = 80% DMF, = 70%
DMF, ! = 60% DMF, 8 = 50% DMF, 7 = 40% DMF).
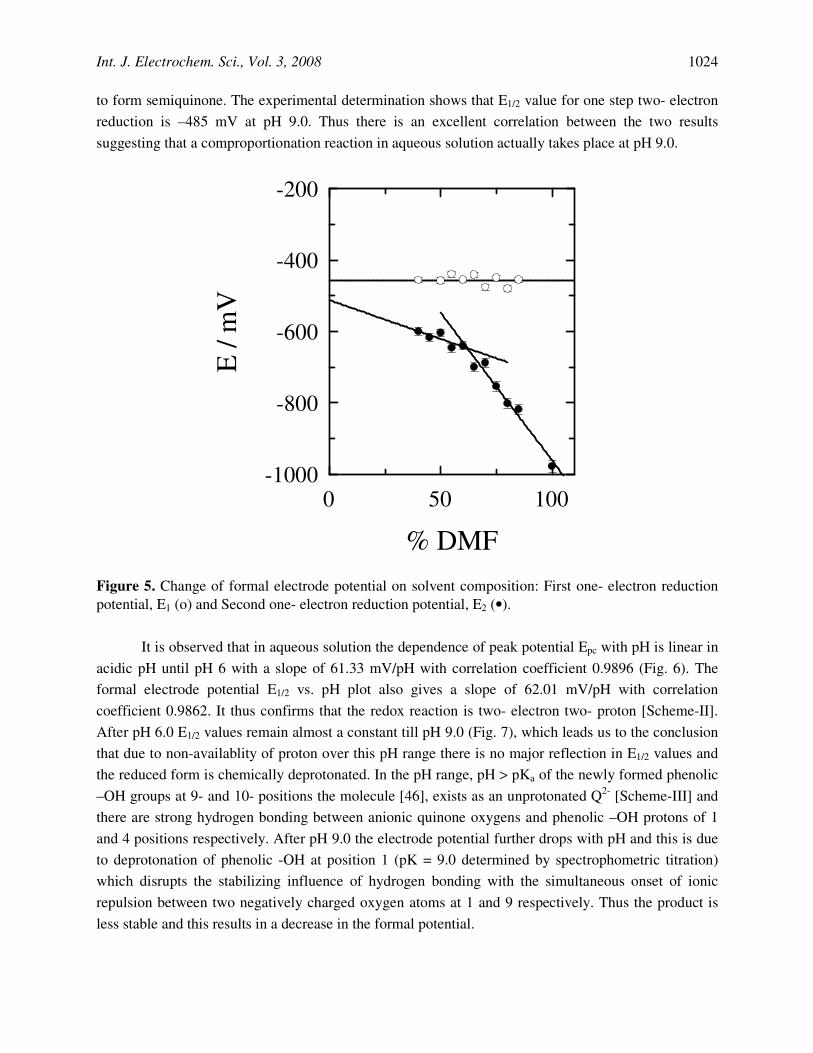
The determined formal electrode potentials of first and second reductions were plotted against
DMF concentration and from an extrapolation of the straight lines [Fig. 5] the two reduction potentials
E1 and E2 for the two successive reductions in pure water were obtained as –457 mV and –515 mV
respectively. Due to such small difference in peak potentials (58 mV), the two one- electron waves
merge to give a single wave and the reduction would be found to be like one step two- electron process
[45]. The E1/2 value calculated for one step two- electron reduction in aqueous solution at pH 9.0 from
this data is –486 mV considering comproportionation reaction in between the quinone and its dianion
10.80.60.40.20
80
60
40
20
0
v1/2 / (Vs-1)1/2
I pcx
10
6 /
A
Int. J. Electrochem. Sci., Vol. 3, 2008
1024
to form semiquinone. The experimental determination shows that E1/2 value for one step two- electron
reduction is –485 mV at pH 9.0. Thus there is an excellent correlation between the two results
suggesting that a comproportionation reaction in aqueous solution actually takes place at pH 9.0.
Figure 5. Change of formal electrode potential on solvent composition: First one- electron reduction
potential, E1 (o) and Second one- electron reduction potential, E2 (•).
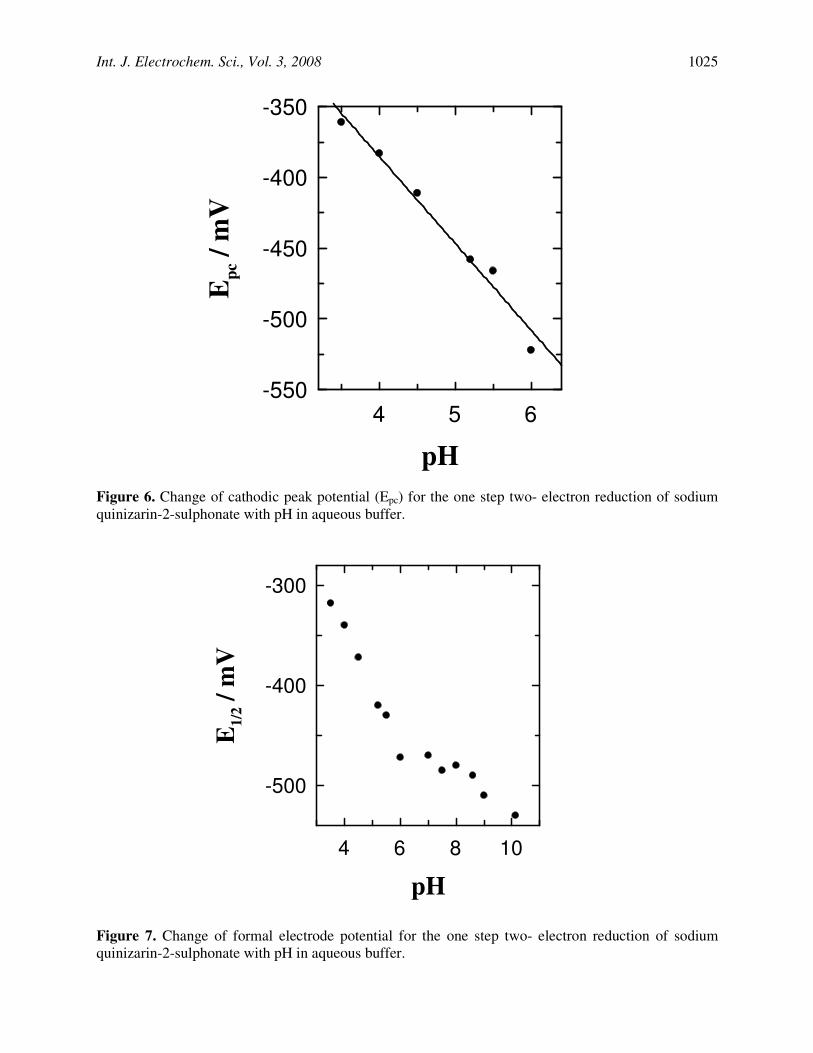
It is observed that in aqueous solution the dependence of peak potential Epc with pH is linear in
acidic pH until pH 6 with a slope of 61.33 mV/pH with correlation coefficient 0.9896 (Fig. 6). The
formal electrode potential E1/2 vs. pH plot also gives a slope of 62.01 mV/pH with correlation
coefficient 0.9862. It thus confirms that the redox reaction is two- electron two- proton [Scheme-II].
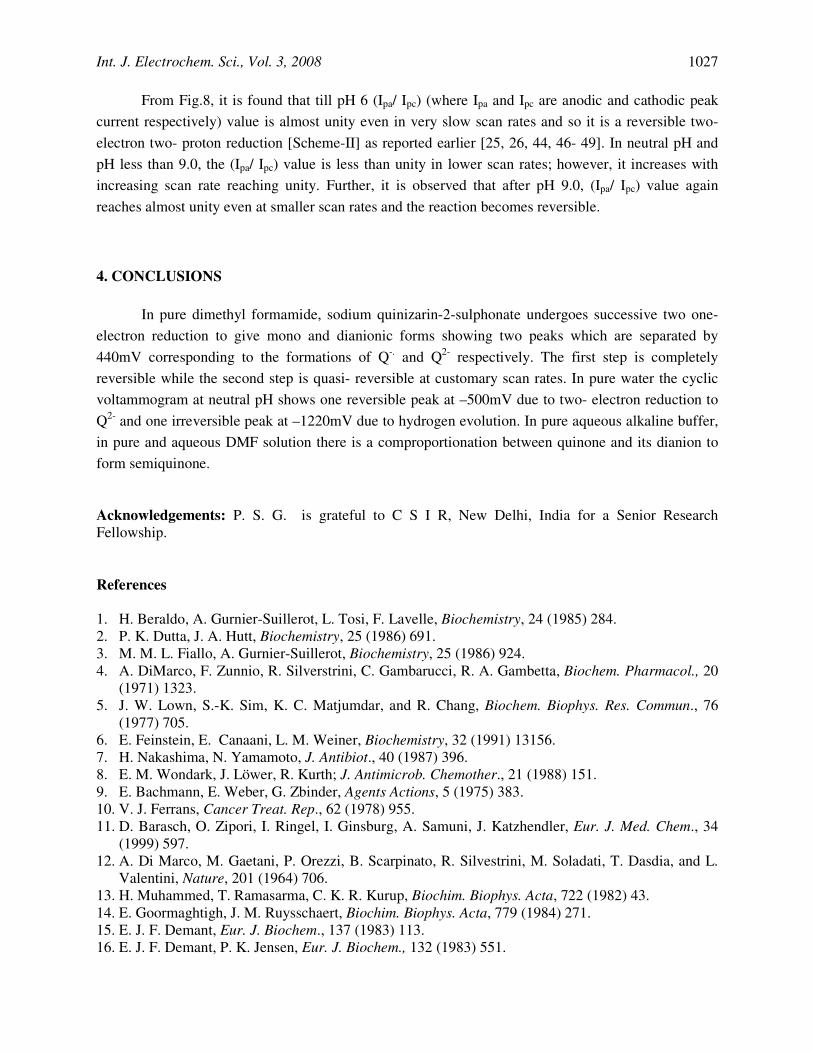
After pH 6.0 E1/2 values remain almost a constant till pH 9.0 (Fig. 7), which leads us to the conclusion
that due to non-availablity of proton over this pH range there is no major reflection in E1/2 values and
the reduced form is chemically deprotonated. In the pH range, pH > pKa of the newly formed phenolic
–OH groups at 9- and 10- positions the molecule [46], exists as an unprotonated Q2-
[Scheme-III] and
there are strong hydrogen bonding between anionic quinone oxygens and phenolic –OH protons of 1
and 4 positions respectively. After pH 9.0 the electrode potential further drops with pH and this is due
to deprotonation of phenolic -OH at position 1 (pK = 9.0 determined by spectrophometric titration)
which disrupts the stabilizing influence of hydrogen bonding with the simultaneous onset of ionic
repulsion between two negatively charged oxygen atoms at 1 and 9 respectively. Thus the product is
less stable and this results in a decrease in the formal potential.
100500
-200
-400
-600
-800
-1000
% DMF
E /
mV
Int. J. Electrochem. Sci., Vol. 3, 2008
1025
Figure 6. Change of cathodic peak potential (Epc) for the one step two- electron reduction of sodium
quinizarin-2-sulphonate with pH in aqueous buffer.
Figure 7. Change of formal electrode potential for the one step two- electron reduction of sodium
quinizarin-2-sulphonate with pH in aqueous buffer.
654
-350
-400
-450
-500
-550
pH
Ep
c /
mV
10864
-300
-400
-500
pH
E1/2 /
mV

Int. J. Electrochem. Sci., Vol. 3, 2008
1026
O
O
S O 3 N a-
O H
O H
2 H + 2 e+
+
S O 3 N a-
O H
O H
O H
O H
++
Scheme II
O
O
S O 3 N a-
O H
O H
2 e+
S O 3 N a-
O H
O H
O
O
++
-
-
Scheme III
Figure 8. (Ipa/ Ipc) ratio dependence on scan rates in aqueous media at different pH values: o = pH 3.5,
• = pH 4.0, = pH 4.5, ! = pH 5.2, 8 = pH 5.5, 7 = pH 6.0, Χ = pH 7.0, Β = pH 7.5, Μ = pH 8.0, Λ = pH
8.6, + = 9.0, × = 9.5, ∗ = 10.1.
0-0.4-0.8
1.2
1
0.8
0.6
0.4
log v / Vs-1
(Ip
a/I
pc)
Int. J. Electrochem. Sci., Vol. 3, 2008
1027
From Fig.8, it is found that till pH 6 (Ipa/ Ipc) (where Ipa and Ipc are anodic and cathodic peak
current respectively) value is almost unity even in very slow scan rates and so it is a reversible two-
electron two- proton reduction [Scheme-II] as reported earlier [25, 26, 44, 46- 49]. In neutral pH and
pH less than 9.0, the (Ipa/ Ipc) value is less than unity in lower scan rates; however, it increases with
increasing scan rate reaching unity. Further, it is observed that after pH 9.0, (Ipa/ Ipc) value again
reaches almost unity even at smaller scan rates and the reaction becomes reversible.
4. CONCLUSIONS
In pure dimethyl formamide, sodium quinizarin-2-sulphonate undergoes successive two one-
electron reduction to give mono and dianionic forms showing two peaks which are separated by
440mV corresponding to the formations of Q-. and Q
2- respectively. The first step is completely
reversible while the second step is quasi- reversible at customary scan rates. In pure water the cyclic
voltammogram at neutral pH shows one reversible peak at –500mV due to two- electron reduction to
Q2-
and one irreversible peak at –1220mV due to hydrogen evolution. In pure aqueous alkaline buffer,
in pure and aqueous DMF solution there is a comproportionation between quinone and its dianion to
form semiquinone.
Acknowledgements: P. S. G. is grateful to C S I R, New Delhi, India for a Senior Research
Fellowship.
References
1. H. Beraldo, A. Gurnier-Suillerot, L. Tosi, F. Lavelle, Biochemistry, 24 (1985) 284.
2. P. K. Dutta, J. A. Hutt, Biochemistry, 25 (1986) 691.
3. M. M. L. Fiallo, A. Gurnier-Suillerot, Biochemistry, 25 (1986) 924.
4. A. DiMarco, F. Zunnio, R. Silverstrini, C. Gambarucci, R. A. Gambetta, Biochem. Pharmacol., 20
(1971) 1323.
5. J. W. Lown, S.-K. Sim, K. C. Matjumdar, and R. Chang, Biochem. Biophys. Res. Commun., 76
(1977) 705.
6. E. Feinstein, E. Canaani, L. M. Weiner, Biochemistry, 32 (1991) 13156.
7. H. Nakashima, N. Yamamoto, J. Antibiot., 40 (1987) 396.
8. E. M. Wondark, J. Löwer, R. Kurth; J. Antimicrob. Chemother., 21 (1988) 151.
9. E. Bachmann, E. Weber, G. Zbinder, Agents Actions, 5 (1975) 383.
10. V. J. Ferrans, Cancer Treat. Rep., 62 (1978) 955.
11. D. Barasch, O. Zipori, I. Ringel, I. Ginsburg, A. Samuni, J. Katzhendler, Eur. J. Med. Chem., 34
(1999) 597.
12. A. Di Marco, M. Gaetani, P. Orezzi, B. Scarpinato, R. Silvestrini, M. Soladati, T. Dasdia, and L.
Valentini, Nature, 201 (1964) 706.
13. H. Muhammed, T. Ramasarma, C. K. R. Kurup, Biochim. Biophys. Acta, 722 (1982) 43.
14. E. Goormaghtigh, J. M. Ruysschaert, Biochim. Biophys. Acta, 779 (1984) 271.
15. E. J. F. Demant, Eur. J. Biochem., 137 (1983) 113.
16. E. J. F. Demant, P. K. Jensen, Eur. J. Biochem., 132 (1983) 551.
Int. J. Electrochem. Sci., Vol. 3, 2008
1028
17. Y. Iwamoto, I. L. Hansen, T. H. Porter, K. Folkers, Biochem. Biophys. Res. Commun., 58 (1974)
633.
18. T. Goodman, P. Hoschstein, Biochem. Biophys. Res. Commun., 77 (1977) 797.
19. Y. Kawakami, A. J. Hopfinger, Chem. Res. Toxicol., 3 (1990) 244- 247
20. F. C. de Abreu, P. A. de Ferraz, M. O. F. Goulart, J. Brazilian Chem. Soc., 13 (2002) 19.
21. J. Lown, H. Chen, J. A. Plambeck, Biochem. Pharmacol., 31 (1982) 575.
22. R. L. Blankespoor, E. L. Kosters, A. J. Post, D. P. VanMeurs, J. Org. Chem. 56 (1991) 1609.
23. A. Kumbhar, S. Padhye and D. Ross, Biometals, 9 (1996) 235.
24. A. Bartoszek , Acta Biochim. Polonica, 49 (2002) 323.
25. D. O. Wipf, K. R. Wehmeyer, R. M. Wightman, J. Org. Chem., 51 (1986) 4760.
26. H. Lund, M. M. Baizer, Organic Electrochemistry, pp- 454, Third Edition, Marcel Dekker, Inc.,
New York.
27. D. Meisel, G. Czapski, J. Am. Chem. Soc., 79 (1975) 1503.
28. D. Meisel, R. W. Fessenden, J. Am. Chem. Soc., 98 (1976) 7505.
29. T. Mukherjee, E. J. Land, A. J. Swallow, J. Chem. Soc., Faraday, Trans. 1, 84 (1988) 2855.
30. V. A. Roginsky, L. M. Pisarenko, W. Bors, C. Michel, M. Saran, J. Chem. Soc., Faraday, Trans.,
94 (1998) 1835.
31. M. N. Schuchumann, E. Bothe, J. V. Sonntag, C. V. Sonntag, J. Chem. Soc., Perkin, Trans.2,
(1998) 791.
32. M. E. Peover, J. Chem. Soc., 1962, 4560.
33. J. H. Wilford and M. D. Archer, J. Electroanal. Chem., 190 (1985) 271.
34. J. S. Jaworski, E. Leniewska , M. K. Kalinowski, , J. Electroanal. Chem., 105 (1979) 329.
35. B. R. Eggins, J. Chem. Soc. D, 1969, 1267.
36. T. Fujinaga, K. Izutsu and T. Nomura, J. Electroanal. Chem., 29 (1971) 203.
37. M. F. Marcus, M. D. Hawley, Biochim. Biophys. Acta, 222 (1970) 163.
38. A. Ashnagar, J. M. Bruce, P. L. Dutton, R. C. Prince, Biochim. Biophys. Acta, 801 (1984) 351.
39. N. Gupta, H. Linschitz, J. Am. Chem. Soc., 119 (1997) 6384.
40. P. G. Marshall, J. Chem. Soc., 1931, 3206
41. G. Gonzalez, D. Rosales, J. L. G. Ariza, A. G. Perez, Talanta, 33 (1986) 105.
42. G. M. Rao, J. W. Lown, and J. A. Plambeck, J. Electrochem. Soc., 125 (1978) 534.
43. R. P. Baldwin, D. Packett, T. M. Woodcock, Anal. Chem., 53 (1981) 540.
44. K. Kano, T. Konse, N. Nishimura, T. Kubota, Bull. Chem. Soc. Jpn., 57 (1984) 2383.
45. M. Noel, K. I. Vasu, Cyclic Voltammetry and Frontier of Electrochemistry, pp- 135, 1990, Oxford
& IBH Publishing Co. Pvt. Ltd.
46. P. He, R. M. Crooks, L. R. Faulkner, J. Phys. Chem, 94 (1990) 1135.
47. Y. Hahn, H. Y. Lee, Arch. Pharm. Res., 27 (2004) 31.
48. L. M. Ignjatovic, J. M. D. Markovic, D. A. Markovic, J. M. Baranac, J. Serb. Shem., Soc., 67
(2002) 53.
49. R. L. Blankespoor, R. Hsung, D. L. Schutt, J. Org. Chem. 53 (1988) 3022.
© 2008 by ESG (www.electrochemsci.org)