Sodium transport and phosphorus metabolism in sodium-loaded yeast: simultaneous observation with...
10
Biochemistry 1987, 26, 4953-4962 4953 Sodium Transport and Phosphorus Metabolism in Sodium-Loaded Yeast: Simultaneous Observation with Sodium-23 and Phosphorus-3 1 NMR Spectroscopy in Vivo+ Herbert Hofeler,* Dye Jensen,$ Martin M. Pike,$,#Jean L. Delayre,$ Vincent P. Cirillo,’! Charles S. Springer, Jr.,*,§ Eric T. Fosse1,t and James A. Balschi*,* NMR Laboratory, Harvard Medical School, Boston, Massachusetts 021 15, and Departments of Chemistry and Biochemistry, Received January 29, 1986; Revised Manuscript Received March 27, 1987 State University of New York at Stony Brook, Stony Brook, New York 11 794 ABSTRACT: Simultaneous 23Na and 31P N M R spectra were obtained from a number of yeast suspensions. Prior to N M R spectroscopy, the yeast cells were Na-loaded: this replaced some of the intracellular K+ with Na+. These cells were also somewhat P-deficient in that they Lad no polyphosphate species visible in the 31P N M R spectrum. In the NMR experiments, the Na-loaded cells were suspended in media which contained inorganic phosphate, very low Na’, and a shift reagent for the Na+ NMR signal. The media differed as to whether dioxygen, glucose, or K+ was present individually or in combinations and as to whether the medium was buffered or not. The NMR spectra revealed that the cells always lost Na+ and gained phosphorus. However, the nature of the Na+ efflux time course and the P metabolism differed depending on the medium. The Na+ efflux usually proceeded linearly until the amount of Na+ extruded roughly equalled the amount of NH4+ and orthophosphate initially present in the medium (external phosphate was added as NH4H2P04). Thus, we presume this first phase reflects a Na+ for NH4+ exchange. The Na+ efflux then entered a transition phase, either slowing, ceasing, or transiently reversing, before resuming at about the same value as that of the first phase. We presume that this last phase involves the simultaneous extrusion of intracellular anions as reported in the literature. The phosphorus metabolism was much more varied. In the absence of exogenous glucose, the P taken up accumulated first as intracellular inorganic phosphate; otherwise, it accumulated first in the “sugar phosphate” pool. In most cases, at least some of the P left the sugar phosphate pool and entered the polyphosphate reservoir in the vacuole. However, this never happened until the phase probably representing Na’ for NH4+ exchange was completed, and the P in the polyphosphate pool never remained there permanently but always eventually reverted back to the sugar phosphate pool. These changes are interpreted in terms of hierarchical energy demands on the cells under the different conditions. In particular, the energy for the Na’ for NH4+ exchange takes precedence over that required to produce and store polyphosphate. This conclusion is supported by the fact that when the cells are “forced” to exchange K+, as well as NH4+, for Na+ (by the addition of 5 times as much K+ to the NH4+-containing medium), polyphosphates are never significantly formed, and the initial linear Na’ efflux phase persists possibly 6 times as long. The ultimate consumption of polyphosphate species probably occurs because (inorganic) phosphate is required for the metabolic processes which produce the anions for the Na+ anion coextrusion phase. Phosphorus-3 1 NMR spectroscopy has been widely used to study yeast metabolism [see Alger et al. (1982) and references cited therein and Nicolay et al. (1983) and references cited therein]. In a more recent development, the introduction of aqueous shift reagents for cation NMR (Pike & Springer, 1982; Gupta & Gupta, 1982) has made possible the discrim- ination of the extra- and intracellular 23Na and ’Li resonances +Supported by NSF Grants PCM 81-04630 and 84-08339 and NIH Grant GM 3212502 to C.S.S., by NSF Grant PCM 80-05570 and NIH Grant AI-20621 to V.P.C., by NIH Grants HL-18003 and HL-28432 to E.T.F., and by DFG Grant DFG-HO 925/1-1 to H.H. Presented, in part, at the Second Annual Meeting of the Society of Magnetic Reso- nance in Medicine, San Francisco, CA, Aug 1983 [for abstracts, see Balschi et ai. (1984) and Delayre et al. (1984)], and taken, in part, from the Ph.D. Dissertation of J. A. Balschi (Balschi, 1984) and the M.S. Thesis of D. Jensen (Jensen, 1983). INMR Laboratory, Harvard Medical School. $Department of Chemistry, State University of New York at Stony HDepartment of Biochemistry, State University of New York at Stony Brook. Brook. in suspensions of yeast cells (Balschi et al., 1982). This allowed the rather continuous monitoring of Na+ efflux from Na+-rich yeast in the latter study. Since ion transport often puts sig- nificant demands on metabolic processes, Shulman and co- workers have discussed the advantages of monitoring the 23Na and/or 39K NMR spectrum of a yeast suspension (containing shift reagent) along with the 31P NMR spectrum (Ogino et al., 1983). One of the more interesting aspects of yeast metabolism is the formation of vacuolar polyphosphate species, P,, in response to a number of different conditions [see Nicolay et al. (1983) and references cited therein and Durr et al. (1979) and ref- erences cited therein]. In particular, the question of whether the P, serve an energy storage function as well as that of phosphorus storage is fascinating but still unresolved. In the present study, we have again used yeasts (Saccharomyces cerevisiae) which are Na+ rich and, in addition, also P, de- pleted. We have monitored Na+ efflux from these yeasts under a number of different external conditions, all including added orthophosphate, Pi. By simultaneously observing the ”P NMR 0006-2960/87/0426-4953$01 SO10 0 1987 American Chemical Society
-
Upload
hms-harvard -
Category
Documents
-
view
3 -
download
0
Transcript of Sodium transport and phosphorus metabolism in sodium-loaded yeast: simultaneous observation with...

Biochemistry 1987, 26, 4953-4962 4953
Sodium Transport and Phosphorus Metabolism in Sodium-Loaded Yeast: Simultaneous Observation with Sodium-23 and Phosphorus-3 1 NMR Spectroscopy
in Vivo+
Herbert Hofeler,* Dye Jensen,$ Martin M. Pike,$,# Jean L. Delayre,$ Vincent P. Cirillo,’! Charles S. Springer, Jr.,*,§ Eric T. Fosse1,t and James A. Balschi*,*
NMR Laboratory, Harvard Medical School, Boston, Massachusetts 021 15, and Departments of Chemistry and Biochemistry,
Received January 29, 1986; Revised Manuscript Received March 27, 1987 State University of New York at Stony Brook, Stony Brook, New York 1 1 794
ABSTRACT: Simultaneous 23Na and 31P N M R spectra were obtained from a number of yeast suspensions. Prior to N M R spectroscopy, the yeast cells were Na-loaded: this replaced some of the intracellular K+ with Na+. These cells were also somewhat P-deficient in that they Lad no polyphosphate species visible in the 31P N M R spectrum. In the N M R experiments, the Na-loaded cells were suspended in media which contained inorganic phosphate, very low Na’, and a shift reagent for the Na+ N M R signal. The media differed as to whether dioxygen, glucose, or K+ was present individually or in combinations and as to whether the medium was buffered or not. The N M R spectra revealed that the cells always lost Na+ and gained phosphorus. However, the nature of the Na+ efflux time course and the P metabolism differed depending on the medium. The Na+ efflux usually proceeded linearly until the amount of Na+ extruded roughly equalled the amount of NH4+ and orthophosphate initially present in the medium (external phosphate was added as NH4H2P04) . Thus, we presume this first phase reflects a Na+ for NH4+ exchange. The Na+ efflux then entered a transition phase, either slowing, ceasing, or transiently reversing, before resuming at about the same value as that of the first phase. We presume that this last phase involves the simultaneous extrusion of intracellular anions as reported in the literature. The phosphorus metabolism was much more varied. In the absence of exogenous glucose, the P taken up accumulated first as intracellular inorganic phosphate; otherwise, it accumulated first in the “sugar phosphate” pool. In most cases, a t least some of the P left the sugar phosphate pool and entered the polyphosphate reservoir in the vacuole. However, this never happened until the phase probably representing Na’ for NH4+ exchange was completed, and the P in the polyphosphate pool never remained there permanently but always eventually reverted back to the sugar phosphate pool. These changes are interpreted in terms of hierarchical energy demands on the cells under the different conditions. In particular, the energy for the Na’ for NH4+ exchange takes precedence over that required to produce and store polyphosphate. This conclusion is supported by the fact that when the cells are “forced” to exchange K+, as well as NH4+, for Na+ (by the addition of 5 times as much K+ to the NH4+-containing medium), polyphosphates are never significantly formed, and the initial linear Na’ efflux phase persists possibly 6 times as long. The ultimate consumption of polyphosphate species probably occurs because (inorganic) phosphate is required for the metabolic processes which produce the anions for the N a + anion coextrusion phase.
Phosphorus-3 1 NMR spectroscopy has been widely used to study yeast metabolism [see Alger et al. (1982) and references cited therein and Nicolay et al. (1983) and references cited therein]. In a more recent development, the introduction of aqueous shift reagents for cation NMR (Pike & Springer, 1982; Gupta & Gupta, 1982) has made possible the discrim- ination of the extra- and intracellular 23Na and ’Li resonances
+Supported by NSF Grants PCM 81-04630 and 84-08339 and NIH Grant GM 3212502 to C.S.S., by NSF Grant PCM 80-05570 and NIH Grant AI-20621 to V.P.C., by NIH Grants HL-18003 and HL-28432 to E.T.F., and by DFG Grant DFG-HO 925/1-1 to H.H. Presented, in part, at the Second Annual Meeting of the Society of Magnetic Reso- nance in Medicine, San Francisco, CA, Aug 1983 [for abstracts, see Balschi et ai. (1984) and Delayre et al. (1984)], and taken, in part, from the Ph.D. Dissertation of J . A. Balschi (Balschi, 1984) and the M.S. Thesis of D. Jensen (Jensen, 1983).
INMR Laboratory, Harvard Medical School. $Department of Chemistry, State University of New York at Stony
HDepartment of Biochemistry, State University of New York at Stony Brook.
Brook.
in suspensions of yeast cells (Balschi et al., 1982). This allowed the rather continuous monitoring of Na+ efflux from Na+-rich yeast in the latter study. Since ion transport often puts sig- nificant demands on metabolic processes, Shulman and co- workers have discussed the advantages of monitoring the 23Na and/or 39K NMR spectrum of a yeast suspension (containing shift reagent) along with the 31P NMR spectrum (Ogino et al., 1983).
One of the more interesting aspects of yeast metabolism is the formation of vacuolar polyphosphate species, P,, in response to a number of different conditions [see Nicolay et al. (1983) and references cited therein and Durr et al. (1979) and ref- erences cited therein]. In particular, the question of whether the P, serve an energy storage function as well as that of phosphorus storage is fascinating but still unresolved. In the present study, we have again used yeasts (Saccharomyces cerevisiae) which are Na+ rich and, in addition, also P, de- pleted. We have monitored Na+ efflux from these yeasts under a number of different external conditions, all including added orthophosphate, Pi. By simultaneously observing the ”P NMR
0006-2960/87/0426-4953$01 SO10 0 1987 American Chemical Society

4954 B I O C H E M I S T R Y H O F E L E R E T A L .
Table I: Protocols for the Nat Efflux Experiments cell
wet wt of suspension external conditions yeast (E) I(w/v) %1 additions at time zero external medium at time zero
aerobic (only) 4.60 22.3 none standard medium" anaerobic (only) 4.39 21.5 none standard medium aerobic, potassium 4.80 23.1 1 mL of 300 mM KCI standard medium plus 18.8 mM Kt anaerobic, potassium 4.65 22.5 1 mL of 300 mM KCI standard medium plus 18.8 mM K+ aerobic, glucose 4.55 22.1 2 mL of 2.0 M glucose standard medium plus 250 mM glucose anaerobic, glucose 4.74 22.9 2 mL of 2.0 M glucose standard medium plus 250 mM glucose aerobic, glucose (buffered) 4.73 anaerobic, glucose (buffered) 4.63
22.8 22.4
2 mL of 2.0 M glucose 2 mL of 2.0 M glucose
standard medium plus 250 mM glucose plus 68 mM MESb standard medium plus 250 mM glucose plus 62 mM MESb
"Standard medium = 6.3 mM SR, 11.3 mM choline bicarbonate, and 3.8 mM NH4H2P04. bTitrated with choline bicarbonate to pH 6.8.
spectrum, we have been able to assay some of the metabolic manifestations of this process. In particular, we find the temporal correlations of a number of phenomena quite in- teresting.
EXPERIMENTAL PROCEDURES Reagents. The shift reagent (SR) cho13DyTTHA-3cholC1
where chol is choline was prepared as described by Chu et al. (1984). Other reagents used were as follows: NH,HzP04 (Fisher ACS certified grade) and choline bicarbonate (45%) (K & K Laboratories); 2-(N-morpholino)ethanesulfonic acid (MES), triethylenetetraminehexaacetic acid (H,TTHA), and N-(2-hydroxyethyl)piperazine-N-2-ethanesulfonic acid (HEPES) (Sigma); and DyCl3.6HZ0 (Alfa).
Preparation of Sodium-Rich Polyphosphate-Depleted Yeast. Red Star bakers' yeast (Standard Brands; Feb 1983; Long Island, NY) was washed 3 times with sterile distilled water and made up to a 50% (w/v) stock suspension. A portion of commercial yeast cake (not from the surface) was taken to assess cell viability. A volumetric aliquot of a sus- pension, whose cell density was known by hemocytometry, was incubated for 2-3 days on agar permeated with 1% yeast extract, 2% peptone, and 2% glucose. The colonies were counted, and 100 f 2% of the cells were found to be viable.
( A ) Sodium Loading. Typically, 16 mL of stock suspension (8 g of cells) was added to 400 mL of a 0.2 M trisodium citrate/5% (w/v) (278 mM) glucose solution and bubbled with 95% 0 2 / 5 % COz while being slowly stirred at room temper- ature (Rothstein, 1974). Loading lasted about 2 h on the average.
( B ) Harvesting, In order to minimize Na+ efflux during harvesting, the Na+ loading suspension containing the yeasts was cooled on ice prior to spin down. Equal portions of sus- pension were added to each of two tubes which were then centrifuged at 4000 rpm for 4 min at 20 OC. The supernatants were discarded. The remainder of the loading suspension was then divided equally between the two tubes already containing pelleted yeast, and 100 mL of ice-cold distilled water was added to each. These were centifuged as above, and the su- pernatants were discarded. Each portion of the yeast was resuspended in 150 mL of cold distilled water and centrifuged as above. The supernatants were again discarded. The yeast pellets thus washed were weighed and resuspended in cold standard medium. The standard medium consisted of 6.3 mM SR, 11.3 mM choline bicarbonate, and 3.8 mM NH4H2P04. An aliquot of a suspension of Na+-loaded yeast cells was also taken for a viability determination as described above. It was found that 94% of these cells were alive.
The yeasts used in this study, at least after loading and harvesting, were polyphosphate depleted. Some batches of commercial yeasts contain polyphosphates. The reason for this variation is not known. However, variations in the nitrogen source, substrate, and exogenous phosphate are known to in-
fluence polyphosphate levels [den Hollander et al., 1981; see Durr et al. (1979) and references cited therein; Salhany et al., 19751. It should also be noted that the Na+-loaded yeast cells are, formally, not starved cells.
Nu+-Efflux, Pi-Influx Experiments. The different gas phases and the different additions for the different experiments are indicated in Table I. The external concentrations of substances added to the suspensions were calculated on the basis of the volumes of the solutions added and assuming a yeast density of 1 g/mL (Cirillo, 1968).
The samples for NMR experiments typically consisted of 20 mL of the cell suspension in 20-mm 0.d. NMR tubes. In the aerobic experiments, a 95% Oz/5% COz gas mixture was bubbled through the suspension; in the anaerobic experiments, the gas mixture was 95% N2/5% C02. In all experiments, the gas mixture was bubbled through a two-bubbler device es- sentially the same as that described by den Hollander et al. (1981). The probe tuning (23Na and 31P) was adjusted with a standard yeast sample prior to the beginning of the exper- iments. Each sample was placed in the probe and warmed to the probe temperature (ca. 25 "C). The beginning of ac- quisition of the first spectrum was usually ca. 3 min after the yeast pellet was resuspended in the cold standard medium. For the first two experiments in Table I, this served as the defi- nition of time zero. For the other experiments, the addition of either KCl or glucose solutions (via the bubbler gas line) defined time zero, but this was still about 3 min from resus- pension. After ca. 2 h of aerobic (only) efflux (Table I ) , another aliquot of the resulting suspension was taken for vi- ability determination. It was found that 90% of these cells were viable. Thus, although the cells are not actually growing during the efflux, they are certainly alive and capable of growth. Also, at the end of most efflux experiments, the external pH was measured with a pH meter. The values were entirely consistent with extrapolations from the spectral data.
NMR Spectroscopy. All NMR experiments were conducted on a Nicolet NT-360 WB instrument modified for simulta- neous 23Na and 31P observe capability by the provision of two entirely separate NMR transmitter/receiver channels (in- cluding pulse programmers and computers) (Jensen, 1983; Delayre et al., 1984). The 23Na spectra (95.24 MHz) were obtained with a coil double-tuned to the 23Na and ZH (55.3- MHz) frequencies and with a spectral width of 4000 Hz represented by 2K data points. The pulses of 95-MHz radio frequency (pulse width = 85 p s ) produced 90" spin flips. The 31P spectra (145.75 MHz) were obtained with a separate coil in the same probe, simultaneously, with a spectral width of 8000 Hz represented by 2K data points. The pulses of 146- MHz radio frequency (pulse width = 12 gs) produced 30" spin flips.
The pulse recycle time was 0.34 s, similar to that used by den Hollander et al. (198 1). Although this is greater than 6 times the largest T I value for 23Na, it does not produce a fully
2 3 N A A N D 3 1 P N M R O F Y E A S T V O L . 2 6 , N O . 1 6 , 1 9 8 7 4955
relaxed 31P spectrum. Assuming that T1 values do not change, temporal trends in the areas of individual 31P NMR peaks reflects trends in concentrations. In any case, the total area under all the 31P peaks does not change much during the course of an efflux experiment (see below). A total of 360 transients was accumulated for each (23Na and )IP) spectrum. The total accumulation time was equal to 2 min. The accumulated free induction decays (FID) for each nucleus were separately stored on hard disks. Before Fourier transformation, the 23Na FID were multiplied by an exponential function sufficient to gen- erate an 8-Hz line broadening, and the 31P FID were multiplied by an exponential function sufficient to generate a 20-Hz line broadening.
The 23Na spectra are referenced to the intracellular peak which is set equal to zero. The 31P spectra are referenced to the peak of intracellular NAD which was set equal to 10.9 ppm (upfield from external 85% phosphoric acid). This was chosen because it could be observed in both the anaerobic and the aerobic experiments and because its chemical shift does not titrate with pH (Salhany et al., 1975). The pH values were determined from the chemical shifts of the Pi resonances by using the pH/chemical shift titration curve of Burt et al. (1979). The absolute values of these pH determinations may have some error associated, but the temporal trends should be reasonably error free. The latter are of most interest to us here.
Spectral integrations were accomplished by using the ID integration subroutine of the N M C spectral operation pro- gram. For certain spectral regions, the NMRCAP subroutine was used to resolve overlapping peaks and to measure their areas. This was necessary in the low-field regions of the 31P spectra. The areas of the 23Na resonances were calibrated by using a set of NaCl standards (which included the SR and were bubbled) of known concentration as described by Pike et al. (1984). The areas of both the 23Na and 31P resonances were also calibrated by measuring the increases in the areas of the appropriate peaks when 206 pmol of NaH2P04 was added to a yeast suspension.
The computation of the fraction of total Na+ which is ex- tracellular,fNa, is a bit involved. If one inspects Figure 1 and 2 carefully, one observes that the total 23Na signal intensity increases as Na+ efflux proceeds. This has been reported earlier (Balschi et al., 1982; Ogino et al., 1983), and it means that the Na+-loaded yeast, at least, exhibits some 23Na NMR invisibility.
Of all the experiments of Table I, we followed the Na+ efflux in the presence of O2 and K+ (Le., that depicted in Figure 1) to the greatest extent of intracellular Na+ depletion. We conducted NMR and FP analyses on a sample identical with that of Figure 1 [except 4.58 g (w/w)] after 2 h (120 min) of Na' efflux in the presence of 02, K', and SR. The NMR analysis consisted of comparing the total area of the inside and outside peaks in the spectrum of intact yeast cells with those of the calibrating standards (Pike et al., 1984). It yielded a value of 30.6 mM (f4%) Na' based on the total sample volume. The FP analysis of the same sample yielded a value of 30.5 mM (f3%). From this good agreement, we conclude that extracellular Na+ is 100% NMR visible in these suspensions of yeast cells. This is in agreement with the results of Shulman and co-workers (Ogino et al., 1983). The NMR visibility of intracellular Na+ in the Na+-loaded yeast is an- other matter, being significantly less than 100% (Balschi, 1984; Ogino et al., 1983). This will be discussed more thoroughly in a subsequent paper (J. A. Balschi et al., unpublished results).
"P NMR ''No NMR
0 - 2 c =mY
t i m a (man)
102 9
43 0
35 7
28 8
21 9
I5 I
8 1
3 6
6 I
/ J JL F
FIGURE 1 : Simultaneous "P (145.75 MHz) and 23Na (95.24 MHz) NMR spectra obtained at 8.5 T on a suspension of Na+-loaded yeast. The yeast are suspended (23.1% w/v) in a medium which is low in Na' and which contains 3.8 mM NH4H2P04 and 6.3 mM cho13DyTTHA.3cholC1, a downfield shift reagent for the 23Na signal. The suspension was bubbled with 95% 0 2 / 5 % C02, and each pair of spectra is marked with the time of the midpoint of the acquisition which had elapsed since the external medium was made 18.8 mM in KCI. This is the third experiment listed in Table I. The numbered peak assignments are given in the text.
The value of fNa was calculated at any point in time by dividing the area of the external Na' resonance at that time by the total area expected at long times, when the Na' could be reasonably expected to be almost completely extracellular. This latter quantity was calculated for each experiment by multiplying the total area of the 23Na NMR spectrum of the 02, K+ study at 102.9 min (Figure 1) by the ratio of yeast wet weight in the particular experiment over the yeast wet weight in the 02, K+ experiment (4.80 g, Table I). This was done in order to correct for the slightly varying amounts of Na+ and the fact that, for most experiments, we ceased monitoring the Na' efflux well before complete depletion was achieved (Balschi, 1984).
Flame Emission Photometry. Flame photometric (FP) analyses for Na+ were conducted by using a Corning flame photometer, Model 430. This instrument was calibrated and the analyses were conducted as described for erythrocytes by Pike et al. (1984).
RESULTS Figures 1 and 2 present examples of the 31P and 23Na NMR
spectra observed in these experiments. Figure 1 depicts rep- resentative spectra obtained during Na' efflux from and Pi influx into Na+-rich, P,-depleted yeast in the presence of both O2 and K+. Although only 8 31P and 23Na spectra are shown, 21 pairs of simultaneous 31P/23Na spectra were obtained

H O F E L E R E T A L . 4956 B I O C H E M I S T R Y
O,, glucose
“P N M R
-23 c c c
t ime Imin)
122 4
46 8
39 8
2 8 9
21 9
14 8
8 0
3 4
“No NMR
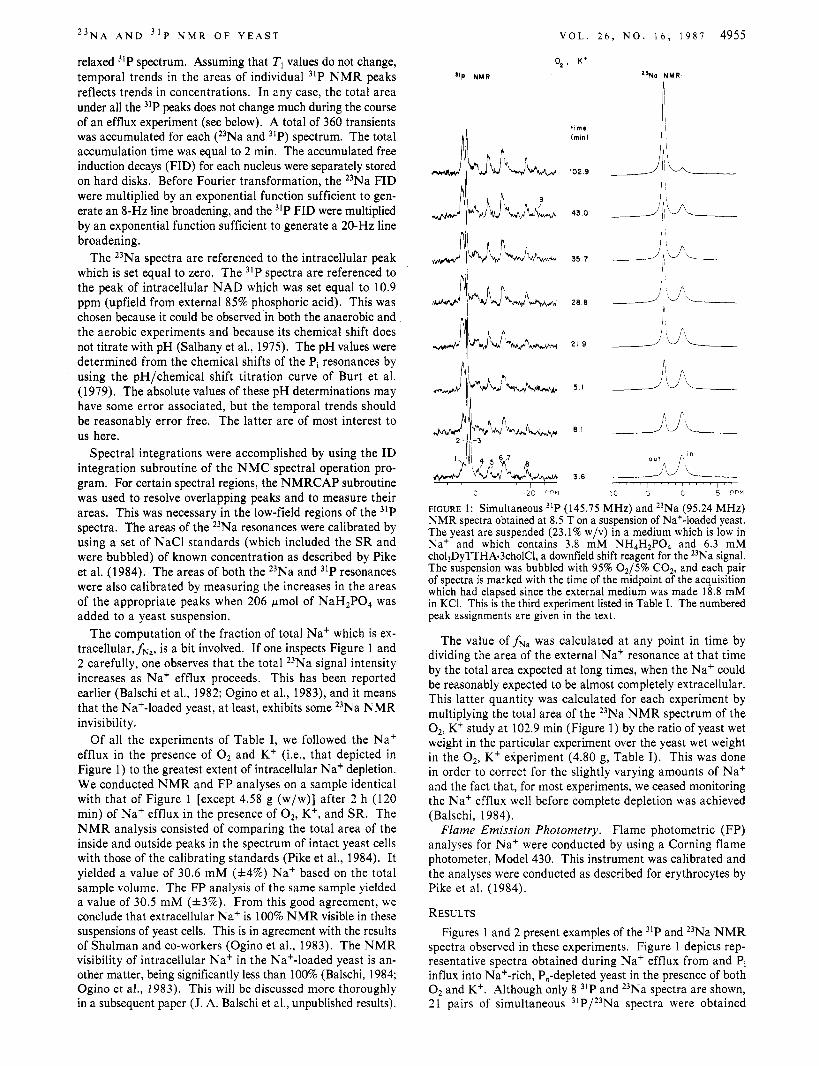
FIGURE 2: Simultaneous ”P (145.75 MHz) and 23Na (95.24 MHz) NMR spectra obtained at 8.5 T on a suspension of Na+-loaded yeast. The yeast are suspended (22.1% w/v) in a medium which is low in Na+ and which contains 3.8 mM NH,H2P0, and 6.3 mM cho13DyTTHA~3cholC1, a downfield shift reagent for the Z3Na signal. The suspension was bubbled with 95% 02/5% COz, and each pair of spectra is marked with the time of the midpoint of the acquisition which had elapsed since the external medium was made 250 mM in glucose. This is the fifth experiment of Table I.
during this time period. The times shown are those elapsed from the addition of KCl to the medium and are measured to the midpoints of the spectral acquisitions. The peaks in the 31P spectra are enumerated. Their assignments are as follows: (1) phosphomonoesters (sugar phosphates, sP); (2) intracellular (probably cytoplasmic) orthophosphate (inorganic phosphate, PI), (PJ1; (3) extracellular inorganic phosphate, (PI),; (4) unassigned; (5) y-P of adenosine triphosphate (ATP and P-P of adenosine diphosphate (ADP); (6) a-P of ATP and a-P of ADP; (7) P of oxidized and reduced nicotinamide adenine dinucleotide, NAD; (8) P-P of ATP; (9) nonterminal P of polyphosphate (P,). This latter peak is seen more clearly in Figure 2. These assignments are based on those of Shulman and co-workers [Ogino et al., 1983; see Alger et al. (1982) and references cited therein; den Hollander et al., 1981; Salhany et al., 1975; Gillies et al., 1981; Navon et al., 1979; Ugurbil et al., 1978)] and Kaptein and co-workers [Nicolay et al., 1982; see Nicolay et al. (1983) and references cited therein]. The different resonance frequencies of the PI peaks are most likely not due to the presence of the shift reagent in the medium but to the fact that external pH (ca. 6.7) is lower than that of the intracellular milieu. The assignments of the 23Na spectra are clear since DY(TTHA)~- is a downfield SR for 23Na+ (Chu et al., 1984). They are indicated in the figure.
I t is quite evident in Figure 1 that after 102.9 min, most of the Na+ (89%, in fact) is extracellular. While this Na+ efflux is occurring, the 31P spectrum shows that PI is being
taken up by the cells. The area of the (Pi), peak (3) decreases while that of the (Pi), peak (2) increases.
Figure 2 shows selected spectra from a similar experiment except that glucose was substituted for the K+ of Figure 1. While the Na+ efflux and P influx proceed in a similar manner, the 31P spectra reveal a metabolic pattern different from that of Figure 1 (see below). Also, as time progresses, the extra- cellular Na+ peak shifts back upfield toward the intracellular peak. This is due to the fact that the yeast cells excrete protons during Na+ efflux under these conditions. Although the DY(TTHA)~- SR is not unduly pH sensitive, the shift it induces in the Na+ resonance does decrease below a pH of 5.5 (Chu et al., 1984). The (PJ0 peak shifts upfield with time (as its area decreases) also indicating a decreasing external pH. If the external medium is buffered at pH 6.8 with 68 mM MES, the 23Na spectral splitting remains constant with time, and the (P,), peak remains unshifted [spectra not shown here, but see Balschi (1984)l.
One might note the relatively poor quality of the 31P spectra, especially in the rich low-field region. There are two reasons for this. First, the short spectral accumulation time leads to a low signal to noise ratio. Even though the spectral param- eters are set to reduce the effects of long 31P relaxation (es- pecially that of the PI resonances), the accumulated 23Na signal is so strong (partly because of its short TI) that the time resolution it allows is much better than that allowed by the 31P signal. Thus, the total acquisition time used was a com- promise between the good time resolution allowed by the 23Na spectrum and the time required for a strong 31P spectrum. This will always be an aspect of the simultaneous acquisition of spectra from different nuclei. Second, there is a broadening of the 31P peaks representing intracellular molecules due to the presence of the paramagnetic SR in the extracellular medium. This has been noted for Na, before (Balschi et al., 1982; Pike et al., 1984) and is probably due to magnetic susceptibility gradient effects (Brindle et al., 1979; Fabry & San George, 1983). Since the Guptas’ SR, DY(PPP)~’-, produces larger shifts of the 23Na resonance (Chu et al., 1984), it would be better in this regard, provided it was not harmful to the cells. If it retained its shift potency, the lower con- centration of paramagnetic species required to produce the same 23Na shift would produce less broadening of the intra- cellular resonances. We have demonstrated this with sus- pensions of human erythrocytes (Pike et al., 1984). Despite these problems with the simultaneous acquisition of 23Na and 31P NMR spectra, Figures 3-8 demonstrate the abundance of information which they contain. In addition, as we will see, there are inferences which would be difficult to reach without the absplute simultaneity of the acquisitions.
Spectra like those in Figures 1 and 2 were obtained for each of the experiments listed in Table I (Balschi, 1984). These were analyzed for the areas under the 31P and 23Na peaks and for the chemical shifts of the two PI peaks. Some of the results are presented in Figures 3-8. The ordinates of these plots indicate the fraction,f, of the total NMR-visible phosphorus (Le., the total area under all the 31P NMR peaks), the fraction of the total sodium, or the pH value. The unity value off corresponds to ca. 240 pmol of P or ca. 610 pmol of Na (in a 20-mL yeast suspension). In the case of ATP, the ordinate represents 3 times the fractional area of the @ resonance. The other ATP peaks are strongly overlapped with resonances of other species. The /3 resonance itself is strongly overlapped with terminal resonances of the polyphosphate species [Navon et al., 1979; Gillies et al., 1981; Nicolay et al., 1982; see Alger et al. (1982) and references cited therein]. However, the levels

2 3 N A A N D 3 1 P N M R O F Y E A S T V O L . 2 6 , N O . 1 6 , 1 9 8 7 4957
.-A- d+--
oL.-.------- 't 4- pHo
7 *a*cu,wum.m. 0 P H ,
6
L --__ ___i--
0 20 40 60 80 100 120 140 160 time (min)
FIGURE 3: Time dependence of spectral data from the first experiment of Table I; that with aerobic (only) medium. The ordinates of the top five curves are the fractions of NMR-visible phosphorus. That of the next curve is the fraction of total Na+ while those of the bottom two curves are pH values. The dashed lines are intended only to guide the eye. The vertical dashed line is drawn to mark the time of the end of the initial period of Na+ efflux.
Table 11: Relative Initial Na+ Effluxes
*I
N2 0 2 K+ glucose glucose, buffer N2 1.0' 0.98 2.0 1.6 0 2 1.6 2.2 1.7 1.7 "Actual magnitude: ca. 11 umol of Na's-' Ika (wet wt) of veastl-I.
of polyphosphate produced in our experiments are never so great that tbis represents a significant error (unless the average oligomeric state of the polyphosphate species is quite small). The only experiments not shown in Figures 3-8 are those under anaerobic conditions in unsupplemented standard medium (Balschi et al., 1984; Balschi, 1984) and in K+-supplemented medium (Balschi, 1984). In both cases, the Na+ efflux is slow (Table 11), and the P, influx is very slow.
Except for the 02/K+ experiment (Figure 4), the Na+ efflux is not linear over most of the time course observed [this is also true for the two anaerobic experiments not shown (Balschi, 1984)l. An initial linear efflux averages 14.7 min and rep- resents the extrusion of an average of 6 1.5 pmol of Na'. The actual efflux values for the initial linear periods are given in
..
0 1 i - . . _ _ L - - . .
7 1 4 PHO
--
'i----.. 6 PHI
LL-i.-i.-- 0 20 40 60 80 100 120 140 160
time ( m i d
FIGURE 4: Time dependence of spectral data from the third experiment of Table I; that with aerobic, K+-containing medium. Some spectra from this experiment are shown in Figure 1. The ordinates are the same as those of Figure 3. The dashed lines have the same significance as those of Figure 3. For the fifth curve, Na,, the intersection of the two straight dashed lines indicates the suspected end of the initial period of Na+ efflux.
Table 11. In other experiments, we have varied the initial external concentration of NH4+ (no K+). The amount of Na+ extruded during the initial linear efflux is proportional to the concentration of NH4', but only if it is added as the H2P04- salt. If NH4Cl is added, in addition to NH4H2P04, the initial Na' efflux value is greater, but the amount of Na' extruded is still roughly equal to the amount of external P,.
After the linear phase, Na' efflux either decreases (Figures 3 and 8), stops (Figures 6 and 7), or actually reverses (Figure 5) for only a short period which averages ca. 10 min. Sub- sequently, the cells enter another phase where the efflux usually resumes with a value similar to that of the initial phase. During this last phase, the cells lose much of their remaining sodium.
During the first phase of Na+ efflux, P enters the cells from the medium. This usually results in a rapid net increase in the sP pool of P, except when glucose is not added to the medium (Figures 3 and 4). In these latter two cases, there is instead an initial net increase in the intracellular P, pool. What sP is formed must come from the endogenous sugar reserves (glycogen and trehalose) which are mobilized initially

4958 B I O C H E M I S T R Y
I .
H O F E L E R E T A L .
t
SP
.' I'
I Na,
2 , A . . S ' ' i 0 t 7: 64'*" PH,
0 20 40 60 80 100 120 140 160 time ( m i d
FIGURE 5 : Time dependence of spectral data from the fifth experiment of Table I; that with aerobic, glucose-containing medium. Some spectra from this experiment are shown in Figure 2. The ordinates are the same as those of Figure 3. The dashed lines have the same significance as those of Figure 3.
by the availability of (PJi and later by P,. In other experiments (non-NMR as well as NMR), we have found that when the yeast cells already have polyphosphate species present a t the end of the Na+-loading and washing period, the uptake of Pi is much slower.
The ATP level rises slightly during the course of these experiments [except for the O2 (only) study (Figure 3)]. The level of ATP before commencement of gas bubbling is un- known. Certainly, in the two Na+-efflux, Pi-influx experiments where neither 0, nor glucose is provided, the ATP level of the yeast is barely detectable (Balschi, 1984; Balschi et al., 1984). However, in the aerobic (only) experiment, where the yeast were prepared identically, ATP is already present at an almost steady-state level when we obtain our first spectrum (Figure 3). In the other analogous experiments where either O2 or glucose was present, the ATP level was also quite high already at the beginning (see Figures 1, 2, 4, 5, and 7) . Either ATP was significant a t the end of the Na+-loading and washing period and dropped very quickly upon bubbling with N, or the ATP level was quite low a t the end of the Na+-loading and washing period and was quickly regenerated upon bubbling with O2 or injection of glucose. We suspect the latter is the case because of the noticeable rise in ATP level from near zero
f
t
_-_- __--- 0 20 40 60 80 100 120 140 160
t ime ( m i d FIGURE 6 : Time dependence of spectral data from the sixth experiment of Table I; that with anaerobic glucose-containing medium. The ordinates are the same as those of Figure 3. The dashed lines have the same significance as those of Figure 3.
a t the beginning of the two anaerobic experiments in glu- cose-containing media (Figures 6 and 8).
Perhaps the most interesting result observed in these studies is that polyphosphate species are usually formed during the course of the experiment [except in the 0 2 / K + case (Figure 4) and in the two anaerobic experiments not shown (Balschi et al., 1984; Balschi, 1984)l. There are three important generalities to be noted with regard to the formation of P,. First, the P, is never formed until after an initial lag period the length of which correlates rather well with that of the initial linear Na+-efflux period [but also with the exhaustion of (PJJ. During this time, of course, P is rapidly entering the cells. In other cases where the formation of polyphosphate species has been observed, the initiation of formation has been coincident with the beginning of plasmalemma1 P influx (J. A. Balschi et al., unpublished results; Balschi, 1984; Gillies et al., 1981). Second, the P stored in the P, species appears usually to derive mostly from the SP pool, as evidenced by very sharp drops in the level of the latter. This transformation is very rapid and has also been reported by Nicolay et al. [see Nicolay et al. (1983) and references cited therein]. Third, the formation of polyphosphate species is always transient. They are always ultimately consumed, and the final distribution of NMR-visible

2 3 N A A N D 3 1 P N M R O F Y E A S T V O L . 2 6 , N O . 1 6 , 1 9 8 7 4959
0, glucose buffer
.: SP ' e ,
4 ,( .*%' '. '
'
2 1
'I
L- ___-_ii__
o 20 40 60 80 100 120 140 160 t ime (min)
FIGURE 7: Time dependence of spectral data from the seventh ex- periment of Table I; that with aerobic, glucose-containing, buffered medium. The ordinates are the same as those of Figure 3. The dashed lines have the same significance as those of Figure 3.
cellular P is mostly in the sP pool (except in the experiment of Figure 4).
DISCUSSION The Na+-rich yeast prepared in this study were loaded with
Na+ in the absence of external phosphate (Rothstein, 1974). The cells are loaded to a level of ca. 100 mM Na+; the in- tracellular K+ concentration is reduced to about 30 mM (Rothstein, 1974).
The amount of Na+ extruded during the initial linear efflux phase (61.5 pmol, on the average, see Results) is approximately equal to the amount of NH4+ and therefore also Pi (58.9 pmol, on the average) initially present in the extracellular medium (recall that NH4+ was added as the H2P04- salt). We believe that this is significant and that the initial linear Na+ efflux is the result of an energy-dependent one-for-one Na+/NH,+ exchange process. The relative efflux values during this period are remarkably similar (1.6-2.2) for all experiments except the two where neither O2 nor exogenous glucose is present (Table 11). This latter fact is indicative of the energy re- quirements of this phase. The analogous Na+/K+ exchange has been shown to be energy dependent (Rodriguez-Navarro & Ortega, 1982), and Peiia has recently shown that NH4+ can behave as a K+ surrogate except that it probably enters the
f
ATP
O U ' 'I- 6 pH,
L. --A-
0 20 40 60 80 100 120 140 160 t i m e (min)
FIGURE 8: Time dependence of spectral data from the eighth ex- periment of Table I; that with anaerobic, glucose-containing, buffered medium. The ordinates are the same as those of Figure 3. The dashed lines have the same significance as those of Figure 3.
cell through a different pathway [Peiia et al., 1987; see also Bogonez et al. (1983)l.
The scheme in Figure 9 depicts many of the transport pathways known to be present in yeast (Borst-Pauwels, 1981) and which are probably employed for Na+/NH4+ exchange. The influx of NH4+ down its electrochemical gradient, whether facilitated (process IX, Figure 9) as pictured by Pefia or via some more complicated mechanism, would tend to depolarize the cell except for the nearly stoichiometric influx of H2PO4-, most likely through the high-affinity proton-phosphate co- transporter (Borst-Pauwels, 1981) (process 11, Figure 9). In any case, if intracellular NH4+ replaces intracellular Na', this would stimulate Na+ extrusion via the Na+/H+ antiporter (process VII). To the extent that process VI1 is as (or more) electrogenic than the analogous Li+/H+ exchange (Rodriguez-Navarro & Ortega, 1982; Rodriguez-Navarro et al., 1981), it would tend to depolarize the cell [(Na+/H+) < 1). A typical yeast cytoplasmic membrane potential is ca. 80 mV (inside negative) (Boxman et al., 1982; Vacata et al., 1981). Thus, an NH4+ influx will cause a stimulation of the electrogenic H+/ATPase (process VIII) in an attempt not only to eliminate protons brought in by VI1 but possibly also to maintain the transplasmalemmal potential (Goffeau & Slay- man, 1981; Borst-Pauwels, 1981).

4960 B I O C H EM IS T R Y H O F E L E R E T A L .
medium 1 I c;toplosm
+
--. I _ _ _ - _ _ _ - - - - - - - + g l u
I
I
EtOH + CO,+- - - - - - - - -E tOH + CO,q--- - - p y r L *
‘, I Y 0 2
k. - ,anions- + HCO; e- - .
PT s i - : . .- ’ -.. . . ~ H’ ? . - -
Na’
H * PIT
4m
Ix x K ’ *
* A T P consuming NH: process
glucose
PY’ pyruvate
FIGURE 9: Some relevant transport and metabolic processes. Some numbers refer to metabolic processes indicated in Table 111.
The above describes an energy-dependent ion-exchange process. Although the NH4+ transport is initially down its electrochemical potential gradient, almost all of the Na+ ex- trusion is energetically uphill as long as the normal membrane potential is more or less maintained. We also detect a small amount of extracellular Na+ at the beginning of the experiment (Figures 1 and 2; Balschi et al., 1984; Balschi, 1984), and we can calculate it to be 5 mM on the average by extrapolating the efflux curves back to time zero. This almost certainly results from insufficient washing of the cells after the Na+- loading incubation. (Hopefully, the low temperature prevents significant Na+ efflux until the sample is warmed in the NMR probe.) Thus, although the Na+ efflux may not start against its electrochemical potential gradient, it must quickly became an uphill process. The combination of the electrogenic (?) NH4+ and H,P04- transport processes, with the activities of the electrogenic H+/ATPase, and the electrogenic (?) Na+/H+ antiporter produce an “effective Na+/NH,+-ATPase”. (Normally, this acts as an “effective Na+/K+-ATPase” em- ploying process X.)
As mentioned under Results, recent experiments suggest that the NH,+ influx into Na+-loaded yeasts is intimately tied to Pi influx. This may mean that the actual mechanism involves the transport of extra protons by the proton-phosphate co- transporter (process 11, Figure 9) and the simple unfacilitated inward diffusion of NH3, present at equilibrium (process I ) . Shift reagent I4N NMR experiments have shown that unfa- cilitated diffusion of NH, across phospholipid bilayer mem- branes is extremely rapid (Balschi, 1984).
We believe that the energy dependence of the first phase provides the key to interpreting our unusual polyphosphate observations. In other cases, the formation of P, species begins as soon as P begins entering the cell (J. A. Balschi et al., unpublished results; Balschi, 1984; Gillies et al., 1981). However, the storage of P in the form of P, requires energy
[see Nicolay et al. (1983) and references cited therein]. This apparently cannot compete successfully with the ion transport processes described above. While the cells are using energy to exchange Na+ for NH4+, they are “energy stressed” and seem not to be able to store their newly acquired P as poly- phosphate. This is demonstrated most dramatically in the aerobic experiments. It is only when the extracellular NH4+ is exhausted that there is a low enough demand on ATP to allow P, synthesis in these experiments. When this happens, the P comes mostly from the sP pool. When the medium is supplemented with 18.8 mM K+, in addition to the 3.8 mM NH4+, the initial linear phase extrudes much more Na+ [probably 5.9 times as much, (18.8 + 3.8)/3.8, Figure 41. Both the Na+/K+ exchange and the Na+/NH,+ exchange require that the cells expend energy. This is the only aerobic experiment where polyphosphate species are never significantly formed (Figure 4).
In addition to the kinetic considerations given above, the amounts of Na+ pumped and P, species transiently formed seem to qualitatively correspond to the amount of energy available to the cell. A qualitative ATP balance sheet is given in Table 111. Energy is available to the cells from either endogenous or exogenous energy sources. Yeast cells use their endogenous reserves sparingly by comparison with exogenous energy sources so that the amount of energy from endogenous metabolism is much lower than from metabolism of exogenous substrates. Furthermore, although yeast cells can both ferment (process 1, Table 111, Figure 9) and respire (process 2) their endogenous reserves, the energy derived from endogenous respiration is greater than that from endogenous fermentation (Sols et al., 1971). Externally added glucose can provide energy both from fermentation (glycolysis) and from respi- ration.
The competition between ion transport (process 3) and polyphosphate synthesis (process 4) in energy-limited cells is

2 3 N A A N D 3 1 P N M R O F Y E A S T V O L . 2 6 , N O . 1 6 , 1 9 8 7 4961
Table 111: Oualitative ATP Balance Sheet ~
relative amount of ATP production experiment fermentation (glycolysis) (1)4 respiration (2)" N2 (only) lXb (endogenous) N,, K+ 1 X (endogenous) N2, glucose 7x 0 2 (only) SX (endogenous) 0 2 , K+ SX (endogenous) 0,. glucose 9 x
relative amount of ATP consumption Na+/K+ (NH4+)
1x 1x 1x 2x 4 x 1x 4 x 5x 1x 4 x 4 x
exchange (3) P, synthesis (4) glycogen synthesis (5)"
' ExDected. not measured. bThe svmbol X reDresents an unknown constant.
also observed in cells under anaerobic conditions (Table 111). Thus, in anaerobic cells without exogenous glucose, in which ATP synthesis is low, only ion transport is observed. In anaerobic cells metabolizing glucose, the additional energy supports both ion transport and P, synthesis although the latter still only after the former is completed. While the results with cells under anaerobic conditions are consistent with this pro- posal, it is surprising that the amount of p,, synthesized by cells metabolizing externally added glucose under anaerobic con- ditions (fermentation) is less than that by cells carrying out endogenous respiration (in the absence of external K') since the energy yield from such exogenous fermentation should be greater than that from endogenous respiration. The lower P, synthesis in the former case suggests that an additional en- ergy-consuming process may be competing with P, synthesis. The most probable reaction would be glycogen synthesis (process 5 ) ; however, we have no direct evidence to support this suggestion.
In all of the experiments, there is still intracellular Na' to be eliminated when the extracellular NH4' (and K', in the experiment of Figure 4) is exhausted. However, there is no longer any extracellular monovalent inorganic cation to be exchanged. Under these conditions, the mechanism preferred by the yeast is Na'/anion coextrusion (Rothstein, 1974). We surmise that the last, mostly linear, efflux phase is the man- ifestation of this process (VI in Figure 9). It is curious that the value of this efflux is, in general, similar to that of the first phase. Perhaps the rate-limiting step is the same because Na' actually exists only via the same Na+/H' antiporter, VII, and only the protonated anions by a separate process, VI. The anions required for extrusion, mostly succinate and bicarbonate (Goffeau & Slayman, 1981; Rothstein, 1974), must be pro- duced by oxidative phosphorylation in the mitochondrion. Since the latter process requires the utilization of Pi, the P stored in P, after the end of the first phase of Na' efflux is mobilized as required during the course of the last phase. Since this latter phase is not energy requiring (Rothstein, 1974), the observed consumption of P, does not answer the important question as to whether ATP is produced upon hydrolysis of
During the transition between the first and last Na' efflux phases, the Na+ efflux is transiently reduced. This is probably necessitated by the requirement for the buildup of sufficient levels of extrudable anions. In one curious case, the experiment with O2 and glucose present in an unbuffered medium, a transient Na+ influx actually occurs (Figure 5) . (This has also been observed in a non-NMR experiment.) This cannot be due to the well-known Na+/Pi cotransporter (111) (Borst- Pauwels, 1981) since the extracellular P, is essentially ex- hausted by the time this occurs. This is also most likely not due to the Na+/H+ antiporter (VII) since the 23Na spectrum indicates that the medium is quite acidic at this time. This is one of the two cases where the medium becomes consid- erably acidified during the first phase (the other is that of
Pn*
Figure 6). Perhaps the cells become transiently hyperpolarized and the Na' is electrophoresed in through the K+ (or NH4') channels. Since this influx does not occur when buffer ions are present in the medium (Figure 7), perhaps the lower ex- tracellular ionic strength extant in the experiment of Figure 5 allows the Na+ ions to easily sense a transient hyperpolar- ization [possibly via surface potential effects (Borst-Pauwels, 1981)l.
The fa:t that the intracellular P accumulated during the courses of these experiments is ultimately mostly stored in the sP pool is interesting. It may suggest that glycolytic inter- mediates accumulate upstream of a block in glycolysis (Thompson & Torchia, 1984). Although our analysis of the composition of the "sugar phosphate" pool is seriously ham- pered by our unavoidably poor spectral resolution, the accu- mulated sugar may contain large amounts of fructose di- phosphate (FDP). The chemical shift observed is consistent with this possibility. This suggests that the cells carry out a form of in vivo Harden-Young reaction (eq 1) by which a 2Pi + 2 glucose - FDP + 2EtOH + 2C02 + 2 H 2 0 (1)
portion of the endogenous sugar reserves are metabolized and a portion converted to sugar phosphate. However, we have no hard data to support this suggestion.
ACKNOWLEDGMENTS We thank Professor Antonio Pefia for alerting us to
Na+/NH4+ exchange and for a preprint of his paper. We thank Dr. John Baldo of General Electric for the construction of the probe used in this work, Professor Robert G. Gillies for a stimulating discussion, Dr. Melvin Clouse, chairman of the Radiology Department of New England Deaconess Hospital, for his generous hospitality to C.S.S. during part of the preparation of this paper, William D. Rooney for help with plotting our data, Marie Dippolito for patiently typing many revisions of the manuscript, and Dr. Krystina Szkutnika and Rita Ongjoco for the yeast viability studies.
Registry No. Na , 7440-23-5; P, 7723-14-0; K, 7440-09-7; NH4, 14798-03-9.
REFERENCES Alger, J. R., den Hollander, J. A., & Shulman, R. G. (1 982)
Balschi, J. A. (1984) Ph.D. Dissertation, State University of
Balschi, J. A., Cirillo, V. P., & Springer, C. S . (1982) Biophys.
Balschi, J. A., Jensen, D., Pike, M. M., Hofeler, H., Cirillo, V. P., Delayre, J. L., Springer, C. S., & Fossel, E. T. (1984) Magn. Reson. Med. 1 , 96-97.
Bogonez, E., Machado, A., & Satrustegui, J. (1 983) Biochim. Biophys. Acta 733, 234-24 1.
Borst-Pauwels, G. W. F. H. (1 98 1) Biochim. Biophys. Acta
Biochemistry 21, 2951-2963.
New York at Stony Brook, Stony Brook, NY.
J . 38, 323-326.
650, 88-127.

4962 Biochemistry 1987,
Boxman, A. W., Barts, P. W. J. A., & Borst-Pauwels, G. W. F. H. (1982) Biochim. Biophys. Acta 686, 13-18.
Brindle, K. M., Brown, F. F., Campbell, I. D., Grathwohl, C., & Kuchel, P. W. (1979) Biochem. J. 180, 37-44.
Burt, C. T., Cohen, S. M., & Barany, M. (1979) Annu. Rev. Biophys. Bioeng. 8, 1-25.
Chu, S. C., Pike, M. M., Fossel, E. T., Smith, T. W., Balschi, J. A., & Springer, C. S. (1984) J. Magn. Reson. 56, 33-47.
Cirillo, V. P. (1968) J. Bacteriol. 95, 603-61 1. Delayre, J. L., Jensen, D., Baldo, J., Pike, M. M., & Fossel,
E. T. (1984) Magn. Reson. Med. I , 292. den Hollander, J. A., Ugurbil, K., Brown, T. R., & Shulman,
R. G. (1981) Biochemistry 20, 5871-5880. Durr, M., Urech, K., Boller, Th., Wiemken, A., Schwenke,
J., & Nagy, M. (1979) Arch. Microbiol. 121, 169-175. Fabry, M. E., & San George, R. C. (1983) Biochemistry 22,
Gillies, R. J., Ugurbil, K., den Hollander, J. A., & Shulman, R. G. (1981) Proc. Natl. Acad.Sci. U.S.A. 78,2125-2129.
Goffeau, A,, & Slayman, C. W. (1981) Biochim. Biophys. Acta 639, 197-223.
Gupta, R. K., & Gupta, P. (1982) J . Magn. Reson. 47,
Jensen, D. (1983) M.S. Thesis, Rheinisch-Westfalische Technische Hochschule, Achen, Federal Republic of Ger- many.
Navon, G., Shulman, R. G., Yamane, T., Eccleshahl, T. R., Lam, K.-B., Baronofsky, J . J., & Marmur, J. (1979) Bio- chemistry 18, 4487-4499.
4119-4125.
344-3 50.
26, 4962-4968
Nicolay, K., Scheffers, W. A., Bruinenberg, P. M., & Kaptein,
Nicolay, K., Scheffers, W. A., Bruinenberg, P. M., & Kaotein,
Ogino, T., den Hollander, J. A., & Shulman, R. G. (1983)
Pefia, A., Pardo, J. P., & Ramirez, J. (1987) Arch. Biochem.
Pike, M. M., & Springer, C. S. (1982) J. Magn. Reson. 46,
Pike, M. M., Fossel, E. T., Smith, T. W., & Springer, C. S.
Rodriguez-Navarro, A,, & Ortega, M. D. (1982) FEBS Lett.
Rodriguez-Navarro, A., Sancho, E. D., & Perez-Lloveres, C. (1981) Biochim. Biophys. Acta 640, 352-358.
Rothstein, A. (1974) J. Gen. Physiol. 64, 608-621. Salhany, J. M., Yamane, T., Shulman, R. G., & Ogawa, S. (1975) Proc. Natl. Acad. Sci. U.S.A. 72, 4966-4970.
Sols, A,, Gancedo, C., & De la Fuente, G. (1971) in The Yeasts (Rose, A. H., & Harrison, J. S., Eds.) pp 271-307, Academic Press, New York.
Thompson, J., & Torchia, D. A. (1984) J . Bacteriol. 158,
Ugurbil, K., Rottenberg, H., Glynn, P., & Shulman, R. G. (1978) Proc. Natl. Acad. Sci. U.S.A. 75, 2244-2248.
Vacata, V., Kotyk, A., & Sigler, K. (1981) Biochim. Biophys. Acta 643, 265-268.
R. (1982) Arch. Microbiol. 133, 83-89.
R. (1983) Arch. Microbiol. 134, 270-275.
Proc. Natl. Acad. Sci. U.S.A. 80, 5185-5189.
Biophys. 253, 431-438.
348-353.
(1984) Am. J . Physiol. 246, C528-C536.
138, 205-208.
79 1-800.
Magnetic Resonance Studies on the Copper Site of Dopamine 6-Monooxygenase in the Presence of Cyanide and Azide Anions
Atsuo Obata, Hisao Tanaka, and Hiroshi Kawazura* Faculty of Pharmaceutical Sciences, Josai University, Keyaki-dai 1 - 1, Sakado, Saitama 350-02, Japan
Received November 12, 1986; Revised Manuscript Received March 13, 1987
ABSTRACT: In order to elucidate the coordination state of water molecules in the Cu(I1) site of dopamine [ (3,4-dihydroxyphenyl)ethylamine] P-Inonooxygenase, measurements of the paramagnetic 'H nuclear magnetic relaxation rate of solvent water in the enzyme solution containing cyanide or azide as an exogenous ligand were carried out to obtain the values of intrinsic paramagnetic relaxation rate decrements R' and R; for the ligand-enzyme 1:l and 2:l complexes, respectively. Rb (percent) values were 53 (pH 5.5f and 52 (pH 7.0) for cyanide and 38 (pH 5.5) and 32 (pH 7.0) for azide, while R; (percent) values were 98 (pH 5.5) and 96 (pH 7.0) for azide. Although no R; values for cyanide were obtained because of its reducing power at the Cu(I1) site, the Rb and R ; values obtained above prove that the Cu(I1) center has two coordinated water molecules that are exchangeable for exogenous ligands at either pH. Supporting evidence was provided by electron paramagnetic resonance (EPR) titration, in which the enzyme solution containing cyanide-enzyme (1: 1) complex in an equal proportion to uncomplexed enzyme gave an observed paramagnetic relaxation rate decrement, R,, of 23%. Another characteristic of the RL and Ri values was their invariability with respect to pH, indicating that the three-dimensional structure of the Cu(I1) site is pH-invariant within the range examined. Binding constants of ligand to enzyme KL and K i for 1:l and 2:l complex formation, respectively, were also determined through an analysis of the R, values; it was found that KL was larger than Kt irrespective of pH. On the basis of these results, together with the axial-symmetric EPR parameters of the 1:l complexes, a possible coordination geometry of the two water molecules in the Cu(I1) site of the enzyme is suggested.
D o p a m i n e P-monooxygenase (EC 1.14.17.1), an indispen- sable copper enzyme in the human brain, regulates neuro- transmitter levels by catalyzing the conversion of dopamine to norepinephrine (Rosenberg & Lovenberg, 1980). Although
0006-2960/87/0426-4962$01.50/0
numerous studies have shown that the copper moiety in the enzyme is essential for the catalysis (Villafranca, 1981), the structure of the copper site has not yet been established. In- deed, even after a recent extended X-ray absorption fine
0 1987 American Chemical Society