Dissolved organic matter dynamic in the Amazon basin: Sorption by mineral surfaces
Upload
independentCategory
view
0download
0
Changes in properties of soil-derived dissolved organic matter
induced by biodegradation
Karsten Kalbitza,*, David Schwesiga,f, Juliane Schmerwitza, Klaus Kaiserb, Ludwig Haumaierc,Bruno Glaserc, Ruth Ellerbrockd, Peter Leinwebere
aDepartment of Soil Ecology, Bayreuth Institute for Terrestrial Ecosystem Research (BITOK),
University of Bayreuth, Bayreuth D-95440, GermanybSoil Biology and Soil Ecology, Institute of Soil Science and Plant Nutrition, Martin-Luther-University Halle-Wittenberg,
Weidenplan 14, D-06108 Halle (Saale), GermanycInstitute of Soil Science and Soil Geography, University of Bayreuth, D-95440 Bayreuth, Germany
dInstitute of Soil Landscape Research, Centre for Agricultural Landscape and Land Use Research (ZALF),
Eberswalder Straße 84, D-15374 Muncheberg, GermanyeInstitute of Soil Science and Plant Nutrition, University of Rostock, Justus-von-Liebig-Weg 6, D-18051 Rostock, Germany
fIWW Rhenish-Westfalian Institute for Water Research, Moritzstr. 26, D-45476 Mulheim an der Ruhr, Germany
Received 2 October 2002; received in revised form 26 February 2003; accepted 10 March 2003
Abstract
Properties of dissolved organic matter (DOM) determine its biodegradation. In turn, biodegradation changes the properties of the
remaining DOM, which may be decisive for the formation of stable organic carbon in soil. To gain information on both mechanisms and
controlling factors of DOM biodegradation and the properties of biodegraded DOM, we investigated changes in the composition of 13
different DOM samples extracted from maize straw, forest floors, peats, and agricultural soils during a 90-day incubation using UV
absorbance, fluorescence emission spectroscopy, FTIR-spectroscopy, 1H-NMR spectroscopy, pyrolysis-field ionization mass spectroscopy
(Py-FIMS), and 13C natural abundance before and after incubation. Changes in the DOM properties were related to the extent of
biodegradation determined by the release of CO2. Increasing UV absorption and humification indices deduced from fluorescence emission
spectra, and increasing portions of aromatic H indicated relative enrichment of aromatic compounds during biodegradation. This enrichment
significantly correlated with the amount of DOC mineralized suggesting that aromatic compounds were relatively stable and slowly
mineralized. 13C depletion during the incubation of highly degradable DOM solutions indicated an enrichment of lignin-derived aromatic
compounds. Py-FI mass spectra indicated increasing contents of phenols and lignin monomers at the expense of lignin dimers and
alkylaromatics during incubation. This partial degradation of higher-molecular, lignin-derived DOM compounds was accompanied by
relative increases in the proportions of lower-molecular degradation products and microbial metabolites. Carbohydrates, especially when
abundant at high initial contents, seem to be the preferred substrate for microorganisms. However, four independent methods suggested also
some microbial production of carbohydrates and peptides during DOM degradation. After incubation, the composition of highly degradable
DOM samples became similar to relatively stable DOM samples with respect to aromaticity, carbohydrate content, and thermal stability. We
conclude that DOM biodegradation seems to result in organic matter properties being a precondition for the formation of stable carbon. These
structural changes induced by DOM biodegradation should also result in stronger DOM sorption to the soil matrix additionally affecting
DOM stabilization.
q 2003 Elsevier Science Ltd. All rights reserved.
Keywords: d13C; Degradation; Dissolved organic matter; Fluorescence spectroscopy; 1H-NMR spectroscopy; Pyrolysis-mass spectrometry; Stabilization;
UV/VIS spectroscopy
1. Introduction
All microbial uptake mechanisms require an aqueous
environment (Metting, 1993). Therefore, dissolved organic
matter (DOM) may be the key constituent for microbial
0038-0717/03/$ - see front matter q 2003 Elsevier Science Ltd. All rights reserved.
doi:10.1016/S0038-0717(03)00165-2
Soil Biology & Biochemistry 35 (2003) 1129–1142
www.elsevier.com/locate/soilbio
* Corresponding author. Tel.: þ49-921-555624; fax: þ49-921-555799.
E-mail address: [email protected] (K. Kalbitz).

degradation of organic matter in soils. Two recent studies
showed that CO2 evolution from soil samples can be largely
explained by the decrease in water-extractable organic
carbon (Marschner and Noble, 2000; Marschner and
Bredow, 2002). The finding that biodegradability of DOM
is similar to that of other fractions of soil organic matter
(Kalbitz et al., 2003) suggests that biodegradation of soil
organic matter is mediated by the aqueous phase.
Incubation studies in the laboratory showed that 4–93%
of soil-derived DOM can be microbially decomposed
(Kalbitz et al., 2003). Marschner and Kalbitz (2003)
considered intrinsic DOM properties as control factors of
DOM biodegradation. DOM with a large portion of carbon
in the XAD-8-adsorbable fraction, rich in aromatic
structures and complex molecules, and poor in carbo-
hydrates is little biodegradable (Qualls and Haines, 1992;
Jandl and Sollins, 1997; Jandl and Sletten, 1999; Volk et al.,
1997; Amon et al., 2001; Kalbitz et al., 2003).
Evaluation of changes in composition of DOM during
degradation could offer deeper insight into mechanisms and
controlling factors of DOM biodegradation and could help
to identify fractions of DOM preferentially decomposed. A
recent study reported depletion in 14C during biodegradation
of riverine DOM which indicates that stable DOM
compounds might be older than the degradable ones
(Raymond and Bauer, 2001). Application of UV and
fluorescence spectroscopy before and after incubation
indicated an enrichment of aromatic moieties during
biodegradation of DOM (Zsolnay and Steindl, 1991;
Hongve et al., 2000; Moran et al., 2000; Parlanti et al.,
2000; Pinney et al., 2000). Decomposition studies using
litter or soil organic matter imply that these aromatic
compounds should mainly derive from lignin (Norden and
Berg, 1990; Kogel-Knabner, 2002). Lignin is a
large contributor to the residue of terrestrial biomass
(Kogel-Knabner, 2002), and water-soluble aromatic lignin
degradation products are also important DOM components
(Guggenberger et al., 1994a).
Volk et al. (1997) and Amon et al. (2001) reported that
dissolved carbohydrates and amino acids are preferentially
utilized by microorganisms. However, carbohydrates can be
bound to refractory DOM compounds (Guggenberger et al.,
1994a; Jandl and Sollins, 1997), which could prevent their
degradation, and carbohydrates like glucose can be
transformed into stable DOM components by bacteria
(Ogawa et al., 2001).
Detailed investigations on biodegradation induced
changes of DOM properties are hampered by the decrease
of the already low amounts of DOM in degradation
experiments. Therefore, combining various techniques
with low sample demand and addressing different DOM
properties should be a promising strategy to overcome this
problem. The use of UV, fluorescence, FTIR, and 1H-NMR
spectroscopy allows one to gain information about the
aromaticity and complexity of DOM molecules, the
contents of functional groups, carbohydrates, and simple
organic compounds (Wilson et al., 1988; Senesi et al., 1989;
Chin et al., 1994; McKnight et al., 1997; Zsolnay et al.,
1999; Parlanti et al., 2000; Kalbitz et al., 2003). Analyzing13C natural abundance could also reveal some structural
changes during DOM biodegradation because different
classes of compounds have different d13C values (Licht-
fouse, 2000). Pyrolysis-field ionization mass spectroscopy
(Py-FIMS) was successfully applied to investigate the
molecular composition and structural properties such as
molecular weights and thermal stability of aquatic humic
substances and DOM (Leinweber et al., 2001; Schulten
et al., 2002).
The objectives of this study are to investigate changes in
DOM properties during microbial DOM degradation as
indicators of the mechanisms and controlling factors of
DOM biodegradation. The tested hypotheses were
† Aromaticity and complexity of DOM molecules increase
during DOM biodegradation whereas carbohydrates
either decrease due to preferential degradation or
increase as a result of microbial synthesis.
† DOM biodegradation results in a relative enrichment of
lignin-derived moieties that are depleted in 13C.
† DOM biodegradation affects the thermal behavior of
whole DOM samples and individual compound classes
with an assumed increased thermal stability of residual
DOM.
2. Materials and methods
Samples were taken at two forest sites, one under
Norway spruce (Picea abies (Karst.) L.) and another one
under European beech (Fagus sylvatica L.), in a fen area,
and from three agricultural soils (Table 1). In addition,
maize straw was collected immediately after harvesting.
The sampled material was sieved (#5 mm), visible roots
and animals were removed, and the samples were
thoroughly mixed and stored frozen. The maize straw and
the beech litter were cut into pieces of 1–2 cm2 in size
before mixing. Production of DOM solutions was done by
adding ultra-pure water to the solid material (solid/solution
ratio: Table 1). The suspensions were equilibrated for 24 h,
then filtered through 0.2 mm membranes (cellulose acetate;
OE 66, Schleicher & Schuell). Prior to the experiment,
aliquots of each solution were freeze dried for further
analysis. Before incubation, DOM solutions with more than
20 mg C l21 were diluted to avoid extensive growth of
microorganisms. Details on sampling, preparation of DOM
solutions, and the incubation experiment are given in
Kalbitz et al. (2003). Seven replicates (700 ml) of each
DOM solution were incubated in 1 l incubation flasks. A
mixed inoculum extracted from Oa-spruce, Oi-beech, fen-4,
and BL-manure was added (1% v/v) with no additional
nutrient amendment. The incubation flasks were sealed,
incubated in the dark at 20 8C for 90 days, gently shaken by
K. Kalbitz et al. / Soil Biology & Biochemistry 35 (2003) 1129–11421130

hand every day. The biodegradation of DOM was monitored
by measuring the CO2 evolution of each of three replicates
(Kalbitz et al., 2003). The incubation flasks of these three
replicates were opened after 6, 14, 54, and 90 days and an
aliquot of the solution was sampled. Furthermore, the DOM
solutions were aerated for 10 min using filtered compressed
air. Solutions of the other four replicates (not sampled
during the incubation) were filtered (0.2 mm) and freeze
dried after the end of the experiment.
The filtered DOM solutions were analyzed before, during
and after incubation for DOC concentrations (High TOC,
Elementar; also for the unfiltered sample), UV absorbance
at 280 nm (UVIKON 930, BIO-TEK Instruments) to
estimate the aromaticity of DOM (Chin et al., 1994;
McKnight et al., 1997), emission fluorescence (SFM 25,
BIO-TEK Instruments) followed by calculations of humi-
fication indices (HIXem; Zsolnay et al., 1999) as a measure
for the complexity of the DOM molecules. For the UV and
fluorescence measurements, all solutions were adjusted to
10 mg C l21, pH 7.7, and an electrical conductivity of
1000 mS cm21 to ensure comparability. DOM solutions
extracted from maize straw were only analyzed before and
at the end of the incubation.
Freeze-dried samples of DOM before and after incu-
bation were analyzed by the following methods:
† Liquid-state 1H-NMR spectroscopy (Avance DRX 500,
Bruker Analytik GmbH) to estimate the portions of H
associated with O-containing functional groups (mainly
carbohydrate H: 3.0 – 4.8 ppm) and with aromatic
compounds (5.5–10.0 ppm) (Kaiser et al., 2002; Kalbitz
et al., 2003).
† FTIR spectroscopy (BioRadw FTS 135; Ellerbrock et al.,
1999).
† Isotope ratio mass spectrometry (d13C; Deltaplus, Ther-
moQuest-Finnigan MAT, connected to an elemental
analyzer, NA 2500, ThermoQuest-Fisons).
† Pyrolysis-field ionization mass spectrometry (Py-
FIMS) of DOM samples from maize straw, Oi-spruce,
and Oa-spruce.
For the FTIR and isotopic analysis of DOM after
incubation we had to combine several replicates of the
samples fen-1 and maize straw due to the low amount of
material (fen 1: combining of all four replicates, maize
straw: combining of each two replicates). All replicates of
each sample were combined for 1H-NMR spectroscopy and
Py-FIMS.
For 1H-NMR spectroscopy, a 15–50 mg aliquot of each
sample was dissolved in 3 ml of 0.5 M NaOD and a portion
of the solution was transferred into a 5 mm NMR tube
(Kaiser et al., 2002). Conditions for 1H-NMR were:
spectrometer frequency, 500.13 MHz; homonuclear pre-
saturation for solvent suppression; pulse delay, 1.0 s;
acquisition time, 1.16 s; line-broadening factor, 2 Hz. Two
hundred scans were accumulated for each sample.
Chemical shifts were given relative to the resonance of
Table 1
Total organic carbon (TOC) and total organic nitrogen (TON) content of the solid material used for production of DOM solutions, the soil/solution ratio for
extraction, the DOC content of the DOM solutions and the portion of DOC mineralized
Sample/site Acronym TOC (g kg21) TON (g kg21) Solid/solution ratio (w/w)a DOCb (mg C l21) Mineralized DOCc (%)
Beech forest (Dystric Cambisol)
Litter layer Oi-beech 456 15.7 0.1 604 65.0
Fermented/Humified layer Oa-beech 295 16.2 0.1 67.4 9.1
Spruce forest (Haplic Podzol)
Litter layer Oi-spruce 474 17.4 0.1 99.3 61.4
Fermented layer Oe-spruce 435 21.2 0.1 149 93.4
Humified layer Oa-spruce 312 13.9 0.1 38.1 7.2
fen area (Gleyic Mollisols and Terric Histosols)
Arable soil fen-1 43.3 3.0 1.5 19.8 7.8
Grassland soil fen-2 48.3 3.6 0.2 18.4 9.4
Grassland in succession fen-3 96.1 7.2 0.1 40.5 8.5
Almost natural forest fen-4 383 26.8 0.1 75.7 5.3
Field sites of a long-term agricultural trial (Haplic Chernozem)
Without any fertilization BL-0 12.8 1.3 1.5 7.2 30.0
Mineral fertilization BL-NPK 12.5 1.1 1.5 12.6 17.2
Organic fertilization BL-manure 14.7 1.4 1.5 13.9 31.8
Maize straw Maize straw 420 8.6 0.1 819 88.6
a Ratio applied to extract DOM.b Measured DOC concentration in the extract.c After 90 days; measured by CO2 evolution (Kalbitz et al., 2003).
K. Kalbitz et al. / Soil Biology & Biochemistry 35 (2003) 1129–1142 1131

tetramethylsilane. Signal assignments to compound groups
and single compounds were made according to the literature
(Wilson, 1987; Wilson et al., 1988; Leenheer, 1994).
Complementary 13C-NMR was not applicable because of
too small amounts of sample, especially after incubation.
In all cases except that of Oa-beech distinct signals at
3.69 and 3.76 ppm occurred in the spectra of DOM after
incubation. These signals were mostly absent in the spectra
before the experiment. These resonances may indicate an
enrichment of methylaryl ethers (Wilson et al., 1988), which
are typical lignin degradation products. However, also
glycols give sharp signals in this region. Since the used filter
membranes contained glycols, contamination of the samples
could not be excluded although all filters were thoroughly
washed with 250 ml ultra-pure water before use. The low
DOC concentrations of samples after biodegradation could
be responsible for the contamination becoming evident only
in these samples. Therefore, we decided not to include the
region between 3.65 and 3.80 ppm when integrating
resonances typical of carbohydrates (3.0–4.8 ppm).
d13C values were determined on ground subsamples of
freeze-dried DOM. The isotope ratios were compared with
that of reference CO2 (Linde AG, Unterschleißheim,
Germany) and calibrated against NBS19-limestone
(National Institute of Standards and Technology, Gaithers-
burg, MD) and sucrose ANU (International Atomic Energy
Agency, Vienna). d13C value expresses the enrichment of13C in a sample relative to the 13C of CO2 prepared from a
calcareous belemnite of the cretaceous Peedee formation,
South Carolina. The analytical precision of the measure-
ments was 0.1‰.
FTIR spectra of freeze dried DOM samples were
recorded in a range of wave numbers between 3900 and
400 cm21. The freeze-dried DOM material (0.5 mg) was
mixed with 80 mg KBr and finely ground using an agate
mortar. The resulting mixture was dried for 12 h over silica
gel in a desiccator. Afterwards pellets of 10 mm diameter
were prepared at a pressure of 10,000 kg cm22 for 10 min.
All spectra were measured using a fixed resolution of
1 cm21 and eight scans (Ellerbrock et al., 1999). To
quantify the amount of carboxylic groups in each sample
the sum of absorption bands at 1740–1700 cm21 and 1640–
1600 cm21 were computed by measuring the length of lines
drawn from the baseline to the maximum of each band using
BIORAD WINIREZ software. The ranges and procedures
are described in more detail by Celi et al. (1997). To
quantify the amounts of C–O groups (polysaccharides), the
same procedure was used for the bands in the region from
1100 to 1000 cm21.
For Py-FIMS, about 1 mg of sample was thermally
degraded in the ion source of a modified Finnigan MAT 731
high performance mass spectrometer. The sample was
heated in the high vacuum of the ion source from 110 to
700 8C at a heating rate of approximately 10 K per magnetic
scan (three replicates). After 19 min of total registration
time, about 60 magnetic scans were recorded for the mass
range of 16–900 Da (single spectra). These were combined
to obtain one thermogram of total ion intensity and an
averaged mass spectrum. In addition, for each of the single
scans the ion intensities of marker signals for 10 selected
classes of chemical compounds found in soil organic matter
were calculated. All Py-FIMS data were normalized per mg
sample. Detailed descriptions of the Py-FIMS methodology
and of statistical evaluations of sample weight and residue,
volatilized matter, and total ion intensities have been
published previously (Schulten, 1996). For the signal
assignment to 10 classes of chemical compounds see
Schulten and Leinweber (1999).
2.1. Statistics
We calculated linear regressions between the analyzed
DOM properties and parameters describing the DOM
biodegradation. These parameters (percentage of miner-
alized DOC after 90 days, calculated portions and
mineralization constants of rapidly and slowly mineraliz-
able DOC) are given in Kalbitz et al. (2003). Changes in
DOM properties before and after incubation were tested for
significance using a paired t-test.
3. Results
3.1. Extent of DOM biodegradation
Changes in DOM properties were evaluated in their
relation to the extent of DOM biodegradation. Three distinct
groups of different degradability could be identified:
Biodegradation was high for DOM from weakly decom-
posed organic material (group 1: Oi-spruce, Oi-beech, Oe-
spruce, maize straw). In these samples, between 61 and 93%
of total DOC was mineralized after 90 days (Table 1). DOM
extracted from agricultural soils (group 2: BL-0, BL-NPK,
BL-manure) revealed moderate biodegradation (mineraliz-
ation of 17–32% of total DOC), whereas DOM from peats
and from Oa forest floor horizons (group 3: fen-1…4, Oa-
spruce, Oa-beech) was relatively stable (mineralization of
5–9% of total DOC). Further details of the extent and
temporal course of DOM biodegradation were published by
Kalbitz et al. (2003).
3.2. UV and fluorescence data
The specific absorption at 280 nm (A 280) and the
humification index deduced from fluorescence emission
spectra (HIXem) increased considerably during incubation
of most of the DOM samples (Figs. 1 and 2, Table 2).
Solutions of highly biodegradable DOM (group 1 in Table 2)
exhibited much stronger increases than solutions of less
degradable DOM. Nevertheless, even after incubation, the
UV absorbance and HIXem of the three sample groups
remained different (see means of the three groups in
K. Kalbitz et al. / Soil Biology & Biochemistry 35 (2003) 1129–11421132

Table 2). The increase in A 280 and HIXem was positively
correlated with the percentage of DOC mineralized after 90
days (A 280: r2 ¼ 0:66; HIXem: r2 ¼ 0:86; n ¼ 39; p ,
0:001 in both cases). However, DOM solutions with
intermediate biodegradation (group 2 in Table 2) showed
a similar increase in A 280 as compared to the most stable
DOM solutions (group 3 in Table 2). The HIXem of DOM in
group 2 did not change during incubation.
Fig. 1. Temporal changes in the specific absorption at 280 nm during DOM incubation (mean and standard deviation of three replicates).
Fig. 2. Temporal changes in the HIXem (humification index deduced from fluorescence emission spectra) during DOM incubation (mean and standard deviation
of three replicates).
K. Kalbitz et al. / Soil Biology & Biochemistry 35 (2003) 1129–1142 1133

The changes in HIXem of DOM solutions during
incubation except those from arable soils were characterized
by strong increases at the beginning and smaller increases
later on. This was less pronounced for A 280, which showed
larger fluctuations over time (Fig. 1). It is noteworthy that
the A 280 of DOM solutions from the beech forest (Oi and
Oa) increased initially, and considerably decreased at later
stages of the experiment. After six days, the A 280 of DOM
from the beech forest Oa almost doubled, but thereafter it
decreased even below the initial value.
3.3. 1H-NMR spectra
Most DOM solutions showed an increase in the
abundance of aromatic H during incubation (Fig. 3,
Table 2). Highly degradable DOM solutions (group 1 in
Table 2) exhibited the strongest increase in aromatic H from
about 6–13% (Table 2). Only in two solutions (BL-manure,
fen-1), proportions of aromatic H decreased. The relative
increase in aromatic H signals was closely correlated with
the percentage of DOC mineralized after 90 days ðr2 ¼
0:72Þ:
Highly degradable DOM solutions (group 1 in Table 2)
and DOM from Oa-spruce and Oa-beech showed strong
decreases in the portion of carbohydrate H during the
incubation experiment. The relative abundance of carbo-
hydrate H in most DOM samples from agricultural soils and
from peats did not considerably change during the
experiment. Changes in the content of carbohydrate H
were neither related to the percentage of DOC mineralized
Table 2
Spectroscopic properties of DOM before and after a 90-day incubation experiment
A 280a DA 280b (%) HIXemc DHIXem
b (%) ARd DARb (%) CHe DCHb (%)
Before After Before After Before After Before After
Group 1: DOM with high biodegradation
Oi-beech 0.016 0.027 67 4.7 13.8 193 5.6 9.9 78 37.1 26.0 230
Oi-spruce 0.016 0.025 57 2.4 8.4 246 6.2 11.6 88 39.6 19.1 252
Oe-spruce 0.007 0.026 297 1.4 6.9 400 5.5 14.5 166 44.0 20.0 255
Maize straw 0.006 0.023 252 0.7 3.4 386 5.4 15.9 194 33.5 21.5 236
Mean 0.011 0.025 168 2.3 8.1 306 5.7 13.0 132 38.6 21.6 243
Group 2: DOM with intermediate biodegradation
BL-0 0.023 0.028 21 12.5 12.7 2 9.5 11.8 25 17.0 21.1 24
BL-NPK 0.029 0.040 37 19.1 20.5 7 9.1 20.8 18.4 212
BL-manure 0.037 0.044 19 20.9 21.3 2 11.7 8.8 225 24.2 17.1 229
Mean 0.030 0.037 26 17.5 18.2 4 10.6 9.9 0 20.6 18.9 25
Group 3: DOM with low biodegradation
Oa-spruce 0.041 0.053 28 16.3 25.4 56 13.3 19.2 44 31.4 20.3 235
Oa-beech 0.031 0.030 22 14.0 20.1 43 10.5 10.7 2 24.4 14.0 243
fen-1 0.028 0.057 102 11.4 7.7 232 9.4 6.3 233 28.8 26.8 27
fen-2 0.042 0.057 36 25.5 29.1 14 10.2 15.4 50 13.9 18.3 32
fen-3 0.042 0.050 19 23.7 37.1 56 11.9 16.6 40 16.6 17.9 8
fen-4 0.044 0.048 11 27.4 39.0 42 13.1 14.0 7 17.7 13.4 224
Mean 0.038 0.049 32 19.7 26.4 30 11.4 13.7 18 22.1 18.4 212
a Specific absorption at 280 nm (l mg C21 cm21; mean of three replicates).b Increase in % during the course of DOM biodegradation (mean of three replicates).c Humification index using emission fluorescence spectra (ratio of areas: 435–480 nm/300–345 nm; mean of three replicates) (Zsolnay et al., 1999).d Aromatic H (% of H); 1H-NMR (5.5–10.0 ppm).e Carbohydrate H (% of H); 1H-NMR, H associated with O-containing functionalities (3.0–4.8 ppm).
Fig. 3. 1H-NMR spectra of one DOM sample before and after incubation.
K. Kalbitz et al. / Soil Biology & Biochemistry 35 (2003) 1129–11421134

nor to other variables describing DOM degradation. At the
end of the experiment the relative portions of carbohydrate
and aromatic H of the different sample groups approached a
similar level (Table 2).
3.4. d13C
Three out of four samples of highly degradable DOM
samples were significantly ðp , 0:05Þ depleted in 13C after
incubation (Fig. 4). In contrast, d13C values increased
during incubation of samples with intermediate degradation
(agricultural soils). The isotopic composition of C in DOM
with low biodegradation changed only little during
incubation. A small depletion in 13C of about 0.4‰ after
incubation was found for only two of these samples (Oa-
spruce, fen-2) which were also characterized by relatively
strong increases in aromatic H of about 5% (Table 2).
3.5. FTIR spectra
Absorption at different wavenumbers could not be
related to the extent of DOM degradation and did not
show a clear trend during incubation. Polysaccharides have
absorption bands at around 1100 cm21 and Celi et al. (1997)
quantified carboxylic groups by adding up the absorption at
1720 cm21 (protonated) and 1600 cm21 (deprotonated).
Ratios of the absorption at 1100 cm21 to the added-up
absorption at 1720 cm21 and 1600 cm21 considerably
increased for 11 of 13 DOM samples during incubation
(Figs. 5 and 6) indicating an enrichment of polysaccharides
relative to carboxylic groups during incubation.
3.6. Py-FI mass spectra
All DOM samples gave highly intensive Py-FI mass
spectra, irrespective of source and biodegradability. The ion
intensities in the lower mass range were larger for highly
degradable DOM samples (Oi-spruce, maize straw) than for
the relatively stable DOM sample (Oa-spruce, not shown).
Difference Py-FI mass spectra were plotted to visualize
differences between DOM samples before and after
incubation (Fig. 7). Positive differences in signal intensities
indicate relative enrichments during incubation. This was
true for low-mass, non-specific signals (m=z 19, 23, 30, 39,
41), some signals of N containing compounds (m=z 57, 59),
carbohydrates (m=z 96, 110), and phenols and lignin
monomers (m=z 110, 124, 166, 208). For some of these
signals there was no increase during incubation of the maize
DOM sample. On the other hand, the relative signal
intensities at higher m=z often decreased during incubation.
This was especially pronounced for the relatively stable
DOM sample (Oa-spruce). For this sample signal intensities
of m=z .230 decreased and of m=z ,230 increased
following incubation (Fig. 7).
The abundances of 10 compound classes (Table 3)
revealed higher contents of lipids, alkylaromatics, sterols,
and free fatty acids, and lower contents of heterocyclic
nitrogen compounds and peptides in the stable DOM sample
(Oa-spruce) as compared with the two highly degradable
samples. In all three samples incubation and biodegradation
increased the proportions of peptides at the expense of
lignin dimers (Table 3). In the samples from forest floor (Oi
and Oa), the proportions of carbohydrates and phenols/
lignin monomers, mainly heterocyclic N containing com-
pounds and peptides increased, again, at the expense of
lignin dimers. DOM from maize straw underwent different
changes during incubations as monomeric and dimeric
lignin building blocks and heterocyclic N containing
compounds were decomposed and, in addition to peptides,Fig. 4. d13C ratios of DOM before (b) and after (a) incubation.
K. Kalbitz et al. / Soil Biology & Biochemistry 35 (2003) 1129–1142 1135

lipids, sterols, and free fatty acids, all of them containing
much alkyl structures, were newly formed (Table 3).
The thermograms of total ion intensity (TII; entire DOM
samples) and of individual compound classes were
relatively similar for the two highly degradable DOM
samples before incubation. A first volatilization peak
occurred between 250 and 300 8C and a second around
450 8C (Fig. 8). In contrast, the thermograms obtained from
the relatively stable DOM sample (Oa-spruce) had a rather
Gaussian-like shape with a peak at 350–400 8C before
incubation (Fig. 9). Only carbohydrates had a first peak of
volatilization at 290 8C and a second, smaller peak at about
400 8C.
Strong degradation of Oi-spruce DOM resulted in
large changes of the thermal behavior. First, the TII
thermograms in Fig. 8 indicate that the volatilization at
lowest pyrolysis temperatures, starting from 150 8C, was
reduced and the volatilization between 400 and 500 8C
largely disappeared. Instead the onset temperature was
Fig. 5. FTIR spectra of one DOM sample before and after incubation.
Fig. 6. Absorbance at 1100 cm21 typical of polysaccharides divided by the
added-up absorbances at 1720 and 1600 cm21 typical of carboxylic groups
of the DOM samples before and after incubation.
Fig. 7. Pyrolysis-field ionization mass spectra of three different DOM
samples (abbreviations see Table 1): differences between spectra before and
after the incubation (positive values indicate enrichment whereas negative
values indicate depletion).
K. Kalbitz et al. / Soil Biology & Biochemistry 35 (2003) 1129–11421136

shifted by þ50 K and a peak of major volatilization
appeared at 350 8C, which was 50 8C higher than that of
DOM before incubation. The volatilization curves of the
individual compound classes changed more or less
similarly to TII except for lignin dimers, lipids, and
free fatty acids which did not substantially change during
incubation.
The more stable DOM sample (Oa-spruce) did not
undergo strong changes in the bulk thermal stability during
incubation (Fig. 9). Only for individual compound classes
such as carbohydrates, N-containing compounds, peptides,
phenols/lignin monomers and alkylaromatics a slight
tendency of relative losses at lower pyrolysis temperatures
and shifts of maximum volatilization by þ80–100 K was
observed. The thermograms of the Oi-spruce sample after
incubation resembled the thermograms of the Oa-spruce
sample before incubation.
4. Discussion
4.1. Relative enrichment of lignin-derived aromatic
compounds by DOM biodegradation
Increasing values of UV absorption, HIXem, portions of
aromatic H, and contents of phenols and lignin monomers
consistently indicate a relative enrichment of aromatic
compounds during DOM biodegradation. These increases
were linearly correlated with the extent of DOC mineral-
ization supporting the idea that aromatic compounds are
relatively stable against DOM biodegradation (Kalbitz et al.,
2003). The close correlation with the increase in the HIXem
ðr2 ¼ 0:86Þ suggests that stable molecules accumulating
during DOM biodegradation are rather complex, possibly
with an enhanced degree of conjugation and condensation
(Senesi et al., 1989; Zsolnay et al., 1999). This is supported
by the similarity in the temporal changes of CO2 evolution
(published by Kalbitz et al., 2003) and in HIXem during the
incubation (except for DOM samples derived from
agricultural soils) (Fig. 2).
The stability of aromatic compounds and their relative
enrichment during DOM degradation are partly questioned
by the observation that alkyl compounds seem to be the
main contributors to the stable fraction of C in the solid soil
phase (Baldock et al., 1992). However, the reason for the
stability of alkyl compounds seems to be inaccessibility
rather than recalcitrance (Capriel et al., 1990; Sollins et al.,
1996). Inaccessibility should be of minor importance for the
incubation of solutes as presented here. Therefore, recalci-
trant aromatic compounds seem to be the dominating
fraction of stable DOM. This assumption is in agreement
with findings of Almendros and Dorado (1999) and Yanagi
et al. (2002) who studied biodegradation of soil-derived
humic acids.
The depletion in 13C observed for samples exhibiting
strong degradation (Fig. 4) contradicts the often postulated
preferential use of the lighter 12C isotope by microorgan-
isms during the decomposition of organic matter (e.g.
Melillo et al., 1989). Recently, Ekblad et al. (2002) found
that microbial 13C discrimination during respiration is
minor. Therefore, the observed 13C depletion of incubated
samples may reflect a relative enrichment of lignin-derived
aromatic compounds which are known to be depleted in 13C
(Benner et al., 1987; Schulten and Gleixner, 1999). Also the
enrichment of aromatic compounds shown above supports
the idea of 13C depletion induced by preferential accumu-
lation of lignin-derived compounds. In samples with low
degradation, changes in the d13C were small. However, 13C
depletion was also notable for two relatively stable DOM
samples (Oa-spruce, fen-2) which also showed relatively
strong increases in aromatic H content during incubation
(Table 2).
Relatively high contents of lipids, sterols, and free fatty
acids of the weakly degradable DOM determined by Py-
FIMS indicate potentially stable compounds other than
aromatic ones. However, the relative decrease of lipids
during incubation especially evident for the weakly
degradable DOM sample from Oa-spruce questions the
assumption that lipids are stable against biodegradation.
The relative decrease of lignin dimers and alkylaro-
matics, and the increase in phenols and lignin monomers
during incubation partly indicate degradation of lignin-
derived compounds (Huang et al., 1998). This was further
supported by the relative increases in the intensity of
Table 3
Relative abundances of 10 important compound classes in DOM before and after DOM biodegradation (% of total ion intensity; carbohydrates ¼ CHYD,
phenols þ lignin monomers ¼ PHLM, lignin dimers ¼ LDIM, lipids ¼ LIPID, alkylaromatics ¼ ALKY, heterocyclic nitrogen containing compounds ¼
NCOMP, sterols ¼ STEROL, peptides ¼ PEPTI, suberin ¼ SUBER, free fatty acids ¼ FATTY; means of three analytical replicates)
Sample CHYDR PHLM LDIM LIPID ALKY NCOMP STEROL PEPTI SUBER FATTY
Oi-spruce-b 7.1 10.4 1.9 4.1 9.2 9.0 0.3 4.7 0.0 0.6
Oi-spruce-a 9.2 13.1 0.2 3.5 8.7 9.1 0.2 5.2 0.0 1.2
Oa-spruce-b 6.5 8.2 2.9 9.0 9.7 6.2 1.8 2.9 0.3 2.2
Oa-spruce-a 10.9 14.7 1.0 4.8 12.1 8.0 0.0 4.5 0.0 0.6
Maize straw-b 4.3 9.1 3.2 5.5 8.0 10.7 0.5 3.3 0.1 0.5
Maize straw-a 4.3 8.0 1.8 6.1 7.5 4.6 2.3 5.2 0.2 1.6
b:Sample before incubation, a: sample after 90 days of incubation.
K. Kalbitz et al. / Soil Biology & Biochemistry 35 (2003) 1129–1142 1137
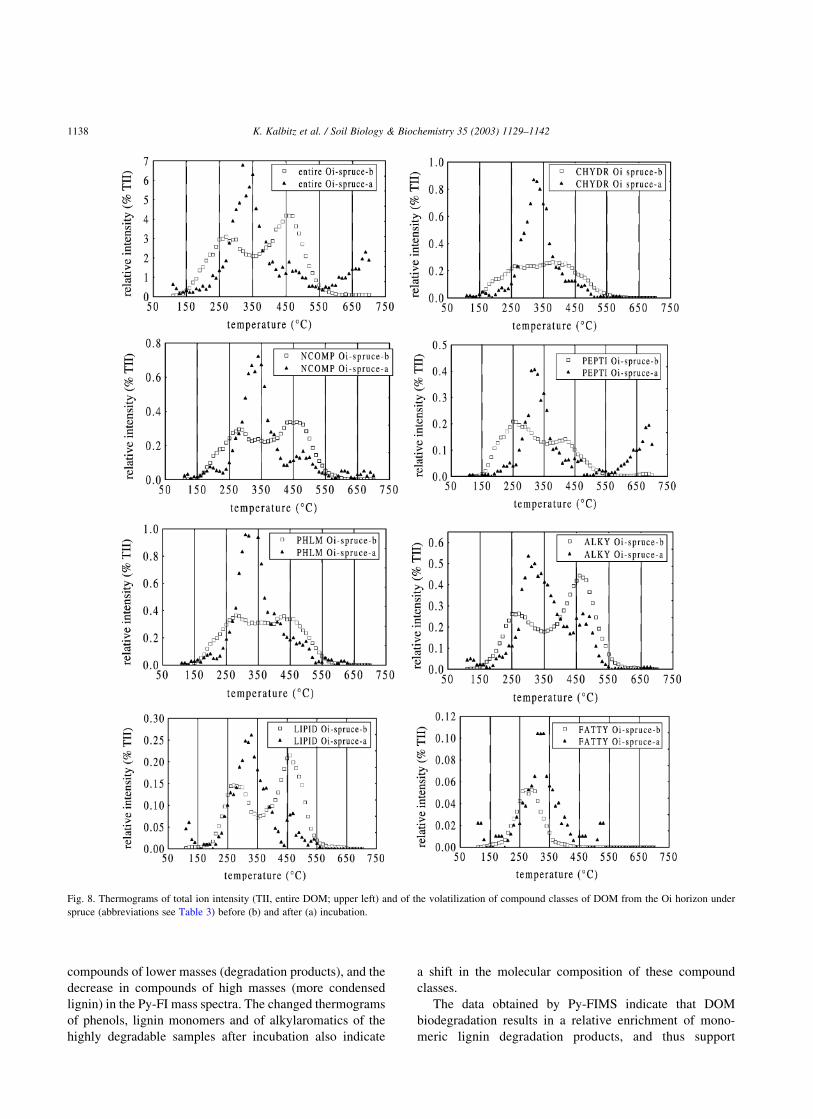
compounds of lower masses (degradation products), and the
decrease in compounds of high masses (more condensed
lignin) in the Py-FI mass spectra. The changed thermograms
of phenols, lignin monomers and of alkylaromatics of the
highly degradable samples after incubation also indicate
a shift in the molecular composition of these compound
classes.
The data obtained by Py-FIMS indicate that DOM
biodegradation results in a relative enrichment of mono-
meric lignin degradation products, and thus support
Fig. 8. Thermograms of total ion intensity (TII, entire DOM; upper left) and of the volatilization of compound classes of DOM from the Oi horizon under
spruce (abbreviations see Table 3) before (b) and after (a) incubation.
K. Kalbitz et al. / Soil Biology & Biochemistry 35 (2003) 1129–11421138

the results obtained by UV, fluorescence, NMR, d13C. Py-
FIMS also indicates degradation of dimeric lignin-derived
compounds. This was not expected, because incubation of
DOM in solution with the chosen inoculation (Kalbitz
et al., 2003) favored free living and loosely attached
microorganisms like bacteria but not fungi which are
supposed to be main degraders of lignin and lignin-
derived compounds (Haider, 1992; Møller et al., 1999).
Probably, the added surfaces in the incubation flasks
(glass fiber filters) were sufficient for attachment of fungi
Fig. 9. Thermograms of total ion intensity (TII, entire DOM; upper left) and of the volatilization of compound classes of DOM from the Oa horizon under
spruce (abbreviations see Table 3) before (b) and after (a) incubation.
K. Kalbitz et al. / Soil Biology & Biochemistry 35 (2003) 1129–1142 1139

and development of mycelium. However, we did not
examine the composition of the microbial community
present in the samples.
4.2. Microbial formation of carbohydrates during DOM
biodegradation
Based on the assumption that DOM biodegradation
follows the same pattern as the decomposition of soil
organic matter we hypothesized that carbohydrates will be
degraded preferentially. A positive relationship between the
content of carbohydrates of the samples at the beginning of
incubation and the extent of DOM biodegradation (Kalbitz
et al., 2003) supported this hypothesis. However, the 1H-
NMR spectra after incubation indicated a preferential use of
carbohydrates only for highly degradable DOM samples and
samples from the Oa layers with high initial contents of
carbohydrates (on average 35%). For most of the other
samples, carbohydrate contents changed little during
incubation.
The increase in the absorbance at wavenumbers
typical of polysaccharides (,1100 cm21) compared to
the absorbance caused by carboxylic groups (Fig. 6)
suggests higher stability of carbohydrates than of
carboxyl groups, possibly due to preservation of
carbohydrates bound to stable DOM compounds such
as lignin (Guggenberger et al., 1994a; Volk et al., 1997).
In contrast, oxidative microbial degradation of organic
matter typically increases the negative charge and
carboxyl groups of DOM (Guggenberger et al., 1994a).
Therefore, relative increase in polysaccharides after
incubation is likely to be caused by microbial formation.
This assumption is confirmed by Ogawa et al. (2001)
who reported production of refractory DOM due to
bacterial use of labile compounds such as glucose and
glutamate. Sollins et al. (1996) stated that many bacteria
and fungi release diverse polysaccharides into their
immediate environment. Biofilms that may have grown
on the added glass fiber filters, are known to produce an
extracellular polysaccharide matrix, which is another
source of carbohydrates in the DOM samples (Lewan-
dowski et al., 1994). It should be noted, however, that
the increased absorption at around 1100 cm21 might
instead be due to enrichment in sulfate. Absorptions of
sulfates range from 1114 cm21 ((NH4)2SO4) to
1119 cm21 (Na2SO4).
Py-FI mass spectra indicated enrichments in typical
microbial metabolites such as carbohydrates and peptides
in samples derived from forest floor material already
high in carbohydrates. Especially m=z 162 (levoglucosan)
was significantly enriched in the Oi and Oa samples after
incubation. This is a typical product of water cleavage
from galactose and mannose (Schulten and Gortz, 1978)
which are considered as indicators of microbial sugars
(Guggenberger et al., 1994b). After incubation, shifts in
the volatilization peaks of carbohydrates and peptides
occurred even in the sample where thermograms of the
entire sample (Oa-spruce; Fig. 9) before and after
incubation were similar. This points out changes in the
composition of carbohydrates. Microbial transformation
seems to be a conclusive explanation. Also Huang et al.
(1998) observed an accumulation of polysaccharides in
mineral soil samples with increasing decomposition of
organic matter, which could be attributed to microbially
synthesized polysaccharides.
Further indication of microbial production of carbo-
hydrates during DOM incubation is the observed increase
of d13C in samples from agricultural soils that showed an
intermediate extent of DOC mineralization, since poly-
saccharides and the microbial biomass are typically
enriched in 13C (Kracht and Gleixner, 2000; Lichtfouse,
2000). Also the unchanged HIXem values of DOM
samples from agricultural soils despite increasing aroma-
ticity point to microbial transformation. HIXem should
increase with increasing aromaticity and complexity.
However, HIXem is low for microbial products (Zsolnay
et al., 1999). The accumulation of both aromatic
compounds (see above) and microbial products is a
plausible explanation for lack of changes in HIXem values
during degradation of DOM from agricultural soils. The
possible formation of microbial products did not result in
increasing d13C during incubation of highly degradable
DOM, because of the strong enrichment of lignin-derived
compounds depleted in 13C (see above). Additionally, we
did not observe increasing d13C ratios for relatively stable
DOM samples from Oa horizons and peats. For the
samples from both Oa horizons, the 1H-NMR spectra
indicated decreases of the initially high contents of
carbohydrates during incubation. According to 1H-NMR,
the peat samples showed hardly changed contents of
carbohydrates. We hypothesize that only for DOM
samples from agricultural soils, the microbial biomass
production was sufficiently high to compensate for the
enrichment of lignin-degradation products and thus to
increase d13C.
In summary, the results obtained by different methods
indicate degradation, transformation, and formation of
carbohydrates during DOM biodegradation. At
low initial contents of carbohydrates, other compounds
such as lignin-derived moieties and lipids serve as
energy and carbon sources for the microorganisms.
However, this will also result in an accumulation
of microbial metabolites such as carbohydrates and
peptides. We can only speculate why these microbial
products are not mineralized as fast as carbohydrates
initially present in DOM before incubation. Possible
explanations may be (i) the preservation of these
compounds by bonding to stable DOM compounds like
lignin or (ii) a changing of the microbial community
during the incubation towards species adapted to the
residual, more refractory DOM.
K. Kalbitz et al. / Soil Biology & Biochemistry 35 (2003) 1129–11421140
4.3. Mechanisms and controlling factors of DOM
biodegradation—implications for the evolution of DOM
properties in soil
Aromatic compounds, possibly deriving from lignin
degradation, are likely to be the most stable fraction of
DOM although partly degradation of these compounds
occurred. The extent of biodegradation and relative
enrichment in aromatic compounds seems to be a function
of the initial aromaticity of DOM. During biodegradation,
aromatic H increased to an average value of 13%, which
resembles aromatic H contents of extractable soil organic
matter (e.g. Six et al., 2001). Therefore, DOM biodegrada-
tion seems to be responsible for the evolution of organic
matter properties being a precondition for the formation of
stable carbon. Furthermore, these structural changes
induced by DOM biodegradation should result in stronger
DOM sorption to the soil matrix.
No evidence was found that dissolved lipids are stable.
However, free fatty acids accumulated during DOM
biodegradation, possibly due to the build-up of microbial
biomass.
Besides preferential carbohydrate degradation in samples
with high initial contents, microbial production of carbo-
hydrates (and peptides) occurred especially for samples
initially low in carbohydrates. The extent of degradation or
production of certain compounds seems to be related to the
initial distribution of potential carbon and energy resources.
Nevertheless, DOM biodegradation is linked with microbial
formation of soluble organic matter.
Biodegradation resulted in an approximation of initially
very different DOM with respect to aromatic H, carbo-
hydrate H, and thermal stability. That means after
incubation, DOM from the Oi horizon strongly resembles
DOM from the Oa horizon. Therefore, not all the DOM
sampled in forest floor seepage is produced in the Oa
horizon but might also originate from the Oi layer and is
microbially altered during its migration through the forest
floor. A possible consequence would be that DOC entering
the mineral soil is much younger than estimated from the
carbon age of the Oa horizon. Further research is necessary
to quantify the relative contribution of different horizons to
DOM in forest floor leachates.
Acknowledgements
Financial support came from the Deutsche Forschungs-
gemeinschaft and the German Ministry of Education and
Research (BMBF).
References
Almendros, G., Dorado, J., 1999. Molecular characteristics related to the
biodegradability of humic acid preparations. European Journal of Soil
Science 50, 227–236.
Amon, R.M.W., Fitznar, H.-P., Benner, R., 2001. Linkages among the
bioreactivity, chemical composition, and diagenetic state of marine
dissolved organic matter. Limnology and Oceanography 46, 287–297.
Baldock, J.A., Oades, J.M., Waters, A.G., Peng, X., Vassallo, A.M.,
Wilson, M.A., 1992. Aspects of the chemical structure of soil organic
materials as revealed by solid-state 13C NMR spectroscopy. Biogeo-
chemistry 16, 1–42.
Benner, R., Fogel, M.L., Sprague, E.K., Hodson, R.E., 1987. Depletion of13C in lignin and its implication for stable isotope studies. Nature 320,
708–710.
Capriel, P., Beck, T., Borchert, H., Harter, P., 1990. Relationship between
soil aliphatic fraction extracted with supercritical hexane, soil microbial
biomass, and soil aggregate stability. Soil Science Society of America
Journal 54, 415–420.
Celi, L., Schnitzer, M., Negre, M., 1997. Analysis of carboxyl groups in soil
humic acids by a wet chemical method. Fourier-transform infrared
spectrophotometry, and solution-state carbon-13 nuclear magnetic
resonance. A comparative study. Soil Science 162, 189–197.
Chin, Y.-P., Aiken, G., O’Loughlin, E., 1994. Molecular weight,
polydispersity, and spectroscopic properties of aquatic humic sub-
stances. Environmental Science and Technology 28, 1853–1858.
Ekblad, A., Nyberg, G., Hogberg, P., 2002. 13C-discrimination during
microbial respiration of added C3-, C4- and 13C-labelled sugars to a C3-
forest soil. Oecologia 131, 245–249.
Ellerbrock, R.H., Hohn, A., Rogasik, J., 1999. Functional analysis of soil
organic matter as affected by long-term manurial treatment. European
Journal of Soil Science 50, 65–71.
Guggenberger, G., Zech, W., Schulten, H.-R., 1994a. Formation and
mobilization pathways of dissolved organic matter: evidence from
structural studies of organic matter fractions in acid forest floor
solutions. Organic Geochemistry 21, 51–66.
Guggenberger, G., Christensen, B.T., Zech, W., 1994b. Land-use effects on
the composition of organic matter in particle-size separates of soil.
I. Lignin and carbohydrate signature. European Journal of Soil Science
45, 449–458.
Haider, K., 1992. Problems related to the humification processes in soils of
temperate climates. In: Stotzky, G., Bollag, J.-M. (Eds.), Soil
Biochemistry 7, Marcel Dekker, New York, pp. 55–94.
Hongve, D., van Hees, P.A.W., Lundstrom, U.S., 2000. Dissolved
components in precipitation water percolated through forest litter.
European Journal of Soil Science 51, 667–677.
Huang, Y., Eglinton, G., van der Hage, E.R.E., Boon, J.J., Bol, R., Ineson,
P., 1998. Dissolved organic matter and its parent organic matter in grass
upland soil horizons studied by analytical pyrolysis techniques.
European Journal of Soil Science 49, 1–15.
Jandl, R., Sollins, P., 1997. Water-extractable soil carbon in relation to the
belowground carbon cycle. Biology and Fertility of Soils 25, 196–201.
Jandl, R., Sletten, R.S., 1999. Mineralization of forest soil carbon:
interactions with metals. Journal of Plant Nutrition and Soil Science
162, 623–629.
Kaiser, K., Guggenberger, G., Haumaier, L., Zech, W., 2002. The
composition of dissolved organic matter in forest soil solutions:
changes induced by seasons and passage through the mineral soil.
Organic Geochemistry 33, 307–318.
Kalbitz, K., Schmerwitz, J., Schwesig, D., Matzner, E., 2003. Biodegrada-
tion of soil-derived dissolved organic matter as related to its properties.
Geoderma 113, 273–291.
Kogel-Knabner, I., 2002. The macromolecular organic composition of plant
and microbial residues as inputs to soil organic matter. Soil Biology &
Biochemistry 34, 139–162.
Kracht, O., Gleixner, G., 2000. Isotope analysis of pyrolysis products from
Sphagnum peat and dissolved organic matter from bog water. Organic
Geochemistry 31, 645–654.
Leenheer, J.A., 1994. Chemistry of dissolved organic matter in rivers,
lakes, and reservoirs. In: Baker, L.A., (Ed.), Environmental Chemistry
of Lakes and Reservoirs, Advances in Chemistry Series 237, American
Chemical Society, Washington, DC, pp. 195–221.
K. Kalbitz et al. / Soil Biology & Biochemistry 35 (2003) 1129–1142 1141

Leinweber, P., Schulten, H.-R., Kalbitz, K., Meißner, R., Jancke, H., 2001.
Fulvic acid composition in degraded fenlands. Journal of Plant
Nutrition and Soil Science 164, 371–379.
Lewandowski, Z., Stoodley, P., Altobelli, S., Fukushima, E., 1994.
Hydrodynamics and kinetics in biofilm systems—recent advances and
new problems. Water Science and Technology 29, 223–229.
Lichtfouse, E., 2000. Compound-specific isotope analysis. Application to
archaelogy, biomedical sciences, biosynthesis, environment, extrater-
restrial chemistry, food science, forensic science, humic substances,
microbiology, organic geochemistry, soil science and sport. Rapid
Communications in Mass Spectrometry 14, 1337–1344.
Marschner, B., Noble, A.D., 2000. Chemical and biological processes
leading to the neutralisation of acidity in soil incubated with litter
materials. Soil Biology & Biochemistry 32, 805–813.
Marschner, B., Bredow, A., 2002. Temperature effects on release and
ecologically relevant properties of dissolved organic carbon in sterilised
and biologically active soil samples. Soil Biology & Biochemistry 34,
459–466.
Marschner, B., Kalbitz, K., 2003. Controls of bioavailability and
biodegradability of dissolved organic matter in soils. Geoderma 113,
211–235.
McKnight, D.M., Harnish, R., Wershaw, R.L., Baron, J.S., Schiff, S., 1997.
Chemical characteristics of particulate, colloidal, and dissolved organic
material in Loch Vale Watershed, Rocky Mountain National Park.
Biogeochemistry 36, 99–124.
Melillo, J.M., Aber, J.D., Linkins, A.E., Ricca, A., Fry, B., Nadelhoffer,
K.J., 1989. Carbon and nitrogen dynamics along the decay continuum:
plant litter to soil organic matter. Plant and Soil 115, 189–198.
Metting, F.B., 1993. Structure and physiological ecology of soil microbial
communieties. In: Metting, F.B., (Ed.), Soil Microbial Ecology.
Applications in Agricultural and Environmental Management, Marcel
Dekker, New York, pp. 3–25.
Møller, J., Miller, M., Kjøller, A., 1999. Fungal-bacterial interaction on
beech leaves: influence on decomposition and dissolved organic carbon
quality. Soil Biology & Biochemistry 31, 367–374.
Moran, M.A., Sheldon, W.M., Zepp, R.G., 2000. Carbon loss and optical
property changes during long-term photochemical and biological
degradation of estuarine dissolved organic matter. Limnology and
Oceanography 45, 1254–1264.
Norden, B., Berg, B., 1990. A non-destructive method (solid state 13C
NMR) for determining organic chemical components of decomposing
litter. Soil Biology & Biochemistry 22, 271–275.
Ogawa, H., Amagai, Y., Koike, I., Kaiser, K., Benner, R., 2001. Production
of refractory dissolved organic matter by bacteria. Science 292,
917–920.
Parlanti, E., Worz, K., Geoffroy, L., Lamotte, M., 2000. Dissolved organic
matter fluorescence spectroscopy as a tool to estimate biological
activity in a coastal zone submitted to anthropogenic inputs. Organic
Geochemistry 31, 1765–1781.
Pinney, M.L., Westerhoff, P.K., Baker, L., 2000. Transformations in
dissolved organic carbon through constructed wetlands. Water
Research 34, 1897–1911.
Qualls, R.G., Haines, B.L., 1992. Biodegradability of dissolved organic
matter in forest throughfall, soil solution, and stream water. Soil
Science Society of America Journal 56, 578–586.
Raymond, P.A., Bauer, J.E., 2001. Riverine export of aged terrestrial
organic matter to the North Atlantic Ocean. Nature 409, 497–500.
Schulten, H.-R., 1996. Direct pyrolysis-mass spectrometry of soils: a novel
tool in agriculture, ecology, forestry, and soil science. In: Boutton,
T.W., Yamasaki, S. (Eds.), Mass Spectrometry of Soils, Marcel Dekker,
New York, pp. 373–436.
Schulten, H.-R., Gortz, W., 1978. Curie-point pyrolysis and field ionization
mass spectrometry of polysaccharides. Analytical Chemistry 50,
428–433.
Schulten, H.-R., Gleixner, G., 1999. Analytical pyrolysis of humic
substances and dissolved organic matter in aquatic systems: structure
and origin. Water Research 33, 2489–2498.
Schulten, H.-R., Leinweber, P., 1999. Thermal stability and composition of
mineral-bound organic matter in density fractions of soil. European
Journal of Soil Science 50, 237–248.
Schulten, H.-R., Leinweber, P., Jandl, G., 2002. Analytical pyrolysis of
humic substances and dissolved organic matter in water. In: Frimmel,
F.H., Abbt-Braun, G., Heumann, K.-G., Hock, B., Ludemann, H.-D.,
Spiteller, M. (Eds.), Refractory Organic Substances in the Environment,
Wiley-VCH, Weinheim, pp. 163–187.
Senesi, N., Miano, T.M., Provenzano, M.R., Brunetti, G., 1989. Spectro-
scopic and compositional comparative characterization of I.H.S.S.
reference and standard fulvic and humic acids of various origin. The
Science of the Total Environment 81/82, 143–156.
Six, J., Guggenberger, G., Paustian, K., Haumaier, L., Elliott, E.T., Zech,
W., 2001. Sources and composition of soil organic matter fractions
between and within soil aggregates. European Journal of Soil Science
52, 607–618.
Sollins, P., Homann, P., Caldwell, B.A., 1996. Stabilization and
destabilization of soil organic matter: mechanisms and controls.
Geoderma 74, 65–105.
Volk, C.J., Volk, C.B., Kaplan, L.A., 1997. Chemical composition of
biodegradable dissolved organic matter in streamwater. Limnology and
Oceanography 42, 39–44.
Wilson, M.A., 1987. NMR Techniques and Applications in Geochemistry
and Soil Chemistry, Pergamon Press, Oxford.
Wilson, M.A., Collin, P.J., Malcolm, R.L., Perdue, E.M., Cresswell, P.,
1988. Low molecular weight species in humic and fulvic fractions.
Organic Geochemistry 12, 7–12.
Yanagi, Y., Tamaki, H., Otsuka, H., Fujitake, N., 2002. Comparison of
decolorization by microorganisms of humic acids with different 13C
NMR properties. Soil Biology & Biochemistry 34, 729–731.
Zsolnay, A., Steindl, H., 1991. Geovariability and biodegradability of the
water-extractable organic material in an agricultural soil. Soil Biology
& Biochemistry 23, 1077–1082.
Zsolnay, A., Baigar, E., Jimenez, M., Steinweg, B., Saccomandi, F., 1999.
Differentiating with fluorescence spectroscopy the sources of dissolved
organic matter in soils subjected to drying. Chemosphere 38, 45–50.
K. Kalbitz et al. / Soil Biology & Biochemistry 35 (2003) 1129–11421142
Copyright © 2022 FDOKUMEN