hurricane impacts on water quality and dissolved organic matter
175
HURRICANE IMPACTS ON WATER QUALITY AND DISSOLVED ORGANIC MATTER CYCLING ALONG AN AQUATIC CONTINUUM By TRACEY B. SCHAFER A DISSERTATION PRESENTED TO THE GRADUATE SCHOOL OF THE UNIVERSITY OF FLORIDA IN PARTIAL FULFILLMENT OF THE REQUIREMENTS FOR THE DEGREE OF DOCTOR OF PHILOSOPHY UNIVERSITY OF FLORIDA 2020
-
Upload
khangminh22 -
Category
Documents
-
view
0 -
download
0
Transcript of hurricane impacts on water quality and dissolved organic matter
HURRICANE IMPACTS ON WATER QUALITY AND DISSOLVED ORGANIC MATTER CYCLING ALONG AN AQUATIC CONTINUUM
By
TRACEY B. SCHAFER
A DISSERTATION PRESENTED TO THE GRADUATE SCHOOL OF THE UNIVERSITY OF FLORIDA IN PARTIAL FULFILLMENT
OF THE REQUIREMENTS FOR THE DEGREE OF DOCTOR OF PHILOSOPHY
UNIVERSITY OF FLORIDA
2020

© 2020 Tracey B. Schafer

To my family, friends, and lab mates who assisted and encouraged me along the way, I really appreciate your help and moral support over the past 4 years. I can never thank
you enough.

4
ACKNOWLEDGMENTS
There are many people that I would like to thank for their guidance and support
over the past 4 years. To begin with, I could not have started or successfully completed
this PhD without my advisor, Dr. Todd Osborne, who gave me a chance as a master’s
student 6 years ago. Additionally, Dr. K.R. Reddy was also an PhD excellent mentor
and co-advisor with a lifetime of experience and advice to offer. I could not have made it
this far without the expertise of my committee members Dr. Christine Angelini and Dr.
Tom Bianchi. There have been several co-authors and collaborators throughout this
process that have been pivotal in making this research and analyses possible, including
Dr. Paul Julian (Department of Environmental protection and the University of Florida)
and Dr. Nicholas Ward (PNNL Marine Sciences Laboratory) who advised me on every
step to complete and publish my second chapter. Dr. Nikki Dix (Guana-Tolomato
Matanzas National Estuarine Research Reserve- GTMNERR) and Shannon Dunnigan
(GTMNERR) allowed me access to GTM sites, data, and expertise that made my third
chapter possible. Dr. Michael Gonsior (University of Maryland Chesapeake Biological
Laboratory- CBL) and Dr. Leanne Powers (CBL) welcomed me into their lab for two
weeks and access to their unique photo-chemistry set-up. Leanne’s further guidance
and patience while I struggled to learn MATLAB to complete my fourth chapter was key
to the completion of my dissertation. I would like to thank Osborne lab members past
and present, especially Anna Thornton and Trent Dye, for all the hours spent assisting
me both in the lab and in the field. I would like to thank my friends, many of which
accompanied me through the PhD struggle and supported me along the way. Finally, I
would like to thank my parents, Marci Adelston-Schafer and Robert Schafer for
supporting me through my 23 years of school.

5
TABLE OF CONTENTS
page
ACKNOWLEDGMENTS .................................................................................................. 4
LIST OF TABLES ............................................................................................................ 8
LIST OF FIGURES .......................................................................................................... 9
LIST OF ABBREVIATIONS ........................................................................................... 12
ABSTRACT ................................................................................................................... 14
CHAPTER
1 IMPACTS OF HURRICANES AND LARGE-SCALE DISTURBANCE ON BIOGEOCHEMICAL CYCLING OF ORGANIC MATTER ALONG THE AQUATIC CONTINUUM ......................................................................................... 16
River Continuum and Associated Concepts ............................................................ 18
Hurricane Effects on Water Quality and Dissolved Organic Matter Cycling ............ 21 Salinity .............................................................................................................. 22
Dissolved Oxygen ............................................................................................ 22 Turbidity............................................................................................................ 23
Dissolved Organic Matter Export and Cycling .................................................. 23 Photo-degradation of Dissolved Organic Matter ..................................................... 24
Data Gaps and Research Needs ............................................................................ 27
2 IMPACTS OF HURRICANE DISTURBANCE ON WATER QUALITY ACROSS
THE AQUATIC CONTINUUM OF A BLACK-WATER RIVER TO ESTUARY COMPLEX .............................................................................................................. 31
Methods and Materials............................................................................................ 34 Study Site ......................................................................................................... 34
Short Duration High-resolution Water Quality Monitoring ................................. 35 Long Duration Monitoring of Carbon, Phosphorus, and Metals ........................ 37
Statistical Analysis ............................................................................................ 37 Results .................................................................................................................... 39
Short-term Water Quality Monitoring of Hurricane Response (St. Augustine) .. 39 Long-term (3 month) Monitoring of Dissolved Carbon, Phosphorus, and
Metals............................................................................................................ 42 Discussion .............................................................................................................. 44
Biogeochemical Responses to Hurricane Irma ................................................. 44 Implications on Ecosystem Resilience.............................................................. 49

6
3 IMPACTS OF HURRICANES ON NUTRIENT EXPORT AND ECOSYSTEM METABOLISM IN A BLACKWATER RIVER ESTUARY ......................................... 64
Methods .................................................................................................................. 67 Study Site ......................................................................................................... 67
Data Collection for Export Calculation .............................................................. 68 Hurricane Export .............................................................................................. 70
Statistical Analysis ............................................................................................ 70 Ecosystem Metabolism..................................................................................... 71
Results .................................................................................................................... 72 Export of DOC and Nutrients ............................................................................ 72
Hurricane Export .............................................................................................. 73 Storm Group Comparison................................................................................. 74
Principle Component Analysis .......................................................................... 74 Ecosystem Metabolism..................................................................................... 75
Discussion .............................................................................................................. 76 Organic Matter Export ...................................................................................... 76
Evaluation of Ecosystem Metabolism ............................................................... 80 Conclusion .............................................................................................................. 81
4 TROPICAL STORM INDUCED CHANGES AFFECT ABSORBANCE AND FLUORESCENCE DEGRADATION OF VEGETATION-DERIVED DISSOLVED ORGANIC MATTER ............................................................................................... 96
Study Site and Methods .......................................................................................... 99
Study Site Description ...................................................................................... 99 Leachate Preparation ..................................................................................... 100
Photo-degradation Experiments ..................................................................... 100 Dissolved Organic Carbon and Nitrogen Analyses: ........................................ 102
Statistical Analysis .......................................................................................... 103 Changes in Optical Properties: ....................................................................... 103
Results .................................................................................................................. 104 Absorbance Curves at a(254), a(300) ............................................................ 104
Fluorescence, PARAFAC, and Component Degradation Curves ................... 106 Dissolved Organic Carbon and Total Dissolved Nitrogen ............................... 108
Discussion ............................................................................................................ 108 Conclusion ............................................................................................................ 113
5 SYNTHESIS ......................................................................................................... 131
APPENDIX
A SUPPLEMENTARY INFORMATION FOR CHAPTER 2 ....................................... 139
B SUPPLEMENTARY INFORMATION FOR CHAPTER 3 ....................................... 141
C SUPPLEMENTARY INFORMATION FOR CHAPTER 4 ....................................... 151

7
LIST OF REFERENCES ............................................................................................. 155
BIOGRAPHICAL SKETCH .......................................................................................... 175

8
LIST OF TABLES
Table page 2-1 Correlations compared before, during, and after Hurricane Irma........................ 53
2-2 Total dissolved phosphorus and total dissolved iron concentrations from collected water samples. .................................................................................... 53
3-1 Precipitation, wind speed, and storm surge measurements for St. Augustine, FL during Hurricanes Matthew, Irma, and Dorian. .............................................. 83
3-2 Cumulative precipitation per month between April 2017 and September 2019. . 83
3-3 Summary of Precipitation, concentration, and standard deviation of analytes collected in Pellicer Creek. ................................................................................. 84
3-4 Estimation of % average annual export of analytes form the hurricane and highest precipitation months. .............................................................................. 84
4-1 Components resulting from PARAFAC analysis of irradiation leachate samples. ........................................................................................................... 115
4-2 Dissolved organic carbon and total dissolved nitrogen concentrations in freshwater leached vegetation .......................................................................... 116
4-3 Average % loss or gain of absorbance at a(254) and a(300) over the 20-hour irradiation period. .............................................................................................. 116
4-4 Average % loss or gain of maximum fluorescence over the 20-hour irradiation period. .............................................................................................. 116
A-1 Minimum detection limits for analytes discussed in this study. ......................... 139
B-1 Storm export of DOC, ammonia-N, phosphate, nitrate, and nitrite in Pellicer Creek ................................................................................................................ 143
B-2 Average net ecosystem metabolism, community respiration, and gross primary production ........................................................................................... 144
C-1 Exponential curves coefficients and R2 values calculated for absorption coefficient changes at a(254) for each sample ................................................. 151
C-2 Exponential curve coefficients and R2 values calculated for absorption coefficient decay at a(300) for each sample. .................................................... 152
C-3 Exponential curve coefficients and R2 values calculated at for PARAFAC generated components of each sample ............................................................ 152

9
LIST OF FIGURES
Figure page 1-1 Diagram depicting an example of DOM cycling and degradation in wetland
systems from photolytic and biotic processes..................................................... 29
1-2 Diagram developed at the beginning of the dissertation connecting the chapters .............................................................................................................. 30
2-1 Map of three locations where YSI data sondes were placed along the study site located in St. Augustine, FL ......................................................................... 54
2-2 Wind speed and precipitation measurements taken during the month of September at the middle reaches site ................................................................ 55
2-3 Salinity graph showing fluctuations at the three sonde locations for before, during, and after Hurricane Irma. ........................................................................ 56
2-4 Turbidity and Chlorophyll-a measurements taken at the estuary sonde location during the storm. ................................................................................... 57
2-5 fDOM concentrations at the estuary and freshwater 1 sonde locations .............. 58
2-6 Measured fluctuations in dissolved oxygen across the study site.. ..................... 59
2-7 Correlations from before, during, and after Hurricane Irma compared for a series of parameters ........................................................................................... 60
2-8 PCA biplot depicting the amount of correlation amongst water quality parameters. ........................................................................................................ 61
2-9 Measured concentrations for changes in salinity, pH, total dissolved phosphorus, total dissolved iron, and dissolved organic carbon at estuary, tidal creek, freshwater 1, and freshwater 2 locations .......................................... 62
2-10 Measured concentrations for changes in salinity, pH, total dissolved phosphorus, total dissolved iron, and dissolved organic carbon ......................... 63
3-1 Map of the study site located within the Pellicer Creek Aquatic Preserve and the Faver Dykes State Park. ............................................................................... 85
3-2 Wind speed and total precipitation collected by the GTMNERR meteorological station ......................................................................................... 86
3-3 Historical precipitation overlaid with nutrient concentrations. .............................. 87
3-4 DOC export from Pellicer Creek from April 2017 to September 2019. ................ 88

10
3-5 Nutrient export form Pellicer Creek from April 2017- September 2019. ............. 89
3-6 Pearson correlation between monthly discharge and precipitation used to estimate discharge for Hurricane Matthew. ........................................................ 90
3-7 Export compared between Hurricanes Matthew, Irma, and Dorian. .................... 91
3-8 Box plot displaying average and range of DOC export based on storm groups. ............................................................................................................... 92
3-9 Box plots displaying average and range nutrients. .............................................. 93
3-10 Principle component analysis run in R using DOC, ammonia-N, nitrate, ortho-phosphate, and TKN data from the 3 storm groups. ................................. 94
3-11 Net ecosystem metabolism in Pellicer Creek from January 2016- September 2019 ................................................................................................................... 95
4-1 Map of the study site near St. Augustine, FL where vegetation was collected for this study from the Intracoastal Waterway into the fresher headwaters of Pellicer Creek ................................................................................................... 118
4-2 Absorbance coefficients in fresh and saltwater diluted samples over λ= 250 – 700 nm.. ........................................................................................................... 119
4-3 Differential absorption coefficients in fresh and saltwater diluted samples over λ= 250 – 700 nm. ...................................................................................... 120
4-4 Decay curves and replicates at wavelength 254 normalized for T0. ................ 121
4-5 Decay curves and replicates at wavelength 300 normalized for T0. ................ 122
4-6 EEMS depicting Avicennia germinans leachate fluorescence before and after irradiation. ......................................................................................................... 123
4-7 EEMs depicting Juncus roemerianus leachate florescence before and after 20 hours of irradiation.. ..................................................................................... 124
4-8 EEMs depicting Taxodium distichum leachate fluorescence before and after 20 hours of irradiation.. ..................................................................................... 125
4-9 Avicennia germinans components. ................................................................... 126
4-10 Juncus roemerianus components. .................................................................... 127
4-11 PARAFAC components for Taxodium distichum split validated spectra. .......... 128
4-12 Component degradation curves normalized to T0 ............................................. 129

11
4-13 Humification index of the three species. ............................................................ 130
5-1 Aquatic continuum that shows biogeochemical effects during and after a hurricane........................................................................................................... 137
5-2 Diagram developed at the end of the dissertation connecting the chapters. ..... 138
A-1 Pellicer Creek tidally filtered discharge volume pre- and post- Hurricane Irma . 139
A-2 Measured concentrations for dissolved organic carbon at four locations. ......... 140
B-1 Map of soil sampling locations across the study site in three ecosystem types. ................................................................................................................ 146
B-2 Soil organic matter and bulk density from three different ecosystem types from around the study site area ........................................................................ 147
B-3 DOC and NH3-N leached from the three soil types in DI water, artificial brackish water at 10 psu, and artificial seawater at 30 psu .............................. 148
B-4 Total kjeldahl nitrogen leached from the three soil types in DI water, artificial brackish water at 10 psu, and artificial seawater at 30 psu. ............................. 149
B-5 Salinity concentrations at the time of Hurricanes .............................................. 150
C-1 PARAFAC components for Taxodium distichum split validated contour plots. . 154
12
LIST OF ABBREVIATIONS
a() Absorbance wavelengh
C carbon
Chl-a Chlorophyll-a
CO2 carbon dioxide
CDOM chromophoric dissolved organic matter
CPOM course particulate organic matter
DIC dissolved inorganic carbon
DOC dissolved organic carbon
DOM dissolved organic matter
EEM excitation emission matrices
FDOM fluorescent dissolved organic matter
FPOM fine particulate organic matter
GTMNERR Guana Tolomato Matanzas National Estuarine Research Reserve
LOAC land-ocean aquatic continuum
NEM net ecosystem metabolism
NH3-N ammonia-Nitrogen
NH4+ ammonium
NO3-N nitrate
P phosphorus
PARAFAC parallel factor analysis
PCA principal component analysis
Pg gross primary production
PO43- ortho-phosphate
OM organic matter

13
RCC river continuum concept
Rt community respiration
SGD submarine groundwater discharge
SRP soluble reactive phosphorus (same as ortho-phosphate)
TDFe total dissolved iron
TDN total dissolved nitrogen
TDP total dissolved phosphorus
TKN total kjeldahl nitrogen

14
Abstract of Dissertation Presented to the Graduate School of the University of Florida in Partial Fulfillment of the Requirements for the Degree of Doctor of Philosophy
HURRICANE IMPACTS ON WATER QUALITY AND DISSOLVED ORGANIC MATTER
CYCLING ALONG AN AQUATIC CONTINUUM
By
Tracey B. Schafer
August 2020
Chair: Todd Osborne Cochair: K. R. Reddy Major: Soil and Water Sciences This work provides some insights on the effects of hurricane disturbance on
dissolved organic matter dynamics along a blackwater-river- estuary continuum. First,
Hurricane Irma’s passage through St. Augustine, FL. Is examined by monitoring water
quality (e.g. dissolved oxygen, turbidity, and salinity) during the storm at three locations
along a 15 km site. Hurricane Irma caused rapid changes as observed by in-situ water
quality monitors over a two-week period, but some effects persisted for longer periods
according to three-month weekly water sampling. These effects included shifts in DOM
loading, altered salinity dynamics, and reshaped landscapes due to wind and wave
surge both in the upland marsh and in the downstream estuary. Observations of system
response to these disturbances helped in understanding mechanisms associated with
ecosystem resilience. Second, in order to determine if hurricanes are more impactful
than other frequent storm events (e.g. thunderstorms and nor’easters) in northeast
Florida, export of dissolved organic matter was calculated. Additionally, net ecosystem
metabolism (NEM) characteristics were measured and monthly data was grouped

15
based on precipitation. Hurricanes and other storms were shown to have similar effects
on DOM export, but hurricanes have a more significant impact metabolic characteristics.
Furthermore, hurricanes create rapid salinity changes in wetlands and
waterways, affecting degradation of organic matter in coastal aquatic systems. A third
mechanistic study was conducted to determine how DOM was photochemically
(abiotically) affected by salinity using DOM source material of the three dominant
vegetative species, Avicennia germinans, Juncus roemerianus, and Taxodium
distichum, along the study site. Photo-chemical properties shown by PARAFAC and
absorbance and fluorescence changes over time indicates important differences in
degradation patterns amongst DOM from different sources and therefore variability of
individual contributions to the DOM pool across the aquatic continuum. These findings
indicate a need for photochemical research from specific DOM sources to improve
photochemical models. Overall, hurricanes can be disruptive forces that change
riverine-estuarine biogeochemistry in significant ways. Although DOM export can be
similar for common storms, photochemical, ecological, and metabolic characteristics
can be drastically impacted by hurricanes and are important considerations as tropical
cyclone intensity and frequency increases.
16
CHAPTER 1 IMPACTS OF HURRICANES AND LARGE-SCALE DISTURBANCE ON
BIOGEOCHEMICAL CYCLING OF ORGANIC MATTER ALONG THE AQUATIC CONTINUUM
Climate change is arguably one of the most important and urgent environmental
issues we face as a global community today. Due to the scale and cost of
environmental problems associated with this issue, there are many unknowns,
especially with respect to coastal ecosystems. Warming temperatures, alterations in
organic matter cycling, shifts in tropical storm intensity and frequency, and rising sea
level are posing the some of the greatest challenges associated with climate change
and making coastal ecosystems especially vulnerable (Masson-Delmotte et al., 2018).
These climate change factors can affect everything from food web dynamics to invasive
species and nutrient cycling (Harley et al., 2006; Herbert et al., 2015b; Masson-
Delmotte et al., 2018). The focus of this dissertation is to understand the effects of one
of these factors, tropical storms, on biogeochemical cycling within coastal waterways,
mainly concentrating on dissolved organic matter (DOM) cycling, a significant ecological
characteristic of estuarine and coastal waterways.
Tropical storms are influential disturbances that affect coastal ecosystems on a
large scale and can alter the state of the system for short (days) to long (months)
periods depending on scale and proximity of the storm. Precipitation from hurricanes
from “wet” storms can transport massive amounts of fresh organic matter into
waterways within only a few hours to days, and dry “windy” storms are more likely to
export older previously stored carbon sources into waterways (Paerl et al., 2018). The
excess nutrients can lead to algal blooms, eutrophication, decreases in dissolved
oxygen concentrations, and alterations in salinity that can greatly affect biological

17
communities (Mallin and Corbett, 2006a; O’Connell et al., 2014; Paerl et al., 2006). On
the other hand, hurricanes may also flush excess nutrients and pollutants out of a
system, indicating that hurricane impacts can be very site specific (Majidzadeh et al.,
2017; Paerl et al., 2018). Hurricanes can cause many of these landscape-scale
changes by altering water levels and organic matter loads. This dissertation primarily
examines the impacts of hurricanes on one fraction of organic matter, DOM, on water
quality, export, and photo-chemical degradation.
Dissolved organic matter consists of a wide range of compounds present in water
that are less than 0.45 µm and play a variety of vital ecological roles. DOM is comprised
of a mixture of organic materials and can be broken down into many consistent parts,
including but not limited to chromophoric dissolved organic matter (CDOM), fluorescent
dissolved organic matter (FDOM), and dissolved organic carbon (DOC) that vary in
lability, bioavailability, and susceptibility to biotic and abiotic degradation pathways
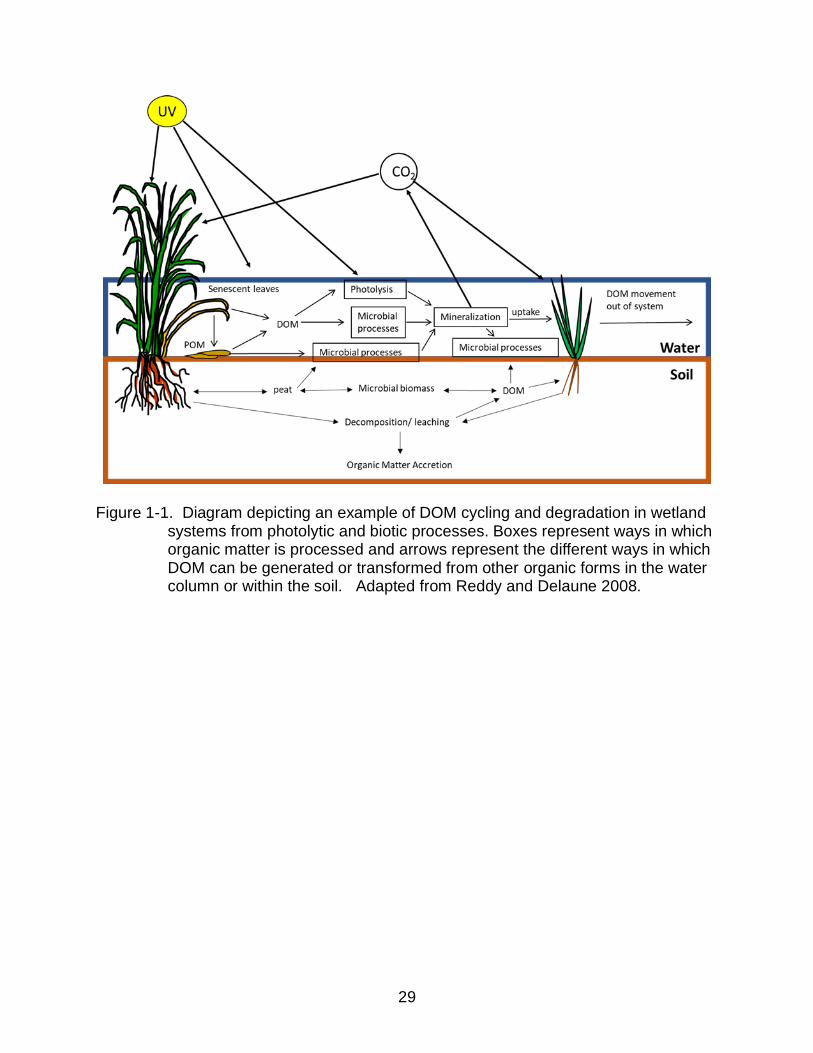
(Bracchini et al., 2006; Del Vecchio and Blough, 2002). DOM plays important ecological
and biogeochemical roles in waterways, providing energy to the microbial loop in the
form of electron donors, binding metals that would otherwise be toxic to the
environment, and providing a source of nutrients to ecological communities (Fig. 1-1;
Wetzel, 2001; Reddy and Delaune, 2008, Frimmel, 1998). Due to the susceptibility of
coastal ecosystems to disturbance and the effects of saline transgression, DOM cycles
in these environments are prone to alteration and can cause direct and indirect adverse
effects to environmental health (Harley et al., 2006).
Several studies have shown how shifts in DOM dynamics occur along an aquatic
continuum, but there is still limited understanding about how salt water intrusion and

18
disturbance events will affect the cycling, degradation, and release of DOM over time
along these transition zones (Bouwman et al., 2013; Stephens and Minor, 2010;
Vannote et al., 1980; Ward et al., 2017). Due to the implications for water quality and
wetland health from large shifts in DOM cycling, it is imperative to better understand
how these potentially imminent storms and their associated effects will affect coastal
waterways. According to the river continuum/ aquatic continuum concepts, water
originates from uplands and flows downstream into larger order streams, rivers, and
estuaries, where biological communities replace one another to maintain levels of
energy equilibria throughout the length of the waterway (Bouwman et al., 2013; Vannote
et al., 1980). As biological communities change along the waterway, organic matter
composition and nutrient inputs shift, which leads to changes in DOM and POM quality
and concentrations that are influenced by a variety of environmental variables. These
variables range from weather patterns to seasonality, and biotic and abiotic degradation
(Bouwman et al., 2013; Ran et al., 2013; Romigh et al., 2006; Wetzel et al., 1995b).
These shifts, the river continuum concept, and other associated concepts are important
first steps to understanding and interpreting the effects of hurricane impacts on DOM
across the aquatic continuum.
River Continuum and Associated Concepts
According the river continuum concept (RCC), changes in nutrient
concentrations, biological communities, and biogeochemical characteristics upstream
can greatly affect downstream communities and cycles. “Leakage” of upstream nutrients
that are not utilized by upstream lotic communities (primarily dominated by
heterotrophs) are then transported to downstream communities (primarily dominated by
autotrophs). Along this gradient, as changes to the system occur, the biotic communities

19
adjust to keep up with alterations occurring in the physical system. This concept relies
highly on the system being in dynamic equilibrium with processing strategies that
involve minimal energy loss along the continuum. In addition, the upper reaches of the
river usually consist of more course particulate organic matter (CPOM), which changes
to fine particulate organic matter (FPOM) downstream (Vannote et al., 1980). These
ideas are prominent in the RCC, but there are several other concepts that are closely
related.
Associated with the river continuum concept is the concept of nutrient spiraling
that combines horizontal stream flow with nutrient cycling, assuming that downstream
flow perpetuates the transport, release, and uptake of nutrients at various locations
along a lotic system (Webster et al., 2016; Webster and Patten, 1979). Some studies
have used isotopes as tracers, such as 32P, to observe this cycling in the natural
environment (Hayes et al., 1952; Rigler, 1956). One study observed that 32P
concentrations were much lower in streambeds than in lakes due to the continuous
movement of the current (Hayes et al., 1952; Rigler, 1956). Another study determined
that 90% of the 32P released in the study was taken up within the first 4800 m of the
stream, then replaced by mineralized phosphorus forms later downstream as
determined by consistent concentrations of SRP (Ball and Hooper, 1963). Uptake length
and velocity have been seen to differ between nutrients in nutrient spiraling studies. On
average ammonium uptake is around 86 m, phosphate is 96 m, and nitrate is 236 m
(Ensign and Doyle, 2006). Although ammonium uptake decreased in large order
streams, nitrate and phosphate uptake increased (Ensign and Doyle, 2006).
Additionally, N:P ratios and uptake are dependent on heterotrophic vs. autotrophic

20
streams due to algal communities’ superior ability to uptake nutrients in comparison to
bacterial communities (Schade et al., 2011). The complexity of this cycling along with
variable flow patterns can make the study of this concept extremely challenging.
There have been several other concepts that also branch from these, including
the serial discontinuity concept, the hyporheic corridor concept, the flood-pulse concept,
U-shaped concept, and the pulse-shunt hypothesis. The land-ocean aquatic continuum
(LOAC) concept and the submarine groundwater discharge (SGD) concepts are also
related to the RCC (Anderson et al., 2019; Xenopoulos et al., 2017). The serial
discontinuity concept supports the idea of impoundments being a disruption within the
river continuum that causes changes to normal flow, cycling, and biological patterns
(Ward and Stanford, 1995). The LOAC examines the transport of carbon and
terrigenous DOM from terrestrial systems to the ocean, in similar fashion to the RCC
(Anderson et al., 2019). The hyporheic corridor and flood pulse concepts are based on
floodplain systems, and theorize that these systems have unique biogeochemical
patterns and food webs that are not based on normal continuous flow conditions (Junk
et al., 1989; Stanford and Ward, 1993). The U-shaped concept is closely related to the
nutrient spiraling concept and is focused on the idea that in the transition from upstream
to downstream, allochthonous inputs decrease and autochthonous production increases
that results in an energy output curve that is u-shaped (Webster, 2007). The pulse-
shunt hypothesis is centered on the idea that snowmelt and occasional large storm
events account for a large percentage of the input of terrestrial DOM into the aquatic
environment. Pulse events mobilize the DOM, which is then shunted (pushed) rapidly
downstream (Raymond et al., 2016). Finally, the SGD concept explains that

21
subterranean estuaries where seawater and groundwater mixing occur are a significant
nutrient, carbon, and metals input to coastal systems (Moore, 2010). Overall, there are
many concepts that evolved around the RCC, but all of them center around the theory
that there is connectivity between waterways and associated areas that leads to
linkages between the biological, chemical, and physical environment. Changes in one
part of this environment creates a domino effect across the entire system. Therefore,
impacts of large-scale disturbances, such as hurricanes, do not affect just one piece of
a waterway but the entire aquatic continuum.
Hurricane Effects on Water Quality and Dissolved Organic Matter Cycling
Due to the level of connectivity, hurricane disturbance can cause drastic shifts
that affect the entire aquatic continuum. According to the report generated from the last
International Panel for Climate Change (Masson-Delmotte et al., 2018), tropical storm
activity has greatly increased in the Atlantic since 1970. The report also claims that
tropical storm activity is believed to become more frequent, suggesting environmental
effects from these storms will persist and may even worsen over time. Contradictorily,
another study claimed that hurricanes may become less frequent over time but more
intense, with higher likelihood of categories 4 or 5 (Bender et al., 2010). Climate
scientists have disagreed over the years as to the frequency and intensity of tropical
storms and hurricanes in the future (Emanuel, 2005b; Knutson et al., 2008; Webster et
al., 2005). However, there is a consensus that whenever these storms do occur, there
are significant environmental repercussions (Masson-Delmotte et al., 2018). Since
every storm and coastal system is unique, effects need to be assessed individually as
some system will be suffer greater effects than others. Regardless of the intensity of
impact, hurricanes do disturb and change the local environment.
22
Salinity
Due to the proximity of hurricanes to the coast and coastal waterways, salinity
concentrations generally fluctuate during hurricanes and tropical storms. Some storms
will primarily cause dilution within estuaries or near coastal waters and cause salinity
and specific conductance values to drop during the storm (Bonvillain et al., 2011).
Salinity fluctuation is dependent primarily on storm conditions and is dependent on
seawater being pushed inland or freshwater being pulled seaward. In Apalachicola Bay,
salinity levels decreased and were diluted due to significant rainfall from Hurricanes
Ivan and Jeanne but this effect was not seen during Frances, indicating unique
circumstances for each event even at the same location (Edmiston et al., 2008).
Dissolved Oxygen
Dissolved oxygen concentrations within a waterway are dependent upon a wide
variety of factors. Hurricanes and disturbance events are well known to affect DO, in
many cases decreasing concentrations that may lead to hypoxia and anoxia in wetlands
and waterways (Bonvillain et al., 2011; O’Connell et al., 2014; Tomasko et al., 2006).
However, mixing from increased wind velocity and tidal flushing can increase DO
concentrations as shown during Hurricane Katrina where coastal areas surrounding the
Gulf of Mexico increased mixing and DO concentrations up to 5 mg l-1 (Smith et al.,
2009). In Apalachicola Bay, DO was shown to either remain the same or increase due
to mixing during both Hurricane Ivan and Jeanne (Edmiston et al., 2008).
During Hurricane Gustav in 2008, DO in the Atchafalaya River Basin decreased
to less than 2 mg L-1 within 3 days of the storm, anoxic conditions were present within 5
days, and normal conditions were not restored in the area until six weeks post-storm
(Bonvillain et al., 2011). When several hurricanes impact an area over a short time

23
period, more pronounced effects of hypoxia can be seen. In 2004, Hurricanes Charley,
Frances, and Jeanne affected DO concentrations in the Peace River in Charlotte
Harbor. DO dropped to less than 2 mg L-1 then to less than 0.5 mg L-1 eight days after
Hurricane Charley. Soon after, the area was hit by Hurricanes Francis and Jeanne
which caused persistently low DO for a total of 2-3 months after the storms passed
(Tomasko et al., 2006).
Turbidity
Turbidity is dependent upon suspended matter in the water column that causes
water coloration. High wind speeds and prolific precipitation during hurricanes increase
turbidity from sediment resuspension and runoff (Edmiston et al., 2008; Lou et al.,
2016). During Hurricanes Frances, Jeanne, and Wilma, the wave and wind action
suspended 3 million metric tons of sediment into the water column (Havens et al. 2011).
Turbidity can also be an indirect effect of other issues caused by hurricane
disturbances. Lake Pontchartrain in Louisiana lost 50% of benthic invertebrates after
Hurricane Katrina, including a variety of bivalves, such as Rangia cuneate, that are
important filter feeders. Collapse of the benthic community caused an increase in
turbidity, as well as chlorophyll a (Poirrier et al., 2008).
Dissolved Organic Matter Export and Cycling
Hurricanes disrupt normal DOM cycling patterns due to high levels of runoff and
wind. During hurricane events, carbon is exported from terrestrial systems into
waterways in concentrations magnitudes larger than under normal (pre-storm)
conditions. Export of DOC from crop fields in the Virginia coastal plain during tropical
storms yielded 22 kg DOC ha-1 (Caverly et al., 2013). One tropical storm event exported
one fifth of the total 2011 DOC flux in a forested ecosystem in Maryland (Dhillon and

24
Inamdar, 2013). In modelling an estuarine system in North Carolina during Hurricane
Irene, it was estimated that there was a one-week lag time after the hurricane event
when maximum DOC concentration discharge was determined. One week post-Irene,
DOC was measured at 29.85 mg L-1 , an increase from pre-storm concentrations by 18
mg L-1 (approximately 2.5 times normal concentrations) (Brown et al., 2014). Overall,
hurricanes export large amounts of organic matter very rapidly, but there are many
processes transforming and degrading DOM as it is exported downstream.
Photo-degradation of Dissolved Organic Matter
Biotic and abiotic processes transform, process, and degrade DOM as it is
transported downstream. Photolysis, the process in which UV light interacts with organic
matter and catalyzes degradation and mineralization, is one of these processes.
Photolysis breaks down recalcitrant aromatic structures in DOM and increases
bioavailability to microbial communities (Wetzel et al., 1995a).
Photo-degradation of DOC can yield a variety of end-products, depending on the
sources and location of origin. Many studies have shown DOC to be photo-mineralized
to form DIC (especially CO2), but terrestrial DOC from a variety of wetland systems
across the United States has been proven to generate carbon monoxide as a byproduct
as well (Valentine and Zepp, 1993). In temperate lakes, significant production of DIC
from DOC has been shown with exposure to UV-B or shorter wavelengths (Granéli et
al., 1996). In the Arctic, photo-chemical oxidation or incomplete oxidation and export of
C is 70-95% higher than conversion of DOC to CO2. Some arctic lakes yield especially
high values of C photolysis with an average of 1.39 +- 0.06 Gg C year-1, in comparison
to Arctic streams yielding between 0.042 – 0.092 Gg C year-1 (Cory et al., 2014). There

25
is a wide variety of factors that affect the photochemistry of organic carbon, but there
are many other potential impacts to other nutrients.
Effects of UV-radiation on other elements found in DOM have not been as well
studied as UV effects on carbon. Increased availability of electron donors, which can be
catalyzed through photolytic processing of carbon, generally increases rates of
biogeochemical processes, such as mineralization of nitrogen and phosphorus
(Bridgham et al., 1998; Kadlec and Reddy, 2001). As organic phosphorus is mineralized
and transformed into orthophosphate, it is made bioavailable to vegetation for uptake
and assimilation into biomass. Mineralization of organic nitrogen into nitrate and
ammonia also increases N availability (Hogan et al., 2004). Therefore, photolysis of C
might have an indirect effect on nitrogen and phosphorus cycling.
Directly, a few studies have explored photo-degradation and photo-mineralization
of nitrogen compounds to yield forms of inorganic nitrogen, such as ammonium, nitrous
acid and nitrite (Bushaw et al., 1996; Stedmon et al., 2007; Stemmler et al., 2006; Vione
et al., 2006). Photo-ammonification is common in nature and might be one of the
primary sources of biologically available and assimilable nitrogen in high altitude lakes
and oceans. Ammonium can be generated from humic nitrogen compounds and made
biologically available to vegetation and microbial species (Bushaw et al., 1996). Nitrite
production from humic substances has been shown to be 40-188% higher after light
exposure and is positively correlated to the amount of humic substances present
(Kieber et al., 1999).
Very few studies have shown the effects of photo-degradation on phosphorus
species. One study proved that organic phosphorus can be photo-mineralized under

26
mercury lamp exposure, indicating a possibility of P photo-mineralization in the natural
environment (Armstrong et al., 1966). Another study used the addition of hydrogen
peroxide to UV light to photo-mineralize dissolved organic phosphorus to soluble
reactive phosphorus (SRP) (Sindelar et al., 2015). As nitrogen and phosphorus enter
water ways in unavailable organic forms, they add to the DOM pool. However, as these
nutrients become mineralized, they become available to a variety of vegetation,
including many algal species. Excess available nitrogen and phosphorus can decrease
water quality and harmful algal blooms (HAB) that negatively affect wetland health
(Anderson et al., 2002).
Aromatic structures are highly resistant to complete UV degradation/ photolysis
and mainly consist of CDOM (of which fDOM is a primary constituent) within the photo-
reactive dissolved organic matter pool. UV-B (280-320 nm) causes production of LMW
carbonyl compounds (formaldehyde, acetaldehyde, and a-keto acid glyoxylate) from
humic substances, which is termed photo-beaching (since the structure is not
completely degraded as in photolysis)(Kieber et al., 1990).
Saline water could affect photo-bleaching and degradation rates of DOM and
alter DOM photochemistry. UV reactions with halides can produce reactive oxygen
species and halogen species that affect DOM breakdown and halogenation of pollutants
(Yang and Pignatello, 2017). A study from 1966 found that exposing seawater to UV
light oxidized many carbon compounds, cleaved inorganic phosphate from organic
phosphorus compounds, and reduced nitrite, ammonia, and several other nitrogenous
compounds to nitrate if oxygen was present (Armstrong et al., 1966). There is also
evidence of increased absorbance photobleaching by up to 40% when chloride and

27
bromide ions are present (Grebel et al., 2009). Although some studies have evaluated
potential impacts of salt on DOM photochemical processing, further research is still
needed to gain a better understanding of these processes. Therefore, the fourth chapter
of this dissertation attempts to look at this processing from a few specific sources.
Data Gaps and Research Needs
Although many studies have already been conducted on hurricane impacts in
numerous locations around the globe, there is a lot of variability between hurricanes
based on intensity, proximity, and ecosystem characteristics (Caverly et al., 2013;
Dhillon and Inamdar, 2013; Paerl et al., 2018). There are few studies examining
biogeochemical properties of hurricane impact on north Florida systems that vary
considerably from those better studied in south Florida and North Carolina (Avery et al.,
2004a; Ensign and Paerl, 2006; Paerl et al., 2006; Xuan and Chang, 2014). Additionally,
a better understanding of hurricane impact along an aquatic continuums is needed to
understand the effects spanning across several ecotones, that vary considerably across
saline gradients from estuarine systems to freshwater rivers and marshes. Also, there
are many unanswered questions on how a hurricane (primarily low category) effects a
waterway in comparison to more common precipitation events. Furthermore, hurricane
alteration of salinity regimes is well-established, but the effects these salinity shifts have
on photochemical properties of organic matter has yet to be studied (Cai et al., 2013a;
O’Connell et al., 2014).
These gaps are addressed in this work through the following overarching
question; how do hurricanes affect dissolved organic matter cycling along aquatic
continuums from terrestrial environments to estuaries? I hypothesize that hurricanes

28
lead to changes in DOM cycling along the aquatic continuum that further affects the
abiotic, metabolic, and chemical characteristics of the waterway, and my primary
objective is to examine how hurricanes alter DOM cycling along a blackwater river-
estuary aquatic continuum through in situ water quality monitoring, water sampling,
statistical analysis, and experiments. Therefore, in order to address some of these
research gaps there are several questions, hypotheses, and objectives outlined in the
figure below (Fig. 1-2).
Storms can have many variable and complex effects on aquatic ecosystem
communities and dynamics. Although there are many possible hurricane and storm
topics and mechanisms to be studied, this work attempts to address a few. These topics
are based on hurricane impacts on water quality and chemistry of a blackwater river-
estuary complex, photo-chemical implications of hurricanes, and whether hurricanes are
more impactful to water quality and chemical processing than other storms. Although
these topics answer just a few questions of how hurricanes and storms impact
waterways, they are a small piece of the larger puzzle of how future changes in weather
patterns and hurricane frequency and intensity will affect aquatic ecosystems.
29
Figure 1-1. Diagram depicting an example of DOM cycling and degradation in wetland systems from photolytic and biotic processes. Boxes represent ways in which organic matter is processed and arrows represent the different ways in which DOM can be generated or transformed from other organic forms in the water column or within the soil. Adapted from Reddy and Delaune 2008.

30
Figure 1-2. Diagram developed at the beginning of the dissertation connecting the
chapters (yellow),hypotheses (green), and objectives (blue) addressed in this thesis. The first line is the overarching hypothesis and objective.

31
CHAPTER 2 IMPACTS OF HURRICANE DISTURBANCE ON WATER QUALITY ACROSS THE AQUATIC CONTINUUM OF A BLACK-WATER RIVER TO ESTUARY COMPLEX
As global temperatures continue to rise, tropical cyclone activity in the north
Atlantic has concomitantly increased over the past 50 years (Masson-Delmotte et al.,
2018). These storms have the power to substantially impact coastal ecosystems and
influence biogeochemical cycling and water quality (Bauer et al., 2013; Shiller et al.,
2012; Smith et al., 2009). During these storm events, high velocity winds transport
dissolved and particulate materials and affect water levels and salinity (Walker, 2001).
Intense rainfall associated with these storms increases runoff contributions to local
waterways resulting in elevated surface water discharge and causing significant loading
of organic matter (OM) and sediment to nearby streams and rivers (Mandal et al., 2016;
Torres et al., 2015). Long term effects that may be associated with these disturbances
can cause shifts in coastal ecosystems that both directly and indirectly affect ecosystem
resilience and function. For example, Hurricane Katrina caused widespread mortality of
coastal forests around the US Gulf Coast, damaging a reservoir of carbon that
represents 50-140% of the net annual US forest carbon sink (Chambers et al.,
2000).Furthermore, numerous factors contribute to an ecosystems recovery and
resilience including storm characteristics (angle and impact, intensity, surge, etc.) and
in-situ characteristics such as nutrient reserves, microbial dynamics, biotic controls and
ecosystem composition (Alongi, 2008; Radabaugh et al.). Disturbances in the
headwaters of the freshwater-to-marine aquatic continuum can have significant
ramifications to downstream portions of these ecosystems (Bouwman et al., 2013;
Vannote et al., 1980). Nutrients transported by stormwater runoff and physical effects
from storm damage in areas upstream will eventually influence areas downstream along

32
the flow path. Typically, freshwater originates from upland ecosystems and flows
downstream into larger order streams, rivers, and estuaries, where biological
communities replace one another to maintain levels of energy equilibria throughout the
length of the waterway (Vannote et al., 1980). As biological communities and terrestrial
and aquatic inputs change along the length of a river, OM composition and nutrient
abundance evolves (Bouwman et al., 2013). A variety of factors modulate OM and
nutrient abundance along the river continuum, with timing and magnitude of
precipitation and wind being the primary driver of material inputs from land to river
(Paerl et al., 2018; Ward et al., 2017) and hydrodynamics (e.g., flow rates and
turbulence) moderating rates of biological respiration (Ward et al., 2018). These
dynamics become more complex along the transition from river to estuary, where tides
drive frequent variability in water level, water chemistry, and terrestrial-aquatic linkages.
Thus, disturbances that impact one part of the aquatic continuum will likely affect the
rest of these complex interconnected systems.
The impact of hurricanes on water quality has been observed to be widespread
and have a sustained effect on the entire system post event (Dix et al., 2008; Miller et
al., 2016). Changes in salinity due to forcing from wind and precipitation can lead to
impacts such as osmotic stress and, potentially, the mortality of organisms that cannot
effectively osmoregulate (Foster et al., 2009). Increased suspended material, along
with dissolved organic matter (DOM), can increase turbidity and out-shade vegetation
leading to decreases in density of submerged aquatic vegetation (SAV) (Jin et al., 2011;
Xuan and Chang, 2014). Large nutrient fluxes can also cause harmful algal blooms that
affect vegetative, wildlife, and human health (Anderson et al., 2002; Boyer et al., 2009;

33
Bricker et al., 2008). The combination of environmental impacts of a particular storm are
not universal and depend largely on the magnitude and storm characteristics such as
where rainfall occurs (i.e. over land or water) and wind direction (Mitra et al., 2013;
Mullaugh et al., 2013).
During hurricane Irma (9/10/2017- 9/11/2017), high winds, several inches of
precipitation, and significant storm surge greatly affected the local environment. Large
amounts of rainfall and wind from the storm caused influxes of organic matter into
waterways and created shifts in local biogeochemical and ecosystem processes
(Cangialosi et al., 2017). Effects of previous hurricanes on local water quality has been
studied (Dix et al., 2008); however, high resolution measurements comparing a wide
range of parameters along a salinity gradient during a hurricane has not been well
documented. These salinity gradients exist as transition zones for coastal systems that
are greatly affected by climate change, sea level rise, and large scale disturbances such
as hurricanes (Gołębiewski et al., 2017; Sharpe and Baldwin, 2009). Thus, it is critical to
understand the effects of disturbance events on these transition zones to determine the
resilience of these systems.
The primary goal of this opportunistic study was to determine the overall effects
of Hurricane Irma on short-term water quality and biogeochemical cycling along a
salinity gradient in north-east Florida (USA) and determine the magnitude and duration
of storm induced deviations in water quality from normal (pre-storm) conditions. We
hypothesized that large scale disturbances due to extreme events such as hurricanes,
cause disruption of normal hydrological and biogeochemical conditions that may lead to
a hysteretic response that yields a short-term altered state that would persist for less

34
than a month. The resilience and original state of degradation of the system, as well as
the scale of the hurricane, should determine the time in which the ecosystem’s altered
state persists.
Methods and Materials
Study Site
Hurricane Irma originated as a tropical wave from the west coast of Africa that
quickly moved across the eastern Atlantic where it rapidly intensified. Hurricane Irma
reached category 5 status as it traveled through the Caribbean and maintained category
4 classification as it made landfall in Florida, affecting the entire state. Elevated wind
and rain from Hurricane Irma passed through St. Augustine, a coastal city in
northeastern Florida, on September 10th, 2017 to early the morning of September 11th,
2017. Winds reached a maximum speed of approximately 65 mph with 168 mm of
precipitation (Cangialosi et al., 2017). Even though the eye of the hurricane did not pass
directly through this area, this part of the state was still greatly affected by the storm
with a surge reaching 0.9 m – 1.5 m (Cangialosi et al., 2017).
This study was conducted along Pellicer Creek, a major tributary of the Matanzas
River within the Guana Tolomato Matanzas National Estuarine Research Reserve
(GTMNERR) in St. Augustine, Florida. Monitoring locations used in this study span the
aquatic continuum between a fresh black water river and an estuary. The estuarine
portion of the site is located between the Whitney Laboratory for Marine Biosciences
and the Princess Place State Park, and the blackwater river, Pellicer Creek, is located
within the Pellicer Creek Aquatic Preserve that flows through Faver Dykes State Park
and spans from Princess Place State Park and beyond the freshwater sites for this

35
study. The brackish piece of Pellicer Creek is represented as middle reaches (Fig. 2-1).
The estuarine portion of the study site can reach salinities as high as 40 psu, whereas
the farthest edge of the study site is primarily fresh water (0 psu, besides long drought
periods with low flows) and is designated by freshwater 1 and freshwater 2 sites.
Pellicer Creek is a major tributary of the Matanzas River. Bathymetry data collected in
April 2016 by the GTMNERR in Pellicer Creek’s middle reaches, displayed an average
depth of 1.7 m with a range from 1.3 m to 2.1 m. The Matanzas River at the estuary
location has an average depth of 1.5 m with a range from 0.8 m to 1.8 m. Average tidal
range at the middle reaches of Pellicer Creek was approximately 0.45 m with a range
from 0.35 to 0.55 m, and the average tidal range of the estuary site at the Matanzas
River was 0.55 m with a total range from 0.4 to 0.7. Since this data was only collected at
one time point, there might be more variability based on seasonality and storm events
(Marcum et al., 2016; unpublished). This region is characterized by southern USA
temperate climate with an average annual rainfall of 140 cm and a summer wet season
between June and September. Pellicer Creek experiences semidiurnal tides with an
average range of 0.6 m (Dix et al., 2008).
Short Duration High-resolution Water Quality Monitoring
Three multi-parameter sondes (YSI Exo-2) were deployed across the study site.
One was located in the estuary, another in the middle reaches between the estuary and
the freshwater river, and the third was located are approximately 10 miles inland from
the estuarine location (freshwater 1; Fig. 2-1). Each of the sondes were configured to
record data at 15-minute intervals. Sondes at the estuary and freshwater 1 sites, were
calibrated to established standards (Xylem, 2019), and were deployed before the storm
on September 7th. The YSI EXO 2 sonde within the estuary was near the top of the
36
water column on a floating dock (0.6 m), whereas the YSI EXO 2 sonde located at the
freshwater 1 site was attached to the bottom of the riverbed due to lack of other
attachment surfaces (1.1 m deep). At the middle reaches site a YSI 6600 sonde (owned
by the GTM- NERR) is semi-permanently installed near the top of the water column (0.5
m) on a floating dock and continuously collects data that is posted publicly on the
Surface water monitoring program (SWMP) NERR site (https://cdmo.baruch.sc.edu).
Additional meteorological data, including precipitation data, is collected and available on
the same site. All three sondes had the ability to log temperature, conductivity, salinity,
pH (although data at the estuary location is unavailable due to probe malfunction), and
dissolved oxygen (DO). The sonde located in the middle reaches additionally measures
relative depth, and the two EXO 2 sondes (estuary and freshwater 1 sites) also logged
total Chlorophyll-a (Chl-a), blue-green algae, turbidity, total dissolved solids, and
fluorescent dissolved organic matter (fDOM). Interference from high turbidity
concentrations has been shown to cause issues with chlorophyll and fDOM
measurement accuracy, but EXO instruments have an error of only 0.5 µgL-1 chlorophyll
interference at 100 NTU as opposed to the older instruments that were 3 µgL-1 at 100
NTU (Xylem, 2012). Therefore, it is assumed that interference was minimal (9/11/2017).
Data download was conducted manually from the sondes at the estuary and
freshwater 1 sites on September 22nd, however the freshwater 1 sonde malfunctioned
and only logged data from September 7th to September 12th. The estuary sonde
collected data from before the storm (September 7th- September 10th), during the storm
(September 10th 8 p.m. E.T.- September 11th 1 a.m. E.T.), and after the storm until the
sonde was removed from the waterway (September 11th- September 22nd). Surface

37
water discharge data was downloaded for the middle reaches and is posted publicly on
the United States Geological Survey’s national water information system website (Fig.
A-1; unpublished data).
Long Duration Monitoring of Carbon, Phosphorus, and Metals
Over a period of three months, every 2-3 days initially post-storm and then
weekly for the remainder of the study, water samples were collected at four sites across
the study site, including the estuary, tidal creek, freshwater 1, and freshwater 2 sites
(Fig. 2-1). Water samples were not able to be collected near the middle reaches of the
site due to park and road closings for several months post-hurricane. Grab samples
were taken by hand in high-density polyethylene 1 L bottles pH and salinity were
measured, then filtered with 0.45 µm filters, acidified, subsampled, and frozen until
analysis. Samples were analyzed for DOC on a Shimadzu TOC-L Total Organic Carbon
Analyzer (Colombia, MD, USA). Phosphorus was analyzed on a Hach DR 6000
spectrophotometer (Loveland, CO, USA) following EPA method 365.3. Subsamples
from the estuary site and freshwater 1 were sent to the University of Florida Analytical
Research Laboratories (Gainesville, FL) for total dissolved cadmium, copper, iron,
molybdenum, lead, and zinc analyses on a Perkin Elmer Optima 5300 inductively
coupled plasma spectrophotometer (Perkin Elmer Inc., Akron, Ohio, USA). It should
also be noted that at the beginning of October, during the duration of monitoring, a
nor’easter event (storm with north-easterly wind occurring on the east coast of North
America) passed through the study site.
Statistical Analysis
Graphical comparisons of salinity with meteorological data, salinity values across
locations, turbidity vs. Chl-a at the estuary location, and fDOM at the estuary and
38
freshwater 1 location were conducted to initially visualize data trends. Some data did
not meet the assumptions of linearity or normality to utilize a linear regression, therefore
Spearman correlations were employed to evaluate these relationships on a subset of
well-correlated parameters from before, during, and after the hurricane (Table 2-1).
Parameters used in this analysis included salinity vs. DO for estuary and middle
reaches sites, fDOM vs. salinity at the estuary site, and salinity vs. pH at the middle
reaches site. The freshwater 1 sonde also malfunctioned the day after the hurricane and
therefore did not record enough observations to make statistically valid comparisons of
characteristics from before and during the storm to after the storm had passed.
Principal component analysis (PCA; ‘factoextra’ R-library) was used to compare
salinity, DO, temperature, and turbidity collected at all three sites by data sondes.
Principle components analysis (PCA) was performed to determine how closely the
parameters were related at these three sonde locations.
Data for salinity, pH, total dissolved phosphorus, total dissolved iron, and dissolved
organic carbon collected and measured from water samples were normalized for T= 0
and graphed to display changes from the original state over time in Microsoft Excel (Fig.
2-9).
Additionally, a Spearman’s rank correlation was performed between fDOM and
DOC data in R package “ggpubr” collected on January 22nd, 2018 at 20 locations at both
high and low tide across the study site in order to assess how fDOM relative fluorescence
relates to DOC within this system. This relationship can be used to link fDOM to DOC
(and indirectly DOM) concentrations during sonde deployments since water sampling was
not possible at the same interval as the sonde measurements (Fig. 2-10). Even though

39
fDOM is only a small fraction of total DOM, fDOM is used as a proxy for the changes in
DOM concentrations within the study site since it was not possible to measure total DOM
continuously on the same timescale.
Statistical operations were performed with R© (Ver 3.1.2, R Foundation for
Statistical Computing, Vienna Austria), and unless otherwise stated all statistical
operations were performed using the base R library. The critical level of significance
was set at α = 0.05.
Results
Short-term Water Quality Monitoring of Hurricane Response (St. Augustine)
Under normal ambient pre- hurricane conditions (measured September 7th- 10th),
salinity values in the middle reaches fluctuated with daily tidal cycles. These cycles
have a wide seasonal range, 10-30 psu during high tide and 0-20 psu at low tide.
However, during Hurricane Irma, salinity levels peaked as wind speeds reached
approximately 31 m s-1 (65 mph; Fig. 2-2), then decreased rapidly as total precipitation
reached a peak of approximately 24 mm in one hour. For approximately five days after
the storm, salinity levels in the middle reaches remained close to 0 psu and then slowly
began to return to pre-storm levels (approximately 0-20 psu range) by day 10 post-
storm. At the estuary, salinity levels also declined by 10-20 psu after Hurricane Irma, but
daily fluctuations in salinity show that tidal cycling still affected salinity in this area (Fig.
2-3). Lower salinity levels than pre-hurricane levels (predominately < 30 psu) were also
still observed at this location for several weeks after the hurricane. The freshwater 1
sonde (15 km inland) salinity remained constant at 0.1 psu except at the storm’s peak
where concentrations rose to 2 psu, indicating some saline intrusion into freshwater
reaches of the creek.

40
Turbidity levels began increasing during the hurricane, peaked immediately after
it passed, and remained elevated for approximately two days after the hurricane made
landfall in the St. Augustine area (Fig. 2-4). Chl-a levels decreased substantially just
prior to the storm and steadily increased after the storm once turbidity levels began to
drop. However, turbidity and Chl-a were not significantly correlated ( rs = -0.07, P > 0.05)
suggesting that other factors such as pulses of nutrients during and/or after the storm
enhanced aquatic primary production.
Fluorescent DOM values measured at freshwater 1 increased marginally during
the hurricane until the sonde malfunctioned after 5 days (Fig. 2-5). In the estuary, fDOM
values were affected widely by tidal cycles and were much lower before and during the
storm but increased greatly after the hurricane from 100 quinine sulfate units (QSU) to
almost 200 QSU. During high tide, fDOM values were much lower than at low tide when
high concentrations of fDOM were being carried into the area by freshwater pulses from
upstream.
Dissolved oxygen ranges varied widely across the three sites. DO concentrations
were highest at all the estuary and middle reaches sites before the storm, whereas
concentrations increased during the storm until the sonde malfunctioned at the
freshwater 1 site (Fig. 2-6). DO within the estuary ranged from 70% to 100% pre-storm,
then displayed a wider range of concentrations post-storm yielding concentrations as
low as 30% and as high as 100%. DO ranged from 40%-90% pre-storm in the middle
reaches of the site but decreased steadily post-storm to concentrations remaining below
50% for the duration of the study. Temporary hypoxia from DO concentrations as low as
6.9% were seen one week after hurricane Irma. DO concentrations at the freshwater 1

41
site ranged from 30%- 60% in the few days before instrument malfunction and peaked
at 61% as the storm passed through the site. These measurements appear to be tidally
influenced and therefore additionally vary based on the daily tidal cycle.
Salinity and DO were highly correlated at various points pre- and post- storm at
estuary and middle reaches locations (Fig. 2-7). Pre-storm middle reaches DO values
were above 40% saturation, and salinity had a wide variability, most likely due to
location within the waterway (rs =0.875, P < 0.001; Table 2-1). A strong positive
relationship was noted between % DO and salinity (rs =0.833, P < 0.001). After the
storm, DO concentrations decreased from 40-90% saturation range to 5-60% saturation
range and salinity decreased from a range of 0- 20 psu to a stable 0 psu (rs =-0.260, P <
0.001). In the estuary, DO and salinity values were concentrated in the high ranges for
both parameters before the storm, exhibiting a weak positive correlation ( rs =0.323, P <
0.001). Within the estuary, DO and salinity were positively correlated during the
hurricane ( rs =0.980, P < 0.001), and remained positively correlated after the storm ( rs
=0.941, P < 0.001). Parameters at freshwater 1 were not compared due to a sonde
malfunction post-storm.
Salinity and pH had distinctive trends and were compared for pre-storm, during
storm, and post-storm correlation (Fig. 2-7D). Salinity and pH were compared in middle
reaches only (due to probe malfunction at the estuary) and positively correlated before
and during the hurricane (before rs=0.988, P < 0.001; during rs=0.952, P < 0.001). Post-
storm, a decrease in pH and salinity reduced the range of values and decreased the
correlation coefficient to rs=0.869, P < 0.001. Salinity and fDOM were compared in the
estuary and displayed a highly negative correlation (rs=-0.845, P < 0.001). Significant

42
correlations of both parameters during and after Hurricane Irma exhibited a negative
trend of rs=-0.984, P < 0.001 and rs=-0.955, P < 0.001 during and after the storm.
Principal component analysis of study site sonde data indicated varying
relationships between salinity, DO, temperature, and turbidity at Estuary, Middle
Reaches, and Freshwater 1 locations (Fig. 2-8). PCA yielded 4 components and the plot
generated illustrates that most of the variability is within the first two principal
components that explain 61.7% and 27.6% of the variability. Other principal
components each explain less than 10% of the overall variability. Overlap of the middle
reaches and estuary components indicate some commonality among sites, whereas the
freshwater 1 site appears to be unique and does not share commonalities with the other
two locations.
Long-term (3 month) Monitoring of Dissolved Carbon, Phosphorus, and Metals
Normalized salinity and pH values collected from water samples across the study
site showed large differences over time (Fig. 2-9A & 2-B). Salinity from the estuary and
tidal creek sites (only locations where sal >0 psu), decreased initially and fluctuated
across time from pre-storm conditions until returning to approximately pre-storm
conditions 60 days after Hurricane Irma’s passage. pH fluctuated initially in the estuary,
tidal creek, and freshwater 1 sites, but returned to pre-storm conditions after
approximately 40 days. The freshwater 2 site showed a different trend and increased
over time across the entire length of the study.
Total dissolved phosphorus concentrations were measured at the four sites every
2-3 days in the week post-storm and weekly for the next approximately 3 months, but
only data from the freshwater sites showed concentrations above the 0.02 mg L-1
detection limit and are shown in figure 2-9 (Fig. 2-9C; Table 2-2). Measurable values

43
were collected at the freshwater 1 site on 9/7 (pre-hurricane), 9/16, 9/18, 9/21, 9/28, and
10/12 (just over one-month post-Irma). Concentrations ranged between 0.15 and 0.3
mg L-1. Freshwater 2 site did not display any measurable concentrations until November
(pre-storm sample was not taken at this site) but ranged from 0.2-0.4 mg L-1 for three
measurements between 11/2 and 11/16.
Total cadmium, copper, iron, molybdenum, lead, and zinc were measured at the
estuary and freshwater 1 sites due to funding limitations during the three-month
sampling period. Iron was the only metal yielding any measurable values above the
minimum detection limit at the freshwater 1 site and showed variability in concentrations
over time ranging from approximately 0.5 to 1.6 mg L-1 (Table A-1; Fig. 2-9D). Iron
concentrations returned to pre-hurricane conditions approximately 1-week post-
hurricane, then decreased again to below the minimum detection limit after the
nor’easter event for approximately 1 week before returning to pre-hurricane
concentrations again (Table 2-2). Iron concentrations decreased again at the end of the
study period even though there were not any large storm events during this period.
Carbon concentrations fluctuated over the nearly three-month period of
monitoring (Fig.2-9E). Pre-storm concentrations were nearly 60 mg L-1 at the freshwater
1 site (freshwater 2 not measured this day) and approximately 1 mg L-1 in the estuary
and tidal creek sites (Fig. A-2). By 9/13/2017 (2 days post-hurricane) the freshwater 1
site had a value of nearly half its pre-storm conditions (32.7 mg L-1), although the
freshwater 2 site DOC was nearly 65 mg L-1. The estuary and tidal creek DOC
concentrations increased by at least 15 times were between 15-20 mg L-1 DOC at this
time period. The estuary and tidal creek sites reached the maximum measured DOC

44
concentrations by 9/16/2017 (approximately 5 days post-hurricane) at 18 mg L-1 and 43
mg L-1. DOC concentrations rebounded back up to 60-70 mg L-1 in the freshwater sites
by 9/22/2017 (approximately 11 days post-storm) as the estuary and tidal creek sites
DOC decreased below 10 mg L-1. The estuary and tidal creek sites did not fully return
to normal concentrations before a nor’easter affected the study site the first week in
October, causing enough precipitation to increase water discharge levels to 8 x10⁶ m3 d-
1, even though only 6 x10⁶ m3 d-1 was actually measured during Hurricane Irma (Fig. A-
1). The nor’easter also caused freshwater 1 site concentrations to decrease to 30 mg L-
1 DOC and the freshwater 2 site to 45 mg L-1 DOC. The nor’easter event likely
prolonged the length of time required for the system to return to pre-hurricane
conditions and the last measurements taken in November yielded concentrations
around 4 mg L-1 at the estuary and tidal creek sites and concentrations 25-30 mg L-1 at
the two freshwater sites.
As expected, fDOM and DOC concentration are strongly correlated with a
moderate ρ value observed during this study (Fig. 2-10; ρ = 0.69, p = 7e-07). During
pre-hurricane, modeled DOC concentrations range from approximately 0 to 60 mg L-1
and post hurricane concentrations were an order of magnitude higher and remained
high post-Hurricane in the estuary. Meanwhile modeled DOC concentrations and fDOM
values continued to increase post hurricane at the freshwater 1 site (Fig 2-5).
Discussion
Biogeochemical Responses to Hurricane Irma
Salinity and changes in DO concentrations were the primary water quality factors
affected during and immediately after Hurricane Irma which are presumably driven by
storm surge, freshwater flushing, wind driven aeration and biological oxygen demand.

45
Hurricanes can have profound effects on ecosystem characteristics and structure. In the
late 1990s in Pamlico Sound, North Carolina (USA) a hurricane caused the estuarine
residence time to decrease from 1 year to 2 months and salinity to drop by 70%, driven
by extremely high discharge volumes from the rivers and stream entering the sound
(Paerl et al., 2006; Pietrafesa et al., 1986). Although instrumentation was not available
at the time of this storm, increased discharge by an order of magnitude relative to
baseflow conditions resulted in decreased salinity by as much as 14 times. This same
hurricane dynamic was evident in the Pellicer Creek/Matanzas estuary post hurricane-
Irma whereby large amounts of freshwater discharge resulted in increased DOM
abundance decreased DO concentrations.
Additionally, flushing causes a pulse of DOM during storms that represents rapid
mobilization of organic material from the terrestrial landscape and adjoining aquatic
habitats, and in some cases these rapid events may shunt DOM to downstream
reaches of the ecosystem with little alteration or change in chemical structure, a
phenomenon described as the pulse-shunt concept (Raymond et al., 2016). However,
abrupt DOM loading can also result in depressed DO concentrations from increasing
biological oxygen demand, which has been observed during prior large storms including
Hurricanes Hugo and Charley (Mallin and Corbett, 2006; Tilmint et al., 1994; Tomasko
et al., 2006).
Prolonged discharge levels effecting nutrient transport and salinity can also alter
phosphorus concentrations within the water column. One study in the Neuse River
Estuary in North Carolina observed that during tropical storms with high precipitation,
total phosphorus loads increased by 25.7% (Paerl et al., 2018). P concentrations

46
remained below the limit of detection at the estuarine site, and unlike the Neuse River
study increases in P loads were not observed downstream in our study presumably due
to uptake, dilution, binding, or flocculation from increases in salinity during transport
downstream (Julian and Osborne, 2018). Reducing species of OM through redox
reactions can also cause binding of phosphate and ammonium with DOC that could
have been caused by decreasing oxygen levels (Peter et al. 2016). Reoxygenation of
the water column post-hurricane, mass transport of nutrients due to increases in rainfall-
runoff and delayed mortality and decomposition of organic matter could have caused a
delayed release of nutrients into the water column, resulting in mass algal uptake of
these released nutrients and a delayed algal response to the hurricane, causing a steep
rise in Chl-a concentration one week post-storm (Bricker et al. 2008; Stratham 2012).
During this study, total dissolved phosphorus (TDP) concentrations were below the
detection limit at the estuary site despite relatively higher concentrations observed at
upstream freshwater sites (Table 2-2). This gradient of P is the result of an integrated
function between availability, demand, recycling and transport. In stream ecology, this
function was coined nutrient spiraling where during transport downstream nutrients are
taken-up, assimilated and recycled (Webster et al., 2016; Webster and Patten, 1979).
Changes in factors that contribute to nutrient spiraling (i.e. biotic uptake, export and
velocity) can influence an ecosystems ability to process and retain nutrients resulting in
pulses of nutrients from the freshwater reaches of the system to the downstream
estuary. This potentially flushes nutrients, such as phosphorus, and temporarily high
algal loads out of the estuary relatively quickly (Fig. A-1).

47
Moreover, as nutrients rapidly flow downstream forcing conditions to shift to a
reduced redox state, iron availability and cycling can be significantly altered. In oxidizing
(aerobic) environments, iron can be tightly bound to DOC. However, under anaerobic
conditions, iron becomes reduced and DOC can flux into the water column (Riedel et
al., 2013). Pyrite formation is also possible under these conditions where iron could be
readily scavenged from the water column as it is being reduced (Julian et al., 2017). In
this study anoxic conditions persisted post-hurricane for two-weeks it is likely that
anoxic conditions occurred in the middle (and likely upper-reaches) of the study area as
DO decreased to levels as low at 5%.). Iron concentrations mostly measuring above 1.5
mg L-1 within the water column in the freshwater 1 site in the month post-hurricane may
be indicative of this type of reaction. Meanwhile, iron concentrations were below the
minimum detection limit (0.05 mg L-1; Table A-1) in the estuarine environment, indicating
the possibility of rebinding to DOC as it was oxidized by new aerobic waters entering
the system through tidal flushing, burial due to pyrite formation or, alternatively, due to
flocculation of both species with OM as a result of changes in salinity (Julian and
Osborne, 2018).
Carbon dynamics during and after a hurricane can be complex as normally
passive channels of transfer from land to ocean become very active (Bauer et al., 2013;
Bauer and Bianchi, 2011; Cole et al., 2007). Storm events cause both a peak in
discharge volume from tributaries but also a peak in DOC (and DOM) loads with levels
remaining elevated for several weeks post-disturbance as terrestrial and wetland
systems slowly drain in to larger water conveyance systems (Majidzadeh et al., 2017).
Increased DOC downstream post-storm from flushing upstream was caused by large

48
increases in sheet flow and soil infiltration that funneled a large portion of carbon into
the estuary. These dynamics observed in the Pellicer Creek/Matanzas Estuary during
Hurricane Irma further supports the importance of the pulse-shunt concept within this
system (Osburn et al., 2012; Raymond and Al, 2016; Schlesinger, 2005). The high
freshwater post-storm runoff from upstream in response to prolonged and abundant
rainfall pre- and during hurricane landfall (Fig. A-1) carrying with it a significant DOC
pulse across the study area persisting for several days (months) post hurricane. The
discharge from middle reaches post-storm continued for approximately 50-days until
returning to pre-storm discharge (Fig. A-1; unpublished data, United State Geologic
Survey) and contributed to a prolonged load of DOC to the estuary. However, the
nor’easter event at the beginning of October that caused a second peak in discharge
prolonged this increased loading. Increases in river DOM concentrations due to storms
both small and large are well-documented, and in some cases can contribute to over
90% of the annual flux of DOC from a system (Raymond and Saiers, 2010). In the case
of normal weather patterns, DOC levels typically return to baseline conditions shortly
after discharge recedes (Ward et al., 2012). However, unlike our observations after
Hurricane Irma where after three months DOC concentrations at freshwater sites had
not yet fully returned to pre-storm levels. Dilution and large flushing events might have
transported large portions of DOC from the upper reaches to downstream locations, so
it is possible that the system takes longer than 3 months to rebuild to previous
concentrations (Paerl et al., 2018).
Relationships between salinity, fDOM, and pH displayed high but variable levels
of correlation across time (Fig. 2-7A, B, & C). Salinity and pH in the middle reaches

49
showed a decreased level of correlation post-storm due to higher variability in DOM and
reduced buffering by seawater, both well-known drivers of pH (Strawn et al. 2015;
Reddy and Delaune 2008). The relationships of fDOM, salinity, and pH observed in the
downstream estuary and marine ecosystems are in-part influenced by the upstream
system. The upstream ecosystem, a blackwater creek, has a high level of connectivity
with its terrestrial components and associated wetlands, which contribute to its
characteristics (i.e. high fDOM load and turbidity). This connectivity facilitates the free
exchange of OM between the creek and wetlands and smaller (tributary) creeks within
the watershed. Normally, the OM is delivered along the river continuum either slowly as
the creek flows or in short pulses in response to rain events (Bauer and Bianchi, 2011;
Raymond et al., 2016). Under normal conditions, given the creeks length and
hydrodynamics, the residence time of the creek allows for this OM (and associated
nutrients) to be utilized as it moves along the river continuum. However large scale
disturbances such as prolonged rain events and intense tropical activity effectively
elongate the continuum and temporarily extend the freshwater portion of the river
continuum into the estuary and marine portion, thereby influencing local biogeochemical
cycles (OM degradation, nutrient availability, etc.), biotic interaction (i.e. oyster health,
fish kills, etc.) and ecosystem condition (i.e. hypoxia, algal blooms, etc.) resulting in an
altered stable or otherwise state. Therefore, largescale disturbances such as Hurricane
Irma ultimately punctuate how the system functions in the context of the river
continuum, ecosystem resilience to disturbance and ecosystems resistance to change.
Implications on Ecosystem Resilience
Hurricane Irma’s impact on several key water quality characteristics did not only
affect biogeochemical cycling but may have similarly affected organism survival and

50
health. Depressed DO levels post-Hurricane may prolong anoxic and hypoxic conditions
leading to widespread fish kills (Burkholder et al., 1999; Mallin and Corbett, 2006b).
Oysters and various other aquatic organisms that can be sensitive to DO concentrations
live across a large portion of the study site and are adapted to some salinity and DO
fluctuations from daily tidal cycles, however even short-term hypoxia can have
devastating effects on estuarine organisms (Sui et al., 2016). Further, the harmful
effects of hypoxia are compounded by other disturbances such as acidification (Gobler
et al., 2014), which also occurred during/after Hurricane Irma. In the months following
Hurricane Irma, changes in oyster populations in the mid and lower reaches of Pellicer
Creek estuary were observed and have been attributed to the extensive freshwater
inputs and low oxygen conditions following the disturbance (Osborne, personal
communication).
The observed spatial and temporal correlations of salinity and DO during this
study are important with respect to the ecosystem’s resistance and resilience to
disturbance (Fig. 2-7A & Fig. 2-7C, Table 2-1). The DO-salinity relationship observed
here could serve as an indicator of ecosystem resilience with respect to large-scale
disturbances as observed with Hurricane Irma. It is expected in a resilient, more flexible
ecosystem that the shape of the DO-Salinity curve post-disturbance would return to pre-
disturbance conditions (hysteretic response), the pre-storm stable state. This hysteretic
response and return to stable state is often linked back to ecosystem health, ecosystem
resistance and resilience to disturbance (Odum, 1985). If a system does not experience
this return, it may be less resilient and resistant and more likely remain in an altered
stable state. When comparing the middle reaches and estuary locations (Fig. 2-7), the
51
lower end of the river continuum, it appears that the estuary hysterectically returns to its
prior stable state, whereas middle reaches returns to an altered condition. Given the
volume of freshwater, prolonged period of low-DO concentrations, physical system
alteration by the hurricane, and potential impacts due to eutrophication and sea-level
rise, it is possible that the brackish middle reaches of the river continuum in this system
is in a new stable (possibly temporarily degraded) state. Data collected from water
samples further supports this statement, showing most measurable parameters,
including DOC and pH, return to pre-hurricane conditions by the end of the study period
in the estuary and tidal creek sites (Fig. 2-9). However, conditions in the freshwater
sites showed a differences in iron, pH (differences seen only in freshwater 2 site), DOC
at the end of the study period that varied from pre-hurricane conditions. Since the
freshwater 2 site is located near the headwaters of a forested blackwater river, pH is
usually lower in this location than at the other sites. However, the increase in pH during
the study may indicate a large flushing of organic matter from the freshwater 2 site that
usually keeps this pH acidic. This indicates a difference in system resiliency across the
site, freshwater sites with little tidal influence and daily fluctuation are taking much
longer to return to the pre-storm conditions than the estuarine sites that are prone to
large daily fluctuations.
Possibly, resiliency across the study site might also be related to the vegetation
transition from salt-tolerant to freshwater species. The study site is surrounded by living
shorelines that transition from mangrove habitat within the estuarine environment to
saltmarsh and Juncus roemerianus dominated systems and finally freshwater species
(Cladium jamaicense, Taxodium distichum, etc.) in its upper reaches. Living shorelines,

52
but mainly saltmarsh and mangrove habitats, have been shown to assist with
ecosystem resilience during previous hurricanes and could help protect this ecosystem
as well as the other NERR sites from large ecosystem shifts (Montgomery et al., 2019;
Smith et al., 2018). However, the impact of increased storm frequency on these
ecosystems is still unknown and could add to future shifts in nutrient cycling and water
quality, which requires more long-term monitoring with detailed measurements
immediately before, during, and after the storm to determine the outlook for these
ecosystems in the future.
In conclusion, water chemistry in the form of salinity, dissolved oxygen, DOM,
and other constituents were temporarily disturbed across the aquatic continuum during
Hurricane Irma. All measured parameters across locations affected one another as
rapid changes occurred during the storm and some persisted for multiple weeks post-
storm. Although not explored in this study, there are potential longer-term ecological
repercussions from these rapid water quality changes from hurricane events that can
affect ecosystem health and resilience, and those consequences need to be further
examined to determine the potential implications of increased tropical storm intensity or
frequency that may occur in the future.

53
Table 2-1. Correlations compared before, during, and after Hurricane Irma as well as overall for the chosen parameters. ρ values above (+ or -) 0.9 are in bold and representative of relatively high levels of correlation, and values between (+ or -) 0.8 and 0.9 are italicized to show intermediate levels of correlation. P values are in parentheses.
Location Parameters Before Irma During Irma After Irma
Estuary DO vs. salinity 0.323 (<0.01)
0.980 (<0.01)
0.941 (<0.01)
Estuary fDOM vs. Salinity -0.845 (<0.01)
-0.984 (<0.01)
-0.955 (<0.01)
Mid. Reaches DO vs salinity 0.875 (<0.01)
0.833 (<0.01)
-0.260 (<0.01)
Mid. Reaches pH vs. Salinity 0.988 (<0.01)
0.952 (<0.01)
0.869 (<0.01)
Table 2-2. Total dissolved phosphorus (TDP) and total dissolved iron (TDFe)
concentrations from collected water samples that yielded values above the minimum limit of detection. Although other time points yielded dissolved organic carbon (DOC) values above the minimum detection limit, measurements from the specific dates where TDP and TDFe was measurable was included as a reference.
Site Date Collected TDP (mg L-1)
TDFe (mg L-1)
DOC (mg L-1)
Freshwater 1
9/7/2017 0.153 1.49 59.73
9/16/2017 0.189 0.81 51.1
9/18/2017 0.289 1.57 60.12
9/21/2017 0.231 1.71 60.32
9/28/2017 0.153 1.52 49.65
10/12/2017 0.290 0.81 33.3
10/19/2017 0.021 1.08 42.18
10/26/2017 0.021 1.17 38.76
11/2/2017 0.021 0.54 40.16
11/9/2017 0.0021 0.67 36.5
Freshwater 2
11/2/2017 0.206 --- 44.34
11/9/2017 0.392 --- 36.02
11/16/2017 0.194 --- 25.74 1 Value reported as less than the minimum detection limit (MDL), therefore data were set to the MDL for analysis purposes.

54
Figure 2-1. Map of three locations where YSI data sondes were placed along the study
site located in St. Augustine, FL (grey circles). Estuary location within the Intracoastal Estuary, middle reaches in Pellicer Creek black-water river that is impacted by daily tidal cycles, and freshwater 1 is located in the headwaters of Pellicer Creek where salinity drops to 0 psu. Water samples from longer-term sampling were collected at the estuary, tidal creek, freshwater 1, and freshwater 2 sites (black triangles). The span of the study site from the estuary to freshwater 2 is approximately 15 km in length when following the waterway. The nearest inlet between the estuary and the Atlantic Ocean is approximately 4.5 km south.

55
A
B Figure 2-2. Wind speed (A) and precipitation (B) measurements taken during the month
of September at the middle reaches site and the effects on salinity concentrations within the study site. The spike in precipitation and wind speed indicates the time of impact from Hurricane Irma on the study site

56
Figure 2-3. Salinity graph showing fluctuations at the three sonde locations for before,
during, and after Hurricane Irma. Salinity values within the estuary (black line), middle reaches (dashed grey line), and freshwater 1 (solid grey line) two days before Irma, during the storm (grey bar) and 1 week after the hurricane had passed.

57
Figure 2-4. Turbidity and Chlorophyll-a measurements taken at the estuary sonde
location during the storm. Chlorophyll data collected between the apex of the storm on 9/10/17 and 9/12/17 might be inaccurate due to potential interference from high turbidity levels.

58
Figure 2-5. fDOM concentrations at the estuary and freshwater 1 sonde locations. The
sonde located at the freshwater 1 site malfunctioned after the storm, so only 4 days of data were successfully recorded.

59
Figure 2-6. Measured fluctuations in dissolved oxygen across the study site. The
estuary and middle reaches sites data spans from 3 days before to approximately 10 days after Hurricane Irma. DO data from the freshwater 1 site is shown for the first few days of deployment before the sonde malfunctioned post-storm.

60
A B
C D
Figure 2-7 Correlations from before (black circle), during (blue triangle), and after (grey +) Hurricane Irma compared for a series of parameters: A) dissolved oxygen and salinity within the estuary B) fDOM and salinity at the estuary C) dissolved oxygen and salinity in the middle reaches D) pH and salinity in the middle reaches. This data was collected by YSI data sondes from September
7th to September 22
nd, 2017. *Hurricane Irma affected the study area between
September 10th and 11
th, 2017

61
Figure 2-8. PCA biplot depicting the amount of correlation amongst water quality
parameters salinity, DO, temperature, and turbidity during Hurricane Irma at the estuary (blue), freshwater 1(pink), and middle reaches (green) sonde sites.

62
A B
C D
E Figure 2-9. Measured concentrations for changes in A) salinity, B) pH, C) total
dissolved phosphorus, D) total dissolved iron, and E) dissolved organic carbon at estuary, tidal creek, freshwater 1, and freshwater 2 locations from initial c concentrations (collected on 9/7/2017). All values have been normalized to time point 0 values to display the differences from initial conditions over time. Salinity was 0 psu across all measured time points at freshwater 1 and 2 sites, and total dissolved phosphorus and iron concentrations were below the minimum detection limit at the estuary and tidal creek locations. Hurricane Irma passed through the study site 3 on day 3 of the study.

63
Figure 2-10. Measured concentrations for changes in A) salinity, B) pH, C) total
dissolved phosphorus, D) total dissolved iron, and E) dissolved organic carbon at estuary, tidal creek, freshwater 1, and freshwater 2 locations from initial concentrations (collected on 9/7/2017). All values have been normalized to time point 0 values to display the differences from initial conditions over time. Salinity was 0 psu across all measured time points at freshwater 1 and 2 sites, and total dissolved phosphorus and iron concentrations were below the minimum detection limit at the estuary and tidal creek locations. Hurricane Irma passed through the study site 3 on day 3 of the study.

64
CHAPTER 3 IMPACTS OF HURRICANES ON NUTRIENT EXPORT AND ECOSYSTEM
METABOLISM IN A BLACKWATER RIVER ESTUARY
Storms are natural disturbances that affect human and natural systems and can
disrupt or alter ecological and biogeochemical processes (Carey et al., 2014; Edmiston
et al., 2008; Morton and Barras, 2011; Xi et al., 2019). Hurricanes or typhoons (term
used in the northwest Pacific) are the storms believed to cause the largest disruptions to
the environment in the areas where they occur, and hurricane frequency and intensity
are predicted to increase as the planet continues to warm in the future (Emanuel,
2005a; Masson-Delmotte et al., 2018). However, in subtropical systems prone to
hurricanes, thunderstorms (and nor’easters in the Atlantic) are also common and can
generate high levels of precipitation.
Precipitation is a major driving factor in transport of organic matter, primarily
through runoff, but also minimally from atmospheric deposition (Dhillon and Inamdar,
2013; Felix et al., 2015; Iavorivska et al., 2017; Li et al., 2016; Majidzadeh et al., 2017;
Zhang et al., 2009). Therefore, storm events greatly aid in transporting organic matter
from terrestrial environments into wetlands and waterways where OM is processed and
pushed further downstream through the river continuum. The river continuum concept
states that terrestrial uplands are connected to waterways through the transport of
organic matter, and within waterways is a series of shredders, grazers, collectors,
predators, and microbes that process organic matter as it is moved downstream
(Vannote et al., 1980). Movement of organic matter from upstream to downstream can
also be labeled export.
Export of organic matter is influenced by a variety of factors, including hydrology
and storm events (Chen et al., 2019; Raymond and Saiers, 2010; Villa et al., 2014).

65
Albeit storms are short-term disturbances, storm events can be responsible for the
largest percentage of organic matter export. A study of dissolved organic carbon (DOC)
export from forested watersheds determined that events (including both storms and
snowmelt) transported 86% of all DOC in 30 watersheds across eight U.S. states
(Raymond and Saiers, 2010). Furthermore, hurricanes generating high precipitation
were predominantly responsible for moving allochthonous material from inland
watersheds and waterways into the Neuse River Estuary and Pamlico Sound in North
Carolina over the past 20 years (Paerl et al., 2018). In addition, in 4 out of 10 study sites
in a five state study across Alabama, Mississippi, Tennessee, Georgia, and South
Carolina (U.S.), discharge driven by Hurricanes Harvey and Irma was responsible for
mobilizing 98% of monthly carbon and nutrients within only a 4-5 day period (Chen et
al., 2019). These massive exports of organic matter powered by short sporadic events
can have wider reaching effects that go beyond chemical transport and effect
ecosystem metabolic characteristics.
Ecosystem metabolism is an indicator of biological function, which is an
assessment of energy processing by all organisms within that ecosystem. Ecosystem
metabolism is a balance between community respiration and gross primary production
(Odum, 1956). In a stable ecosystem, net ecosystem metabolism (NEM) is
approximately 0, but in a stressed or unbalanced ecosystem, either community
respiration (Rt) or gross primary production (Pg) will be more influential and yield a
positive or negative ecosystem metabolism (Odum, 1985). Community respiration
measures the release of CO2 from breakdown of organic matter, whereas primary
production measures the increase in biomass from photosynthesis. These processes
66
are very closely tied to carbon cycling and are greatly affected by excess inputs and
losses of organic matter (Caffrey, 2003; Hoellein et al., 2013). As previously discussed,
storm events with prolific rainfall transport copious quantities of carbon (and other
nutrients) into waterways that stress ecosystems through eutrophication, increases in
community respiration, and increases in biological oxygen demand (Avery et al., 2004b;
Pinckney et al., 2001).
Frequent storms and hurricanes in northern Florida make it vital to determine the
effects these events have on coastal riverine/estuarine biogeochemistry and ecosystem
metabolism. Florida averages 1362.71 mm of rainfall and 70-100 thunderstorms per
year (depending on location within the state), the highest number in the United States
(FSU climate center, NOAA). During the winter months when thunderstorms are less
common, Florida’s Atlantic coast experiences the effects of nor’easters. A study in the
St. John’s River in east-central Florida, observed that nor’easters may produce storm
surges up to 1.15 m- 1.3 m, which is slightly less than hurricanes and tropical storms
that create surges of 1.3 m-1.5 m in this region (Bacopoulos, 2017). Wind and
precipitation from nor’easters and thunderstorms mobilize pulses organic matter that is
transported into waterways through runoff and contributes to biogeochemical cycling
(Raymond et al., 2016).
In order to determine if nor’easters and other storms with high precipitation have
as significant an impact as hurricanes on northern Florida chemical cycling, export was
calculated for several analytes that have been measured monthly in Pellicer Creek over
the past several years. In the past five years, Hurricanes Matthew, Irma, and Dorian
affected regions of the Atlantic coast of north Florida, not impacted in the previous

67
decade. These events in addition to a collection of other precipitation events were
compared in this study. Ecosystem metabolic characteristics were also calculated by
using continuously monitored dissolved oxygen concentrations. The hypothesis of this
study was that hurricanes will have a larger impact on DOM loading and export than
other common storm events and cause significant changes in ecosystem metabolic
characteristics not seen during other storms. In order to examine this hypothesis, there
were two main goals of this study: these were (1) to determine how hurricanes Matthew,
Irma, and Dorian that impacted St. Augustine, FL over the past 5 years and determine
the if these hurricanes increased nutrient export more than nor’easters or other storms
with high rainfall, and (2) examine how export of nutrients affected local biological
responses. By answering these questions, this study assesses the impact of hurricanes
on waterways and the importance of examining multiple levels of storm impacts on
biogeochemical and metabolic pathways.
Methods
Study Site
The study is located within Pellicer Creek, the largest tributary of the Matanzas
River estuary, approximately 10 km from the Matanzas inlet. Pellicer Creek is relatively
pristine. It is a state Aquatic Preserve, within the Guana Tolomato Matanzas National
Estuarine Research Reserve (GTMNERR) and bordered by Faver Dykes State Park
and other conservation lands (Fig. 3-1). The creek is influenced by daily tidal cycles and
watershed inputs with salinity concentrations ranging from 0 – 35 psu. The surrounding
watershed consists of mixed mangrove and salt marsh species downstream, Juncus
roemerianus marsh surrounding the study site, and mixed freshwater forest species
(primarily Taxodium distichum) and Cladium marsh upstream. There are also some

68
sparse pine plantations and horse farms located upstream near the headwaters of
Pellicer Creek.
Three hurricanes have influenced this site over the past 5 years. Hurricane
Matthew passed through the area on October 7th, 2016; Hurricane Irma effected the
area on September 10th-11th, 2017; and Hurricane Dorian passed offshore through St.
Augustine on September 4th, 2019. Hurricane Matthew dropped 34.5 cm of rainfall in the
St. Augustine area (14.2 cm measured at the study site), Hurricane Irma deposited 26
cm of rainfall (16.3 cm at the study site), and Hurricane Dorian created only 5.6 cm of
precipitation measured only at the study site (Table 3-1). Hurricane Matthew created the
largest storm surge of 1.6 m, followed by Irma with 1.3 m, and Dorian with 0.9 m.
Data Collection for Export Calculation
Tidally filtered discharge (ft3 s-1) was retrieved from the United States Geological
Survey on the National Water Information System Website for gage #02247222 at
Pellicer Creek near Espanola, FL. The gage at this location has been inconsistently
maintained over the past 15 years and tidally filtered discharge is available from
October 2007 to August 2013 and April 2017 to the present. Therefore, data from 2014-
2016 (during Hurricane Matthew) is unavailable.
Nutrient data used for export calculations was collected by the Guana Tolomato
Matanzas National Estuarine Research Reserve (GTMNERR) as part of the national
System-Wide Monitoring Program (SWMP). Water samples were collected monthly for
dissolved organic carbon (DOC), total kjeldahl nitrogen (TKN), ortho-phosphate (PO43-,
SRP), nitrate-N (NO3-N), and ammonia-N (NH3-N). DOC and TKN have been measured
at Pellicer Creek since 2015, and nitrate, nitrite, ortho-phosphate, and ammonia-N have
been collected monthly since 2002. An ISCO autosampler collected water samples

69
every 2.5 hours over a 24-hour period (approximately 2 tidal cycles) and grab samples
were collected at the start and end of the autosampler cycle once per month. Analysis
of water samples was conducted using EPA methods 365.1 Rev. 2.0 (ortho-phosphate),
351.2 Rev. 2.0 (TKN), 353.2 Rev 2.0 (nitrate/ nitrite), 350.1 Rev 2.0 (ammonia), and SM
5310 B-00 (DOC) (National Environmental Methods Index,
https://www.nemi.gov/methods/method_summary/5717/).
Nutrient and precipitation data were collected and graphed for available years in
the “SWMPr” package in R with ammonia-N, nitrate-N, and SRP in mg L-1 (Fig. 3-3).
DOC and TKN were not collected at this site until 2014 and are available upon request
from a NERR office. Spearman correlations were performed on this dataset between
precipitation and ammonia-N, nitrate-N, and SRP, but spearman correlation coefficients
were low (sp < 0.1) likely due to sampling intervals (not continuous to directly relate to
individual storm events) and lag times between storm events and runoff of nutrients into
waterways. Therefore, a different methodology was used to analyze organic matter
export within the waterway by using monthly sampling intervals to calculate export.
Export was calculated in kg day-1 using tidally filtered discharge and nutrient
concentrations for DOC, TKN, SRP, NO3-N, and NH3-N in mg L-1. Since nutrient data is
collected once per month, USGS tidally filtered discharge data was extracted from each
sampling time point. Export was then averaged across each day (approximately 1 tidal
cycle) and plotted over time with error bars for 1 standard deviation. The equation (Eq1)
used to calculate export is listed below, Q is discharge (ft3s-1), C is concentration of
analyte (mg L-1), and the other constants are conversion factors between mg to kg, L to
ft3, and seconds to days.

70
Export (kg day−1) = QC ∗ 1e−8 ∗ 28.32 ∗ 86400 (3-1)
Hurricane Export
Export for DOC, TKN, SRP, NO3-N, and NH3-N from the months of hurricanes
Matthew, Irma, and Dorian were calculated. Since the USGS gage was out of
commission during Hurricane Matthew, a Pearson correlation was computed between
precipitation (mm) from the SWMP NERR meteorological station and discharge (ft3 s-1)
from the USGS gage using “ggpubr” package in R, (version 10.3), a freely available
statistical software (Fig. 3-5). For the correlation analysis monthly data was pulled from
all available months where discharge data was collected, in total 56 data points. The
assumptions of linearity, normality, and homogeneity required for a Pearson correlation
to be used were checked before analysis. The correlation yielded a moderate
relationship (R2 = 0.67, p < 0.01). Discharge was then estimated for Hurricane Matthew
(precipitation = 142 mm) as 33.8 m3 s-1. Export for the month of Hurricane Matthew was
calculated using Eq.1. Estimates of discharge from precipitation were also calculated for
Hurricanes Irma and Dorian using Eq.1 to verify the accuracy of the calculated values
for Hurricane Matthew. Discharge was estimated as 40.8 m3 s-1 for Irma (precipitation =
168.3 mm) and 11.6 m3 s-1 for Dorian (precipitation = 56 mm). Export for the estimated
values of the three hurricanes and the actual values for Hurricanes Irma and Dorian
were graphed with error bars for 1 SD using Microsoft Excel (Fig. 3-7).
Statistical Analysis
Monthly cumulative precipitation was used as a proxy to determine periods of
storm influence, and applicable months were grouped into three groups. Low
precipitation (approximately 30% of data) was monthly precipitation < 50 mm (storm

71
group 1), high precipitation (approximately 30% of data) was monthly precipitation > 150
mm (storm group 2), and hurricane months (based on 3 hurricane months only) were
months when Hurricanes Matthew, Irma, and Dorian affected the study site (storm
group 3). Each export value for DOC, SRP, ammonia-N, and nitrate-N within each storm
group between April 2017 and September 2019 (months where discharge and nutrient
concentrations were available to calculate discharge accurately) were graphed with box
plots using the ‘ggpubr’ package in R. Kruskal-Wallis was performed using the ‘diplyr’
package in R to determine significant differences between groups for each nutrient
exported.
Additionally, a principal component analysis (PCA) was performed using the
‘factoextra’ package in R with the averaged export values for DOC, TKN, SRP, NO3-N,
and NH3-N. Variables are colored/clustered by storm group.
Ecosystem Metabolism
‘SWMPr’ package in R was used to calculate and graph ecosystem metabolism
characteristics in Pellicer Creek from dissolved oxygen (DO) values continuously
collected by a YSI data sonde at the study site (Beck, 2016). Eq 1. can be used to
calculate net ecosystem metabolism (NEM, dC/dt) by using community respiration (Rt,
mg L-1 h-1), gross primary production (Pg, mg L-1 h-1), and rate of oxygen uptake from
diffusion across the air-water interface (mg L-1 h-1) as listed below (Beck, 2016; Odum,
1956; Thébault et al., 2008).
NEM = (dC
dt) = Pg − Rt + D (3-2)
NEM was aggregated by month with “aggreswamp” in order to analyze the similarly to
export. A Kruskal-Wallis test was run using the “diplyr” library in R to determine

72
significant differences in NEM between storm groups. Significant differences were
found, so the Dunn post-hoc test was utilized in the “FSA” package with p-vales
adjusted with the Benjamini-Hochberg method. As mentioned above, all statistical
operations were performed with R© (Ver 3.1.2, R Foundation for Statistical Computing,
Vienna Austria) with the critical level of significance set at α = 0.05.
Results
Export of DOC and Nutrients
Export of carbon and nutrients varied between analytes, although all analytes
exhibited large increases in export in September 2017. DOC export peaked largely to
approximately 240 kg C day-1 in September 2017 (sampled 1-week post- Hurricane
Irma) that slowly decreased to 9 kg day-1 in March 2018, 245 kg C day-1 at the end of
May 2018, and 294 kg C day-1 in August 2018. There were smaller peaks in DOC
export in February 2018 and February 2019 (Fig. 3-4). Ammonia-N Export only peaked
in September 2017 at 1.5 kg NH3-N day-1 that slowly decreased until March 2018 at
0.02 kg NH3-N day-1 and consistently ranged between 0.02 kg NH3-N day-1 and 0.09 kg
NH3-N day-1 before and after Hurricane Irma from April 2017- August 2017 and March
2018- September 2019 (Fig. 3-5A). TKN displayed a similar pattern to DOC with the
largest spikes in export in September 2017 around 9.8 kg TKN day-1 that decreased
slowly until March 2018 (to approximately 0 kg day-1), May 2018 at 7.9 kg TKN day-1,
and August 2018 at 7.8 kg TKN day-1 (Fig. 3-5B). There was a smaller spike in February
2019 at 2.5 kg TKN day-1 and otherwise values ranged from approximately 0 to 1.7 kg
TKN day-1. Orthophosphate was also similar to TKN and DOC and peaked in
September 2017 at 0.04 kg SRP day, May 2018 at 0.034 kg SRP- day-1, and August
2018 at 0.028 kg SRP- day-1 (Fig. 3-5C). Nitrate N exhibited a more unique pattern than

73
the rest of the analytes and peaked at 0.18 kg NO3-N day-1 in September 2017, but the
largest spike in nitrate was December 2018 at 0.4 kg NO3-N day-1 (Fig. 3-5D).
Hurricane Export
Since the export graphs shown were not accurately able to display data from
2016 and Hurricane Matthew, bar graphs were generated to visually compare export
from the three hurricanes including the estimated values derived from the correlation
between precipitation and discharge (Fig. 3-6). Irma displayed the largest DOC export
of the three hurricanes at 240 kg C day-1, Matthew exported 85 kg C day-1 and Dorian
exported only 24 kg C day-1 (Fig. 3-7A). Average TKN during Irma also yielded the
largest value of 9.8 kg TKN day-1, followed by Matthew with 3.3 8 kg TKN day-1, and
Dorian with 1.0 8 kg TKN day-1 (Fig. 3-7B). Average ortho-phosphate export was
highest after Matthew 0.14 kg SRP day-1, Irma exported 0.04 kg SRP day-1, and Dorian
exported 0.002 kg SRP day-1. Average nitrate export was highest after Irma at 0.2 kg
NO3-N day-1, then Matthew at 0.01 kg NO3-N day-1, and last Dorian at 0.006 kg NO3-N
day-1. Ammonia-N export was also greatest after Hurricane Irma at 1.5 kg NH3-N day-1,
second greatest after Matthew at 0.20 NH3N day-1, and then after Dorian at 0.05 NH3-N
day-1. Estimated values for Hurricane Irma were 105 kg C day-1, 4.3 kg TKN day-1, 0.21
kg SRP day-1, 0.08 kg NO3-N day-1, and 0.64 kg NH3-N day-1, which were not very close
to actual values. Estimated values for Hurricane Dorian were 19 kg C day-1, 0.85 kg
TKN day-1, 0.03 kg SRP day-1, 0.005 kg NO3-N day-1, and 0.04 kg NH3-N day-1, which
were more similar to actual values. Due to the largest number of points being clustered
below 200 mm precipitation and 5.66 m3 s-1 discharge, it is assumed that estimation of
values below this range are probably more accurate than estimates of points above this
range. Besides low values for SRP and nitrate-N (concentrations near limit of detection),

74
estimated values for Dorian were within 15-20% the actual values. Estimates for
Hurricane Matthew are in a similar range within the area of the graph with most data
points, so estimates for Hurricane Matthew are likely within a 20% window, but these
are the best estimates available without actual discharge values.
Storm Group Comparison
In order to compare export from storms besides hurricanes, box plots were
derived from grouping cumulative monthly precipitation into storm groups (Table 3-2;
Table A-2; Fig. 3-8 & 3-9). This data was non-normal, so a Kruskal-Wallis test was used
to determine significant difference between hurricane months, months of high
precipitation (> 150 mm), and months of low precipitation (< 50 mm). No significant
differences were observed. Average DOC export was higher during high precipitation
months (approximately 150 kg day-1) as opposed to low precipitation (approximately 60
kg day-1) and hurricane months (approximately 50 kg day-1), but high variability was
present within groups and therefore no significant differences were found (Fig. 3-8).
Ammonia-N (0.1-0.2 kg day-1), TKN (2-3 kg day-1), SRP/ orthophosphate (0.01- 0.02 kg
day-1), and nitrate-N (0.01-0.05 kg day-1) did not yield any significant differences
between storm groups and had very similar average values (Fig. 3-9). Although not
significantly different, group 3 months (hurricane months) consistently displayed the
widest range of variability.
Principle Component Analysis
Although no significant differences were found between groups of analytes, a
PCA was run with the analyte data from all groups to determine the overall relationships
between low precipitation, high precipitation, and hurricane months (Fig. 3-10). The
results of the PCA displayed a clear separation between each of the different groups,

75
indicating variable clustering shows differences between groups even if there is not a
significant difference within analytes groups themselves.
Ecosystem Metabolism
Additionally, a graph displaying net ecosystem metabolism (NEM), community
respiration (Rt), and gross primary production (Pg) was generated from dissolved
oxygen data that displays a decrease in Pg, increase in Rt, and therefore a drop in NEM
after Hurricanes Matthew and Irma that persisted for at least 6 months post-hurricane
(Fig. 3-11A; Table A-3). Generally, Pellicer Creek appears to be net heterotrophic, but
each hurricane event caused a drop in NEM, increasing community respiration and
decreasing gross primary production. Before Matthew in September 2016, average
NEM = -6.4 mmol O2 m-2 day-1 and in October 2016 it dropped to -40 mmol O2 m-2 day-1
. Before Irma in August 2017, average NEM = -20 mmol O2 m-2 day-1 ,but in September
and October 2017 post-Irma, NEM dropped to -41 mmol O2 m-2 day-1 (September) and -
57 mmol O2 m-2 day-1 (October). Before Dorian in August 2019, NEM = -16 mmol O2 m-
2 day-1 and dropped to -29 mmol O2 m-2 day-1 in September (Table A-3).
To determine if differences were present between low precipitation, high
precipitation, and hurricane months, the storm groups were again used to generate a
box plot for NEM. High and low precipitation months showed similar averages and
ranges in NEM (Average = approx. -15, Range = -5 – to 20), but hurricane months had
average values and a range that was significantly lower as shown by the Kruskal-Wallis
and Dunn tests (Average = approx. -30, range = -30 to -40). The Kruskal-Wallis test
yielded a p-value of 0.033, and the post-hoc Dunn test showed a p-adjusted value of 0.5
between groups 1 and 2, but a significant p-value between hurricane months and the
high/low precipitation months (1-3 : p-value = 0.030, 2-3: p-value = 0.034).

76
Discussion
Organic Matter Export
Precipitation driven runoff into Pellicer Creek is the largest driver of nutrient
concentrations within the waterway (Fig. 3-3). However, lag times for export of organic
matter from terrestrial to aquatic environments are extremely variable and the monthly
sampling times were inadequate to determine a timeline between runoff and export of
organic matter into Pellicer Creek (Askew, 1970; Laurenson, 1964). Precipitation drives
the organic matter into waterways, but river-mediated transport of carbon and nutrients
is critical in exporting OM from high order streams to the ocean.
Rivers globally transport 0.45 peta-grams OC yr-1 or 1.2e9 kg OC day-1 to the
ocean (Cole et al., 2007). Pellicer Creek discharges less water and DOC when
compared to larger Florida systems with an average discharge of 1.16 m3s-1 for spring,
1.78 m3s-1 for summer, and 2.09 m3s-1 for fall, and exports an average of 38.9 kg DOC
day-1 (spring), 62.6 kg DOC day-1 (summer), and 87.7 kg day-1 (fall). In comparison,
Apalachicola Bay seasonally discharges 757 m3s-1 for spring, 441 m3s-1 for summer,
and 272 m3s-1 for fall and exports 177,120 kg DOC day-1 (spring), 97,632 kg DOC day-1
(summer), and 56,160 kg DOC day-1 (fall) (Arellano et al., 2019). However, Pellicer
Creek is representative of blackwater rivers that are prolific feeders of these larger
coastal systems in the south-eastern United States where the majority of organic matter
originates (Mallin et al., 2004; Meyer, 1990). Additionally, Pellicer Creek is only 5%
developed and has been continuously monitored for a variety of parameters in the past
3-15 years, making it a great example of a model for predominantly natural system.
Hurricanes have the ability to drive export of DOC and nutrients in natural and
non-natural systems alike, rapidly pulsing a large percentage of annual export into

77
aquatic systems (Chen et al., 2019; Yoon and Raymond, 2012). A study on Hurricane
Irene determined that 25- 45% of annual carbon and 11-35% of annual nitrogen was
exported from a forested watershed into the Esopus Creek in New York (Yoon and
Raymond, 2012). Another study of Hurricane Gustav determined that 24% of DOC,
1.7% of dissolved inorganic nitrogen, and 6% of phosphate yearly exports were
transported downstream in the Pearl River in only 9 days (Cai et al., 2013b). A long
term, 20 year, study discovered that that wet hurricanes (hurricanes with high
precipitation) export 21% DOC, 26% soluble reactive phosphorus (SRP), and 11% total
nitrogen (TN) of long term loads in the Neuse River Estuary in North Carolina (Paerl et
al., 2018). In this study, Pellicer Creek exported 39% of annual average DOC, 180%
annual average ammonia-N, 54% annual average ortho-phosphate, 48% annual
average TKN, and 33% annual average nitrate during the month of Hurricane Irma
(Table 3-4). Although differences in sampling methods make it difficult to compare
between studies, the high percentages of annual nitrogen species and SRP export are
similar or higher than estimates from examples from other systems discussed above.
Most hurricane nutrient transport is driven by “wet” hurricanes with high precipitation,
and windy, dry hurricanes may not drive nutrient loading in coastal systems to the same
extent (Paerl et al., 2018). In this study, September 2019 (Hurricane Dorian) only
exported 3% yearly average DOC, 7% yearly average NH3-N, 4% yearly average
phosphate, 5% yearly average TKN, and 1% yearly average NO3-N. These values are
much less than other non-hurricane months and at least a degree of magnitude less
than the month of Hurricane Irma, indicating substantial variability in hurricane impact
depending on intensity, proximity, antecedent conditions, etc.
78
Antecedent conditions pre-hurricane are predominately dependent on landscape
saturation from summer storms in the months before hurricane impact. In the summer of
2016, before Matthew, St. Augustine experienced a period of drought with fewer
summer thunderstorms than average, creating dry terrestrial conditions and higher
salinities in local waterways (Fig. A-7). On the contrary, the months preceding Hurricane
Irma were rainy, saturating the upland systems and lowering salinity levels in the
waterway. Since soil saturation will increase sheet-flow runoff from landscapes into
streams and rivers, rainy summers pre-hurricane Irma aided in the spikes of carbon and
nutrients in Pellicer Creek (Kirkby, 2014). Additionally, Hurricane Irma’s storm surge
pushed saline water into the previously fresh upper reaches of the creek, leaching
additional ions from the soil in the rapid transition from fresh to saline water (Herbert et
al., 2015;Chapter 2). Since salinity in Pellicer Creek was already elevated pre-Matthew,
it is less likely that this mechanism of ion release had an equivalent impact.
Hurricane Irma created a 1.3 m storm surge, causing saltwater to creep into the
previously freshwater portion of the river (Chapter 2). Increased ionic strength of
saltwater may have displaced or obstructed ions from ion exchange sites in soil,
causing ammonium, phosphate, and other ions to desorb (Stumm and Morgan, 1996).
Desorbed ammonium, phosphate, and other ions were then added to the bioavailable
nutrient pool within the water column. Due to higher exchangeable ammonium present
in freshwater wetlands and waterways, salinization can release adsorbed ammonium
from soils rapidly and increase water column ammonium concentrations within hours
(Ardón et al., 2013; Herbert et al., 2015a; Weston et al., 2006). Soil flux studies
performed on soils across the study site showed a steady flux of ammonium ions into

79
the water column that progressed over a 9 day study interval (Fig. A-5). Although
variability was considerable, higher salinity generally lead to increased leaching of
ammonium as well as TKN, especially in the freshwater marsh and pine plantation soils
(Fig. A-5- A-7). Due to the bioavailability of ammonium, ammonium desorption and
diffusion into the water column can increase microbial processing, increasing biological
oxygen demand and driving down DO concentrations (Mallin and Corbett, 2006a).
Furthermore, microbial sulfate reduction becomes the dominant degradation pathway as
salinity increases, in situ organic matter mineralization doubles, and additional nutrients
are released into the water column, further increasing DOM concentrations (Weston et
al., 2006). DOC leaching was variable across salinity treatments, and the highest DOC
leaching potential was not associated with the highest salinity. This effect might help to
explain the lack of significant differences between hurricane and other precipitation
events, since salinity might not be a primary factor in DOC release from these soils.
Therefore, thunderstorms, nor’easters, and other events with high precipitation might
also yield high carbon inputs in these waterways.
In forested watersheds it is estimated that 86% of DOC is exported during storm
and snowmelt events (Raymond and Saiers, 2010). A watershed in Maryland
contributed 53% annual carbon export from storm events totaling 1052 mm of
precipitation in 2008, and 60% annual carbon export from storm events yielding 1238
mm of precipitation in 2009. The same study produced similar estimates for hurricane
years, and calculated 972 mm of precipitation in 2010 (Hurricane Nicole) contributed
57% of yearly carbon export, and 1462 mm in 2011 (Hurricane Irene) contributed 76%
annual export (Dhillon and Inamdar, 2013). In Juneau, Alaska, storms between

80
September 6th-9th and July 9th-14th produced 48mm and 72 mm of precipitation, which
exported 22-28% annual DOC and 31-37% annual DOC (Fellman et al., 2009). In
comparison, the 2 largest storm/ precipitation months from this study contributed 42%
annual DOC export (May 2018) and 47% annual DOC export (August 2018). Although
coarse estimates, these values are in line with other estimates and display the
contributions of non-hurricane storm events to DOC export.
Evaluation of Ecosystem Metabolism
Export of DOC and other nutrients is vital to biogeochemical processing that is
coupled with metabolic processes in streams and rivers (Vannote et al., 1980). A
transition occurs between heterotrophic and autotrophic conditions moving downstream
from headwaters to estuaries. Heterotrophic portions of waterways are dominated by
allochthonous inputs and organisms that gain energy from organic matter consumption,
whereas autotrophic zones are dominated by autochthonous organic matter added to
the waterway by primary production (Odum, 1956; Webster, 2007). Pellicer Creek is a
3rd-4th order predominantly heterotrophic stream, indicating high allochthonous inputs in
that area of the river (Table A-3). A study on the Ogeechee River (another blackwater
river in GA) revealed that allochthonous inputs were the largest driver of stream
metabolism, regardless of stream order (Meyer and Edwards, 1990). Due to the
coloration and high DOM concentrations indicative of blackwater rives, it is
understandable that heterotrophy tends to be prevalent in these systems. Rapid
additions of organic matter during hurricane disturbance further decreases net
ecosystem metabolism in Pellicer Creek (increasing the heterotrophic condition) (Fig. 3-
11). Net ecosystem metabolism was significantly lower in hurricane months than other

81
time points in Pellicer Creek during the study interval even though no significant
differences were seen across export values (Fig. 3-11B).
On a monthly timescale no significant differences are seen in overall export, but
the rapid pace of runoff into Pellicer Creek during a hurricane is much quicker than
another storm event. A study in Cape Fear found that hurricanes multiplied organic
matter inputs by three times, adding considerably more labile organic matter than runoff
from other events and increasing biological oxygen demand (Avery et al., 2004b).
Pellicer Creek experienced a similar phenomenon, and the rapid addition of TKN and
ammonia-N (during Irma) into this nitrogen limited system catalyzed microbial
processing and further increased respiration rates (Dix et al., 2008). A spike in
community respiration resulted in a drop in net ecosystem metabolism that persisted in
Pellicer Creek for up to 3-4 months (Fig. 3-11A).
One additional factor in the initial decrease in NEM is rapidly increased turbidity
that occurs during a hurricane event (Chapter 2). As turbidity increases, photo-synthetic
organisms are out-shaded or potentially exported with increased discharge, as seen by
the decrease in chl-a downstream after Hurricane Irma. Although high turbidity (up to 70
NTU) was only seen to persist for a couple days after Hurricane Irma’s passage, it is
possible that the turbidity spike aided in decreasing primary production initially (Chapter
2).
Conclusion
On a monthly scale, no significant differences were found between export of
organic matter in hurricane months and months of low precipitation (< 50 mm) or high
precipitation (> 150 mm). However, due to more rapid inputs of nutrients during
hurricanes, biological oxygen demand and turbidity drove down net ecosystem

82
metabolism. Therefore, hurricanes do not affect nutrient export more than
thunderstorms or nor’easters, but wet hurricanes can have a more significant and
persistent effect on ecosystem metabolic characteristics. Biogeochemical cycling and
ecosystem metabolism are closely coupled processes that can be drastically altered by
disturbance, calling for more extensive study of the relationship between these
processes to better understand future shifts in rivers and estuaries as Earth’s climate
and associated disturbance events continue to change.

83
Table 3-1. Precipitation, wind speed, and storm surge measurements for St. Augustine, FL during Hurricanes Matthew, Irma, and Dorian.
Hurricane
Approx. Cumulative Precip. (cm)
Max Wind Speed (m s-1)
Sustained Wind Speed (m s-1)
Storm Surge (m) Source
Matthew 34.5 38.6 29.3 1.6 (Stewart, 2016)
Irma 25.96 37.4 30.4 1.3 (Cangialosi et al., 2017)
Dorian 5.6 26.4 20.6 0.93
National Weather Service, Precip. from NERR meteorological station
Table 3-2. Cumulative precipitation per month between April 2017 and September
2019.
Month Year Cumulative Precipitation (mm)
4 2017 81
5 2017 25
6 2017 231
7 2017 130 8 2017 179
9 2017 284
10 2017 236
11 2017 132 12 2017 33
1 2018 133
2 2018 32 3 2018 38
4 2018 118
5 2018 164
6 2018 185 7 2018 122
8 2018 157
9 2018 63
10 2018 118 11 2018 77
12 2018 206
1 2019 98
2 2019 27 3 2019 38

84
Table 3-2. cont.
Month Year Cumulative Precipitation (mm)
4 2019 76
5 2019 51 6 2019 159
7 2019 129
8 2019 42
9 2019 112
Table 3-3. Summary of Precipitation (month), concentration, and standard deviation
(SD) of DOC, NH3-N, TKN, NO3-N, and SRP collected in Pellicer Creek during the months of Hurricanes Matthew, Irma, and Dorian, and during the 6 highest precipitation events.
Concentration
(mg L-1
) Hurricanes P
(mm) DOC SD NH3-N SD TKN SD NO3
-N SD SRP SD
Matthew 142 31 8.4 0.032 0.031 0.53 0.16 0.005 0.002 0.053 0.013 Irma 284 32 0 0.195 0.021 1.30 0.00 0.024 0.000 0.063 0.003 Dorian 112 21 4.8 0.059 0.026 0.95 0.08 0.006 0.002 0.034 0.006 High Precipitation Jun-17 231 11 0.6 0.060 0.037 0.91 0.06 0.004 0.000 0.091 0.020 Aug-17 179 11 2.0 0.051 0.039 0.80 0.13 0.011 0.005 0.066 0.021 **Oct-17 236 37 6.2 0.070 0.035 1.24 0.23 0.010 0.005 0.050 0.010
May-18 164 41 1.2 0.019 0.009 1.23 0.08 0.017 0.003 0.047 0.003 *Jun-18 185 37 6.6 0.027 0.008 1.25 0.08 0.020 0.004 0.043 0.003 Aug-18 157 4 0.6 0.011 0.005 1.15 0.07 0.011 0.003 0.036 0.004
**October 2017 was the month of a large nor’easter that hit Florida (one-month post- Hurricane
Irma)
Table 3-4. Estimation of % average annual export of DOC, NH3-N, TKN, NO3-N, and
SRP form the hurricane and highest precipitation months.
Storm/ Month DOC NH3-N SRP TKN NO3-N
Oct-16 (Matthew) 14.3 25.2 17.0 16.7 2.6
Sept-17 (Irma) 39.0 180.8 54.0 48.2 32.8
Sept-19 (Dorian) 3.3 6.8 3.8 4.6 1.0
Jun-17 1.2 5.2 7.1 3.1 0.5
Aug-17 1.8 6.2 7.5 3.9 2.1
Oct-17 27.5 41.0 25.6 22.0 9.3
May-18 41.8 15.3 33.7 38.5 19.1
Jun-18 22.9 12.8 18.4 23.4 14.0
Aug-18 46.7 9.2 27.8 38.4 13.2

85
Figure 3-1. Map of the study site located within the Pellicer Creek Aquatic Preserve and the Faver Dykes State Park. The sampling location consisting of brackish water is surrounding by Juncus roemerianus marsh. The Matanzas River (a portion of the Intracoastal Waterway) is approximately 5 km east. Pellicer Creek extends inland to the west approximately 10 km from the sampling location, the upper reaches of which consist of freshwater surrounded by mixed forest, Cladium spp. marsh, Pinus spp. plantations, and other varieties of freshwater groundcover.

86
A
B
C Figure 3-2. Wind speed and total precipitation collected by the GTMNERR
meteorological station (NEERS 2019) at the study site during A) Hurricane Matthew, B) Hurricane Irma, and C) Hurricane Dorian. * indicates the time in which the peak (eye) of the hurricane was at its closest point to St. Augustine.

87
A
B
C Figure 3-3. Historical precipitation overlaid with A) Ammonia-N concentration, B)
Nitrate-N concentration, C) Ortho-phosphate concentration between 2014 and 2018 at the Pellicer Creek study site.

88
Figure 3-4. DOC export from Pellicer Creek from April 2017 to September 2019. The
symbols indicate the passage of Hurricanes Irma and Dorian.

89
A
B
C
D Figure 3-5. Nutrient export form Pellicer Creek from April 2017- September 2019 for A)
Ammonia-N, B) total kjeldahl nitrogen (TKN), C) ortho-phosphate, and D) nitrate-N. The symbols indicate the passage of Hurricanes Irma and Dorian.

90
Figure 3-6. Pearson correlation between monthly discharge and precipitation used to
estimate discharge for Hurricane Matthew based on precipitation value of 142 mm (33.8 m3 s-1).

91
A B
C Figure 3-7. Export compared between Hurricanes Matthew, Irma, and Dorian for A)
DOC, B) TKN, and C) ortho-phosphate, nitrate, and ammonia-N. Estimated values for Hurricanes Irma and Matthew were also calculated and compared as verification for the estimated values calculated for Hurricane Matthew.

92
Figure 3-8. Box plot displaying average and range of DOC export based on storm
groups 1 (low precipitation months < 50 mm), 2 (high precipitation months > 150 mm), and hurricane months (where hurricanes impacted the area. Kruskal-Wallis test determined no significant differences between groups.

93
Figure 3-9. Box plots displaying average and range of A) ammonia-N export, B)
orthophosphate export, C) nitrate export, and D) TKN export from Pellicer Creek based on storm groups 1 (low precipitation months < 50 mm), 2 (high precipitation months > 150 mm), and hurricane months (where hurricanes impacted the area. Kruskal-Wallis test determined no significant differences between groups of all analytes.

94
Figure 3-10. Principle component analysis run in R using DOC, ammonia-N, nitrate, ortho-phosphate, and TKN data from the 3 storm groups.

95
A
B Figure 3-11. Net ecosystem metabolism (NEM) and associated characteristics A)
graphed with gross primary production (Pg), and ecosystem respiration (Rt) in Pellicer Creek from January 2016- September 2019. M, I, and D represent the passage of Hurricanes Matthew, Irma, and Dorian. B) Net ecosystem metabolism divided into storm groups and displayed as a box plot showing averages and range of data. Kruskal-Wallis and Dunn post-hoc tests determined that hurricane months (3) were significantly different in NEM than high and low precipitation months (1 & 2).

96
CHAPTER 4 TROPICAL STORM INDUCED CHANGES AFFECT ABSORBANCE AND
FLUORESCENCE DEGRADATION OF VEGETATION-DERIVED DISSOLVED ORGANIC MATTER
Photo-reactive components of dissolved organic matter (DOM) play a vital
biogeochemical and ecological role as a source of nutrients and organic substrates, as
well as a means of attenuating sunlight. Chromophoric dissolved organic matter
(CDOM) and a portion of CDOM specifically referred to as fluorescent DOM (fDOM)
primarily make up these photo-reactive species and are very structurally complex,
consisting of an unknown array of aromatic structures (Engelhaupt et al., 2003; Wetzel
et al., 1995a). CDOM shields aquatic organisms from harmful UV radiation, and upon
breakdown can release nutrients for phytoplankton that fuels aquatic food webs and
microorganisms that drive biogeochemical cycling (Miller et al., 2002; Stedmon et al.,
2007; Vahatalo and Jarvinen, 2007; Walsh et al., 2003; Williamson et al., 2001).
Although well documented in the literature, photochemical degradation of CDOM
remains highly variable with studies reporting conflicting evidence on effects of
photodegradation rates, including both release and inhibition of greenhouse gas
emissions, such as CO2 (Johannessen and Miller, 2001; Stubbins et al., 2006; Toole et
al., 2006). Therefore, further studies are still needed to clarify conflicting results and
understand the nuances of the complexity of photodegradation and photo-reduction
behavior of different CDOM source material.
One of these nuances that has yet to be thoroughly studied is the impact of large
disturbance events, such as hurricanes, on photochemical degradation behavior and
kinetics. Hurricane events cause rapid changes in water chemistry, especially salinity,
that can drastically change the matrix of CDOM (Chapter 2). Hurricanes may also cause
97
temporal dilution of coastal brackish environments and an associated decrease in
salinity as seen post-Hurricane Irma (Chapter 2). However, these impacts are storm-
dependent and a contrasting effect might instead temporarily increase salinity through
wind-driven surges of seawater moving inland as was seen during Hurricane Francis
and Hurricane Irma in Florida (Bonvillain et al., 2011; Edmiston et al., 2008; Chapter 2).
Salinity has been shown to substantially affect longwave (>350 nm) CDOM
photobleaching, and CDOM absorption decreased by 10% to 40% as salinity was
increased from 0 to 33 at 440 nm (Osburn et al., 2009). Decreases in CDOM
photobleaching at 280 nm has also been shown when humic-rich CDOM was added to
a salinity gradient that simulated estuarine mixing (Minor et al., 2006b). Quantum yields
for photobleaching and hydrogen peroxide production have also been shown to
increase with salinity as an indicator of higher photo-reactivity (Osburn et al., 2009).
Decreasing chromophoric and fluorescence intensities have been documented in saltier
photobleached samples, but the extent of these affects were observed to be dependent
on specific chromophores and fluorophores (Yang et al., 2014b). The delicate effect of
pH changes associated with increase in alkalinity (Timko et al., 2015a) as well as
drastic changes in ionic strength and dissolved inorganic constituents are all factors
fundamentally changing photodegradation of CDOM with increasing salinity (Grebel et
al., 2009).
Many of these specific chromophores and fluorophores are derived from
vegetative sources, and these sources of organic matter more rapidly enter the DOM
pool during hurricane disturbance. For example, 60% of mangroves were uprooted,
25% of upright unbroken trees were dead, and only 14% of upright, unbroken trees

98
were well vegetated after Hurricane Andrew in south Florida, indicating a large input of
mangrove-derived organic matter to the environment (Mccoy et al., 1996). Live
saltmarsh species are resistant to mortality and removal during hurricanes, but dead
biomass (especially plant litter) can be easily transported and directly added to riverine
or estuarine OM pools. One species of cypress, Taxodium distichum, is resistant to
hurricane impacts in terms of survival, but may still be prone to broken limbs (especially
if the tree is already damaged) and other non-lethal impacts that denude branches
(Gresham et al., 1991; Putz and Sharitz, 1991). Moreover, a study in Yucatán mixed
forest revealed that biomass collected in litter traps in the month post-hurricane was
more than was collected in an entire year without hurricane disturbance (Whigam et al.,
1991). Overall, hurricanes have been consistently proven to amplify organic matter
inputs into waterways across a broad range of studies.
When this vegetative material is added to aquatic systems (or transported into
waterways), organic compounds from the OM begin to leach into the water column,
creating a DOM leachate in a very early diagenetic state (Wheeler et al., 2017). A few
studies have previously observed the effects of environmental factors, such as pH and
senescence, on the effect of photo-degradation of leaf litter leachates in a variety of tree
species, including lodgepole pine (Pinus contorta), sugar maple (Acer saccharum),
white spruce (Picea glauca), silver maple (Acer saccharinum), American beech (Fagus
grandifolia Ehrh.), yellow poplar (Liriodendron tulipifera L.), and red mangrove
(Rhizophera mangle) (Beggs and Summers, 2011; Cuss et al., 2014; Shank et al.,
2010a; Wheeler et al., 2017). However, none of these studies directly investigated the
effects of salinity on leaf litter leachates. In addition, a study by Cuss et al. 2014 using

99
parallel factor analysis (PARAFAC) determined that individual DOM source material did
not behave the same under equivalent experimental treatments; therefore, calling for
more studies examining source-specific material.
Since DOM derived from a variety of sources will chemically behave differently
than source-specific material, it is necessary to look at source-specific DOM in order to
determine each source’s contribution to the DOM photo-reactive pool. Hurricanes
drastically change the environment and affect fresh DOM source inputs and salinity
regimes in coastal waterways for days to weeks after a storm. Some studies used
fluorescence, absorbance, and PARAFAC characteristics to determine hurricane-
induced changes to fDOM and CDOM pools, but there has been very limited research
exploring how source-specific DOM is affected (Larsen et al., 2010; Osburn et al.,
2012). Therefore, dominant vegetation types were leached in this study to create
source-specific DOM and observe salinity effects on photo-reactivity of these specific
DOM sources. It is hypothesized that tropical storms cause abrupt salinity changes to
coastal environments and greatly increase DOM inputs to near-coastal environments
that will rapidly photo-degrade in the higher salinity environment (Chapter2 and 3).
Furthermore, dominant vegetation growing along waterways is the primary vegetative
source of DOM and each source has unique absorbance and fluorescence properties
that react differently under varying salinity regimes.
Study Site and Methods
Study Site Description
The study site consists of a transition zone between an estuary and black-water
river in St. Augustine, Florida. Pellicer Creek is the blackwater river that is the primary
tributary of the Matanzas River (also the Intracoastal Estuary) (Fig. 4-1). The site spans

100
approximately 15 km and is tidally influenced with daily salinity fluctuations (0- 35 psu),
influencing dominant vegetation species throughout the study site. Black mangrove
(Avicennia germinans) is the dominant species within the Matanzas River at the eastern
edge of the site. Further inland (at salinities 10-25 psu), the marsh grass black needle
rush (Juncus roemerianus) is the overwhelmingly dominant vegetative type, spanning a
10 km section of the waterway. In the farthest western 3 km of the site, where salinity is
primarily 0 psu, a mix of freshwater species exist with Bald cypress (Taxodium
distichum) as one of the most prolific species in this area.
Leachate Preparation
Senescent leaves were collected from Taxodium distichum (T. distichum),
Juncus roemerianus (J. roemerianus), and Avicennia germinans (A. germinans).
Following the methods of Osborne et al.(2007) for leachate preparation. 50 grams of air-
dried senescent leaves for each species were added to 2 L of deionized water or
autoclaved 1 µm filtered seawater (35 psu). Leaves were leached for 24 hours and
filtered through 0.45 µm glass fiber filters. Leachates were then refrigerated at 4°C until
irradiation. Before irradiation, the following dilutions were calculated for assurance that
absorbance values would remain below 1 m-1 at 230 nm; dilution ratios were J.
roemerianus 1: 3, A. germinans 1: 10, and T. distichum 1:6.
Photo-degradation Experiments
Leachates were irradiated over a 20-hour period using a continuous flow-through
custom-designed photodegradation system described in detail elsewhere (Timko et al.,
2015a). Leachate subsamples of 15 mL were placed in a 50 mL three-neck round
bottom flask with an intake and output tubing to consistently uptake leachate in small
amounts and return it to the vial after irradiation. After rinsing the tubing with at least

101
300 mL of distilled deionized water (also used for original blank), 40 mL of sample were
pumped through the flow-through system to avoid dilution from residual DI. An Orian
8220BNWP micro-electrode pH stat was also placed into the flask to monitor pH and
an attached J-kem Infinity 2 reaction controller was used to make microliter adjustments
to pH with 0.1M HCL and 0.1 M NaOH to stabilize and maintain pH between 7.7 and
8.0.
Sample was pumped from the 50 mL vial and was fully irradiated under a Sol2A
class ABA solar simulator (Newport Oriel SolABA) in a 101 cm2 custom-designed
borosilicate glass Archimedean spiral (SCHOTT Borofloat, Hellma Analytics, 70 to 85%
transmission between 300 and 350 nm, and 85% transmission at wavelengths > 350)
with a 2mm wide by 1 mm deep channel to avoid inner filter effects (Timko et al. 2015
above). Under these experimental conditions, integrated photon doses between ~330 –
380 nm were approximately 145 µEinsteins m-2 sec-1, determined by NO2 actinometry
and methods described previously (Jankowski et al., 1999, 2000). Based on modeled
solar irradiance from 330 – 380 nm from the System for Transfer of Atmospheric
Radiation model (Ruggaber et al., 1994) calculated just below the sea surface (Fichot
and Miller, 2010), a 20 h irradiation in this system is equivalent to 3 d exposure at 30 °N
in mid-July.
Irradiation, sample flowed through a 1 cm quartz cuvette in an Aqualog
spectrofluorometer (Horiba Instruments). Absorbance/excitation was recorded between
230-700nm wavelengths at 3 nm intervals and emission was recorded between 290-600
nm at ~3 nm intervals to create excitation emission matrices (EEMs). Ultrapure water
(18 MΩ Milli-Q water) served as the fluorescence and absorbance blank and all

102
fluorescence spectra were normalized to the area of water Raman peak. Absorbance
and EEMs were collected from the flow through every 20 minutes for 20 hours, resulting
in 60 absorbance and EEM spectra. Because the Aqualog records absorbance and
fluorescence together, fluorescence spectra were corrected for inter-filter effects and
resulting spectra were corrected for first and second order Raleigh scattering using the
FLToolbox 1.91 (Zepp et al., 2004) in MATLAB®. Raw absorbance was corrected for
any offsets between seawater and the pure water blank and/or instrument drift by
subtracting all spectra by their absorbance at 700 nm. Corrected absorbance was then
converted to the Naperian absorption coefficient by multiplying spectra by 2.303 and
dividing by the cell pathlength (0.01 m). Difference absorption coefficient spectra were
calculated by subtracting all spectra from that at time zero (before irradiation).
Humification index was also calculated and graphed for each species and water
treatment with inner filter corrections (Ohno, 2002). Humification index is calculated by
the following equation in MATLAB 2018b:
HIX = (∑ I435→480)/(∑ I300→345) (4-1)
HIX is the humification index, I is the fluorescence intensity at the wavelengths indicated
between the arrows. Even though humification is not necessarily the appropriate term
for leachate material, this property was explored to determine if there were changes in
the stability of the material across the 20 hours of irradiation.
Dissolved Organic Carbon and Nitrogen Analyses:
Dissolved organic carbon (DOC) and total dissolved nitrogen (TDN) were
measured for the first series of samples with dilutions used for photo-experiments
before and after irradiation using a Shimadzu TOC-L total organic carbon analyzer

103
(Shimadzu Corp. Osaka Japan) (Table 4-2). It was not possible to sample consistently
during irradiation due to changes in sample volume and the subsequent change in
photo-kinetics.
Statistical Analysis
Data for each sample were further corrected for Raleigh scattering using
MATLAB 2018b (MathWorks, Natick, MA,USA). The DREEM tutorial in MATLAB for
parallel factor analysis (PARAFAC) was then used to determine PARAFAC components
for each sample run (Murphy et al., 2013). After number of components were chosen
using core consistency values, peak picking, and sum of squares values, split validation
was performed to authenticate each model. PARAFAC was rerun with EEMs for
individual irradiation experiments as an extra validation process. Components
generated for A. germinans and J. roemerianus individual PARAFAC models were
consistent with the overall model, although degradation rates for samples in each of the
experiments varied (Fig. 4-9 & 4-10; Table 4-1 & A-6). Components generated for T.
distichum were variable between DI and saltwater treatments as well as within the
saltwater treatments and each of the spectra and contour plots are shown (Fig. 4-11).
Components were identified through various sources (see Table 4-1) or were matched
within the Openfluor Database if not already identified (Murphy et al., 2014).
Additionally, Fmax values for PARAFAC analyses were used to calculate average %
change in fluorescence over the 20-hour irradiation period in all components (Table 4-
4).
Changes in Optical Properties:
Absorbance and differential absorbance curves were graphed to observe
changes in absorbance across wavelengths over time (Fig. 4-2 & 4-3). Wavelengths

104
a(254) and a(300) were chosen because all samples displayed the largest absolute
differences in fluorescence intensity within this excitation range. In addition, a(245) is
indicative of % aromaticity, and a(300) is amongst the most energetic wavelengths that
reach the Earth’s surface (Weishaar et al., 2003). Optical property changes were
monitored for absorption coefficients at a(254) and a(300), normalized to T=0, and
visualized in R (Ver 3.5.2, R Foundation for Statistical Computing, Vienna Austria), over
the 20-hour irradiation interval (Fig. 4-4 & 4-5). Fmax values generated from PARAFAC
analysis were also normalized to T=0 and visualized in R (Fig. 4-12).
Data used to generate curves for a(254) and a(300) were also used to calculate
average % change in absorbance across 20 hours of irradiation (Table 4-3).
Results
Absorbance curves at a(254), a(300)
Absorbance curves displayed a visible difference between species and water
treatment across the entire measured spectrum a(230-700). Differential absorbance
over time exhibited the largest absolute changes in absorbance primarily between
a(250-400) (Fig. 4-3). A. germinans DOM displayed largest decrease in absorbance
between wavelengths a(300-350) in freshwater and a(350-400) in saltwater , but
A.germinans appeared to degrade more rapidly in the higher salinity samples between
a(350-500) than in freshwater diluted DOM (Fig. 4-3 A & B). In the visible wavelengths
a(400-700), freshwater diluted A.germinans DOM does not show a decrease in
absorbance over time, whereas the saltwater diluted A.germinans DOM continues to
degrade across those wavelengths. J. roemerianus DOM displays a similar trend to A.
germinans but J. roemerianus shows a lower overall change in absorbance (Fig. 4-3C &
D). Taxodium distichum diluted in DI water appeared to be absorbing light across the

105
entire spectrum throughout the 20 hour irradiation period, but this is only true for a(250-
350) for the more fresh samples and the change appears to be less pronounced in
seawater (Fig. 4-3E & F).
Specifically, at a(254), at which all species appear to show photo-reactivity,
differences were apparent between freshwater and saltwater diluted treatments (Fig. 4-
4). Each irradiation experiment for A. germinans showed a unique trend in degradation
rate and % loss over time (Fig. 4-4A). A. germinans freshwater diluted samples at
a(254) increased 0.64% (SD = 2.77%) over 20 hours of irradiation and saltwater diluted
samples decreased by 0.44% (SD = 6.15%, Table 4-3). J. roemerianus displayed more
consistency between replicates, and freshwater diluted samples decreased in
absorbance by 5.3% (SD = 1.16%) and saltwater diluted samples decreased by 10.93%
(SD= 0.46% ; Fig. 4-4B; Table 4-3). T.distichum revealed the largest difference between
the DI diluted and saltwater diluted samples, and DI diluted samples did not degrade
over the 20-hour irradiation time (Fig. 4-4C). T. distichum diluted in freshwater
increased in absorbance at a(254) by 22.58% (SD = 2.00%) and T. distichum diluted in
seawater decreased in absorbance by 3.58% (SD = 1.45%; Table 4-3).
At a(300), A. germinans and J. roemerianus presented more consistency
between DI and saltwater replicates (Fig. 4-5A & B; Table 4-3). Absorbance in both
species in DI and seawater diluted samples decreased over the 20-hour interval.
Freshwater diluted A. germinans decreased in absorbance by 17.66% (SD = 1.00%) at
a(300), and saltwater diluted A. germinans decreased by 15.15% (SD = 4.34%). J.
roemerianus seawater samples decreased at a more rapid rate with a total % loss of
18.54% (SD = 0.35%), whereas freshwater samples only lost 12.97% (SD = 0.88%)

106
absorbance at a(300). T. distichum displayed a similar effect at a(300) as a(254),
freshwater diluted samples increasing by 30.48% (SD = 0.75%) in absorbance at a(300)
and saltwater samples decreased in absorbance by 2.61% (SD = 0.54%) over the entire
20 hour interval (Fig. 4-5C; Table 4-3).
HIX decreased in all species across irradiation time (Fig. 4-13). J. roemerianus
displayed the highest humification index that ranged from approximately 0.84 pre-
irradiation to approximately 0.73 post-irradiation. A. germinans and T. distichum had a
similar range between 0.15 and 0.35. T. distichum was primarily the only species that
showed a clear difference between salt and DI (fresh) treatments with salt increasing in
HIX until 5 hours and then decreasing the remainder of the irradiation period, whereas
DI treatments decreased initially until 10 hours and increased for the remainder of the
irradiation period. HIX is generally indicative of humification, but since this study is
based on from DOM leachates it is used as an observation of stabilization of DOM.
Fluorescence, PARAFAC, and component degradation curves
Fluorescent properties of A. germinans, J. roemerianus, and T. distichum were
unique to each species. All three species displayed diverse patterns of fluorescence
and photo-degradation as displayed by EEMs (Fig. 4-6- 4-8). PARAFAC analysis
resulted in the generation of three components for each species, A. germinans and J.
roemerianus yielding the same components across treatments and T. distichum
producing slightly different compilations of components between DI and saltwater
treatments and between saltwater replicates (Fig. 4-8- 4-10). PARAFAC analysis for all
treatments in A. germinans resulted in C1 is amino acid-like, C2 is UVA humic-like, and
C3 is terrestrial humic-like (Table 4-1). PARAFAC analysis for all treatments of J.
roemerianus resulted in C1 is humic-like C peak, C2 is Tryptophan-like, and C3 is

107
humic-like. PARAFAC analysis for both DI diluted replicates of T. distichum resulted in
C1 is fulvic acid FA-MVI, C2 is UVA humic-like, and C3 is humic-like. T. distichum
saltwater diluted replicate 1 irradiation experiment resulted in C1 is terrestrial humic-like,
C2 is Tryptophan-like, and C3 is marine humic-like, and T. distichum saltwater diluted
components were C1 is fulvic acid FA-MVI, C2 is Tryptophan-like, and C3 is UVA
humic-like.
The percent change in Fmax over the irradiation interval varied between species
and components (Table 4-4). In freshwater diluted A. germinans, average Fmax for C1,
C2, and C3 decreased by 3.6% (SD = 7.29%), 34% (SD = 3.5%), and 69% (SD = 65%).
In saltwater treated A. germinans, average Fmax increased for C1 by 0.6% (SD =
10.88%), and average Fmax decreased in C2 and C3 by 41.63% (SD = 4.19%) and
76.57% (SD = 0.13%). Freshwater treatment of J. roemerianus C1 and C3 decreased
by 25.25% (SD = 1.34%) and 68.6% (SD = 0.16%), but C2 increased by 11.04% (SD =
3.86%). Saltwater treated J. roemerianus C1 and C3 also decreased by 40.31% (SD =
1.28%) and 78.31% (SD = 0.81%), and C2 also increased by 3.41% (SD = 2.41%). T.
distichum freshwater diluted samples C1, C2, and C3 all decreased by 20.23% (SD =
1.37%), 43.12% (SD = 1.16%), and 66.88% (SD = 4.49%). T. distichum saltwater
treatments % change in components Fmax were not averaged due to differences in
PARAFAC components outlined above. First replicate T. distichum saltwater diluted
samples C1 and C2 decreased by 39.40% and 26.87% and C3 increased by 1.91%.
Second replicate T. distichum saltwater diluted samples C1, C2, and C3 decreased by
60.62%, 78.94%, and 48.66% over 20 hours of irradiation.

108
Dissolved Organic Carbon and Total Dissolved Nitrogen
DOC and TDN values were highest before irradiation in T. distichum leachate
(DOC = 52.30 mgL-1, TDN = 0.49 mgL-1), which was nearly double J. roemerianus and
A. germinans leachate at 16.3mgL-1 DOC, 0.92 mg L-1 TDN and 24.57 mgL-1 DOC,
0.80 mgL-1 TDN (Table 4-2). DOC concentration increased in J. roemerianus during
irradiation by almost 20% but decreased in the two other species by 3% in T. distichum
and 6% in A. germinans.
Discussion
Hurricane disturbance transports fresh organic matter into waterways and affects
salinity regimes in a number of ways that can influence dissolved organic matter
characteristics and reactivity. Wind and precipitation are the primary drivers of hurricane
disturbance, which have the power to add large fluxes of organic matter to riverine
systems rapidly and drive seawater further inland into freshwater areas. Photo-
degradation of fresh or normally photo-resistant compounds might occur with hurricane-
induced seawater incursion, since salt can increase photo-reactivity which effects the
structure of humic substances, increasing availability of material to further biotic
degradation (Obernosterer and Benner, 2004). Saline water also more rapidly leaches
organic carbon and nitrogen from vegetation than freshwater (Steele and Aitkenhead-
Peterson, 2013). After hurricane passage, salinity decreases due to runoff that
transports additional large pulses of fresh organic matter into the waterway (Raymond
et al., 2016). Reduced residence times from rapid export of organic matter into
estuarine environments also has the capability to transport more allochthonous
freshwater DOM into saline environments.

109
Increasing salinity positively effects photo-oxidation and degradation rates of
DOM through a series of pathways that are complex and not yet fully understood.
Chloride and bromide ions increase absorbance and increase photo-bleaching in water
samples, as shown in J. roemerianus and A. germinans leachates (Grebel et al., 2009).
However, T. distichum reacted differently, showing increased absorbance intensity
across the 20 hour irradiation period in freshwater samples but not saltwater samples.
Additionally, at least one component of all species displayed some difference in
degradation patterns of fluorescent components between treatments, and the increased
photo-degradation of fluorophores at higher salinities could be due to increases in
reactive oxygen species that form in the presence of salt (Mostofa et al., 2013; Osburn
et al., 2009; Yang et al., 2014a). Also, one study of CDOM absorption loss at 440nm
revealed an absorbance loss of 10-40% with salinity, indicating more rapid photo-
bleaching in saline waters at longer wavelengths (Osburn et al., 2009). Faster photo-
bleaching has also been seen at 350 nm than 250 nm, which supports the faster photo-
bleaching in A. germinans and J. roemerianus at 300nm than at 254 nm (Del Vecchio
and Blough, 2002; Grzybowski, 2000; Osburn et al., 2009). Ecologically, a(300)
representative of UV-B of which 50% reaches the Earth’s surface whereas a(254) is
representative of the aromaticity of the OM but light in this region (UV-C) does not
permeate the Earth’s surface, make a(300) more relevant in nature (Coble, 2007; Shank
et al., 2010b). However, photo-bleaching was 20% higher at 280nm at 0 salinity than
salinity 14 in a conflicting study conducted in the Great Dismal Swamp, indicating
increased resistance to photodegradation in terrestrial derived organic matter with
increasing salinity. This study was conducted on bulk water, containing DOM from a

110
wide variety of sources in a unique system as opposed to solely one species (Minor et
al., 2006a). The intricacies and unique photo-sensitivity of DOM from various sources
exhibit distinct reactions to salinity, demonstrating the complexity of photochemistry and
salinity interactions on chromophore and fluorophore sources (Yang et al., 2014a).
One significant finding from this study is that photo-degradation of primary source
material is species specific. Leachate photo-chemistry has already been established as
seasonally specific due to senesce and seasonal growth patterns of source vegetation,
altering DOM properties and concentration throughout the year (Wheeler et al., 2017).
Variability between species indicates that irradiation studies conducted on whole water
samples do not capture the intricacies and variability that can be present across a study
site, especially riverine/ estuarine systems since species compositions can change
rapidly across the aquatic continuum (Vannote et al., 1980; Webster et al., 2016). For
example, a study examining photo-kinetics of red mangrove (Rhizophera mangle) and
Sargassum spp. leachate observed very different degradation half-lives between the
two species, mangrove leachate half-lives varying by senescence from <50 hrs (brown
leaves- late senescence) and 60-90 hours (yellow-orange- early senescence), and
Saragassum leachate exhibiting less variability and a half-life of < 40 hours (Shank et
al., 2010b). Additionally, a study exploring photochemical properties of water, soil
leachate, and vegetation leachates from sawgrass (Cladium jamaicense), spikerush
(Elocharis cellulosa), red mangrove, and one species of seagrass (Thalassia
testudinidum) discovered a large difference in photo-reactivity after 7 days of irradiation,
exhibiting higher photo-reactivity of soil and vegetative leachates than bulk water (Chen
and Jaffé, 2014). Results of these studies necessitate further PARAFAC analysis on

111
DOM from specific vegetation or soil types in order to aid researchers in identifying
specific source material in bulk water samples.
Across the most explored and reactive wavelengths in the UV region and the
components generated from the PARAFAC analysis, clear differences are observed
between species. Although all leachate types and treatments were most reactive in the
lower wavelengths a(250-400), there were apparent differences in absorbance and
fluorescence spectra (Fig. 4-3, 6-8). Additionally, none of the primary components were
the same across species, as C1 for A. germinans was “amino-acid like”, J. roemerianus
was “humic-like”, and T. distichum was variable with either “fulvic acid-like” or “terrestrial
humic-like”. It is important to note is that “humic-like” is a term used generally in
PARAFAC analyses to describe humic substances within a wide range of excitation and
emissions wavelengths (Ex: 260, 350, Em: 380-460, 420-480, Coble et al., 1996). Since
humic material is much more degraded and mature than fresh leachate, it is unlikely
that this fresh DOM is humic. Other fluorophores from marine environments and sulfate
reducers have been shown to fluoresce in this region, indicating other possibilities
besides strictly humic-like structures in this fluorescent region (Luek et al., 2017; Zhao
et al., 2017). However, in order to compare across this study and others, the term
“humic-like” is still used in this manuscript as an indication of the differences or
similarities to other PARAFAC models, and humification index was explored in order to
look at stability and reactivity of the species specific DOM. Humification index was seen
to differ between DI and salinity treatments, and after 20 hours of irradiation T.
distichum leachate HIX had decreased by approximately 15%. This suggests that T.

112
distichum dominated wetlands, or potentially freshwater wetlands overall, might be
susceptible to periods of heightened photo-degradation after a hurricane event.
Although differences in components were seen across species, only T. distichum
clearly revealed differences in primary source material leached in DI as opposed to
saltwater. A. germinans and J. roemerianus inhabit saline environments and likely
chemically and biologically adapted to survive in these environments (Liang et al., 2008;
Touchette, 2006). Potentially, due to these adaptations, these two species are more
resistant to effects of saltwater during leaching and irradiation. A. germinans can grow
in soil salinities up to 90 psu and has thick, waxy leaves that directly excrete salt from
the plant, indicating a level of tolerance and resistance to salinity-induced breakdown
(Liang et al., 2008; Suárez and Medina, 2005). T. distichum is non- halophytic and
therefore this species may not have the adaptations to prevent further leaching and
degradation with increasing salinity (Thomas et al., 2015). T. distichum is not
considered to have the ability to exclude salt ions, excrete salt through leaves, or
compartmentalize them in cell vacuoles like halophytes (Allen et al., 1996).
T. distichum leached twice as much DOC as A. germinans and J. roemerianus
before irradiation. DOC composition was likely polyphenolic in nature due to
fluorescence in the “humic-like” range and resemblance of optical properties typically
observed in surface waters that photo-degrade more rapidly in the environment
(Obernosterer and Benner, 2004). Interestingly, this only appears to happen when T.
distichum is irradiated in saline conditions. Furthermore, none of the leachates
displayed more than a 6% decrease in DOC over the 20 hour irradiation period, which
suggests that irradiation is destroying the chromophores and causing photo-bleaching

113
(incomplete photolysis) instead of completely mineralizing the material in all species.
Chromophores and fluorophores degrade more readily in light than bulk DOC (Ma and
Green, 2004; Moran et al., 2000). Since T. distichum freshwater leachate continues to
absorb light over 20 hours of irradiation, the minimal decrease in DOC is likely due to a
total lack of photo-degradation. It is likely that at longer irradiation periods, T. distichum
will begin to photo-degrade and DOC will be mineralized, but it is difficult to speculate
on the timespan it will take to see similar % losses in absorbance (and possibly
fluorescence) without further data.
Conclusion
As the field of spectroscopy grows, there are increasing numbers of studies on
the photo-kinetics, photo-degradation, and photo-transformation of organic matter in
natural systems. PARAFAC is a key analysis used to break down the resulting
fluorescence EEMs, and glean information on the appearance of the primary structures
of DOM. However, previous studies have primarily focused on the photochemistry of
bulk DOM, and few have looked at the individual constituents of the organic matter
themselves. This study suggests that individual DOM sources will vary in reactivity to
light, indicating a lack of understanding about the contribution of each constituent to the
photoreactive DOM pool. Additionally, the differences in morphology of plant species
may enable certain species resist photo-degradation under disturbed conditions, such
as during saline intrusion from hurricanes and sea level rise. However, freshwater
species that do not have these adaptations may be more susceptible to photo-
degradation and oxidation, although further research on freshwater species at various
salinity concentrations is needed to better understand these processes. In conclusion,
there is a lot of intriguing knowledge to be gained from the investigation of the

114
photochemical properties of natural organic matter, but a lot of work must be done to
further develop the field and improve the tools and models that exist.

115
Table 4-1. Components resulting from PARAFAC analysis of irradiation leachate samples, including citations for studies that originally interpreted the peak or source that appeared closest to the indicated model in the Open-Fluor system (Murphy et al., 2014).
Species DI/ Salt
Dilution
Component Ex/Em Max Ex/ Em Max
Reported
Range
Citation Probable
Sources
Avicennia
germinans
DI& Salt C1 ex.250, em.
315
open-fluor
match(1/19)
(Catala et al., 2015) amino acid-
like
Avicennia
germinans
DI& Salt C2 ex.304,
em.422
ex. 290-
325(<250), em. 370-430
(Coble et al., 1998;
Fellman et al., 2019; Parlanti et al., 2000)
UVA humic-
like
Avicennia
germinans
DI& Salt C3 ex.380,
em.508
open-fluor
match (1/1)
(Coble, 1996; Liu et al.,
2019)
terrestrial
humic-like
Juncus
roemerianus
DI& Salt C1 ex.250, em.
420
open-fluor
match (1/60)
(Baker, 2001; Coble,
1996, 2007; Coble et al.,
1998; Jørgensen et al.,
2011; Stedmon et al.,
2011)
Humic-;ole
C peak
Juncus
roemerianus
DI& Salt C2 ex.280, em.
340
ex. 270-280
(<240), em.
330-368
(Coble et al., 1990,
1998; Fellman et al.,
2019; Parlanti et al., 2000)
Tryptophan-
like
Juncus
roemerianus
DI& Salt C3 ex. 268, em.
508
open-fluor
match (1/36)
(Chen et al., 2018a) humic-like
Taxodium
distichum
DI C1 ex. 275, em.
320
ex. 275, em.
320
(Sierra and Giovanela,
2005)
FA-MVI
(fulvic acid)
Taxodium
distichum
DI C2 ex. 305, em.
425
ex. 290-
325(<250), em.
370-430
(Coble et al., 1998;
Fellman et al., 2019;
Parlanti et al., 2000)
UVA humic-
like
Taxodium
distichum
DI C3 ex. 376, em.
469
open-fluor
match(1/2)
(Wunch et al., 2017) humic-like
Taxodium
distichum
Salt- rep1 C1 ex. 250, em.
415
open-fluor
match (1/14)
(Murphy et al., 2011) terrestrial
humic-like in high nutrient
environment
Taxodium
distichum
Salt- rep1 C2 ex. 280, em.
345
ex. 270-280
(<240), em.
330-368
(Coble et al., 1990,
1998; Fellman et al.,
2019; Parlanti et al.,
2000)
Tryptophan-
like
Taxodium
distichum
Salt- rep1 C3 ex. 265, em.
495
Open-fluor
match(2/3)
(Chen et al., 2018b;
Maie et al., 2007)
Marine
humic-like
Taxodium
distichum
Salt- rep2 C1 ex. 275, em.
320
ex. 275, em.
320
(Sierra and Giovanela,
2005)
FA-MVI
(fulvic acid)
Taxodium distichum
Salt- rep2 C2 ex. 280, em. 345
ex. 270-280 (<240), em.
330-368
(Coble et al., 1990, 1998; Fellman et al.,
2019; Parlanti et al.,
2000)
Tryptophan-like
Taxodium
distichum
Salt- rep2 C3 ex. 315, em.
430
ex. 290-
325(<250), em.
370-430
(Coble, Green, Blough,
& Gagosian, 1990;
Fellman, Hood, &
Spencer, 2019; Parlanti,
Woè, Geoffroy, &
Lamotte, 2000)
UVA humic-
like

116
Table 4-2. Dissolved organic carbon and total dissolved nitrogen concentrations in freshwater leached vegetation diluted to concentrations used for the photolytic experiments before and after 20 hours of irradiation.
Sample
Hours of Irradiation DOC (mg L-1) SD TDN (mg L-1) SD C/N
Juncus roemerianus 0 16.3 0.36 0.92 0.02 18
Juncus roemerianus 20 19.6 0.23 1.05 0.02 19
Taxodium distichum 0 52.3 0.38 0.49 0.02 106
Taxodium distichum 20 50.6 0.38 0.49 0.04 103
Avicennia germinans 0 24.6 0.27 0.80 0.04 31
Avicennia germinans 20 23.1 0.19 0.64 0.02 36
Table 4-3. Average % loss or gain of absorbance at a(254) and a(300) over the 20-hour
irradiation period.
Sample λ Ave. % Change SD
A. germinans fresh 254 0.64 2.77
A. germinans salt 254 -0.44 6.15
J. roemerianus fresh 254 -5.30 1.16
J. roemerianus salt 254 -10.93 0.46
T. distichum fresh 254 22.58 2.00
T. distichum salt 254 -3.85 1.45
A. germinans fresh 300 -17.66 1.00
A. germinans salt 300 -15.15 4.34
J. roemerianus fresh 300 -12.97 0.88
J. roemerianus salt 300 -18.54 0.35
T. distichum fresh 300 30.46 0.75
T. distichum salt 300 -2.61 0.54
Table 4-4. Average % loss or gain of maximum fluorescence over the 20-hour
irradiation period. Components for salt treatment T. distichum are not averaged since the components are not the same between runs.
Sample Component Ave. % Change SD
A. germinans fresh C1 -3.61 7.29
A. germinans fresh C2 -33.84 3.52
A. germinans fresh C3 -68.99 5.71
A. germinans salt C1 0.60 10.88
A. germinans salt C2 -41.63 4.19
A. germinans salt C3 -76.57 0.13
J. roemerianus fresh C1 -25.25 1.34
J. roemerianus fresh C2 11.04 3.86
J. roemerianus fresh C3 -68.60 0.16

117
Table 4-4. cont.
Sample Component Ave. % Change SD
J. roemerianus salt C1 -40.31 1.28
J. roemerianus salt C2 3.41 2.14
J. roemerianus salt C3 -78.37 0.81
Taxodium distichum fresh C1 -20.23 1.37
Taxodium distichum fresh C2 -43.12 1.16
Taxodium distichum fresh C3 -66.88 4.49
Taxodium distichum salt1 C1 -39.40 NA
Taxodium distichum salt1 C2 -26.87 NA
Taxodium distichum salt1 C3 1.91 NA
Taxodium distichum salt2 C1 -60.62 NA
Taxodium distichum salt2 C2 -78.94 NA
Taxodium distichum salt2 C3 -48.66 NA
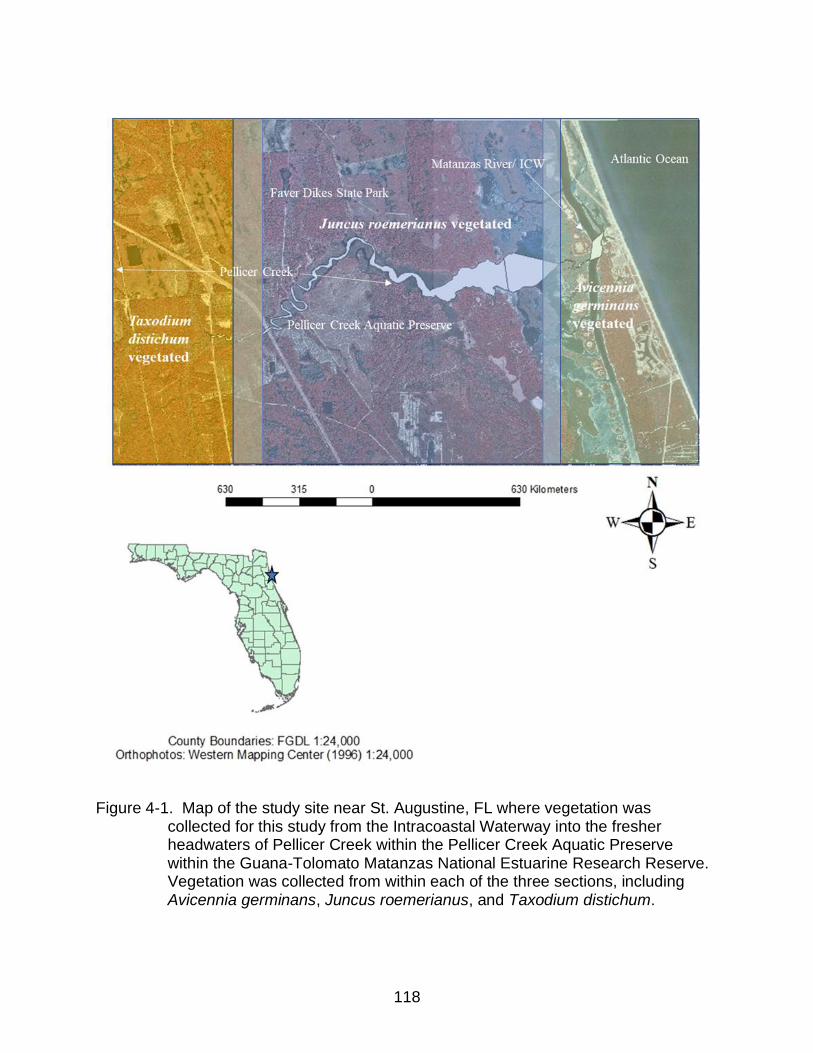
118
Figure 4-1. Map of the study site near St. Augustine, FL where vegetation was
collected for this study from the Intracoastal Waterway into the fresher headwaters of Pellicer Creek within the Pellicer Creek Aquatic Preserve within the Guana-Tolomato Matanzas National Estuarine Research Reserve. Vegetation was collected from within each of the three sections, including Avicennia germinans, Juncus roemerianus, and Taxodium distichum.
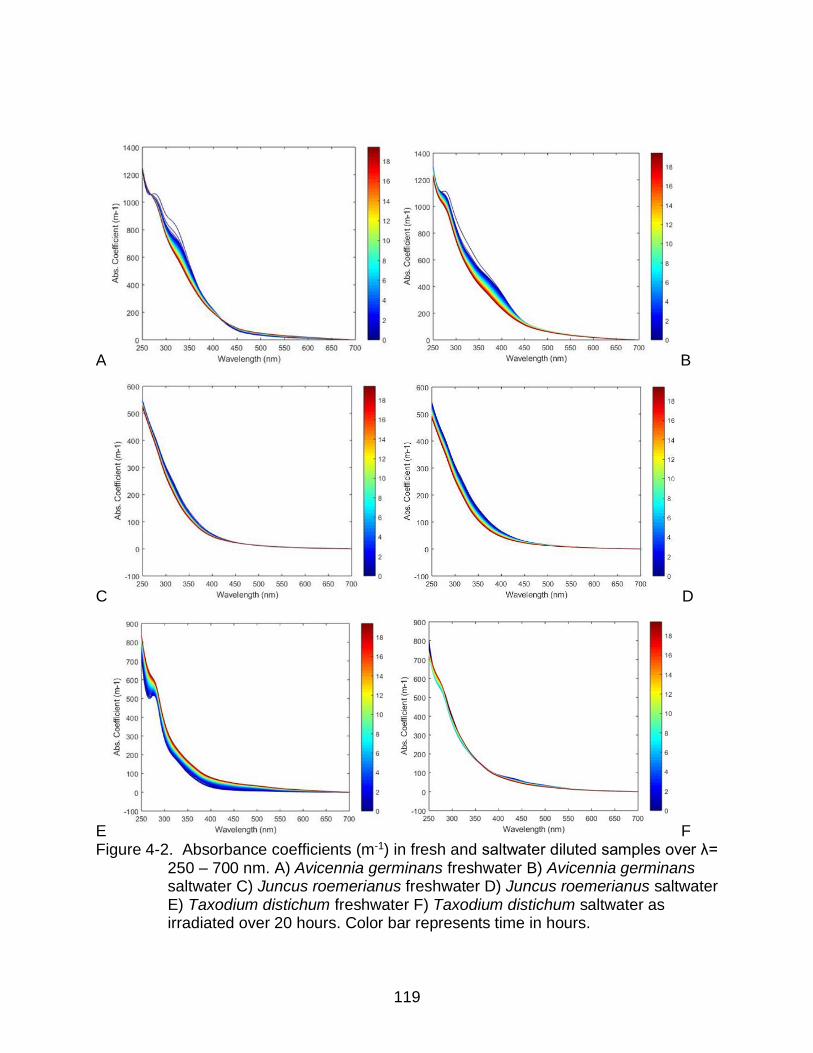
119
A B
C D
E F Figure 4-2. Absorbance coefficients (m-1) in fresh and saltwater diluted samples over λ=
250 – 700 nm. A) Avicennia germinans freshwater B) Avicennia germinans saltwater C) Juncus roemerianus freshwater D) Juncus roemerianus saltwater E) Taxodium distichum freshwater F) Taxodium distichum saltwater as irradiated over 20 hours. Color bar represents time in hours.
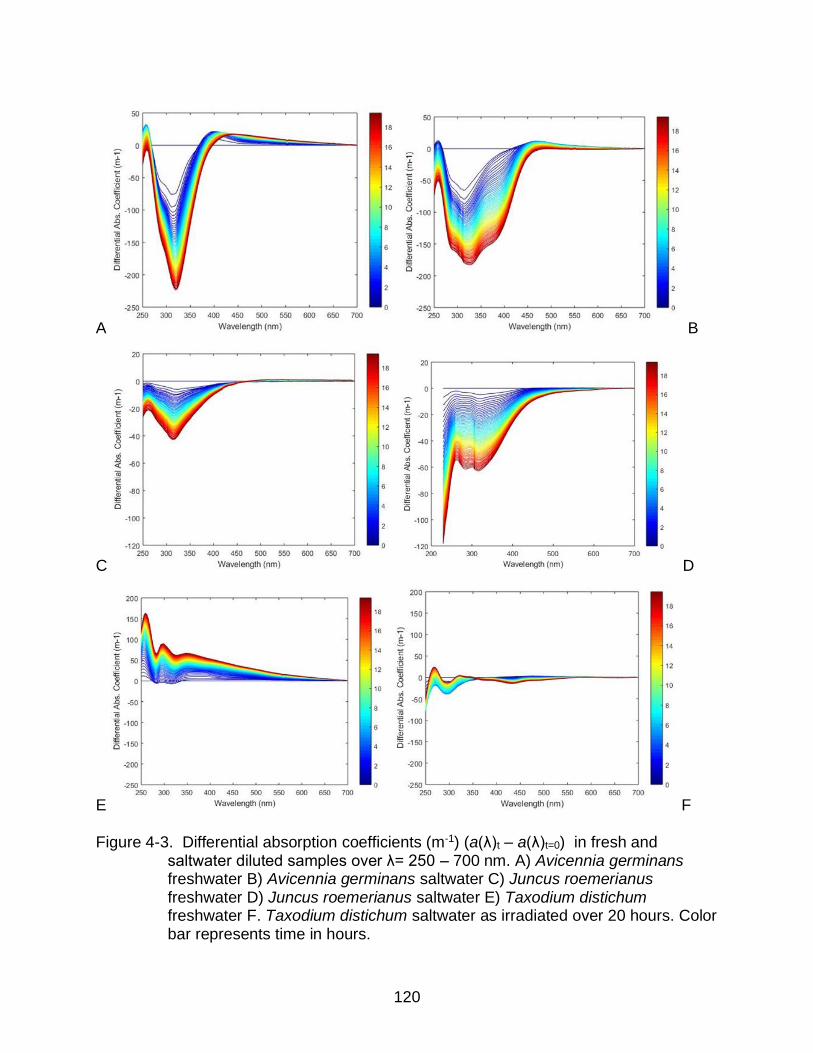
120
A B
C D
E F
Figure 4-3. Differential absorption coefficients (m-1) (a(λ)t – a(λ)t=0) in fresh and
saltwater diluted samples over λ= 250 – 700 nm. A) Avicennia germinans freshwater B) Avicennia germinans saltwater C) Juncus roemerianus freshwater D) Juncus roemerianus saltwater E) Taxodium distichum freshwater F. Taxodium distichum saltwater as irradiated over 20 hours. Color bar represents time in hours.

121
A B
C
Figure 4-4. Decay curves and replicates for A) Avicennia germinans, B) Juncus roemerianus, and C) Taxodium distichum freshwater and saltwater irradiation experiments at wavelength 254 normalized for T0.

122
A B
C
Figure 4-5. Decay curves and replicates for A) Avicennia germinans, B) Juncus
roemerianus, and C) Taxodium distichum freshwater and saltwater irradiation experiments at wavelength 300 normalized for T0.

123
A
B Figure 4-6. EEMS depicting Avicennia germinans leachate fluorescence before and
after irradiation. A) Leachate diluted with deionized water. B) Leachate diluted with sterilized seawater.

124
A
B Figure 4-7. EEMs depicting Juncus roemerianus leachate florescence before and after
20 hours of irradiation. A) Leachate diluted with fresh water. B) Leachate diluted with saltwater.

125
A
B Figure 4-8. EEMs depicting Taxodium distichum leachate fluorescence before and after
20 hours of irradiation. A) Leachate diluted with deionized water. B) Leachate diluted with sterilized sea water.

126
A
B Figure 4-9. Avicennia germinans components. A) Spectral loadings. B) Contour plots

127
A
B Figure 4-10. Juncus roemerianus components. A) Spectral loadings. B) Contour plots

128
A
B
C Figure 4-11. PARAFAC components for Taxodium distichum split validated spectra for
A) freshwater diluted samples B) saltwater replicate 1 sample C) saltwater replicate 2 sample.
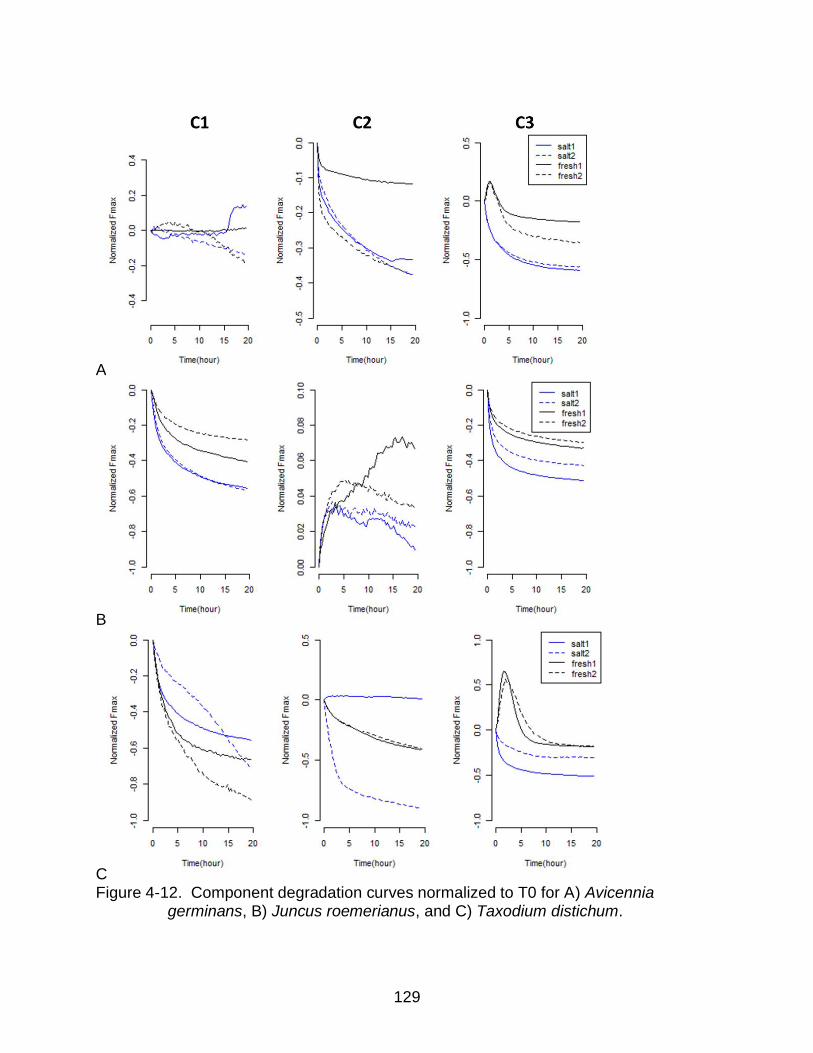
129
A
B
C Figure 4-12. Component degradation curves normalized to T0 for A) Avicennia
germinans, B) Juncus roemerianus, and C) Taxodium distichum.

130
A B
C Figure 4-13. Humification index of A) Avicennia germinans, B) Juncus roemerianus,
and C) Taxodium distichum species in DI and saltwater.

131
CHAPTER 5 SYNTHESIS
According to the latest International Panel for Climate Change report, hurricane
frequency and intensity is likely to increase as global temperatures continue to rise
(Masson-Delmotte et al., 2018). Massive inputs of organic matter due to hurricane-
induced runoff can alter salinity regimes, eutrophy coastal aquatic systems, increase
biological oxygen demand, and lower DO for extended periods (Statham, 2012).
Conversely, hurricanes can flush excess nutrients and toxins out of wetlands and
waterways, and although there is conflicting evidence, hurricanes may promote
successional processes (Majidzadeh et al., 2017; Paerl et al., 2018; Xi et al., 2019).
Disturbance from hurricanes can therefore have positive or negative implications for
coastal aquatic systems.
Storm surges from hurricanes Matthew and Irma (and to a lesser extent Dorian)
caused a saltwater wedge to move inland into Pellicer Creek, temporarily increasing
salinity levels (Fig. 5-1). Salinization released ammonium and other ions from soils and
increased leaching rates from vegetative material that increased available nutrient
concentrations in the waterway (Chambers et al., 2014; Zhou et al., 2017). These
concentrations were added to already elevated levels from terrestrial runoff, spurring
biotic and abiotic organic matter processing. A prominent abiotic degradation process,
photodegradation, occurred more rapidly with salinization. Runoff progressively adds
more fresh organic matter inputs as the storm surge and peak of the hurricane passes
and freshwater pushes the salt wedge out of the system. As this point, microbial
transformation and assimilation increases, rapidly increasing biological oxygen demand
as available oxygen is depleted (Avery et al., 2004a; Yang et al., 2013). The excess

132
nutrients increase community respiration, and net ecosystem metabolism becomes
more heterotrophic (Hoellein et al., 2013; Odum, 1956). The heterotrophic conditions
are consistent with high allochthonous inputs of organic matter and added turbidity that
persists for days post-hurricane, increasing organic matter export and altering
biogeochemical and metabolic characteristics for weeks to months post-storm. The
extent of these alterations to the waterway are dependent on the antecedent conditions,
hurricane category (and associated wind speed), storm surge, and precipitation. Wet
hurricanes, like Irma, increase nutrient and carbon export for extended time periods,
especially if the landscape is already saturated pre-storm. Drier hurricanes, like Dorian,
might not have the same scale of impact (Paerl et al., 2018).
The objectives of this research were focused on determining the impacts of
hurricanes on water quality, biogeochemistry, photochemistry in blackwater river-
estuarine aquatic continuums and to gain an understanding of how hurricane
disturbance differs from that of other storm systems. In order to address the primary
objective of determine how hurricanes alter DOM cycling along a blackwater river-
estuary aquatic continuum, the following objectives were addressed and summarized in
this work:
• Objective 1, Chapter 2: Monitor water quality in situ to determine short-term
alteration of system from pre-hurricane conditions. Salinity and DO peaked and
then decreased greatly across the study site during Hurricane Irma. Turbidity
increased as well and drove down chl-a concentrations. The monitored sites
changed rapidly during the hurricane and slowly started to return to pre-storm
conditions days (estuary) to weeks (freshwater) post-hurricane.

133
• Objective 2, Chapter 2: Analyze water samples over 3-month interval to examine
system resilience to hurricane impact. DOC concentrations steeply decreased in
upstream areas and increased in downstream areas as Hurricane Irma passed
through the system. Altered DOC concentrations persisted over the 3-month
interval (assisted by a nor’easter 1-month post-storm) and began to return to pre-
storm conditions near the end of the 3-month study. Phosphorus and iron
concentrations were diluted or exported during the hurricane and then returned to
pre-storm concentrations near the end of the study, The return (or imminent
return) of these concentrations to pre-hurricane conditions is a sign of resiliency
in this system to disturbance.
• Objective 1, Chapter 3: Calculate export of DOM from hurricanes and compare to
other precipitation events. Analysis of storm (precipitation) groups determined
based on monthly values show no significant differences in export of DOC,
ammonia-N, SRP, nitrate-N, or TKN between low precipitation (< 50 mm), high
precipitation (> 150 mm), or hurricane (3 events) months at the study site. This
indicates a similar input/ export of DOM on longer-term (monthly) intervals for all
precipitation events.
• Objective 2, Chapter 3: Determine how export from precipitation events and
hurricanes effect net ecosystem metabolism. Net ecosystem metabolism was
significantly more heterotrophic during hurricane months than low or high
precipitation months. These differences were likely due to increased turbidity and
BOD driving up community respiration and lowering primary productivity.

134
• Objective 1, Chapter 4: Determine differences in photo-degradation patterns of
source material collected from dominant vegetation types along an aquatic
continuum. DOM created from Avicennia germinans, Juncus roemerianus, and
Taxodium distichum showed very different structural properties when irradiated
and analyzed through PARAFAC analysis. These findings show the importance
of looking at specific source material instead of only bulk water samples to
understand the intricacies of photochemical properties.
• Objective 2, Chapter 4: Examine how salinity changes caused by hurricane
events will alter photochemical properties. Salinity increased photodegradation
more greatly in Taxodium distichum DOM indicating a possibility that fresh-water
vegetation that is not already adapted to saline environments might be much
more readily degraded in saline conditions than Avicennia germinans or
Taxodium distichum that are already adapted to estuarine environments.
Objectives from ch.2 and ch.3 tie very closely together. Chapter 2 observes the
impacts of one specific hurricane event with high resolution (15 min in situ water quality
sampling- weekly water sampling) and documents the resiliency of the study site.
Chapter 3 goes one step further and incorporates lower resolution data (monthly water
sampling) to look beyond Irma and examine how all three hurricane events that have
affected St. Augustine in the past 5 years impact the study site. Additionally, how do
these hurricanes overall compare to other storm systems that are extremely common in
Florida and affect biological systems and biotic functions (ecosystem metabolism).
Chapter 4 then takes a very close look at one abiotic mechanism of degradation that
affects waterway chemistry during- after a hurricane event when organic matter from

135
vegetation enters the waterway and is broken down and exposed to saline water as
storm surge enters the freshwater environment and then transports fresh organic matter
downstream. The common link between all these objectives is the hurricane disturbance
across an aquatic continuum and each chapter examines a part of what is happening
when this type of disturbance is impacting our waterways.
Scientists have been researching the environmental impacts of hurricanes since
before meteorologist William C. Redfield recognized them for what they were in an 1831
article in the Journal of Science and Arts. Dr. Redfield provided evidence from tree falls
to determine that hurricanes are circular in nature and rotate counter-clockwise
(Redfield, 1831). Therefore, the field of hurricane research is not exactly new, but it has
improved greatly with technology in that last two centuries. Additionally, as more is
understood about hurricane-related disturbance, it becomes clear that there is still a lot
that scientists do not yet know. Part of this issue is related to the unique qualities
associated with every hurricane (and storm in general), that will create differing
ecological, chemical, and physical implications for the area of impact. Hurricanes can
cause a storm surge that adds a massive amount of water to a coastal area or create a
negative surge that picks up a giant mass of water (Xie et al., 2011). Hence, it is
extremely difficult to make many assumptions across these events.
However, by continuing to monitor as many characteristics of these storms as
possible and collaborations between the fields of meteorology, biogeochemistry,
ecology, and climate modelling might lead to a better understanding of the potential of
these storms to impact the environment and humanity. There are many studies from
each of these fields of research individually, but more collaborative work might help to

136
correlate hurricane properties with their effects on environmental variables. This could
aid in predictive research on hurricane impacts as well as figure out ways to lessen the
effects or prepare for restoration effects post-event.
Disturbance can be helpful or destructive and the only way to understand the
intricacies and implications of disturbance events and is to continue to experiment and
make observations. The research in this dissertation explores just a few aspects of
hurricane and storm impacts in one type of system. This system can be used as a
model for other blackwater river-estuarine systems and will hopefully add to the pool of
knowledge about hurricane impacts on waterways that can be useful in the future. As
mentioned many times in this work, hurricanes are expected to become even more of a
nuisance in the future, so it is important to try to understand as much as possible now.

137
A
B Figure 5-1. Aquatic continuum diagrams depicting A) biogeochemical effects during a
hurricane. B) Effects across the aquatic continuum post-hurricane.

138
Figure 5-2. Diagram developed at the end of the dissertation connecting the chapters
(blue), processes (yellow), and parameters (green) addressed in this thesis.

139
APPENDIX A SUPPLEMENTARY INFORMATION FOR CHAPTER 2
Table A-1. Minimum detection limits for analytes discussed in this study.
Analyte MDL
Cd 0.2
Cu 0.05
Fe 0.05
Mo 0.2
Pb 0.1
Zn 0.05
P 0.02
Figure A-1. Pellicer Creek (near Esponola, Florida) tidally filtered discharge volume
pre- and post- Hurricane Irma (unpublished data, United State Geologic Survey).

140
Figure A-2. Measured concentrations for dissolved organic carbon at four locations
where water samples were collected across the study site (refer to fig. 2-1). Dark grey bar represents the period where the hurricane was directly passing through the area of study.

141
APPENDIX B SUPPLEMENTARY INFORMATION FOR CHAPTER 3
Soil cores were taken along Pellicer Creek from a Juncus roemerianus
dominated marsh (Juncus site) surrounding the study site (Fig. A-3), freshwater cores
were taken in a freshwater sawgrass marsh approximately 3 km upstream (FW site),
and in a wetland fragment consisting on the edge of a Pinus spp. plantation (Pine site).
Three 10 cm long, 10 cm diameter cores were collected at each of the soil collection
sites, sectioned by 2 cm, and analyzed for bulk density and organic matter loss on
ignition (LOI) method (Fig. A-4; Sparks 1996). Nine intact 10 cm cores collected in the
field from each site were placed in three buckets receiving a different water treatment.
The three water treatments consisted of DI, salinity 10 psu (artificial low-salinity brackish
water), and salinity 27 psu (artificial high-salinity brackish water). Saline water was
made with DI water and instant ocean (Blacksburg, VA). Three replicates of soil from
each site received one water treatment. All replicates were placed in a bucket, which
was flooded with the same water as the cores in order to create hydraulic pressure and
stop the cores from leaking. Core tubes were covered with punctured parafilm to allow
gas exchange but prevent high levels of evapotranspiration and prevent the salinity
treatments from concentrating. Subsamples were collected at 3 hours, 10 hours, 24
hours, 3 days, 5 days, 7 days, and 9 days. Subsample (30 mL) of water from each soil
core was collected with 60-mL syringes and immediately filtered through 0.45 µm
syringe filters. Subsamples were acidified with one drop of 32 M sulfuric acid for later
analysis. Subsamples were analyzed for DOC on a Shimadzu TOC-L Total Organic
Carbon Analyzer (Colombia, MD, USA). Remaining 20 mL subsamples were sent off to
Analytical Research Laboratories in Gainesville, FL for NH3-N, TKN, and TP on Seal

142
Analytical air segmented continuous autoflow analyzer 3 (Mequon, WI). Dissolved
organic carbon was measured with the Shimadzu TOC-L Total Organic Carbon
Analyzer (Colombia, MD, USA). Data for Juncus and freshwater sites were graphed
using Excel from the Microsoft Office 365 ProPlus package.

143
Table B-1. Storm export (kg day-1) and standard deviation of DOC, ammonia-N, phosphate, nitrate, and nitrite in Pellicer Creek based on monthly sampling between May 2017 and September 2019.
Date Cat
DOC
SD NH3-N
SD SRP SD TKN SD NO3-N
SD NO2-N
SD
5/8/2017 1 3.4 0.93
0.002
0.000
0.000
0.000
0.35 0.11
0.002
0.000
0.001
0.000
5/9/2017 1 5.2 0.34
0.004
0.001
0.000
0.000
0.5 0.06
0.003
0.001
0.001
0.000
12/13/2017
1 120 8.9 0.115
0.038
0.008
0.001
3.4 0.15
0.024
0.009
0.021
0.012
12/14/2017
1 110 12 0.111
0.037
0.009
0.001
3.2 0.08
0.039
0.007
0.013
0.007
2/12/2018 1 100 5.4 0.093
0.044
0.012
0.001
2.8 0.06
0.086
0.015
0.010
0.000
2/13/2018 1 87 6.6 0.111
0.041
0.011
0.001
2.6 0.22
0.076
0.031
0.012
0.008
3/26/2018 1 -0.3 2.65
-0.00
2
0.005
0.000
0.000
-0.02
6
0.19
0.000
0.002
0.000
0.001
3/27/2018 1 9.1 1.28
0.012
0.005
0.001
0.000
0.55 0.08
0.006
0.001
0.003
0.001
2/4/2019 1 92 21 0.053
0.017
0.007
0.002
2.6 0.4 0.018
0.007
0.019
0.010
2/5/2019 1 84 28 0.048
0.016
0.006
0.003
2.5 0.7 0.022
0.010
0.013
0.006
8/12/2019 1 34 11 0.102
0.052
0.005
0.002
1.2 0.19
0.007
0.002
0.012
0.004
8/13/2019 1 35 11 0.129
0.031
0.005
0.002
1.3 0.14
0.010
0.002
0.013
0.004
6/19/2017 2 7.2 0.45
0.019
0.017
0.002
0.001
0.6 0.04
0.003
0.000
0.002
0.000
6/20/2017 2 8 0.44
0.064
0.017
0.002
0.000
0.67 0.07
0.003
0.000
0.002
0.000
8/1/2017 2 9.8 2.1 0.047
0.046
0.002
0.001
0.78 0.11
0.010
0.005
0.003
0.001
8/2/2017 2 12 1.5 0.050
0.024
0.002
0.001
0.77 0.12
0.012
0.004
0.004
0.001
10/16/2017
2 190 25 0.349
0.192
0.032
0.006
5.5 3.2 0.040
0.022
0.072
0.052
10/17/2017
2 180 23 0.469
0.299
0.029
0.004
3.2 3.2 0.050
0.024
0.047
0.038
10/31/2017
2 160 8.3 0.219
0.043
0.016
0.001
5 0.14
0.051
0.012
0.012
0.001
5/28/2018 2 250 5.6 0.092
0.033
0.032
0.002
7.2 0.33
0.105
0.018
0.018
0.000
5/29/2018 2 250 13 0.143
0.072
0.034
0.004
7.9 0.7 0.098
0.021
0.019
0.001
6/11/2018 2 150 13 0.098
0.043
0.017
0.002
4.7 0.3 0.071
0.017
0.018
0.015
6/12/2018 2 140 33 0.108
0.021
0.017
0.004
4.8 0.3 0.083
0.011
0.011
0.000
8/6/2018 2 290 13 0.047
0.005
0.029
0.004
7.8 0.2 0.060
0.011
0.021
0.001

144
Table B-1. cont. Date C
at DOC
SD NH3-N
SD SRP SD TKN
SD NO3-N
SD NO2-N
SD
8/7/2018 2 270 6 0.094
0.024
0.028
0.001
7.2 0.49
0.079
0.010
0.019
0.000
12/3/2018
2 36 8.5 0.044
0.021
0.003
0.001
1.2 0.13
0.381
0.071
0.007
0.001
12/4/2018
2 32 12 0.037
0.039
0.003
0.001
1.2 0.15
0.372
0.091
0.007
0.002
6/3/2019 2 6.6 0.76
0.004
0.000
0.001
0.000
0.6 0.15
0.003
0.000
0.002
0.001
6/4/2019 2 6.9 0.88
0.005
0.001
0.001
0.000
0.8 0.09
0.004
0.000
0.002
0.000
9/18/2017
3 240 0 1.465
0.159
0.043
0.002
9.8 0 0.180
0.000
0.105
0.000
9/10/2019
3 24 7.5 0.052
0.035
0.002
0.001
1 0.09
0.006
0.002
0.006
0.003
9/11/2019
3 18 4.4 0.058
0.009
0.002
0.001
0.83
0.12
0.005
0.002
0.005
0.002
10/6/2016
3 85 22 0.198
0.043
0.144
0.036
3.3 0.53
0.014
0.005
0.023
0.006
Table B-2. Average net ecosystem metabolism (NEM), community respiration (Rt), and gross primary production (Pg), and the associated upper and lower limits. Data was calculated from dissolved oxygen data collected continuously by a YSI data sonde in mmol O2 m-2 day-1.
Date Ave. NEM
Lower NEM
Upper NEM
Ave. Rt Lower Rt
Upper Rt
Ave. Pg Lower Pg
Upper Pg
16-Jan 0.4 11.0 -10.2 -66.9 -50.3 -83.4 67.2 87.1 47.3
16-Feb -12.1 -0.9 -23.4 -62.7 -41.7 -83.8 50.6 69.1 32.2
16-Mar -14.9 -5.2 -24.7 -68.8 -45.8 -91.9 53.9 75.0 32.7
16-Apr -21.8 -10.7 -32.9 -104.8 -72.7 -136.8 83.0 111.3 54.6
16-May -14.0 -2.9 -25.0 -181.3 -131.5 -231.2 167.4 216.7 118.0
16-Jun -17.7 -8.9 -26.5 -140.6 -87.0 -194.1 122.8 174.5 71.2
16-Jul -11.3 -4.4 -18.1 -167.5 -100.0 -235.0 156.3 223.7 88.9
16-Aug -10.7 -1.2 -20.3 -235.0 -194.3 -275.8 224.3 261.9 186.7
16-Sep -6.4 3.0 -15.8 -221.5 -187.2 -255.8 215.1 248.1 182.1
16-Oct -40.0 -19.3 -60.7 -123.2 -91.5 -154.9 83.2 106.2 60.2
16-Nov -14.2 6.6 -35.0 -95.7 -80.3 -111.0 81.5 109.9 53.1
16-Dec -1.6 6.4 -9.6 -77.0 -62.3 -91.8 75.4 90.3 60.6
17-Jan -5.9 6.3 -18.1 -122.5 -95.7 -129.2 106.6 122.5 90.6
17-Feb -15.0 -3.1 -26.9 -106.4 -86.2 -126.7 91.4 112.0 70.8
17-Mar -14.0 -2.3 -25.7 -116.4 -90.7 -142.0 102.4 125.0 79.7
17-Apr -18.5 -11.9 -25.2 -109.8 -67.4 -152.2 91.3 135.3 47.2
17-May -17.5 -4.5 -30.4 -209.7 -164.6 -254.9 192.3 236.5 148.1
17-Jun -17.4 -6.0 -28.7 -187.7 -132.7 -242.7 170.3 225.1 115.5
17-Jul 1.6 42.1 -38.9 -239.5 -149.1 -330.0 241.1 338.5 143.7
17-Aug -19.8 -8.5 -31.2 -189.1 -140.4 -237.8 169.2 221.4 117.1
17-Sep -40.9 -26.6 -55.2 -68.1 -49.1 -87.0 27.2 48.5 5.9

145
Table B-2. cont.
Date Ave. NEM
Lower NEM
Upper NEM
Ave. Rt Lower Rt
Upper Rt
Ave. Pg Lower Pg
Upper Pg
17-Oct -56.7 -33.6 -79.7 -68.9 -42.5 -95.2 12.2 28.7 -4.3
17-Nov -18.4 -9.6 -27.1 -53.1 -36.1 -70.2 34.8 53.7 15.8
17-Dec -9.6 -2.2 -17.0 -29.7 -18.4 -41.1 20.1 34.2 6.1
18-Jan -13.4 -4.1 -22.8 -22.7 -11.8 -33.6 9.2 17.3 1.2
18-Feb -19.1 -12.5 -25.6 -39.3 -29.2 -49.4 20.3 30.1 10.4
18-Mar -5.6 2.0 -13.1 -96.7 -83.3 -110.1 91.1 103.7 78.6
18-Apr -17.6 -10.5 -24.7 -95.0 -69.3 -120.7 77.4 102.2 52.6
18-May -16.9 -11.1 -22.8 -87.8 -64.2 -111.3 70.8 94.5 47.2
18-Jun -14.4 -9.4 -19.4 -51.3 -41.4 -61.1 36.9 46.3 27.5
18-Jul -10.7 -5.4 -15.9 -120.9 -85.5 -156.2 110.2 144.6 75.8
18-Aug -14.7 -10.7 -18.7 -74.6 -56.5 -92.7 59.9 78.5 41.3
18-Sep -10.1 -2.2 -18.7 -170.6 -145.8 -195.3 160.5 186.2 134.8
18-Oct -18.2 -8.6 -27.8 -97.3 -68.5 -126.0 79.1 107.5 50.7
18-Nov -4.2 7.9 -16.2 -71.5 -55.2 -87.8 67.3 87.5 47.2
18-Dec -10.6 -2.6 -18.5 -24.6 -13.5 -35.8 14.1 22.2 5.9
19-Jan -4.6 2.4 -11.5 -10.7 -1.9 -19.5 6.2 14.6 -2.3
19-Feb -18.0 -10.1 -25.9 -21.7 -10.4 -32.9 3.7 12.4 -5.0
19-Mar -11.0 -4.9 -17.1 -55.2 -45.6 -64.9 44.2 52.9 35.6
19-Apr -9.8 -3.0 -16.6 -118.7 -103.5 -133.8 108.9 124.6 93.1
19-May -11.5 -4.4 -18.5 -157.7 128.4 -187.1 146.3 175.7 116.8
19-Jun -7.0 0.6 -14.5 -212.6 -185.7 -239.5 205.6 232.1 179.2
19-Jul -12.2 -5.3 -19.1 -156.6 -108.1 -205.1 144.4 191.5 97.2
19-Aug -15.7 -11.0 -20.3 -110.3 -81.2 -139.3 94.6 122.8 66.4
19-Sep -29.3 12.0 -70.7 -222.0 -150.7 -293.3 192.6 271.5 66.4

146
Figure B-1. Map of soil sampling locations across the study site in three ecosystem types, including a Juncus roemerianus marsh, wetland fragment along a Pinus spp. plantation, and a freshwater site in a Cladium spp. dominated marsh.

147
A
B
Figure B-2. Soil organic matter A) and bulk density B) from three different ecosystem types from around the study site area or upstream, including Juncus roemerianus marsh, small wetland fragment surrounded by Pinus spp. plantation, and freshwater marsh dominated by Cladium jamaicense.

148
A
B
Figure B-3. Leaching of analytes A) DOC and B) NH3-N from the three soil types in DI water, artificial brackish water at 10 psu, and artificial seawater at 30 psu. FW denoted freshwater marsh, Pine denotes wetland fragment near Pinus spp. plantation, and Juncus represents the area near the study site surrounded by Juncus roemerianus marsh.

149
Figure B-4. Total kjeldahl nitrogen leached from the three soil types in DI water, artificial brackish water at 10 psu, and artificial seawater at 30 psu. FW denoted freshwater marsh and Juncus represents the area near the study site surrounded by Juncus roemerianus marsh, the Pine site was not sampled for TKN.

150
A
B
C
Figure B-5. Salinity concentrations at the time of Hurricanes A) Matthew, B) Irma, and C) Dorian. * marks the passage of the hurricane through the study site.

151
APPENDIX C SUPPLEMENTARY INFORMATION FOR CHAPTER 4
Growth or decay curves generated from these analyses were then graphed
separately in the MATLAB 2018b curve fitting toolbox in order to determine best fit for
each curve according to R2 (indicative of model fit in MATLAB not of linearity or Pearson
correlation coefficient), lowest root mean square error (RMSE), and sum of squares
error (SSE) values (Table A-4 – A-6). Primarily, curves of time vs. Fmax were non-linear
when graphed, indicating a double exponential relationship. The following equation
used by other studies to fit labile and semi-labile decay was used to fit the double
exponential curves:
Ft = FLe−kLt + FSLe−kSLt (A-1)
Coefficient F represents fluorescence at time through the decay of labile (L) and semi-
labile (SL) dissolved organic matter at rate constant k (Murphy et al., 2018; Sleighter et
al., 2014; Timko et al., 2015b).
Table C-1. Exponential curves coefficients (Equation 4-1) and R2 values calculated for absorption coefficient changes at a(254) for each sample. M is for Avicennia germinans, J is Juncus roemerianus, C is Taxodium distichum, fresh is DI diluted, and salt is seawater diluted. Adjusted R2, SSE, and RMSE values represent the fit of the full model. *Linear regression was the best fit
Sample FL (1/m) k
L (1/h) F
SL (1/m) k
SL (1/h) Fit type SSE
R-square
Adj. R-square RMSE
Mfresh1 26.63 0.005 -16.540 -1.032 exp2 19.803 0.952 0.949 0.600 Mfresh2 -6.30E+05 0.306 630400.000 0.306 exp2 240.100 0.979 0.978 2.089 Msalt1 12.8 -0.352 2.519 1.758 exp2 1331.000 0.794 0.783 4.919 Msalt2 -4.29E+05 -0.031 429200.000 -0.031 exp2 160.800 0.994 0.994 1.710 Jfresh1 -7.609 0.055 7.486 -0.412 exp2 21.387 0.988 0.987 0.624 Jfresh2* -1.318 -1.318 NA NA Linear 1.531 0.999 0.999 0.164 Jsalt1 -26.63 0.042 26.830 -0.256 exp2 5.457 0.999 0.999 0.315 Jsalt2 -26.41 0.039 24.020 -0.198 exp2 4.291 0.999 0.999 0.279
Cfresh1 128.2 0.097 -9.376 -1.375 exp2 8.899 0.999 0.999 0.402 Cfresh2 160.6 0.002 0.002 -0.512 exp2 96.220 0.999 0.999 1.323 Csalt1 -246.1 -0.131 248.600 -0.243 exp2 93.230 0.991 0.990 1.302 Csalt2 -67.77 -0.039 66.570 -0.298 exp2 25.254 0.993 0.993 0.678

152
Table C-2. Exponential curve coefficients and R2 values calculated for absorption
coefficient decay at a(300) for each sample. M is for Avicennia germinans, J is Juncus roemerianus, C is Taxodium distichum, fresh is DI diluted, and salt is seawater diluted. Adjusted R2, SSE, and RMSE values represent the fit of the full model. *single exponential was best fit
Sample FL (1/m) k
L (1/h) F
SL (1/m) k
SL (1/h) Fit type SSE R-square Adj. R-square RMSE
Mfresh1 -100.2 0.024 94.620 -1.468 exp2 676.955 0.985 0.984 3.477 Mfresh2 -98.71 0.030 96.090 -2.438 exp2 395.557 0.993 0.993 2.658 Msalt1* -91.57 0.130 NA NA exp1 3003.000 0.747 0.743 7.259 Msalt2 -88.52 0.033 83.350 -1.949 exp2 956.757 0.983 0.982 4.133 Jfresh1 -15.09 0.047 13.310 -0.369 exp2 8.450 0.998 0.998 0.388 Jfresh2 -20.84 0.027 19.160 -0.107 exp2 5.162 0.999 0.999 0.304 Jsalt1 -27.47 0.041 25.640 -0.179 exp2 7.750 1.000 0.999 0.372 Jsalt2 -29.51 0.036 26.560 -0.136 exp2 16.936 0.999 0.999 0.550
Cfresh1 74.22 0.013 -82.340 -0.120 exp2 117.247 0.997 0.997 1.447 Cfresh2 -
2.05E+08 -0.023 2.052E+08 -0.023 exp2 209.029 0.996 0.996 1.932 Csalt1 -72.78 -0.114 73.250 -0.513 exp2 116.172 0.980 0.979 1.440 Csalt2 -30.92 -0.089 30.000 -1.028 exp2 53.902 0.972 0.970 0.981
Table C-3. Exponential curve coefficients and R2 values calculated at for PARAFAC
generated components of each sample. M is for Avicennia germinans, J is Juncus roemerianus, C is Taxodium distichum, fresh is DI diluted, and salt is seawater diluted. Adjusted R2, SSE, and RMSE and represent the fit of the full model.
Sample FL (1/m) k
L (1/h) F
SL (1/m) k
SL (1/h) SSE R-square Adj. R-square RMSE
Mfresh1_C1 1.006 0.194 -1.008 0.194 0.000 0.701 0.685 0.003 Mfresh1_C2 -0.083 0.020 0.079 -1.476 0.001 0.976 0.975 0.003 Mfresh1_C3 -1.555 -0.069 1.699 -0.101 0.066 0.877 0.870 0.034 Mfresh2_C1 -6.385E+03 0.089 6.385E+03 0.089 0.011 0.962 0.960 0.014 Mfresh2_C2 -0.243 0.024 0.226 -1.568 0.006 0.978 0.977 0.010 Mfresh2_C3 -2.567E+03 -0.721 2.567E+03 -0.721 0.097 0.926 0.922 0.042 Msalt1_C1 -277.200 0.149 277.100 0.149 0.026 0.875 0.868 0.021 Msalt1_C2 -0.260 0.015 0.201 -0.420 0.009 0.969 0.967 0.013 Msalt1_C3 -0.494 0.010 0.457 -0.431 0.004 0.996 0.995 0.009 Msalt2_C1 106.200 -0.005 -106.100 -0.005 0.002 0.982 0.981 0.006 Msalt2_C2 -0.246 0.023 0.199 -0.352 0.004 0.989 0.989 0.009 Msalt2_C3 -0.464 0.011 0.426 -0.471 0.005 0.994 0.994 0.009 Jfresh1_C1 -0.291 0.017 0.296 -0.410 0.000 0.999 0.999 0.003 Jfresh1_C2 -49.020 0.148 49.040 0.148 0.001 0.948 0.945 0.004 Jfresh1_C3 -0.249 0.016 0.225 -0.646 0.002 0.991 0.991 0.006 Jfresh2_C1 -0.215 0.015 0.210 -0.366 0.000 0.998 0.998 0.003

153
Table C-3. cont.
Sample FL (1/m) k
L (1/h) F
SL (1/m) k
SL (1/h) SSE R-square Adj. R-square RMSE
Jfresh2_C2 0.060 -0.030 -0.057 -0.570 0.000 0.980 0.979 0.001 Jfresh2_C3 -0.220 0.017 0.198 -0.599 0.002 0.991 0.991 0.006 Jsalt1_C1 -0.415 0.016 0.386 -0.518 0.005 0.994 0.994 0.009 Jsalt1_C2 4.951 0.073 -4.923 0.073 0.001 0.566 0.543 0.005 Jsalt1_C3 -0.425 0.011 0.391 -0.931 0.007 0.986 0.985 0.011 Jsalt2_C1 -0.403 0.019 0.388 -0.469 0.003 0.997 0.997 0.007 Jsalt2_C2 -0.038 -1.382 0.038 -0.023 0.000 0.920 0.916 0.002 Jsalt2_C3 -0.348 0.012 0.322 -0.793 0.004 0.990 0.990 0.008
Cfresh1_C1 -0.565 0.009 0.556 -0.409 0.001 0.999 0.999 0.005 Cfresh1_C2 0.248 -0.223 -0.272 0.023 0.004 0.995 0.994 0.008 Cfresh1_C3 2.104E+04 -0.082 -
2.104E+04 -0.082 1.085 0.708 0.693 0.139 Cfresh2_C1 -0.647 0.017 0.601 -0.309 0.012 0.995 0.995 0.015 Cfresh2_C2 -0.210 0.035 0.199 -0.407 0.001 0.997 0.997 0.005 Cfresh2_C3 1.423E+03 -0.246 -
1.423E+03 -0.245 0.884 0.731 0.716 0.126 Csalt1_C1 -0.415 0.016 0.386 -0.518 0.005 0.994 0.994 0.009 Csalt1_C2 -4.074 0.074 4.099 0.733 0.001 0.565 0.542 0.005 Csalt1_C3 -0.425 0.011 0.391 -0.931 0.007 0.986 0.985 0.011 Csalt2_C1 -0.185 0.071 0.178 -0.434 0.006 0.997 0.997 0.010 Csalt2_C2 -0.740 0.010 0.767 -0.613 0.003 0.999 0.999 0.007 Csalt2_C3 -0.319 -0.002 0.286 -0.294 0.003 0.991 0.990 0.007

154
A
B
C Figure C-1. PARAFAC components for Taxodium distichum split validated contour plots
for A) freshwater diluted samples B) saltwater replicate 1 sample C) saltwater replicate 2 sample.

155
LIST OF REFERENCES
Allen, J. A., Pezeshki, S. R., and Chambers, J. L. (1996). Interaction of flooding and salinity stress on baldcypress (Taxodium distichum). Tree Physiol. 16, 307–313. Available at: https://academic.oup.com/treephys/article-abstract/16/1-2/307/1658252/ [Accessed October 7, 2019].
Alongi, D. M. (2008). Mangrove forests : Resilience , protection from tsunamis , and
responses to global climate change. 76, 1–13. doi:10.1016/j.ecss.2007.08.024. Anderson, D. M., Glibert, P. M., and Burkholder, J. M. (2002). Harmful algal blooms and
eutrophication: Nutrient sources, composition, and consequences. Estuaries. doi:10.1007/BF02804901.
Anderson, T. R., Rowe, E. C., Polimene, L., Tipping, E., Evans, C. D., Barry, C. D. G.,
et al. (2019). Unified concepts for understanding and modelling turnover of dissolved organic matter from freshwaters to the ocean: the UniDOM model. Biogeochemistry 146, 105–123. doi:10.1007/s10533-019-00621-1.
Ardón, M., Morse, J. L., Colman, B. P., and Bernhardt, E. S. (2013). Drought-induced
saltwater incursion leads to increased wetland nitrogen export. Glob. Chang. Biol. 19, 2976–2985. doi:10.1111/gcb.12287.
Arellano, A. R., Bianchi, T. S., Osburn, C. L., D’Sa, E. J., Ward, N. D., Oviedo‐Vargas, D., et al. (2019). Mechanisms of Organic Matter Export in Estuaries with Contrasting Carbon Sources. J. Geophys. Res. Biogeosciences. doi:10.1029/2018jg004868.
Armstrong, F. A. J., Williams, P. M., and Strickland, J. D. H. (1966). Photo-oxidation of
Organic Matter in Sea Water By Ultra-Violet Radiation, Analytical and Other Applications. Nature 211, 481–483. doi:10.1038/211676a0.
Askew, A. J. (1970). Derivation of formulae for variable lag time. J. Hydrol. 10, 225–242.
doi:10.1016/0022-1694(70)90251-9. Avery, G. B., Kieber, R. J., Willey, J. D., Shank, G. C., and Whitehead, R. F. (2004a).
Impact of hurricanes on the flux of rainwater and Cape Fear River water dissolved organic carbon to Long Bay, southeastern United States. Global Biogeochem. Cycles 18, 1–6. doi:10.1029/2004GB002229.
Avery, G. B., Kieber, R. J., Willey, J. D., Shank, G. C., and Whitehead, R. F. (2004b).
Impact of hurricanes on the flux of rainwater and Cape Fear River water dissolved organic carbon to Long Bay, southeastern United States. Global Biogeochem. Cycles. doi:10.1029/2004GB002229.
Bacopoulos, P. (2017). Tide-surge historical assessment of extreme water levels for the
St. Johns River: 1928–2017. J. Hydrol. 553, 624–636.

156
Baker, A. (2001). Fluorescence excitation - Emission matrix characterization of some sewage-impacted rivers. Environ. Sci. Technol. 35, 948–953. doi:10.1021/es000177t.
Bauer, J. E., and Bianchi, T. S. (2011). Dissolved Organic Carbon Cycling and
Transformation. Treatise Estuar. Coast. Sci. 5, 7–68. doi:10.1016/B978-0-12-374711-2.00502-7.
Bauer, J. E., Cai, W. J., Raymond, P. A., Bianchi, T. S., Hopkinson, C. S., and Regnier,
P. A. G. (2013). The changing carbon cycle of the coastal ocean. Nature 504, 61–70. doi:10.1038/nature12857.
Beck, M. W. (2016). SWMPr: An R Package for Retrieving, Organizing, and Analyzing
Environmental Data for Estuaries. R J. 8, 219–232. Available at: http://www.nerrs.noaa.gov/ [Accessed October 8, 2019].
Beggs, K. M. H., and Summers, R. S. (2011). Character and Chlorine Reactivity of
Dissolved Organic Matter from a Mountain Pine Beetle Impacted Watershed. 5717–5724. doi:10.1021/es1042436.
Bender, M. A., Knutson, T. R., Tuleya, R. E., Sirutis, J. J., Vecchi, G. a, Garner, S. T., et
al. (2010). Modeled Impact of Anthropogenic. Science (80-. ). 327, 454–458. doi:10.1126/science.1180568.
Bonvillain, C. P., Halloran, B. T., Boswell, K. M., Kelso, W. E., Harlan, A. R., and
Rutherford, D. A. (2011). Acute physicochemical effects in a large river-floodplain system associated with the passage of hurricane gustav. Wetlands 31, 979–987. doi:10.1007/s13157-011-0213-4.
Bouwman, A. F., Bierkens, M. F. P., Griffioen, J., Hefting, M. M., Middelburg, J. J.,
Middelkoop, H., et al. (2013). Nutrient dynamics, transfer and retention along the aquatic continuum from land to ocean: Towards integration of ecological and biogeochemical models. Biogeosciences. doi:10.5194/bg-10-1-2013.
Boyer, J. N., Kelble, C. R., Ortner, P. B., and Rudnick, D. T. (2009). Phytoplankton
bloom status: Chlorophyll a biomass as an indicator of water quality condition in the southern estuaries of Florida, USA. Ecol. Indic. doi:10.1016/j.ecolind.2008.11.013.
Bracchini, L., Cózar, A., Dattilo, A. M., Loiselle, S. A., Tognazzi, A., Azza, N., et al.
(2006). The role of wetlands in the chromophoric dissolved organic matter release and its relation to aquatic ecosystems optical properties. A case of study: Katonga and Bunjako Bays (Victoria Lake; Uganda). Chemosphere 63, 1170–1178. doi:10.1016/j.chemosphere.2005.09.045.

157
Bricker, S. B., Longstaff, B., Dennison, W., Jones, A., Boicourt, K., Wicks, C., et al. (2008). Effects of nutrient enrichment in the nation’s estuaries: A decade of change. Harmful Algae 8, 21–32. doi:10.1016/j.hal.2008.08.028.
Bridgham, S. D., Updegraff, K., Pastor, J., and Pastor2, J. (1998). Carbon, Nitrogen,
and Phosphorus Mineralization in Northern Wetlands. Source Ecol. Ecol. 79, 1545–1561. Available at: http://www.jstor.org/stable/176775.
Brown, M. M., Mulligan, R. P., and Miller, R. L. (2014). Modeling the transport of
freshwater and dissolved organic carbon in the Neuse River Estuary, NC, USA following Hurricane Irene (2011). Estuar. Coast. Shelf Sci. doi:10.1016/j.ecss.2014.01.005.
Burkholder, J. M., Mallin, M. A., and Glasgow Jr., H. B. (1999). Fish kills, bottom-water
hypoxia, and the toxic Pfiesteria complex in the Neuse River and Estuary. Bushaw, K. L., Zepp, R. G., Tarr, M. A., Schulz-Jander, D., Bourbonniere, R. A.,
Hodson, R. E., et al. (1996). Photochemical release of biologically available nitrogen from aquatic dissolved organic matter. Nature 381, 404–407. doi:10.1038/381404a0.
Caffrey, J. M. (2003). Production, respiration and net ecosystem metabolism U.S.
estuaries. Environ. Monit. Assess. 81, 207–219. doi:10.1023/A:1021385226315. Cai, Y., Guo, L., Wang, X., Lohrenz, S. E., and Mojzis, A. K. (2013a). Effects of tropical
cyclones on river chemistry: A case study of the lower Pearl River during Hurricanes Gustav and Ike. doi:10.1016/j.ecss.2013.05.019.
Cai, Y., Guo, L., Wang, X., Lohrenz, S. E., and Mojzis, A. K. (2013b). Effects of tropical
cyclones on river chemistry: A case study of the lower Pearl River during Hurricanes Gustav and Ike. Estuar. Coast. Shelf Sci. 129, 180–188. doi:10.1016/j.ecss.2013.05.019.
Cangialosi, J. P., Latto, A. S., and Berg, R. (2017). National Hurricane Center Tropical
Cyclone Report. Carey, R. O., Wollheim, W. M., Mulukutla, G. K., and Mineau, M. M. (2014).
Characterizing Storm-Event Nitrate Fluxes in a Fifth Order Suburbanizing Watershed Using In Situ Sensors. Environ. Sci. T 48, 7756–7765. doi:10.1021/es500252j.
Catala, T. S., Reche, I., Fuentes-lema, A., Romera-castillo, C., Nieto-cid, M., Ortega-
retuerta, E., et al. (2015). matter in the dark global ocean. doi:10.1038/ncomms6986.
158
Caverly, E., Kaste, J. M., Hancock, G. S., and Chambers, R. M. (2013). Dissolved and particulate organic carbon fluxes from an agricultural watershed during consecutive tropical storms. Geophys. Res. Lett. doi:10.1002/grl.50982.
Chambers, J. Q., Fisher, J. I., Zeng, H., Chapman, E. L., Baker, D. B., and Hurtt, G. C.
(2000). Hurricane Katrina’s Carbon Footprint on U.S. Gulf Coast Forests. Proc. Natl. Acad. Sci. U.S.A 290, 77–78. doi:10.1126/science.1148913.
Chambers, L. G., Davis, S. E., Troxler, T., Boyer, J. N., Downey-Wall, A., and Scinto, L.
J. (2014). Biogeochemical effects of simulated sea level rise on carbon loss in an Everglades mangrove peat soil. Hydrobiologia 726, 195–211. doi:10.1007/s10750-013-1764-6.
Chen, M., and Jaffé, R. (2014). Photo- and bio-reactivity patterns of dissolved organic
matter from biomass and soil leachates and surface waters in a subtropical wetland. Water Res. 61, 181–190. doi:10.1016/j.watres.2014.03.075.
Chen, M., Jung, J., Kyung, Y., and Hur, J. (2018a). Surface accumulation of low
molecular weight dissolved organic matter in surface waters and horizontal off-shelf spreading of nutrients and humic-like fl uorescence in the Chukchi Sea of the Arctic Ocean. Sci. Total Environ. 639, 624–632. doi:10.1016/j.scitotenv.2018.05.205.
Chen, M., Park, M., Kim, J., Jae, Y., Kyung, Y., and Hur, J. (2018b). Exploring pore
water biogeochemical characteristics as environmental monitoring proxies for a CO 2 storage project in Pohang Basin , South Korea. Mar. Pollut. Bull. 137, 331–338. doi:10.1016/j.marpolbul.2018.10.036.
Chen, S., Lu, Y., Dash, P., Das, P., Li, J., Capps, K., et al. (2019). Hurricane pulses:
Small watershed exports of dissolved nutrients and organic matter during large storms in the Southeastern USA. doi:10.1016/j.scitotenv.2019.06.351.
Coble, P. G. (1996). Characterization of marine and terrestrial DOM in seawater using
excitation-emission matrix spectroscopy. Mar. Chem. doi:10.1016/0304-4203(95)00062-3.
Coble, P. G. (2007). Marine Optical Biogeochemistry : The Chemistry of Ocean Color.
Chem Rev 107, 402–418. Coble, P. G., Del Castillo, C. E., and Avril, B. (1998). Distribution and optical properties
of CDOM in the Arabian Sea during the 1995 Southwest Monsoon. Deep. Res. Part II Top. Stud. Oceanogr. doi:10.1016/S0967-0645(98)00068-X.
Coble, P. G., Green, S. A., Blough, N. V, and Gagosian, R. B. (1990). Characterization
of dissolved organic matter in the Black Sea by fluorescence spectroscopy. Nature 348, 432–435. doi:10.1038/348432a0.

159
Cole, J. J., Prairie, Y. T., Caraco, N. F., McDowell, W. H., Tranvik, L. J., Striegl, R. G., et al. (2007). Plumbing the global carbon cycle: Integrating inland waters into the terrestrial carbon budget. Ecosystems 10, 171–184. doi:10.1007/s10021-006-9013-8.
Cory, R. M., Ward, C. P., Crump, B. C., and Kling, G. W. (2014). Sunlight controls water
column processing of carbon in arctic fresh water. Science (80-. ). 345, 925–928. Cuss, C. W., Shi, Y. X., McConnell, S. M., and Gueguen, C. (2014). Changes in the
fluorescence composition of multiple DOM sources over pH gradients assessed by combining parallel factor analysis and self-organizing maps. J. Geophys. Res. Biogeosciences 119, 1850–1860. doi:10.1002/2013JG002598.Received.
Del Vecchio, R., and Blough, N. V. (2002). Photobleaching of chromophoric dissolved
organic matter in natural waters: Kinetics and modeling. Mar. Chem. 78, 231–253. doi:10.1016/S0304-4203(02)00036-1.
Dhillon, G. S., and Inamdar, S. (2013). Extreme storms and changes in particulate and
dissolved organic carbon in runoff: Entering uncharted waters? Geophys. Res. Lett. doi:10.1002/grl.50306.
Dix, N. G., Phlips, E. J., and Gleeson, R. A. (2008). Water Quality Changes in the
Guana Tolomato Matanzas National Estuarine Research Reserve, Florida, Associated with Four Tropical Storms. J. Coast. Res. doi:10.2112/SI55-008.1.
Edmiston, H. L., Fahrny, S. A., Lamb, M. S., Levi, L. K., Wanat, J. M., Avant, J. S., et al.
(2008). Tropical Storm and Hurricane Impacts on a Gulf Coast Estuary: Apalachicola Bay, Florida. J. Coast. Res. doi:10.2112/SI55-009.1.
Emanuel, K. (2005a). Increasing destructiveness of tropical cyclones over the past
30 years. Nature 436, 686. Available at: http://dx.doi.org/10.1038/nature03906. Emanuel, K. (2005b). Increasing destructiveness of tropical cyclones over the past 30
years. Nature 436, 686–688. doi:10.1038/nature03906. Engelhaupt, E., Bianchi, T. S., Wetzel, R. G., and Tarr, M. A. (2003). Photochemical
transformations and bacterial utilization of high-molecular-weight dissolved organic carbon in a southern Louisiana tidal stream (Bayou Trepagnier). Biogeochemistry 62, 39–58. doi:10.1023/A:1021176531598.
Ensign, S. H., and Doyle, M. W. (2006). Nutrient spiraling in streams and river networks.
J. Geophys. Res. Biogeosciences 111, 1–13. doi:10.1029/2005JG000114. Ensign, S. H., and Paerl, H. W. (2006). Development of an unattended estuarine
nutrient monitoring program using ferries as data-collection platforms. Limnol. Oceanogr. Methods. doi:10.4319/lom.2006.4.399.

160
Felix, J. D., Elliott, E. M., Avery, G. B., Kieber, R. J., Mead, R. N., Willey, J. D., et al. (2015). Isotopic composition of nitrate in sequential Hurricane Irene precipitation samples: Implications for changing NOxsources. Atmos. Environ. doi:10.1016/j.atmosenv.2015.01.075.
Fellman, J. B., Hood, E., Edwards, R. T., and D’Amore, D. V. (2009). Changes in the
concentration, biodegradability, and fluorescent properties of dissolved organic matter during stormflows in coastal temperate watersheds. J. Geophys. Res. 114, G01021. doi:10.1029/2008JG000790.
Fellman, J. B., Hood, E., and Spencer, R. G. M. (2019). Fluorescence spectroscopy
opens new windows into dissolved organic matter dynamics in freshwater ecosystems : A review Author ( s ): Jason B . Fellman , Eran Hood and Robert G . M . Spencer Published by : Wiley Stable URL : https://www.jstor.org/stable/41. 55, 2452–2462. doi:10.4319/lo.2010.55.6.2452.
Fichot, C. G., and Miller, W. L. (2010). An approach to quantify depth-resolved marine
photochemical fluxes using remote sensing: Application to carbon monoxide (CO) photoproduction. Remote Sens. Environ. 114, 1363–1377. doi:10.1016/j.rse.2010.01.019.
Foster, C., Amado, E. M., Souza, M. M., and Freire, C. A. (2009). Do osmoregulators
have lower capacity of muscle water regulation than osmoconformers? A Study on Decapod Crustaceans. J. Exp. Zool. Part A Ecol. Genet. Physiol. 313 A, 80–94. doi:10.1002/jez.575.
Frimmel, F. H. (1998). Characterization of natural organic matter as major constituents
in aquatic systems. J. Contam. Hydrol. 35, 201–216. doi:10.1016/S0169-7722(98)00133-8.
Gobler, C. J., DePasquale, E. L., Griffith, A. W., and Baumann, H. (2014). Hypoxia and
acidification have additive and synergistic negative effects on the growth, survival, and metamorphosis of early life stage bivalves. PLoS One 9. doi:10.1371/journal.pone.0083648.
Gołębiewski, M., Całkiewicz, J., Creer, S., and Piwosz, K. (2017). Tideless estuaries in
brackish seas as possible freshwater-marine transition zones for bacteria: the case study of the Vistula river estuary. Environ. Microbiol. Rep. 9, 129–143. doi:10.1111/1758-2229.12509.
Granéli, W., Lindell, M., and Tranvik, L. (1996). Photo-oxidative production of dissolved inorganic carbon in lakes of different humic content. Limnol. Oceanogr. 41, 698–706. doi:10.4319/lo.1996.41.4.0698.
Grebel, J. E., Pignatello, J. J., Song, W., Cooper, W. J., and Mitch, W. A. (2009). Impact
of halides on the photobleaching of dissolved organic matter. Mar. Chem. 115, 134–144. doi:10.1016/j.marchem.2009.07.009.

161
Gresham, C. A., Williams, T. M., and Lipscomb, D. J. (1991). Hurricane Hugo Wind
Damage to Southeastern U . S . Coastal Forest Tree Species Author ( s ): C . A . Gresham , T . M . Williams and D . J . Lipscomb Source : Biotropica , Vol . 23 , No . 4 , Part A . Special Issue : Ecosystem , Plant , and Animal Response. 23, 420–426.
Grzybowski, W. (2000). Effect of short-term sunlight irradiation on absorbance spectra
of chromophoric organic matter dissolved in coastal and riverine water. Chemosphere 40, 1313–1318. doi:10.1016/S0045-6535(99)00266-0.
Harley, C. D. G., Hughes, A. R., Hultgren, K. M., Miner, B. G., Sorte, C. J. B., Thornber,
C. S., et al. (2006). The impacts of climate change in coastal marine systems. Ecol. Lett. doi:10.1111/j.1461-0248.2005.00871.x.
Hayes, F. R., McCarter, J. A., Cameron, M. L., and Livingstone, D. A. (1952). On the
Kinetics of Phosphorus Exchange in Lakes. J. Ecol. 40, 202–216. Herbert, E. R., Boon, P., Burgin, A. J., Neubauer, S. C., Franklin, R. B., Ardon, M., et al.
(2015a). A global perspective on wetland salinization: Ecological consequences of a growing threat to freshwater wetlands. Ecosphere 6, 1–43. doi:10.1890/ES14-00534.1.
Herbert, E. R., Boon, P., Burgin, A. J., Neubauer, S. C., Franklin, R. B., Ardón, M., et al.
(2015b). A global perspective on wetland salinization: ecological consequences of a growing threat to freshwater wetlands. Ecosphere 6, art206. doi:10.1890/ES14-00534.1.
Hoellein, T. J., Bruesewitz, D. A., and Richardson, D. C. (2013). Revisiting Odum
(1956): A synthesis of aquatic ecosystem metabolism. Limnol. Oceanogr. 58, 2089–2100. doi:10.4319/lo.2013.58.6.2089.
Hogan, D. M., Jordan, T. E., and Walbridge, M. R. (2004). Phosphorus retention and
soil organic carbon in restored and natural freshwater wetlands. Wetlands 24, 573–585. doi:10.1672/0277-5212(2004)024[0573:PRASOC]2.0.CO;2.
Iavorivska, L., Boyer, E. W., Grimm, J. W., Miller, M. P., DeWalle, D. R., Davis, K. J., et
al. (2017). Variability of dissolved organic carbon in precipitation during storms at the Shale Hills Critical Zone Observatory. Hydrol. Process. 31, 2935–2950. doi:10.1002/hyp.11235.
Jankowski, J. J., Kieber, D. J., and Mopper, K. (1999). Nitrate and nitrite ultraviolet actinometers. Photochem. Photobiol. 70, 319–328. doi:10.1111/j.1751-1097.1999.tb08143.x.
Jankowski, J. J., Kieber, D. J., Mopper, K., and Neale, P. J. (2000). Development and
Intercalibration of Ultraviolet Solar Actinometers. Photochem. Photobiol. 71, 431. doi:10.1562/0031-8655(2000)071<0431:daious>2.0.co;2.

162
Jin, K. R., Chang, N. Bin, Ji, Z. G., and James, R. T. (2011). Hurricanes affect the sediment and environment in lake okeechobee. Crit. Rev. Environ. Sci. Technol. 41, 382–394. doi:10.1080/10643389.2010.531222.
Johannessen, S. C., and Miller, W. L. (2001). Quantum yield for the photochemical
production of dissolved inorganic carbon in seawater. Mar. Chem. 76, 271–283. Jørgensen, L., Stedmon, C. A., Kragh, T., Markager, S., Middelboe, M., and
Søndergaard, M. (2011). Global trends in the fluorescence characteristics and distribution of marine dissolved organic matter. Mar. Chem. 126, 139–148. doi:10.1016/j.marchem.2011.05.002.
Julian, P., Chambers, R., and Russell, T. (2017). Iron and Pyritization in Wetland Soils
of the Florida Coastal Everglades. Estuaries and Coasts 40, 822–831. doi:10.1007/s12237-016-0180-3.
Julian, P., and Osborne, T. Z. (2018). From lake to estuary, the tale of two waters: a
study of aquatic continuum biogeochemistry. Environ. Monit. Assess. 190. doi:10.1007/s10661-017-6455-8.
Junk, W. J., Bayley, P., and Sparks, R. (1989). The Flood Pulse Concept in River-
Floodplain Systems. Kadlec, R. H., and Reddy, K. R. (2001). Temperature Effects in Treatment Wetlands.
Source Water Environ. Res. 73, 543–557. Available at: http://www.jstor.org/stable/25045537.
Kieber, R. J., Li, A., and Seaton, P. J. (1999). Production of nitrite from the
photodegradation of dissolved organic matter in natural waters. Environ. Sci. Technol. 33, 993–998. doi:10.1021/es980188a.
Kieber, R. J., Zhou, X., and Mopper, K. (1990). Formation of carbonyl compounds from
UV-induced photodegradation of humic substances in natural waters: Fate of riverine carbon in the sea. 35.
Kirkby, M. J. (2014). Do not only connect: A model of infiltration-excess overland flow
based on simulation. Earth Surf. Process. Landforms 39, 952–963. doi:10.1002/esp.3556.
Knutson, T. R., Sirutis, J. J., Garner, S. T., Vecchi, G. A., and Held, I. M. (2008). Simulated reduction in Atlantic hurricane frequency under twenty-first-century warming conditions. Nat. Geosci. 1, 359–364. doi:10.1038/ngeo202.
Larsen, L. G., Aiken, G. R., Harvey, J. W., Noe, G. B., and Crimaldi, J. P. (2010). Using
fluorescence spectroscopy to trace seasonal DOM dynamics, disturbance effects, and hydrologic transport in the Florida Everglades. J. Geophys. Res. Biogeosciences. doi:10.1029/2009JG001140.

163
Laurenson, E. M. (1964). A catchment storage model for runoff routing. J. Hydrol. 2,
141–163. doi:10.1016/0022-1694(64)90025-3. Li, L., He, Z., Li, Z., Zhang, S., Li, S., Wan, Y., et al. (2016). Spatial and temporal
variation of nitrogen concentration and speciation in runoff and storm water in the Indian River watershed, South Florida. Environ. Sci. Pollut. Res. 23, 19561–19569. doi:10.1007/s11356-016-7125-z.
Liang, S., Zhou, R. C., Dong, S. S., and Shi, S. H. (2008). Adaptation to salinity in
mangroves: Implication on the evolution of salt-tolerance. Chinese Sci. Bull. 53, 1708–1715. doi:10.1007/s11434-008-0221-9.
Liu, C., Du, Y., Yin, H., Fan, C., Chen, K., Zhong, J., et al. (2019). Exchanges of
nitrogen and phosphorus across the sediment-water interface in fl uenced by the external suspended particulate matter and the residual matter after dredging *. Environ. Pollut. 246, 207–216. doi:10.1016/j.envpol.2018.11.092.
Lou, S., Huang, W., Liu, S., Zhong, G., and Johnson, E. (2016). Hurricane impacts on
turbidity and sediment in the Rookery Bay National Estuarine Research Reserve, Florida, USA. Int. J. Sediment Res. 31, 330–340. doi:10.1016/j.ijsrc.2016.06.006.
Luek, J. L., Thompson, K. E., Larsen, R. K., Heyes, A., and Gonsior, M. (2017). Sulfate
Reduction in Sediments Produces High Levels of Chromophoric Dissolved Organic Matter OPEN. doi:10.1038/s41598-017-09223-z.
Ma, X., and Green, S. A. (2004). Photochemical transformation of dissolved organic
carbon in lake superior - An in-situ experiment. in Journal of Great Lakes Research (International Association of Great Lakes Research), 97–112. doi:10.1016/S0380-1330(04)70380-9.
Maie, N., Scully, N. M., Pisani, O., and Jaffé, R. (2007). Composition of a protein-like
fluorophore of dissolved organic matter in coastal wetland and estuarine ecosystems. Water Res. 41, 563–570. doi:10.1016/j.watres.2006.11.006.
Majidzadeh, H., Uzun, H., Ruecker, A., Miller, D., Vernon, J., Zhang, H., et al. (2017).
Extreme flooding mobilized dissolved organic matter from coastal forested wetlands. Biogeochemistry. doi:10.1007/s10533-017-0394-x.
Mallin, M. A., and Corbett, C. A. (2006a). How hurricane attributes determine the extent of environmental effects: Multiple hurricanes and different coastal systems. Estuaries and Coasts 29, 1046–1061. doi:10.1007/BF02798667.
Mallin, M. A., and Corbett, C. A. (2006b). How hurricane attributes determine the extent
of environmental effects: Multiple hurricanes and different coastal systems. Estuaries and Coasts 29, 1046–1061. doi:10.1007/BF02798667.

164
Mallin, M. A., Mciver, M. R., Ensign, S. H., and Cahoon, L. B. (2004). Photosynthetic and Heterotrophic Impacts of Nutrient Loading to Blackwater Streams.
Mandal, A., Stephenson, T. S., Brown, A. A., Campbell, J. D., Taylor, M. A., and
Lumsden, T. L. (2016). Rainfall-runoff simulations using the CARIWIG Simple Model for Advection of Storms and Hurricanes and HEC-HMS: Implications of Hurricane Ivan over the Jamaica Hope River watershed. Nat. Hazards 83, 1635–1659. doi:10.1007/s11069-016-2380-3.
Masson-Delmotte, V., Zhai, P., Pörtner, H.-O., Roberts, D., Skea, J., Shukla, P. R., et
al. (2018). Global warming of 1.5°C An IPCC Special Report on the impacts of global warming of 1.5°C above pre-industrial levels and related global greenhouse gas emission pathways, in the context of strengthening the global response to the threat of climate change, .
Mccoy, E. D., Mushinsky, H. R., Johnson, D., and Meshaka, W. E. (1996). MANGROVE
DAMAGE CAUSED BY HURRICANE ANDREW ON THE SOUTHWESTERN COAST OF FLORIDA extensive mangrove forests on Florida ’ s southwestern coast , also were affected Heavy damage appears to have occurred to nearly 150 km 2 of mangroves in the drew had been da. 59, 1–8.
Meyer, J. L. (1990). A Blackwater Perspective on Riverine Ecosystems. Bioscience 40,
643. doi:10.2307/1311431. Meyer, J. L., and Edwards, R. T. (1990). Ecosystem Metabolism and Turnover of
Organic Carbon along a Blackwater River. Miller, R. L., Brown, M. M., and Mulligan, R. P. (2016). Transport and transformation of
dissolved organic matter in the Neuse River estuarine system, NC, USA, following Hurricane Irene (2011). Mar. Freshw. Res. doi:10.1071/MF15352.
Miller, W. L., Moran, M. A., Sheldon, W. M., Zepp, R. G., and Opsahl, S. (2002).
Determination of apparent quantum yield spectra for the formation of biologically labile photoproducts. 47, 343–352.
Minor, E. C., Pothen, J., Dalzell, B. J., Abdullah, H., and Mopper, K. (2006a). Effects of
Salinity Changes on the Photodegradation and Ultraviolet-Visible Absorbance of Terrestrial Dissolved Organic Matter Author ( s ): E . C . Minor , J . Pothen , B . J . Dalzell , H . Abdulla and K . Mopper Published by : Wiley Stable URL : https: 51, 2181–2186.
Minor, E. C., Simjouw, J. P., and Mulholland, M. R. (2006b). Seasonal variations in
dissolved organic carbon concentrations and characteristics in a shallow coastal bay. Mar. Chem. 101, 166–179. doi:10.1016/j.marchem.2006.02.005.

165
Mitra, S., Wozniak, A. S., Miller, R., Hatcher, P. G., Buonassissi, C., and Brown, M. (2013). Multiproxy probing of rainwater dissolved organic matter (DOM) composition in coastal storms as a function of trajectory. Mar. Chem. 154, 67–76. doi:10.1016/j.marchem.2013.05.013.
Montgomery, J. M., Bryan, K. R., Mullarney, J. C., and Horstman, E. M. (2019).
Attenuation of Storm Surges by Coastal Mangroves. Geophys. Res. Lett. 46, 2680–2689. doi:10.1029/2018GL081636.
Moore, W. S. (2010). The Effect of Submarine Groundwater Discharge on the Ocean.
Ann. Rev. Mar. Sci. 2, 59–88. doi:10.1146/annurev-marine-120308-081019. Moran, M. A., Sheldon, W. M., and Zepp, R. G. (2000). Carbon loss and optical property
changes during long-term photochemical and biological degradation of estuarine dissolved organic matter. Limnol. Oceanogr. doi:10.4319/lo.2000.45.6.1254.
Morton, R. A., and Barras, J. A. (2011). Hurricane Impacts on Coastal Wetlands: A Half-
Century Record of Storm-Generated Features from Southern Louisiana. J. Coast. Res. 275, 27–43. doi:10.2112/jcoastres-d-10-00185.1.
Mostofa, K. M. G., Yoshioka, T., Mottaleb, M. A., and Vione, D. (2013).
Photobiogeochemistry of Organic Matter: Principles and Practices in Water. Mullaugh, K. M., Willey, J. D., Kieber, R. J., Mead, R. N., and Avery, G. B. (2013).
Dynamics of the chemical composition of rainwater throughout Hurricane Irene. Atmos. Chem. Phys. doi:10.5194/acp-13-2321-2013.
Murphy, K. R., Hambly, A., Singh, S., Henderson, R. K., Baker, A., Stuetz, R., et al.
(2011). Organic Matter Fluorescence in Municipal Water Recycling Schemes : Toward a Unified PARAFAC Model. 2909–2916. doi:10.1021/es103015e.
Murphy, K. R., Stedmon, C. A., Graeber, D., and Bro, R. (2013). Fluorescence
spectroscopy and multi-way techniques. PARAFAC. Anal. Methods 5, 6557–6566. doi:10.1039/c3ay41160e.
Murphy, K. R., Stedmon, C. A., Wenig, P., and Bro, R. (2014). OpenFluor- An online
spectral library of auto-fluorescence by organic compounds in the environment. Anal. Methods 6, 658–661. doi:10.1039/c3ay41935e.
Murphy, K. R., Timko, S. A., Gonsior, M., Powers, L. C., Wünsch, U. J., and Stedmon,
C. A. (2018). Photochemistry Illuminates Ubiquitous Organic Matter Fluorescence Spectra. Environ. Sci. Technol. 52, 11243–11250. doi:10.1021/acs.est.8b02648.
O’Connell, M. T., O’Connell, A. M. U., and Schieble, C. S. (2014). Response of Lake
Pontchartrain Fish Assemblages to Hurricanes Katrina and Rita. Estuaries and Coasts 37, 461–475. doi:10.1007/s12237-013-9675-3.

166
Obernosterer, I., and Benner, R. (2004). Competition between biological and
photochemical processes in the mineralization of dissolved organic carbon. Limnol. Oceanogr. 49, 117–124. doi:10.4319/lo.2004.49.1.0117.
Odum, E. P. (1985). Trends Expected in Stressed Ecosystems. Bioscience 35, 419–
422. doi:10.2307/1310021. Odum, H. T. (1956). Primary Production in Flowing Waters. Limnol. Oceanogr. 1, 102–
117. doi:10.4319/lo.1956.1.2.0102. Ohno, T. (2002). Fluorescence inner-filtering correction for determining the humification
index of dissolved organic matter. Environ. Sci. Technol. 36, 742–746. doi:10.1021/es0155276.
Osburn, C. L., Handsel, L. T., Mikan, M. P., Paerl, H. W., and Montgomery, M. T.
(2012). Fluorescence tracking of dissolved and particulate organic matter quality in a river-dominated estuary. Environ. Sci. Technol. doi:10.1021/es3007723.
Osburn, C. L., O’Sullivan, D. W., and Boyd, T. J. (2009). Increases in the Longwave
Photobleaching of Chromophoric Dissolved Organic Matter in Coastal Waters Author ( s ): Christopher L . Osburn , Daniel W . O ’ Sullivan and Thomas J . Boyd Published by : Wiley Stable URL : https://www.jstor.org/stable/40058403. 54, 145–159.
Paerl, H. W., Crosswell, J. R., Van Dam, B., Hall, N. S., Rossignol, K. L., Osburn, C. L.,
et al. (2018). Two decades of tropical cyclone impacts on North Carolina’s estuarine carbon, nutrient and phytoplankton dynamics: implications for biogeochemical cycling and water quality in a stormier world. Biogeochemistry 141, 307–332. doi:10.1007/s10533-018-0438-x.
Paerl, H. W., Valdes, L. M., Joyner, A. R., Peierls, B. L., Piehler, M. F., Riggs, S. R., et
al. (2006). Ecological Response to Hurricane Events in the Pamlico Sound System , North Carolina , and Implications for Assessment and Management in a Regime of Increased Frequency Linked references are available on JSTOR for this article : Ecological Response to Hur. Estuaries and Coasts 29, 1033–1045. doi:10.1007/BF02798666.
Parlanti, E., Woè, K., Geoffroy, L., and Lamotte, M. (2000). Dissolved organic matter
¯uorescence spectroscopy as a tool to estimate biological activity in a coastal zone submitted to anthropogenic inputs. Org. Geochem. 31, 1765–1781.
Pietrafesa, L. J., Janowitz, G. S., Chao, T.-T., Weisberg, R. H., Askari, F., and Noble, E.
(1986). The Physical Oceanography of Pamlico Sound. UNC Sea Grant Publ. UNC-WP-86-.

167
Pinckney, J. L., Paerl, H. W., Tester, P., and Richardson, T. L. (2001). The Role of Nutrient Loading and Eutrophication in Estuarine Ecology. Environ. Heal. Perscpectives 109, 699–706.
Poirrier, M. A., Rodriguez, Z., Spalding, E. A., Poirrier, M. A., Rodriguez, Z., and
Spalding, E. A. (2008). Acute Disturbance of Lake Pontchartrain Benthic Communities by Hurricane Katrina. Estuaries and Coasts 31, 1221–1228. doi:10.1007/sl2237-008-9103-2.
Putz, F. E., and Sharitz, R. R. (1991). Hurricane Damage to Old-growth Forest in
Congaree Swamp National Monument, South Carolina, USA. Can. J. For. Res. 21, 1765–1770.
Radabaugh, K. R., Moyer, R. P., Chappel, A. R., Dontis, E. E., Russo, C. E., Joyse, K.
M., et al. Mangrove Damage, Delayed Mortality, and Early Recovery Following Hurricane Irma at Two Landfall Sites in Southwest Florida, USA. doi:10.1007/s12237-019-00564-8.
Ran, L., Lu, X. X., Sun, H., Han, J., Li, R., and Zhang, J. (2013). Spatial and seasonal
variability of organic carbon transport in the Yellow River, China. J. Hydrol. doi:10.1016/j.jhydrol.2013.06.018.
Raymond, P. A., and Saiers, J. E. (2010). Event controlled DOC export from forested
watersheds. Biogeochemistry 100, 197–209. doi:10.1007/s10533-010-9416-7. Raymond, P. A., Saiers, J. E., and Sobczak, W. V. (2016). Hydrological and
biogeochemical controls on watershed DOM transport: pulse-shunt concept. Ecology 97, 5–16. doi:10.1890/14-1684.1.
Redfield, William C. (1831). Remarks on the Prevailing Storms of the Atlantic Coast.
American Journal of Science and Art 20,17-51. Riedel, T., Zak, D., Biester, H., and Dittmar, T. (2013). Iron traps terrestrially derived
dissolved organic matter at redox interfaces. Proc. Natl. Acad. Sci. U. S. A. 110, 10101–10105. doi:10.1073/pnas.1221487110.
Rigler, F. H. (1956). A Tracer Study of the Phosphorus Cycle in Lake Water. Ecology
37, 550–562. Romigh, M. M., Davis, S. E., Rivera-Monroy, V. H., and Twilley, R. R. (2006). Flux of
organic carbon in a riverine mangrove wetland in the Florida Coastal Everglades. Hydrobiologia. doi:10.1007/s10750-006-0152-x.
Ruggaber, A., Dlugi, R., and Nakajima, T. (1994). Modeling Radiation Quantities and
Photolysis Frequencies in the Troposphere. J. Atmos. Chem. 18, 171–210.

168
Schade, J. D., Macneill, K., Thomas, S. A., Camille Mcneely, F., Welter, J. R., Hood, J., et al. (2011). The stoichiometry of nitrogen and phosphorus spiralling in heterotrophic and autotrophic streams. Freshw. Biol. 56, 424–436. doi:10.1111/j.1365-2427.2010.02509.x.
Shank, G. C., Zepp, R. G., Vähätalo, A., Lee, R., and Bartels, E. (2010a).
Photobleaching kinetics of chromophoric dissolved organic matter derived from mangrove leaf litter and floating Sargassum colonies. Mar. Chem. 119, 162–171. doi:10.1016/j.marchem.2010.01.003.
Shank, G. C., Zepp, R. G., Vähätalo, A., Lee, R., and Bartels, E. (2010b).
Photobleaching kinetics of chromophoric dissolved organic matter derived from mangrove leaf litter and floating Sargassum colonies. Mar. Chem. 119, 162–171. doi:10.1016/j.marchem.2010.01.003.
Sharpe, P. J., and Baldwin, A. H. (2009). Patterns of wetland plant species richness
across estuarine gradients of Chesapeake Bay. Wetlands 29, 225–235. doi:10.1672/08-111.1.
Shiller, A. M., Shim, M. J., Guo, L., Bianchi, T. S., Smith, R. W., and Duan, S. (2012).
Hurricane Katrina impact on water quality in the East Pearl River, Mississippi. J. Hydrol. 414–415, 388–392. doi:10.1016/j.jhydrol.2011.11.010.
Sierra, M. M. D., and Giovanela, M. (2005). Fluorescence fingerprint of fulvic and humic
acids from varied origins as viewed by single-scan and excitation / emission matrix techniques. 58, 715–733. doi:10.1016/j.chemosphere.2004.09.038.
Sindelar, H. R., Lloyd, J., Brown, M. T., and Boyer, T. H. (2015). Degradation of lignin in
ionic liquid with HCl as catalyst. Environ. Prog. Sustain. Energy 35, 809–814. doi:10.1002/ep.
Sleighter, R. L., Cory, R. M., Kaplan, L. A., Abdulla, H. A. N., and Hatcher, P. G. (2014).
A coupled geochemical and biogeochemical approach to characterize the bioreactivity of dissolved organic matter from a headwater stream. J. Geophys. Res. G Biogeosciences 119, 1520–1537. doi:10.1002/2013JG002600.
Smith, C. S., Puckett, B., Gittman, R. K., and Peterson, C. H. (2018). Living shorelines
enhanced the resilience of saltmarshes to Hurricane Matthew (2016). Ecol. Appl. 28, 871–877. doi:10.1002/eap.1722.
Smith, L. M., MacAuley, J. M., Harwell, L. C., and Chancy, C. A. (2009). Water quality in
the near coastal waters of the gulf of mexico affected by hurricane katrina: Before and after the storm. Environ. Manage. doi:10.1007/s00267-009-9300-1.
Stanford, J. A., and Ward, J. V. (1993). An Ecosystem Perspective of Alluvial Rivers :
Connectivity and the Hyporheic Corridor. J. North Am. Benthol. Soc. 12, 48–60.

169
Statham, P. J. (2012). Nutrients in estuaries - An overview and the potential impacts of
climate change. Sci. Total Environ. 434, 213–227. doi:10.1016/j.scitotenv.2011.09.088.
Stedmon, C. A., Markager, S., Tranvik, L., Kronberg, L., Slätis, T., and Martinsen, W.
(2007). Photochemical production of ammonium and transformation of dissolved organic matter in the Baltic Sea. Mar. Chem. 104, 227–240. doi:10.1016/j.marchem.2006.11.005.
Stedmon, C. A., Tallec, N. Le, Waul, C. K., and Arvin, E. (2011). A potential approach
for monitoring drinking water quality from groundwater systems using organic matter fluorescence as an early warning for contamination events b. Water Res. 45, 6030–6038. doi:10.1016/j.watres.2011.08.066.
Steele, M. K., and Aitkenhead-Peterson, J. A. (2013). Salt impacts on organic carbon
and nitrogen leaching from senesced vegetation. Biogeochemistry. doi:10.1007/s10533-012-9722-3.
Stemmler, K., Ammann, M., Donders, C., Kleffmann, J., and George, C. (2006).
Photosensitized reduction of nitrogen dioxide on humic acid as a source of nitrous acid. Nature 440, 195–198. doi:10.1038/nature04603.
Stephens, B. M., and Minor, E. C. (2010). DOM characteristics along the continuum
from river to receiving basin: A comparison of freshwater and saline transects. Aquat. Sci. doi:10.1007/s00027-010-0144-9.
Stewart, S. R. (2016). HURRICANE MATTHEW. Stubbins, A., Law, C. S., Mopper, K., Robinson, C., and Upstill-goddard, R. C. (2006).
Open-ocean carbon monoxide photoproduction. 53, 1695–1705. doi:10.1016/j.dsr2.2006.05.011.
Stumm, W., and Morgan, J. J. (1996). AQUATIC CHEMISTRY: Chemical Equilibria and
Rates in Natural Waters. Suárez, N., and Medina, E. (2005). Salinity effect on plant growth and leaf demography
of the mangrove, Avicennia germinans L. Trees - Struct. Funct. 19, 721–727. doi:10.1007/s00468-005-0001-y.
Sui, Y., Kong, H., Shang, Y., Huang, X., Wu, F., Hu, M., et al. (2016). Effects of short-
term hypoxia and seawater acidification on hemocyte responses of the mussel Mytilus coruscus. Mar. Pollut. Bull. 108, 46–52. doi:10.1016/j.marpolbul.2016.05.001.

170
Thébault, J., Schraga, T. S., Cloern, J. E., and Dunlavey, E. G. (2008). Primary production and carrying capacity of former salt ponds after reconnection to San Francisco bay. Wetlands 28, 841–851. doi:10.1672/07-190.1.
Thomas, B. L., Doyle, T., and Krauss, K. (2015). Annual Growth Patterns of
Baldcypress (Taxodium distichum) Along Salinity Gradients. Wetlands 35, 831–839. doi:10.1007/s13157-015-0659-x.
Timko, S. A., Gonsior, M., and Cooper, W. J. (2015a). Influence of pH on fluorescent
dissolved organic matter photo-degradation. Water Res. 85, 266–274. doi:10.1016/j.watres.2015.08.047.
Timko, S. A., Maydanov, A., Pittelli, S. L., Conte, M. H., Cooper, W. J., Koch, B. P., et
al. (2015b). Depth-dependent photodegradation of marine dissolved organic matter. Front. Mar. Sci. 2, 1–13. doi:10.3389/fmars.2015.00066.
Tomasko, D. A., Anastasiou, C., and Kovach, C. (2006). Dissolved Oxygen Dynamics in
Charlotte Harbor and Its Contributing Watershed, in Response to Hurricanes Charley, Frances, and Jeanne—Impacts and Recovery. Estuaries and Coasts 29, 932–938.
Toole, D. A., Slezak, D., Kiene, R. P., Kieber, D. J., and Siegel, D. A. (2006). Effects of
solar radiation on dimethylsulfide cycling in the western Atlantic Ocean. 53, 136–153. doi:10.1016/j.dsr.2005.09.003.
Torres, J. M., Bass, B., Irza, N., Fang, Z., Proft, J., Dawson, C., et al. (2015).
Characterizing the hydraulic interactions of hurricane storm surge and rainfall-runoff for the Houston-Galveston region. Coast. Eng. 106, 7–19. doi:10.1016/j.coastaleng.2015.09.004.
Touchette, B. W. (2006). Salt tolerance in a Juncus roemerianus brackish marsh:
Spatial variations in plant water relations. J. Exp. Mar. Bio. Ecol. 337, 1–12. doi:10.1016/j.jembe.2006.05.011.
Vahatalo, A. V., and Jarvinen, M. (2007). Photochemically produced bioavailable
nitrogen from biologically recalcitrant dissolved organic matter stimulates production of a nitrogen-limited microbial food web in the Baltic Sea. 52, 132–143.
Valentine, R. L., and Zepp, R. G. (1993). Formation of Carbon Monoxide from the
Photodegradation of Terrestrial Dissolved Organic Carbon in Natural Waters. Environ. Sci. Technol. 27, 409–412. doi:10.1021/es00039a023.
Vannote, R. L., Minshall, G. W., Cummins, K. W., Sedell, J. R., and Cushing, C. E.
(1980). The River Continuum Concept. Can. J. Fish. Aquat. Sci. 37.

171
Villa, J. A., Mitsch, W. J., Song, K., and Miao, S. L. (2014). Contribution of different wetland plant species to the DOC exported from a mesocosm experiment in the Florida Everglades. Ecol. Eng. 71, 118–125. doi:10.1016/j.ecoleng.2014.07.011.
Vione, D., Maurino, V., Minero, C., Pelizzetti, E., Harrison, M. A. J., Olariu, R. I., et al.
(2006). Photochemical reactions in the tropospheric aqueous phase and on particulate matter. Chem. Soc. Rev. 35, 441–453. doi:10.1039/b510796m.
Walker, N. D. (2001). Tropical Storm and Hurricane Wind Effects on Water Level,
Salinity, and Sediment Transport in the River-Influenced Atchafalaya-Vermilion Bay System, Louisiana, USA. Estuaries 24, 498. doi:10.2307/1353252.
Walsh, J. J., Weisberg, R. H., Dieterle, D. A., He, R., Darrow, B. P., Jolliff, J. K., et al.
(2003). Phytoplankton response to intrusions of slope water on the West Florida Shelf : Models and observations. 108, 1–23. doi:10.1029/2002JC001406.
Ward, N. D., Bianchi, T. S., Medeiros, P. M., Seidel, M., Richey, J. E., Keil, R. G., et al.
(2017). Where Carbon Goes When Water Flows: Carbon Cycling across the Aquatic Continuum. Front. Mar. Sci. 4. doi:10.3389/fmars.2017.00007.
Ward, N. D., Richey, J. E., and Keil, R. G. (2012). Temporal variation in river nutrient
and dissolved lignin phenol concentrations and the impact of storm events on nutrient loading to Hood Canal, Washington, USA. Biogeochemistry 111, 629–645. doi:10.1007/s10533-012-9700-9.
Ward, N. D., Sawakuchi, H. O., Neu, V., Less, D. F. S., Valerio, A. M., Cunha, A. C., et
al. (2018). Velocity-amplified microbial respiration rates in the lower Amazon River. Limnol. Oceanogr. Lett. 3, 265–274. doi:10.1002/lol2.10062.
Ward, J. V., and Stanford, J. A. (1995). Ecosystems and Its Disruption By Flow
Regulation. Regul. Rivers Res. Manag. II, 105–119. doi:10.1002/rrr.3450110109. Webster, J., Newbold, J., and Lin, L. (2016). Nutrient Spiraling and Transport in
Streams. doi:10.1016/B978-0-12-405890-3.00005-1. Webster, J. R. (2007). Spiraling down the river continuum: stream ecology and the U-
shaped curve. J. North Am. Benthol. Soc. 26, 375–389. doi:10.1899/06-095.1. Webster, J. R., and Patten, B. C. (1979). Effects of Watershed Perturbation on Stream
Potassium and Calcium Dynamics. Webster, P. J., Holland, G. J., Curry, J. A., and Chang, H.-R. (2005). Changes in
Tropical Cyclone Number, Duration, and Intensity in a Warming Environment. Science (80-. ). 309, 1844 LP – 1846.

172
Weishaar, J. L., Fram, M. S., Fujii, R., and Mopper, K. (2003). Evaluation of Specific Ultraviolet Absorbance as an Indicator of the Chemical Composition and Reactivity of Dissolved Organic Carbon. 4702–4708. doi:10.1021/es030360x.
Weston, N. B., Dixon, R. E., and Joye, S. B. (2006). Ramifications of increased salinity
in tidal freshwater sediments: Geochemistry and microbial pathways of organic matter mineralization. J. Geophys. Res. Biogeosciences. doi:10.1029/2005JG000071.
Wetzel, R. G., Hatcher, P. G., and Bianchi, T. S. (1995a). Natural photolysis by
ultraviolet irradiance of recalcitrant dissolved organic matter to simple substrates for rapid bacterial metabolism. Limnol. Ocean. 40, 1369–1380.
Wetzel, R. G., Hatcher, P. G., and Bianchi, T. S. (1995b). Natural photolysis by
ultraviolet irradiance of recalcitrant dissolved organic matter to simple substrates for rapidbacterial metabolism. Limnol. Oceanogr. 40, 1369–1380. doi:10.4319/lo.1995.40.8.1369.
Wheeler, K. I., Levia, D. F., and Hudson, J. E. (2017). Tracking senescence-induced
patterns in leaf litter leachate using parallel factor analysis (PARAFAC) modeling and self-organizing maps. J. Geophys. Res. Biogeosciences 122, 2233–2250. doi:10.1002/2016JG003677.
Whigam, D. F. (Smithsonian E. R. C., Olmsted, I., Cabrera Cano, E., and Harmon, M. E.
(1991). The Impact of Hurricane Gilbert on Trees , Litterfall , and Woody Debris in a Dry Tropical Forest in the Northeastern Yucatan Peninsula Author ( s ): Dennis F . Whigham , Ingrid Olmsted , Edgar Cabrera Cano and Mark E . Harmon Source : Biotropica , Vol . 23, 434–441.
Williamson, C. E., Neale, P. J., Grad, G., Lange, H. J. De, Hargreaves, B. R., and
Hargreaves, B. R. (2001). Beneficial and Detrimental Effects of UV on Aquatic Organisms : Implications of Spectral Variation 11, 1843–1857.
Wunch, U. J., Murphy, K. R., and Stedmon, C. A. (2017). The One-Sample PARAFAC Approach Reveals Molecular Size Distributions of Fluorescent Components in Dissolved Organic Matter. Environ. Sci. Technol. 51, 11900–11908. doi:10.1021/acs.est.7b03260.
Xenopoulos, M. A., Downing, J. A., Kumar, M. D., Menden-Deuer, S., and Voss, M.
(2017). Headwaters to oceans: Ecological and biogeochemical contrasts across the aquatic continuum. Limnol. Oceanogr. 62, S3–S14. doi:10.1002/lno.10721.
Xi, W., Peet, R. K., Lee, M. T., Dean, •, and Urban, L. (2019). Hurricane disturbances,
tree diversity, and succession in North Carolina Piedmont forests, USA. J. For. Res. 30, 219–231. doi:10.1007/s11676-018-0813-4.

173
Xie, L., Liu, H., Liu, B., and Bao, S. (2011). A numerical study of the effect of hurricane wind asymmetry on storm surge and inundation. Ocean Model. doi:10.1016/j.ocemod.2010.10.001.
Xuan, Z., and Chang, N. Bin (2014). Modeling the climate-induced changes of lake
ecosystem structure under the cascade impacts of hurricanes and droughts. Ecol. Modell. 288, 79–93. doi:10.1016/j.ecolmodel.2014.05.014.
Xylem (2012). EXO Water Quality Field Sensors: Features, Specifications, and
Comparability to YSI 6-Series Sensors. Xylem (2019). EXO User Manual Advanced Water Quality Monitoring Platform User
Manual. Yang, X., Meng, F., Huang, G., and Sun, L. (2014a). Sunlight-induced changes in
chromophores and fluorophores of wastewater-derived organic matter in receiving waters e The role of salinity. Water Res. 62, 281–292. doi:10.1016/j.watres.2014.05.050.
Yang, X., Meng, F., Huang, G., Sun, L., and Lin, Z. (2014b). Sunlight-induced changes
in chromophores and fluorophores of wastewater-derived organic matter in receiving waters - The role of salinity. Water Res. doi:10.1016/j.watres.2014.05.050.
Yang, Y., He, Z., Wang, Y., Fan, J., Liang, Z., and Stoffella, P. J. (2013). Dissolved
organic matter in relation to nutrients (N and P) and heavy metals in surface runoff water as affected by temporal variation and land uses - A case study from Indian River Area, south Florida, USA. Agric. Water Manag. 118, 38–49. doi:10.1016/j.agwat.2012.12.001.
Yang, Y., and Pignatello, J. J. (2017). Participation of the halogens in photochemical
reactions in natural and treated waters. Molecules 22. doi:10.3390/molecules22101684.
Yoon, B., and Raymond, P. A. (2012). Dissolved organic matter export from a forested
watershed during Hurricane Irene. Geophys. Res. Lett. 39. doi:10.1029/2012GL052785.
Zepp, R. G., Sheldon, W. M., and Moran, M. A. (2004). Dissolved organic fluorophores
in southeastern US coastal waters: correction method for eliminating Rayleigh and Raman scattering peaks in excitation–emission matrices. Mar. Chem. 89, 15–36. doi:10.1016/j.marchem.2004.02.006.
Zhang, J. Z., Kelble, C. R., Fischer, C. J., and Moore, L. (2009). Hurricane Katrina
induced nutrient runoff from an agricultural area to coastal waters in Biscayne Bay, Florida. Estuar. Coast. Shelf Sci. 84, 209–218. doi:10.1016/j.ecss.2009.06.026.

174
Zhao, Z., Gonsior, M., Luek, J., Timko, S., Ianiri, H., Hertkorn, N., et al. (2017). Picocyanobacteria and deep-ocean fluorescent dissolved organic matter share similar optical properties. Nat. Commun. 8. doi:10.1038/ncomms15284.
Zhou, M., Butterbach-Bahl, K., Vereecken, H., and Brüggemann, N. (2017). A meta-
analysis of soil salinization effects on nitrogen pools, cycles and fluxes in coastal ecosystems. Glob. Chang. Biol. 23, 1338–1352. doi:10.1111/gcb.13430.

175
BIOGRAPHICAL SKETCH
Tracey B. Schafer was born in Champaign, Illinois to Marci Adelston-Schafer and
Robert Schafer. Her parents are extremely environmentally conscious, and Tracey
learned about the importance of environmental research and protection from a very
young age. In 2007, Tracey attended the University of Illinois in natural resource and
environmental science as a James Baldwin Turner Scholar. She graduated in
December 2010 and idealistically began the process of applying to become a Peace
Corps volunteer. In August 2011, Tracey left for Senegal where she lived and served as
an agroforestry volunteer in the Fatick region, teaching local villagers about sustainable
farming practicing and integrating trees into gardens and crop fields. In December 2013
Tracey returned home to the United States and was lucky enough to meet Dr. Osborne
in early 2014 as he was starting his lab at the Whitney Laboratory for Marine
Biosciences. She became Dr. Osborne’s laboratory technician for 8 months before
becoming his master’s student and starting graduate school in the Soil and Water
Sciences Department at the University of Florida in August 2014. She gained a
fellowship through the Soil and Water Sciences Department to continue as a PhD
student in 2016. She has since had the opportunity to work with many great PIs from
across the country during her studies over the past 4 years and is excited for the next
step after the completion of her PhD in summer 2020.