Winter to spring variations of chromophoric dissolved organic matter in a temperate estuary (Po...
29
Accepted Manuscript Title: Winter to Spring Variations of Chromophoric Dissolved Organic Matter in a temperate estuary (Po River, Northern Adriatic Sea) Authors: D. Berto, M. Giani, F. Savelli, E. Centanni, C.R. Ferrari, B. Pavoni PII: S0141-1136(10)00045-0 DOI: 10.1016/j.marenvres.2010.03.005 Reference: MERE 3432 To appear in: Marine Environmental Research Received Date: 26 October 2009 Revised Date: 4 March 2010 Accepted Date: 13 March 2010 Please cite this article as: Berto, D., Giani, M., Savelli, F., Centanni, E., Ferrari, C.R., Pavoni, B. Winter to Spring Variations of Chromophoric Dissolved Organic Matter in a temperate estuary (Po River, Northern Adriatic Sea), Marine Environmental Research (2010), doi: 10.1016/j.marenvres.2010.03.005 This is a PDF file of an unedited manuscript that has been accepted for publication. As a service to our customers we are providing this early version of the manuscript. The manuscript will undergo copyediting, typesetting, and review of the resulting proof before it is published in its final form. Please note that during the production process errors may be discovered which could affect the content, and all legal disclaimers that apply to the journal pertain.
-
Upload
independent -
Category
Documents
-
view
0 -
download
0
Transcript of Winter to spring variations of chromophoric dissolved organic matter in a temperate estuary (Po...

Accepted Manuscript
Title: Winter to Spring Variations of Chromophoric Dissolved Organic Matter in atemperate estuary (Po River, Northern Adriatic Sea)
Authors: D. Berto, M. Giani, F. Savelli, E. Centanni, C.R. Ferrari, B. Pavoni
PII: S0141-1136(10)00045-0
DOI: 10.1016/j.marenvres.2010.03.005
Reference: MERE 3432
To appear in: Marine Environmental Research
Received Date: 26 October 2009
Revised Date: 4 March 2010
Accepted Date: 13 March 2010
Please cite this article as: Berto, D., Giani, M., Savelli, F., Centanni, E., Ferrari, C.R., Pavoni, B. Winterto Spring Variations of Chromophoric Dissolved Organic Matter in a temperate estuary (Po River,Northern Adriatic Sea), Marine Environmental Research (2010), doi: 10.1016/j.marenvres.2010.03.005
This is a PDF file of an unedited manuscript that has been accepted for publication. As a service toour customers we are providing this early version of the manuscript. The manuscript will undergocopyediting, typesetting, and review of the resulting proof before it is published in its final form. Pleasenote that during the production process errors may be discovered which could affect the content, and alllegal disclaimers that apply to the journal pertain.
MANUSCRIP
T
ACCEPTED
ACCEPTED MANUSCRIPT
1
Winter to Spring Variations of Chromophoric Dissolved Organic Matter in a temperate
estuary (Po River, Northern Adriatic Sea)
D. Berto1*, M. Giani1,2, F. Savelli1, E. Centanni3, C.R. Ferrari4 , B. Pavoni3
1 Istituto Superiore per la Protezione e la Ricerca Ambientale, ISPRA, Chioggia, Italy
2 present address: Istituto Nazionale di Oceanografia e di Geofisica Sperimentale, Dip. di
Oceanografia Biologica, Trieste, Italy
3 Università di Venezia, Dipartimento Scienze Ambientali, Venezia, Italy.
4Agenzia regionale per la Protezione dell’Ambiente dell’Emilia Romagna, Cesenatico, Italy
*[email protected], corresponding author
Keywords: chromophoric dissolved organic matter, Po river, Northern Adriatic, estuary.
Abstract
The light absorbing fraction of dissolved organic carbon (DOC), known as chromophoric dissolved
organic matter (CDOM) showed wide seasonal variations in the temperate estuarine zone in front of
the Po River mouth. DOC concentrations increased from winter through spring mainly as a seasonal
response to increasing phytoplankton production and thermohaline stratification. The monthly
dependence of the CDOM light absorption by salinity and chlorophyll a concentrations was
explored. In 2003, neither DOC nor CDOM were linearly correlated with salinity, due to an
exceptionally low Po river inflow. Though the CDOM absorbance coefficients showed a higher
content of chromophoric dissolved organic matter in 2004 with respect to 2003, the spectroscopic
features confirmed that the qualitative nature of CDOM was quite similar in both years.

MANUSCRIP
T
ACCEPTED
ACCEPTED MANUSCRIPT
2
CDOM and DOC underwent a conservative mixing, only after relevant Po river freshets, and a
change in optical features with an increase of the specific absorption coefficient was observed,
suggesting a prevailing terrestrial origin of dissolved organic matter.
1. Introduction
The general circulation in the Northern Adriatic Sea (NA) is characterized by a northward current
along the eastern coast and a Western Adriatic Current (WAC) flowing southwards along the
western coast. Near the Po River delta the stratification persists throughout most of the year
(Artegiani et al., 1997). The structure of the plume depends on the discharge rate and the
stratification of the water column, resulting in maximum offshore extension under high runoff,
strong Bora wind forcing and summer stratification (Mauri and Poulain, 2001). The Po River
freshwater may flow southward along the shelf strengthening the WAC (Malanotte-Rizzoli and
Bergamasco, 1983) or cross the shelf extending toward Istria in the central basin (Mauri and
Poulain, 2001). In particular, during periods of weak stratification, in absence of wind forcing,
vortices constrain fresh Po river waters to a southward flow along the Italian shelf (Orlić et al.,
1992). In contrast, during periods of stratification, particularly in spring-summer, the Po freshwater
plume spread across the basin to the Istrian coast to form a front that divides the northern basin
(Franco and Michelato, 1992; Jeffries and Lee, 2007). The extent of Po River inflow and wind
forcing, therefore, modulate fresh water (FW) penetration in the NA (Kourafalou, 1999; Jeffries and
Lee, 2007). Dilution processes are the main factor controlling dissolved and particulate organic
matter concentrations in the mixing zone of Po River (Pettine et al., 1999 and references therein).
Many efforts have been devoted to understand the dissolved organic carbon (DOC) cycle and the
role of chromophoric dissolved organic matter (CDOM) in the marine environment (Blough and
Del Vecchio, 2002 and references therein). The coastal zone, especially in areas adjacent to the
estuaries of major rivers, is a marine environment where key biogeochemical processes occur
(Hansell and Carlson, 2002). DOC represents the major fraction (60%) of riverine organic matter

MANUSCRIP
T
ACCEPTED
ACCEPTED MANUSCRIPT
3
(Spitzy and Ittekkot, 1991); in addition, a local source of autochthonous DOC from phytoplankton
and bacterial activity may be observed in the region influenced by freshwaters (Sempéré et al.,
2000; Raymond and Bauer, 2001). The estuaries are often characterized by high mixing rates that
make it difficult to discriminate between different DOC sources (e.g.: Stedmon and Markager,
2003). As CDOM is the most important sunlight-absorbing substance in the sea especially in the
UV and blue region of the spectrum (Ferrari, 2000 and references therein) its optical properties
provide information on DOM as a whole and on DOC fractions which are fundamental for studies
on organic matter and carbon fluxes in aquatic ecosystems (Bacastow and Maier-Reimer, 1991). A
fraction of CDOM consists of a mixture of aliphatic and aromatic substances deriving from the
degradation of terrestrial and aquatic plants (Kirk, 1994). This material contributes to form the light
absorbing fraction of DOM and its absorption is strongest in the UV region, restricting the
penetration into surface waters of biologically damaging UV radiation and protecting phytoplankton
and other aquatic organisms (e.g.: de Mora et al., 2000) but, at the same time, limiting the in depth
production because of its shading effect (Stedmon et al., 2000).
The aim of this work was to investigate the winter to spring variations of dissolved organic matter
and its chromophoric fraction in the temperate estuarine zone of the Northern Adriatic in two
periods (during 2003 and 2004) characterized by significantly different Po river inflows, in order to
elucidate its origin and composition. Correlations among DOC, CDOM and physical–chemical
parameters were also discussed in terms of processes involved.

MANUSCRIP
T
ACCEPTED
ACCEPTED MANUSCRIPT
4
2. Material and Methods
2.1 Sampling
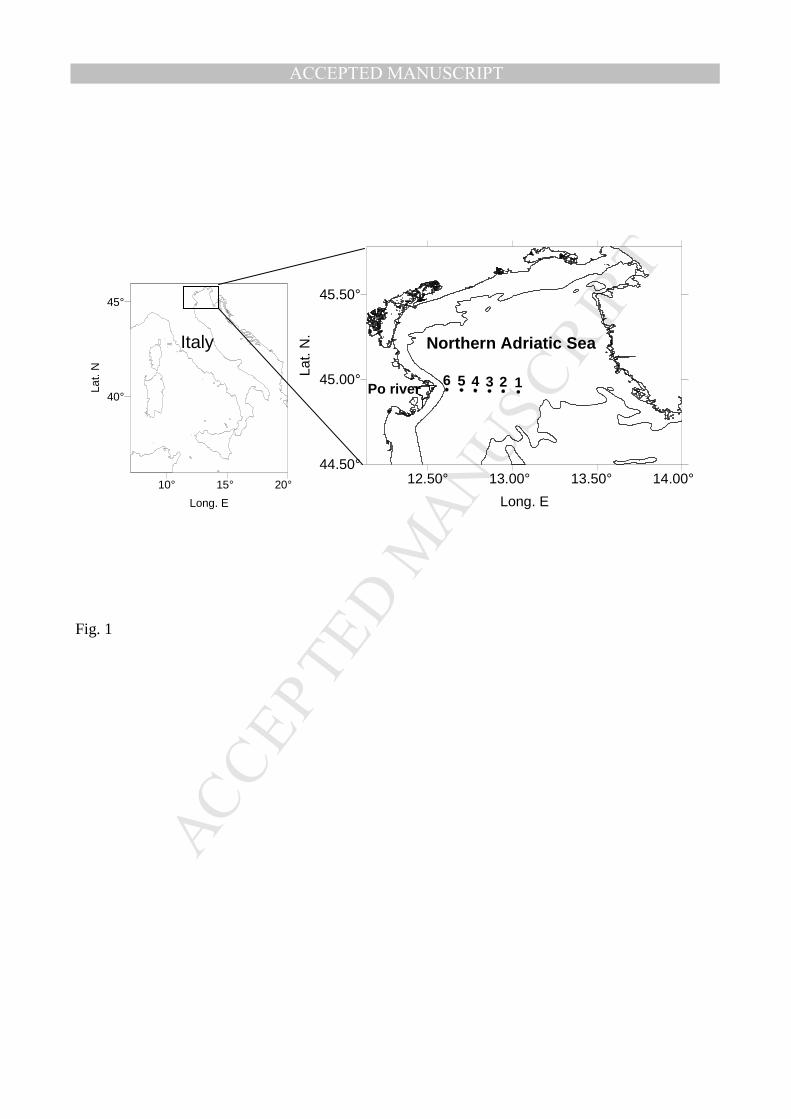
Water samples were collected at 6 stations on a transect from the Po Prodelta eastwards (Figure 1)
from February to May 2003 (ten cruises) and from February to June 2004 (ten cruises). Surface
waters were sampled using 5 L Niskin bottles. Water samples for DOC and POC analyses were
filtered through Whatman GF/F, precombusted at 480°C for 4 h. 100 µL of HgCl2 (1 g L-1) were
added to 10 ml of the seawater sample for DOC conservation (Cauwet, 1999). About 2 L of
seawater were filtered on Whatman GF/F for chlorophyll a (Chl a) analyses. All samples were
stored at –20 °C until analysis.
2.2 Analytical procedures
Temperature, depth and salinity were determined by a CTD probe (Conductivity, Temperature,
Depth, SEA BirdElectronics - SBE 25). Vertical CTD profiles were performed at all stations during
cruises in 2003 and 2004.
DOC concentrations of seawater samples were measured using a Shimadzu TOC 5000 Analyzer
and a 1.2 % Pt on silica catalyst at 680°C. Potassium hydrogen phthalate was used as standard. The
reproducibility of the analytical procedure was within 2-3 %.
POC was determined with a CHN Elemental Analyzer Carlo Erba Mod. EA1110, after acidification
with HCl (1N), to remove the inorganic carbonate fraction. Acetanilide was used as standard. The
reproducibility of the analytical system was lower than 2 %.
Chl a was extracted in acetone 90 % and determined by UV-VIS ATI Unicam UV2 double beam
spectrophotometer (Parson et al., 1984).
UV-Visible spectra of CDOM in waters were recorded from 280 to 800 nm by UV-VIS ATI
Unicam UV2 double beam spectrophotometer with quartz cells (5 cm) using Milli-Q water as
blank. Data were expressed as absorption coefficients: aλ= 2.303Aλ/L, where Aλ is the absorbance

MANUSCRIP
T
ACCEPTED
ACCEPTED MANUSCRIPT
5
at a given wavelength and L is the path length in meters. A baseline correction was applied by
subtracting the absorbance average value at 650 nm.
The absorption coefficient of CDOM at 355 nm (aCDOM355) was chosen (Blough and Del Vecchio,
2002), as the specific wavelength of 355 nm coincides with the pulsed frequency tripled Nd:YAG
excitation laser currently used in shipborne and airborne laser fluorescence spectroscopy sensing
(Ferrari and Dowell, 1998).
aCDOM280 at 280 nm was chosen because it is the spectral region where aromatic substances
(Traina et al. 1990), which are mainly of terrestrial origin as lignin, absorb.
The slope of the absorption spectra, SCDOM, describing the rate of decrease of CDOM absorption
with increasing wavelength, was extracted from the absorption data using an exponential decay
curve fitted to the plot of absorption (aλ, m-1) versus wavelength (λ) over the range 350-480 nm. The
SCDOM parameter was calculated according to Green and Blough (1994):
a(λ)= a(λo)e-S CDOM(λ-λo)
where λo = 480 nm is the initial wavelength, and SCDOM is the fitted parameter (nm-1) for the
exponential decay of aλ with increasing λ.
Nutrients (ammonium-NH4+, nitrite-NO2
-, nitrate-NO3-, orthophosphate-PO4
3- and orthosilicate-
Si(OH)4, were analysed spectrophotometrically (Parsons et al., 1984) by a Technicon TRAACS 800
autoanalyzer. Dissolved inorganic nitrogen (DIN) was calculated as the sum of the NH4+, NO2
- and
NO3- concentrations.
The salinity is expressed on the basis of the UNESCO practical salinity scale (PSS 1978).
For the graphical representations Grapher 7 (Golden Software Inc, USA) was used. Statistical
analyses were performed using Statistica 6 (Statsoft, USA).

MANUSCRIP
T
ACCEPTED
ACCEPTED MANUSCRIPT
6
3. Results and discussion
3. 1 Po river inflow
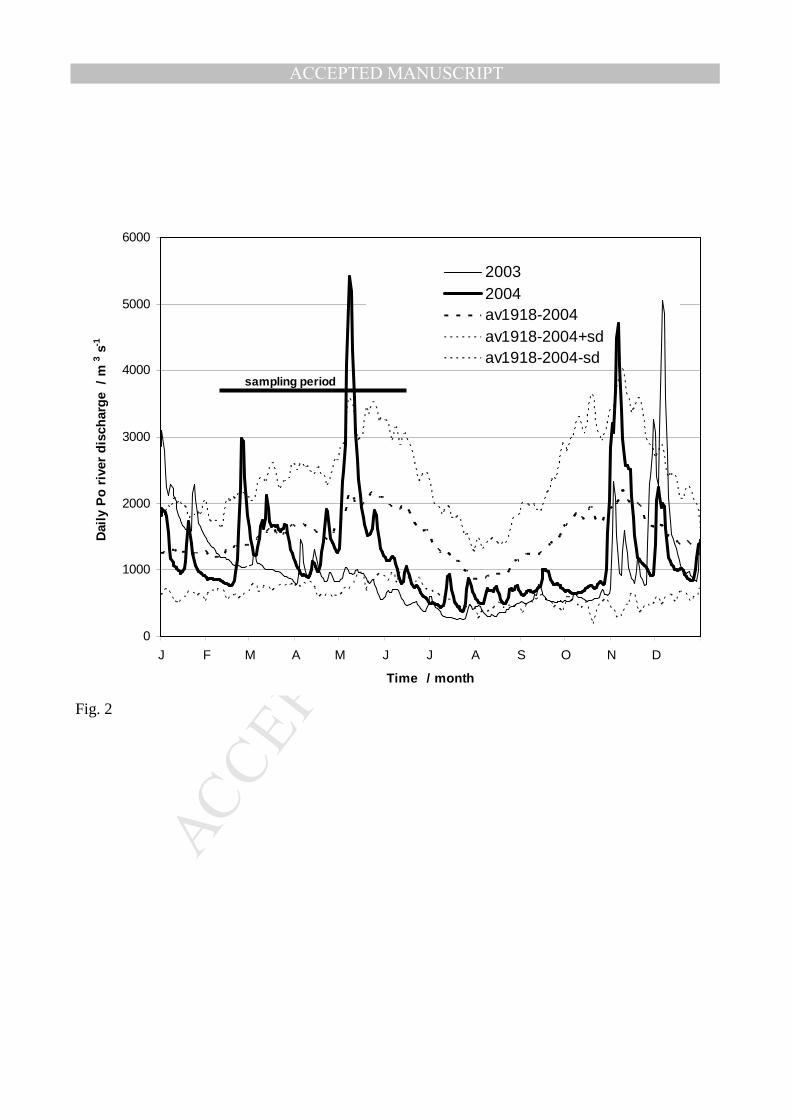
During the period 1918-2004 it has been observed that the Po river flow regimen was generally
characterized by two main periods of high rate in late spring (May-June) and autumn (October-
November) and by a minimum in summer (July-August). These variations are due to the seasonal
rainfall in the drainage basin and to the melting of snows on the mountains in late spring. The mean
daily inputs of the Po River in 2003 and 2004 are reported in Figure 2 along with the average flow
in the period 1918-2004.
During 2003, except in January and February, the Po river flow was lower than the 1918-2004
average, whereas in 2004 there were two main freshets in February (∼3000 m3s-1) and May (>5000
m3 s-1): this implied that higher salinities were observed during 2003 than in 2004.
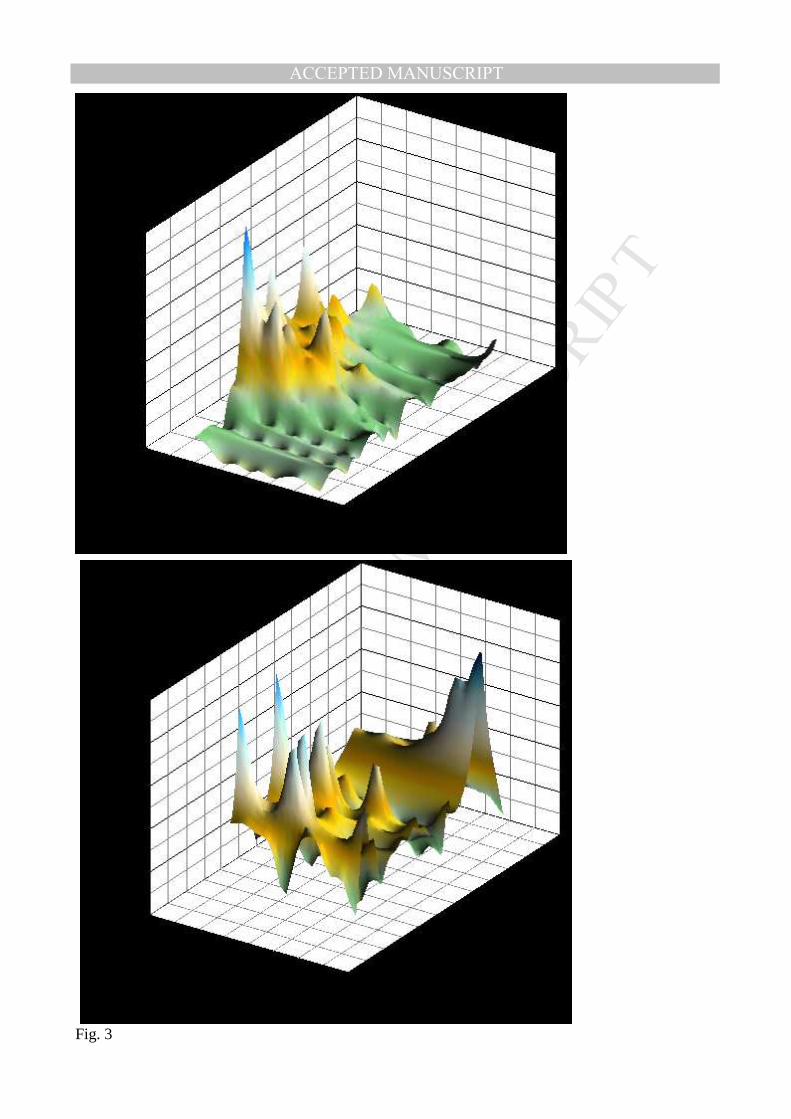
The stratification in front of the Po mouth was limited to the coastal waters during the winter-spring
period of 2003, whereas in 2004 the plume reached the centre of the NA basin and the
discontinuous discharges caused the advection of FW pools offshore. Therefore the salinity vertical
gradients (Fig. 3) were more marked in 2004 (∆S = 7±4) than in 2003 (∆S = 3±4). The situation
observed in front of Po delta is in accordance with the stronger warming of stratified surface waters
observed in spring 2004 in the NA with respect to 2003, which determined also a higher stability
(De Lazzari et al., 2008). Moreover, the higher river discharge of 2004 caused a more relevant
eastwards spreading of the plume than in 2003 and lower salinities (<35 psu) were observed near
the Po prodelta. Lower rainfall precipitation and higher salinities during spring-summer of 2003
were observed also in other areas of the Adriatic (Celio et al., 2006; Grbec et al., 2007) and are
supported by the more than 50% lower than average (1918-2004) Po inflows in spring of 2003 (Fig.
2) and by the lower content of fresh waters observed in the station in front of Po delta (fig. 4a).
The surface water temperatures ranged between 7.3 and 18.2 °C in 2003 and between 5.5 and 21.8
°C in 2004. The colder temperatures were observed in February in the less saline waters of the Po
river plume as usually observed in the Northern Adriatic (Russo et al., 2005). The highest

MANUSCRIP
T
ACCEPTED
ACCEPTED MANUSCRIPT
7
temperatures due to the seasonal warming were recorded on May 2003 and June 2004 in the
shallowest coastal station. The descriptive statistics for the parameters measured in surface waters
are summarized in Table 1.
3.2 Chlorophyll a and nutrients
The average and standard deviation of Chl a concentrations with statistically significant differences
between the two years are reported in Table 1.
Chl a concentrations were on average 4 fold higher in 2004 than in 2003 when an increased nutrient
availability sustained a more relevant phytoplankton biomass (Table 1). The monthly distribution of
Chl a in the 2003 and 2004 (Figure 4b) years showed high concentrations in the last period of 2004.
The highest value of the Chl a in the last period of 2004 was probably due to a phytoplankton
bloom of Cerataulina pelagica, stimulated by the nutrients carried by the Po river (Socal et al.,
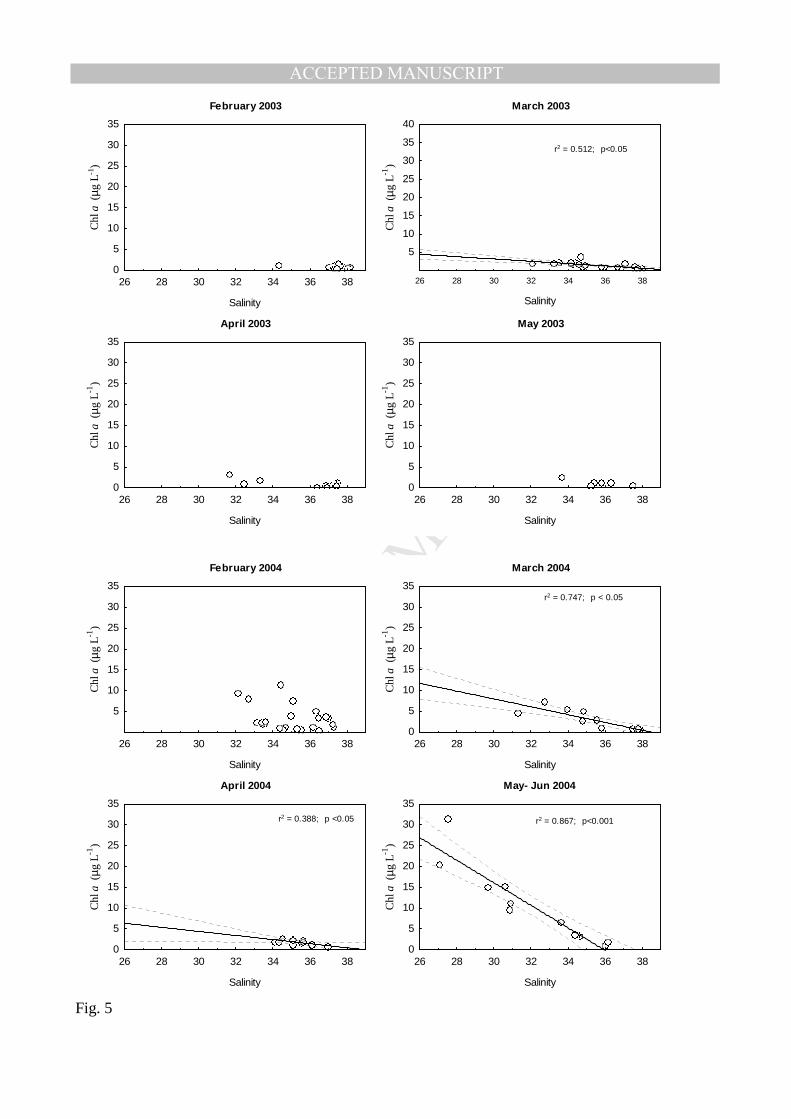
2008). The monthly Chl a concentrations plotted as a function of salinity in 2003 and 2004 (Figure
5) showed a negative linear relationships between Chl a and salinity in March 2003 and 2004, April
2004 and May-June 2004. This situation is typically observed in the NA when the spring runoff
determines an increase of Chl a concentrations (Barale et al., 2005, Mauri et al., 2007).
Relevant relationships were found between Chl a and orthosilicate concentrations in March, April
and May-June 2004 (Table 2) but were not observed in 2003. Considering that the influence of the
Po River was weaker in 2003 than in 2004, the river inputs significantly increased the primary
production and consequently the amount of organic matter in the basin.
The concentration of dissolved inorganic nitrogen (DIN) was on average higher in 2004 than in
2003, reaching the highest values in winter 2004: DIN had the same trend of NO3-, which was > 76
% of the nitrogen forms. Higher NH4+ concentrations were found in 2003 (Table 1) which could be
due to a more intense bacterial degradation, enhanced by the higher winter temperatures. A
significant negative relationship (p<0.05) has been found between DIN concentrations and salinity
showing that the major amount of nutrients was transported by riverine waters.

MANUSCRIP
T
ACCEPTED
ACCEPTED MANUSCRIPT
8
3.3 Dissolved Organic Carbon
The main fraction of total organic carbon in the waters was the dissolved form both in 2003 (mean:
86 %; range: 67-95 %) and in 2004 (mean: 78 %; range: 45-95 %); the lowest values in 2004 were
observed in February when the Po flow was low. Monthly variations in DOC concentrations in
2003 and 2004 showed lower concentrations in winter and higher in spring (Figure 4c) following a
trend typical for the northern Adriatic Sea (Giani et al., 2005). The gradual build up of DOC
accumulation proceeds from spring to summer when sub basin scale seasonal circulation structures
link the eutrophic western part with the oligotrophic central part of the basin. The cyclonic re-
circulation cause the transport of DOC produced in the coastal areas to the off-shore regions where
the system has low bacterial growth efficiency and long DOC utilization time (Polimene et al.,
2007). Significantly higher DOC concentrations in 2004 with respect to those observed in 2003
(Table 1) could be a consequence of the major input of Po River as well as of the exudation/release
from the more intense phytoplankton blooms associated with a higher retention of FW in the NA.
Mixing diagrams of concentrations along the salinity gradient were used to infer the net effect of
estuarine processes. Concentrations of DOC were plotted as a function of salinity for the different
periods of sampling (February, March, April and May-June) in 2003 and 2004. The fairly linear
plots corresponding to March 2003, March 2004 and May-June 2004 indicate a conservative mixing
of the dissolved organic matter during these periods (Figure 6).
A positive correlation between DOC and Chl a in February, March and May-June 2004 (Table 2)
highlights the contribution of the intense phytoplankton biomass, following which extracellular
polysaccharides probably represent a relevant fraction of dissolved organic carbon (Decho, 1990).
This is supported also by the increase of dissolved carbohydrate concentrations which are observed
during diatom blooms in the NA (Ahel at al., 2005 and references therein).

MANUSCRIP
T
ACCEPTED
ACCEPTED MANUSCRIPT
9
3.4 Chromophoric Dissolved Organic Matter
Values of chromophoric dissolved organic matter in 2004 were on average higher than those found
in 2003 (Table 1), with the highest values in May-June 2004. The absorption coefficients showed a
significant statistical difference between the two years (Table 1). The mean aCDOM280 absorbance
coefficients significantly (p<0.001) increased from 1.6 m-1 in 2003 to 2.2 m-1 in 2004; these
aCDOM280 values were similar to those found in coastal waters of Tuscany by Seritti et al. (1998).
Similarly the mean aCDOM355 absorbance coefficients also increased from 0.3 m-1 in 2003 to 0.5 m-
1 in 2004 (Table 1). These values for aCDOM355 fall in the range (0.4 - 1.1 m-1) reported by
Rochelle and Newall (2002b), for coastal areas in the Chesapeake Bay.
Sub-monthly variations in aCDOM355 in 2003 and 2004 (Figure 4f) could reflect the presence of
considerable amount of chromophoric dissolved organic matter of continental origin derived from
fluvial input. Nevertheless the contribution of bacterially transformed algal exudates, especially in
the April and May–June, during the strong river flows (Figure 2) and intense phytoplankton growth,
cannot be excluded.
The analysis of monthly data revealed significant correlations in May–June 2004 among salinity,
DOC, aCDOM280, aCDOM355 and Chl a samples collected after the Po freshets (Table 2). The
same was not observed in the previous months (February-April, Table 2). The trend of aCDOM355
is related to land proximity as the highest aCDOM355 is usually observed in freshwaters and
estuaries and decrease in coastal and offshore waters (Blough et al., 1993). aCDOM280 and
aCDOM355 were inversely correlated with salinity in May–June 2004 (Table 2). The linear
dependence between aCDOM and salinity (Figure 6) could be interpreted as the result of the
conservative mixing of terrestrial CDOM. A similar behaviour is usually observed in periods of
higher river input, lower solar irradiance and stratification breakdown (Blough and Del Vecchio,
2002).
Despite the fact that a significant fraction of the DOC is not associated with CDOM, a positive
correlation was observed between DOC values and aCDOM in May–June 2004 (Table 2). This

MANUSCRIP
T
ACCEPTED
ACCEPTED MANUSCRIPT
10
observation was also reported by several authors (Vodacek et al., 1995; 1997; Chen., 1999). The
amount of non-absorbing DOC in May–June 2004, extrapolated by the intercept on the DOC axis
from the positive correlation between aCDOM355 and DOC at aCDOM355 = 0, contributed to 86 %,
of the average DOC concentration of this period. Therefore the incidence of the absorbing fraction
was assumed to be 14 %. The estimation from aCDOM280 gave a 23% of incidence of the
chromophoric fraction on total dissolved organic carbon in the same period of 2004.
Considering all of the monthly cruises, there was no significant relationship between CDOM
concentration and Chl a concentration in almost all periods of 2003 and 2004, except for May-June
2004 when both aCDOM280 and aCDOM355 were correlated with Chl a (Table 2) and salinity (r = -
0.932, p<0.001). These strong relationships were probably a consequence of the mixing process,
both due to the input of fluvial-terrestrial chromophoric organic matter and possibly to bacterial
reprocessing of the algal organic matter produced by the phytoplankton. Recent research pointed
towards a microbial source of CDOM in the aquatic environment and led to the hypothesis that
phytoplankton is not a direct source of CDOM but that bacterial reprocessing of DOM of algal
origin is an important source of CDOM (Rochelle-Newall and Fisher, 2002a). The lack of observed
relationships between aCDOM and Chl a concentration has been reported in other works (Nelson et
al., 1998; Rochelle-Newall and Fisher 2002b) and this supports the hypothesis that CDOM is not
directly released by phytoplankton.
Whereas in both years a seasonal increase of DOC from winter to spring is evident (t test, p< 0.05),
the same is not true for aCDOM which has a stronger variability on the ten days and monthly time
scale (one way ANOVA, p<0.05). This suggests that there is probably no seasonal accumulation of
CDOM in the surface waters as this fraction is more labile than most of bulk DOM.
The specific UV absorption at 280 nm can be used as an index of the proportion of humic
compounds as a strong linear relationship exists between the molar absorptivity at 280 nm and the
aromatic content of water-soluble fulvic and humic acids (Chin et al., 1994). On this basis, the
riverine transport of terrestrially derived CDOM from Po River was probably the dominant delivery

MANUSCRIP
T
ACCEPTED
ACCEPTED MANUSCRIPT
11
mechanism by which CDOM entered in estuarine and coastal waters of northern Adriatic Sea. Also
in other marine environments, the contribution of chromophoric matter could derive from a large
fraction of humic compounds of fluvial or terrestrial origin (Blough et al., 1993), even if the role of
bacteria in reprocessing DOM of algal origin and producing CDOM is not excluded. According to
Twardowski et al., (2004) in situ production of CDOM in terrestrially dominated waters may be
evident only under a relatively stable water mass containing a high level of phytoplankton but a
relatively low background of terrestrial CDOM.
A significant positive relationship between aCDOM355 and DIN (Table 2) found in May-June 2004,
could derive from DOM photoproducts (Moran and Zepp, 1997) or by intense microbial
degradation (Coble et al., 1998 and references therein). CDOM, when photolytically degraded, can
be a source of dissolved organic and inorganic compounds such as NH4+and PO4
3- (Bushaw et al.,
1996): actually a strong relationship between aCDOM and NH4+ (Table 2) was observed in May-
June 2004. The absence of linear relationship between CDOM and phosphate in all the investigated
periods of 2003 and 2004 could be due to the low concentrations of phosphate in both years.
Though the riverine inflow was higher in 2004, the orthophosphate concentrations did not increase
as they were probably immediately taken up by phytoplankton. In 2004 the DIN/PO4 ratio (Figure
4) was much higher than in 2003 probably because the phosphate consumption limited the
assimilation of the DIN. The reduction of the phosphorus load in the Po River water (Pagnotta et al.,
1995) and a significant increase in the DIN/PO4 ratio in the NA surface waters was observed by
different authors (Rinaldi et al., 1998; Degobbis et al., 2000). Earlier research indicated that
phosphorus was also the primary limiting element in the NA prior to the reduction of its load
(Chiaudani and Vighi, 1982; Degobbis and Gilmartin, 1990). The lack of PO43- could play a role in
the CDOM accumulation by limiting its microbial degradation, as it was shown that phosphorous
exerts a limiting role on bacterial DOC degradation in the NA (Zoppini et al., 2005 and references
therein) or, by favouring, its transformation due to the enhanced alkaline phosphatase (Ivancic et al.,
2009).

MANUSCRIP
T
ACCEPTED
ACCEPTED MANUSCRIPT
12
Probably a concerted action of phytoplankton and bacteria concur to form CDOM as phytoplankton
provides substrates that heterotrophic bacteria process into coloured compounds (Rochelle-Newall
and Fisher, 2002). Moreover, the presence of biological by-products (e.g. nutrients) could stimulate
primary production (Bricaud et al., 1981) and secondary productivity (Nelson et al., 2004).
The spectral slope (SCDOM) was determined to improve the information about the nature of DOM
chromophores and quite similar values in 2003 and 2004 were observed (Table 1). The values in the
study area are similar to those reported by Babin et al. (2003) for the Adriatic Sea. The high
variability of SCDOM values in the two years and the absence of linear relationship between SCDOM
and salinity suggest a non conservative behaviour of SCDOM. This type of wide variability in S at
low CDOM concentrations has also been reported in earlier studies (Blough et al., 1993; Stedmon et
al., 2000). Possible reasons for the increase in standard deviation in the slope coefficients S are
photodegradation and bacterial utilization of CDOM, as both these processes have been reported to
have a flattening effect on the slope (Stedmon at al., 2000 and references therein).
The low values of specific absorption coefficients (a*CDOM), at 280 and 355 nm, obtained by
normalizing the absorbance at the specific λ per unit of DOC (Table 1), could be due to the
occurrence of low molecular weight compounds and low aromatic carbon content as found by
several authors (Chin et al., 1994). Similar values of a*CDOM at 280 and 355 nm have been
reported by Seritti et al. (1998) for the estuarine and coastal waters of the Tyrrhenian Sea. Changes
in the optical properties become evident only in May 2004 when the low salinity of waters
determined a 30 % increase in specific absorbtion coefficient of DOM (1.5±0.1 m-2gC-1 for
a*CDOM280 and 0.4±0.1 m-2gC-1 for a*CDOM355, respectively).
4. Conclusions
The Northern Adriatic waters in front of Po River are characterized by variations in hydrological
and physical processes which strongly influence the dissolved organic matter dynamics on a
monthly and sub-monthly time scale. A seasonal increase from winter to spring of DOC was
MANUSCRIP
T
ACCEPTED
ACCEPTED MANUSCRIPT
13
evident in both years of study, whereas the chromophoric fractions did not show a seasonal trend
similar to that of DOC, possibly because of its lability.
The relatively scarce riverine input in 2003 may account for the less significant relationship found
between DOC and nutrients concentrations, whereas the high values of DOC were probably a
consequence of the increased freshwaters inputs. The marked depletion of inorganic phosphorus
probably limits the microbial degradation of DOC, favouring its accumulation. CDOM values were
much higher in 2004 than in 2003 and the spectroscopic features showed that the average
qualitative nature of CDOM was quite similar in both years. Only after relevant freshets can an
increase of the specific absorption coefficient take place.
The contribution of UV-VIS absorbing DOC in May-June 2004, after the Po freshet, was estimated
to be 14-23% of DOC. The lack of relationships between CDOM and Chl a concentrations in both
years, with the exception of May-June 2004, could imply that the phytoplankton is not a direct
source of CDOM, whereas bacteria could play a relevant role in the CDOM production.
Aknowledgements
The authors are grateful to ARPA Emilia Romagna for supplying the Po river flow rate data. A
special thank is due to the scientific leader of the cruises Dr. Antonio Miralto of Stazione Zoologica
di Napoli for his help in planning and organizing the field activity. The valuable help of Visma II
crew and captain Giuliano Gianni† was fundamental to accomplishing the work.
References
Ahel, M., Tepic, N., Terzic, S. 2005. Spatial and temporal variability of carbohydrates in the
northern Adriatic-a possible link to mucilage events. The Science of the Total Environment 353,
139-150.
MANUSCRIP
T
ACCEPTED
ACCEPTED MANUSCRIPT
14
Artegiani, A., Bregant, E. Paschini, N. Pinardi, Raicich, F., Russo, A., 1997. The Adriatic Sea
general circulation. Part I: Air-Sea Interactions and Water Mass Structure. Journal of Physical
Oceanography 27, 1492– 1514.
Babin, M., Stramski, D., Ferrari, G.M:, Claustre, H., Bricaud, A., Obolensky G., Hoepffner, N.,
2003. Variations in the light absorption coefficients of phytoplankton, nonalagal particles, and
dissolved matter in coastal waters around Europe. Journal Geophysical Research, 108, NO C7,
3211.
Bacastow, R., Maier-Reimer, E., 1991. Dissolved organic carbon in modelling oceanic new
production. Global Biogeochemistry Cycles 5, 71–85.
Barale, V., Schiller, C., Tacchi, R., Marechal, C., 2005. Trends and interactions of physical and bio-
geo-chemical features in the Adriatic Sea as derived from satellite observations. The Science of
the Total Environment 353, 68-81.
Blough, N.V., Zafirou, O.C., Bonilla, J., 1993. Optical absorption spectra of waters from the
Orinoco river outflow: terrestrial input of colored organic matter to the Caribbean. Journal
Geophysical Research 98, 2271– 2278.
Blough, N.V., Del Vecchio, R., 2002. Chromophoric DOM in the coastal environment. In: Hansell,
D.A., Carlson, C.A.(Eds.), Biogeochemistry of Marine Dissolved Organic Matter. Elsevier, San
Diego, pp. 509-546.
Bricaud, A., Morel, A., Prieur, L., 1981. Absorption by dissolved organic matter of the sea (yellow
substance) in the UV and visible domains. Limnology Oceanography 26, 43-53.
Bushaw, K.L., Zepp, R.G., Tarr, M.A., Shulz-Jander, D., Bourbonniere, R.A., Hodson, R.E., Miller,
W.L., Bronk, D.A., Moran, M.A., 1996. Photochemical release of biologically available nitrogen
from aquatic dissolved organic matter. Nature 381, 404– 407.
Cauwet, G., 1999. Determination of dissolved organic carbon and nitrogen by high temperature
combustion. In Grasshoff, K., Kremling, K., Ehrhardt, M. (Eds.) Methods of seawater analysis,
Wuley VCH Weinheim, Germany, pp. 407-420.

MANUSCRIP
T
ACCEPTED
ACCEPTED MANUSCRIPT
15
Celio, M., Malačič,, Bussani, A., Čermely, B., Comici, C, Petelin, B., 2006. The coastal scale
observing system component of ADRICOSM: Gulf of Trieste network. Acta Adriatica 47, 65-79.
Chen, R.F., 1999. In situ fluorescence measurements in coastal waters. Organic Geochemistry 30,
397–409.
Chiaudani, G, Vighi, M., 1982. Multistep approach to identification of limiting nutrients in northern
Adriatic eutrophied coastal waters. Water Research 16, 161-1166.
Chin, Y.P., Alken, G., O’Loughlin, E., 1994. Molecular Weight Polydispersivity and spectroscopic
properties of aquatic humic substances. Environmental Science Technology 28, 1853-1858.
Coble, P.G., Del Castillo, C.E. Avril, B., 1998. Distribution and optical properties of CDOM in the
Arabian Sea during 1995 Southwest Monsoon. Deep-Sea Research II 45, 2195-2223.
Decho, A.W., 1990. Microbial exopolymer secretions in ocean environments: their role(s) in food
webs and marine processes. Oceanography Marine Review 28, 73-153.
Degobbis, D., Gilmartin, M., 1990. Nitrogen, phosphorus and silicon budgets for the northern
Adriatic Sea. Oceanological Acta 13, 31 – 45.
Degobbis, D., Precali, R., Ivanëić, I., Smodlaka, N., Fuks, D., Kveder, S., 2000. Long-term changes
in the northern Adriatic ecosystem related to anthropogenic eutrophication. International Journal
of Environmental Pollution 13, 495–533.
De Lazzari, A., Cassin D., Boldrin, A., Berto, D., Giani. M. 2008. Influence of winds and
oceanographic conditions on the mucilage aggregation in the Northern Adriatic Sea in 2003-
2006. Marine Ecology 29(3), 469-482.
de Mora, S., Demers, S., Vernet, M., 2000. The effect of UV radiation in the Marine Environment.
Cambridge University Press, Cambridge.
Ferrari, G.M., 2000. The relationship between chromophoric dissolved organic matter and dissolved
organic carbon in the European Atlantic coastal area and in the West Mediterranean Sea Gulf of
Lions. Marine Chemistry 70, 339-357.

MANUSCRIP
T
ACCEPTED
ACCEPTED MANUSCRIPT
16
Ferrari, G. M., Dowell, M. D. 1998. CDOM absorption characteristics with relation to fluorescence
and salinity in coastal areas of southern Baltic Sea. Estuarine, Coastal and Shelf Science 47, 91–
105.
Franco, P., Michelato, A., 1992. Northern Adriatic Sea: Oceanography of the basin proper and of
the western coastal zone in Marine Coastal Eutrophication.. Vollenweider, R.A, Marchetti, R., .
Viviani, R. (Eds), Elsevier, New York, pp. 35-62.
Giani, M., Savelli, F., Berto, D., Zangrando, V., Ćosović, B., Vojvodić, V., 2005. Temporal
dynamic of dissolved and particulate organic carbon in the northern Adriatic Sea in relation to
the mucilage events. The Science of the Total Environment 353, 126-138.
Grbec, B., Vilibić, I., Bajić, A., Morović, M., Beg Paklar, G., Matić, F., Dadić, V., 2007. Response
of the Adriatic to the atmospheric anomaly in 2003. Annales Geophysicae 25, 835-846.
Green, S.A., Blough, N.V., 1994. Optical absorption and fluorescence properties of chromophoric
dissolved organic matter in natural waters. Limnology Oceanography 39(8), 1903-1916.
Hansell, D.A., Carlson, C.A., (Eds) 2002. Biogeochemistry of Marine Dissolved Organic Matter.
Academic Press. London.774 pp.
Ivančić, I., Radić, T., Lyons, D. M.; Fuks, D., Precali, R., Kraus, R. 2009. Alkaline phosphatase
activity in relation to nutrient status in the northern Adriatic Sea Source: Marine Ecology
Progress Series 378, 27-35
Jeffries, M.A, Lee, C. M., 2007. A climatology of the northern Adriatic Sea’s response to bora and
river forcing. Journal of Geophysical Research 112, 1-18.
Kirk, J.T.O., 1994 Light and Photosynthesis in Aquatic Ecosystems, 2nd edition. Cambridge
University Press.
Kourafalou, V.H., 1999. Process studies on the Po River pulme, north Adriatic Sea. Journal of
Geophysical Research 104, 29963-29985.
Malanotte-Rizzoli, P., Bergamasco, A. 1983. The dynamics of the coastal region of the northern
Adriatic Sea. Journal of Physical Oceanography 13, 1105–1130.

MANUSCRIP
T
ACCEPTED
ACCEPTED MANUSCRIPT
17
Mauri, E., Poulain, P.M., 2001. Northern Adriatic Sea surface circulation and temperature/pigment
fields in September and October 1997. Journal of Marine Systems 29, 51–67.
Mauri, E., Poulain, P.M., Juznic-Zonta, Z., 2007. MODIS chlorophyll variability in the northern
Adriatic Sea and relationship with forcing parameters. Journal of Geophysical Research 122, 1-
14.
Moran, M. A., Zeep, R.G., 1997. Role of photoreactions in the formation of biologically labile
compounds from dissolved organic matter. LimnologyOceanography 42(6), 1307-1316.
Nelson, N.B., Siegel, D.A., Michaels, A.F., 1998. Seasonal dynamics of colored dissolved material
in the Sargasso Sea. Deep-Sea Research, Part1 45, 931-957.
Nelson, N.B., Carlson, C.A., Steinberg, D.K., 2004. Production of chromophoric dissolved organic
matter by Sargasso Sea microbes. Marine Chemistry 89, 273-287.
Orlić, M., Gačić, M., LA Violette, P.E., 1992. The currents and circulation of the Adriatic sea.
Oceanological Acta 15 (2), 109-124.
Pagnotta, R., Caggiati, G., Piazza, D., Ferrari, F., 1995. Il controllo della qualita` delle acque
superficiali del bacino padano. Inquinamento 4, 8-14.
Parsons, T.R., Maita, Y., Lalli, C.M., 1984. A Manual of Chemical and Biological Methods for
Seawater Analysis. Pergamon Press, Oxford.
Pettine, M., Patrolecco, L., Manganelli, M., Capri, S., Farrace, M.G., 1999. Seasonal variation of
dissolved organic matter in the Nortern Adriatic Sea. Marine Chemistry 64, 153-169.
Polimene, L., Pinardi, N., Zavatarelli, M., Allen, J. I., Giani, M., Vichi, M., 2007. A numerical
simulation study of dissolved organic carbon accumulation in the northern Adriatic Sea, Journal
of Geophysical Research, 112, C03S20, doi:10.1029/2006JC003529.
Rinaldi, A., Montanari, G., Ferrari, C.R., Ghetti, A., Vollenweider, A.R., 1998. Evoluzione dello
stato trofico nelle acque costiere Emiliano-Romagnole nel periodo 1982–1994. Evoluzione dello
stato trofico in Adriatico: analisi degli interventi attuati e future linee di intervento. Bologna,
Regione Emilia-Romagna; pp. 33–49.

MANUSCRIP
T
ACCEPTED
ACCEPTED MANUSCRIPT
18
Raymond, P.A., Bauer, J.E., 2001. DOC cycling in a temperate estuary: mass balance approach
using natural 14C and 13C isotopes. Limnology Oceanography 46, 655-667.
Rochelle-Newall, E.J., Fisher, T.R., 2002a. Production of chromophoric dissolved organic matter
fluorescence in marine and estuarine environments: an investigation into the role of
phytoplankton. Marine Chemistry 77, 7-21.
Rochelle-Newall, E.J., Fisher, T.R., 2002b. Chromophoric dissolved organic matter and dissolved
organic carbon in Chesapeake Bay. Marine Chemistry 77, 23– 41.
Russo, A., Maccaferri, S., Djakovac, T, Precali, R. , Degobbis, D., Deserti ,M., Paschini, E. Lyons.
D.M., 2005. Meteorological and oceanographic conditions in the northern Adriatic Sea during
the period June 1999-July 2002: Influence on the mucilage phenomenon. The Science of the
Total Environment, 24-38.
Sempéré, R., Charriére, B., Van Wambeke, F., Cauwet, G., 2000. Carbon inputs of the Rhone River
to the Mediterranean Sea: biogeochemical implications. Global Biogeochemical Cycles 14, 669 -
681.
Seritti, A, Russo, D. Nannicini, L., Del Vecchio, R., 1998. DOC, absorption and fluorescence
properties of estuarine and coastal waters of the Northern Tyrrhenian Sea. Chemical Speciation
and Bioavailability 10, 95-106.
Socal, G., Acri, F. Bastianini , M., Bernardi Aubry, F., Bianchi, F., Cassin, D., Coppola, J., De
Lazzari, A, Bandelj, V., Cossarini, G., Solidoro, C., 2008. Hydrological and biogeochemical
features of the Northern Adriatic Sea in the period 2003-2006. Marine Ecology 29, 449-468.
Spitzy, A., Ittekkot, V., 1991. Dissolved and particulate organic matter in rivers. In: Mantoura,
R.F.C., Martin, J.M., Wollast, R. (Eds.), Ocean Margin Processes in Global Change. Wiley
Press, New York pp.5-16.
Stedmon, C.A., Markager, S., Kaas, H., 2000. Optical Properties and Signatures of Chromophoric
Dissolved Organic Matter (CDOM) in Danish Coastal Waters. Estuarine Coastal Shelf Science
51, 267-278.
MANUSCRIP
T
ACCEPTED
ACCEPTED MANUSCRIPT
19
Stedmon, C.A., Markager, S., 2003. Behaviour of the optical properties of coloured dissolved
organic matter under conservative mixing. Estuarine Coastal Shelf Science 57, 973-979.
Traina, S. J., Novak, J., Smeck, N. E.. 1990. An ultraviolet absorbance method of estimating the
percent aromatic carbon content of humic acids. J. Environ. Qual. 19.151–153.
Twardowski, M. S.., Boss, E., Sullivan, J. M., Percy, L., 2004. Modelling the spectral shape of
absorption by chromophoric dissolved organic matter. Marine Chemistry 89, 69-88.
Vodacek, A., Hoge, F.E., Swift, R.N., Yungel, J.K., Peltzer, E.T., Blough, N.V., 1995. The in situ
and airborne fluorescence measurements to determine UV absorption coefficients and DOC
concentrations in surface waters. Limnology Oceanography 40, 411–415.
Vodacek, A., Blough, N.V., DeGrandpre, M.D., Peltzer, E.T., Nelson, R.K., 1997. Seasonal
variation of CDOM and DOC in the Middle Atlantic Bight: terrestrial inputs and photo-
oxidation. Limnology Oceanography 42 (4), 674–686.
Zoppini, A., Puddu, A., Fazi, S., Rosati, M., Sist, P., 2005. Extracellular enzyme activity and
dynamics of bacterial community in mucilaginous aggregates of the northern Adriatic Sea. The
Science of the Total Environment 353, 270-286.
Williamson C.E., Stenberger, R.S., Morris, D.P., Frost T.M., Paulsen, S.G., 1996. Ultraviolet
radiation in North American lakes: Attenuation estimates from DOC measurements and
implication for plankton communities. Limnology Oceanography 41, 1024-1034.
MANUSCRIP
T
ACCEPTED
ACCEPTED MANUSCRIPT
20
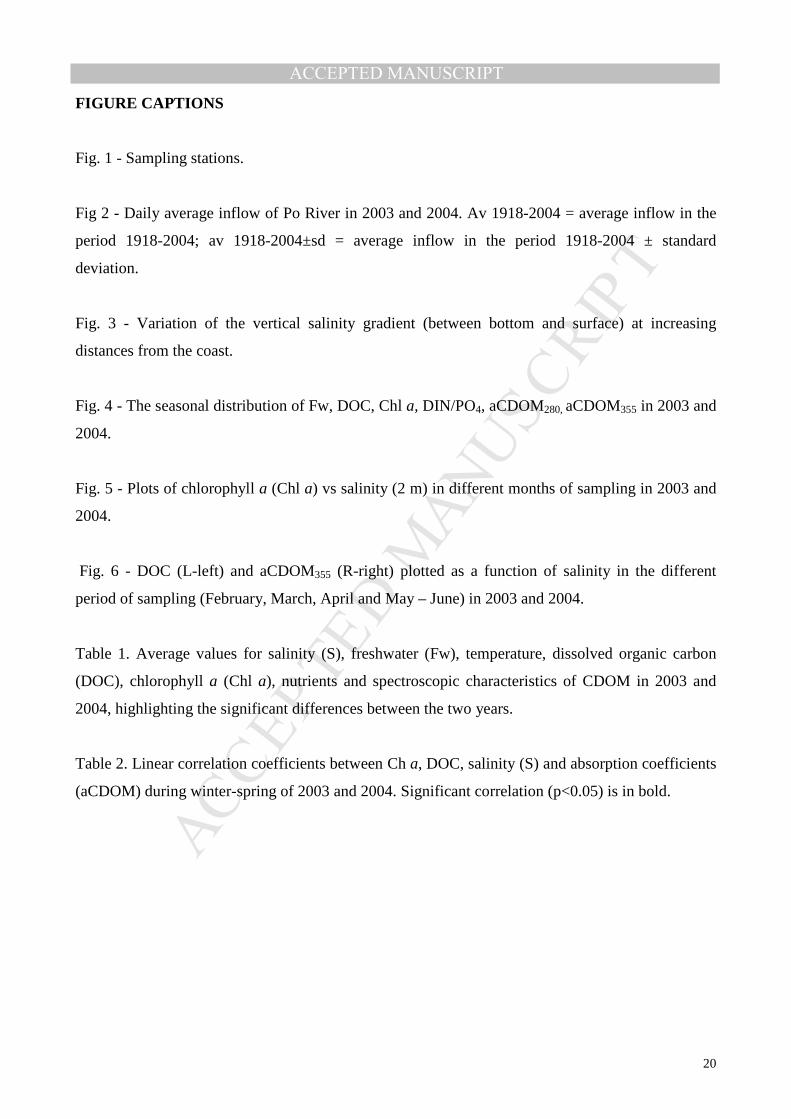
FIGURE CAPTIONS
Fig. 1 - Sampling stations.
Fig 2 - Daily average inflow of Po River in 2003 and 2004. Av 1918-2004 = average inflow in the
period 1918-2004; av 1918-2004±sd = average inflow in the period 1918-2004 ± standard
deviation.
Fig. 3 - Variation of the vertical salinity gradient (between bottom and surface) at increasing
distances from the coast.
Fig. 4 - The seasonal distribution of Fw, DOC, Chl a, DIN/PO4, aCDOM280, aCDOM355 in 2003 and
2004.
Fig. 5 - Plots of chlorophyll a (Chl a) vs salinity (2 m) in different months of sampling in 2003 and
2004.
Fig. 6 - DOC (L-left) and aCDOM355 (R-right) plotted as a function of salinity in the different
period of sampling (February, March, April and May – June) in 2003 and 2004.
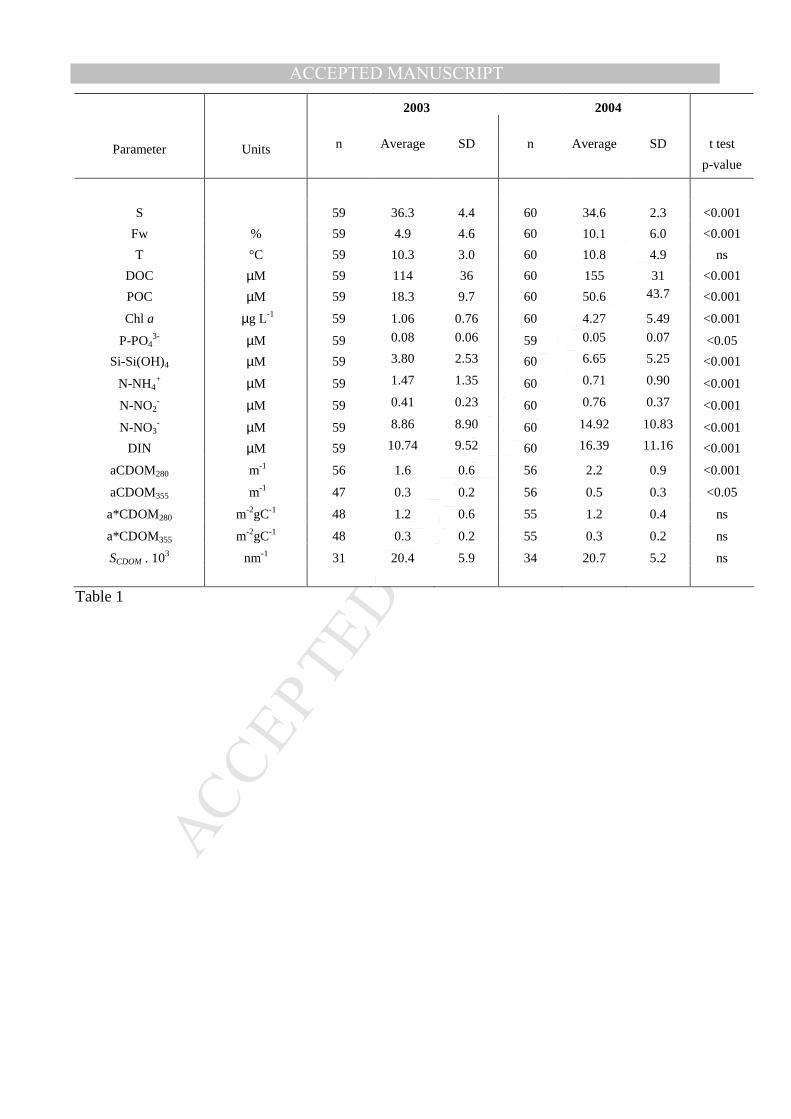
Table 1. Average values for salinity (S), freshwater (Fw), temperature, dissolved organic carbon
(DOC), chlorophyll a (Chl a), nutrients and spectroscopic characteristics of CDOM in 2003 and
2004, highlighting the significant differences between the two years.
Table 2. Linear correlation coefficients between Ch a, DOC, salinity (S) and absorption coefficients
(aCDOM) during winter-spring of 2003 and 2004. Significant correlation (p<0.05) is in bold.
MANUSCRIP
T
ACCEPTED
ACCEPTED MANUSCRIPT
2003 2004
Parameter Units n Average SD n Average SD t test
p-value
S 59 36.3 4.4 60 34.6 2.3 <0.001
Fw % 59 4.9 4.6 60 10.1 6.0 <0.001
T °C 59 10.3 3.0 60 10.8 4.9 ns
DOC µM 59 114 36 60 155 31 <0.001
POC µM 59 18.3 9.7 60 50.6 43.7 <0.001
Chl a µg L-1 59 1.06 0.76 60 4.27 5.49 <0.001
P-PO43- µM 59 0.08 0.06 59 0.05 0.07 <0.05
Si-Si(OH)4 µM 59 3.80 2.53 60 6.65 5.25 <0.001
N-NH4+ µM 59 1.47 1.35 60 0.71 0.90 <0.001
N-NO2- µM 59 0.41 0.23 60 0.76 0.37 <0.001
N-NO3- µM 59 8.86 8.90 60 14.92 10.83 <0.001
DIN µM 59 10.74 9.52 60 16.39 11.16 <0.001
aCDOM280 m-1 56 1.6 0.6 56 2.2 0.9 <0.001
aCDOM355 m-1 47 0.3 0.2 56 0.5 0.3 <0.05
a*CDOM280 m-2gC-1 48 1.2 0.6 55 1.2 0.4 ns
a*CDOM355 m-2gC-1 48 0.3 0.2 55 0.3 0.2 ns
SCDOM . 103 nm-1 31 20.4 5.9 34 20.7 5.2 ns
Table 1

MANUSCRIP
T
ACCEPTED
ACCEPTED MANUSCRIPTTable 2
February 2003 March 2003 April 2003 May 2003
n r p n r p n r p n r p
aCDOM355 vs S 12 0.101 n.s. 24 -0.042 n.s. 6 -0.153 n.s. 6 -0.382 n.s.
aCDOM280 vs S 12 -0.218 n.s. 24 -0.345 n.s. 6 -0.799 n.s. 6 -0.965 <0.005
DOC vs aCDOM355 12 0.017 n.s. 24 -0.317 n.s. 6 0.046 n.s. 6 -0.423 n.s.
DOC vs aCDOM280 12 0.174 n.s. 24 -0.116 n.s. 6 0.004 n.s. 6 0.013 n.s.
Chla vs aCDOM355 12 -0.292 n.s. 24 0.285 <0.05 6 0.084 n.s. 6 0.344 n.s.
Chla vs aCDOM280 12 -0.177 n.s. 24 0.410 <0.005 6 0.407 n.s. 6 0.598 <0.05
DOC vs Chla 17 -0.469 n.s. 24 0.202 n.s. 12 0.307 n.s. 6 0.357 n.s.
Chla vs P-PO43- 16 -0.449 n.s. 25 0.442 <0.05 12 0.421 n.s. 5 0.612 n.s.
Chla vs Si-Si(OH)4 16 0.495 n.s. 25 0.524 n.s. 12 0.416 n.s. 5 -0.800 <0.05
Chla vs N-NH4+ 16 -0.373 n.s. 25 0.263 n.s. 12 0.159 n.s. 5 -0.043 n.s.
Chla vs N-NO2- 16 -0.407 n.s. 25 0.354 n.s. 12 0.594 <0.05 5 0.06 n.s.
Chla vs N-NO3- 16 -0.507 <0,05 25 0.507 <0.05 12 0.650 <0.05 5 0.011 n.s.
aCDOM355 vs DIN 11 -0.260 n.s. 25 0.212 n.s. 6 -0.143 n.s. 6 0.520 n.s.
aCDOM355 vs N-NH4+ 11 -0.353 n.s. 25 0.513 <0.01 6 -0.652 n.s. 6 0.180 n.s.
February 2004 March 2004 April 2004 May-June 2004
n r p n r p n r p n r p
aCDOM355 vs S 19 -0.307 n.s. 12 0.026 n.s. 10 1.608 n.s. 12 -0.853 <0.001
aCDOM280 vs S 19 -0.443 n.s. 12 -0.023 n.s. 10 -0.150 n.s. 12 -0.946 <0.001
DOC vs aCDOM355 19 2.975 n.s. 12 -0.275 n.s. 10 -0.365 n.s. 12 0.546 <0.005
DOC vs aCDOM280 19 0.346 <0.05 12 0.138 n.s. 10 0.185 n.s. 12 0.544 <0.005
Chla vs aCDOM355 19 0.355 <0.05 12 -0.370 n.s. 10 0.492 <0.05 12 0.564 <0.005
Chla vs aCDOM280 19 4.969 <0.001 12 -0.059 n.s. 10 0.141 n.s. 12 0.590 <0.001
DOC vs Chla 23 0.577 <0.05 12 0.886 <0.001 11 -0.638 <0.05 12 0.649 <0.05
Chla vs P-PO43- 24 -0.025 n.s. 12 0.128 n.s. 11 -0.029 n.s. 11 -0.05 n.s.
Chla vs Si-Si(OH)4 24 0.134 n.s. 12 0.705 <0.05 11 0.728 <0.05 11 0.858 <0.05
Chla vs N-NH4+ 24 -0.251 n.s. 12 0.636 <0.05 11 -0.016 n.s. 11 0.822 <0.05
Chla vs N-NO2- 24 0.649 <0.005 12 0.599 <0.05 11 0.604 <0.05 11 0.926 <0.05
Chla vs N-NO3- 24 0.578 <0.005 12 0.140 n.s. 11 0.517 n.s. 11 0.241 n.s.
aCDOM355 vs DIN 22 -0.174 n.s. 12 0.364 n.s. 5 -0.013 n.s. 11 0.723 <0.05
aCDOM355 vs N-NH4+ 22 -0.188 n.s. 12 0.142 n.s. 5 -0.445 n.s. 11 0.888 <0.001
n.s.= not significative
MANUSCRIP
T
ACCEPTED
ACCEPTED MANUSCRIPT
10° 15° 20°
Long. E
40°
45°
Lat.
N
Italy
12.50° 13.00° 13.50° 14.00°
Long. E
44.50°
45.00°
45.50°La
t. N
.
123456Po river
Northern Adriatic Sea
Fig. 1
MANUSCRIP
T
ACCEPTED
ACCEPTED MANUSCRIPT
0
1000
2000
3000
4000
5000
6000
J F M A M J J A S O N D
Time / month
Dai
ly P
o r
iver
dis
char
ge
/ m
3 s-1
20032004av1918-2004av1918-2004+sdav1918-2004-sd
sampling period
Fig. 2
MANUSCRIP
T
ACCEPTED
ACCEPTED MANUSCRIPT
Date
Sb
ott
om
- S
surf
ace
Date
a) 2003
Date
Sb
ott
om
- S
surf
ace
Date
b) 2004
Fig. 3

MANUSCRIP
T
ACCEPTED
ACCEPTED MANUSCRIPT
30 60 90 120 150 180Julian days
0
4
8
12
16
20
24
28Fw (%)
20032004
30 60 90 120 150 180Julian days
0
4
8
12
16
20
24
Chl a (µg L-1)
20032004
30 60 90 120 150 180Julian days
0
0.5
1
1.5
2
2.5
3
3.5
4 aCDOM280
(m-1)
20032004
30 60 90 120 150 180Julian days
60
80
100
120
140
160
180
200
220 DOC (µM)
20032004
a) b) c)
d) e) f)
30 60 90 120 150 180Julian days
0
0.5
1
1.5 aCDOM355
(m-1)
20032004
30 60 90 120 150 180Julian days
10
100
1000
DIN/PO4 (molar ratio)
20032004
Fig. 4
MANUSCRIP
T
ACCEPTED
ACCEPTED MANUSCRIPT
February 2003
26 28 30 32 34 36 38
Salinity
0
5
10
15
20
25
30
35
Chl
a (
µg L
-1)
March 2003
26 28 30 32 34 36 38
Salinity
5
10
15
20
25
30
35
40
Chl
a (
µg L
-1)
April 2003
26 28 30 32 34 36 38
Salinity
0
5
10
15
20
25
30
35
Chl
a (
µg L
-1)
May 2003
26 28 30 32 34 36 38
Salinity
0
5
10
15
20
25
30
35
Chl
a (
µg L
-1)
r2 = 0.512; p<0.05
February 2004
26 28 30 32 34 36 38
Salinity
5
10
15
20
25
30
35
Chl
a (
µg L
-1)
March 2004
26 28 30 32 34 36 38
Salinity
0
5
10
15
20
25
30
35
Chl
a (
µg L
-1)
April 2004
26 28 30 32 34 36 38
Salinity
0
5
10
15
20
25
30
35
Chl
a (
µg L
-1)
May- Jun 2004
26 28 30 32 34 36 38
Salinity
0
5
10
15
20
25
30
35
Chl
a (
µg L
-1)
r2 = 0.747; p < 0.05
r2 = 0.388; p <0.05 r2 = 0.867; p<0.001
Fig. 5

MANUSCRIP
T
ACCEPTED
ACCEPTED MANUSCRIPT
February 2003
DOC(L)
aCDOM355(R)
26 28 30 32 34 36 38
Salinity
6080
100120140160180200220240260280
DO
C (
M
)
0.0
0.2
0.4
0.6
0.8
1.0
1.2
1.4
aCD
OM
355
(m
-1)
March 2003
DOC(L)
aCDOM355(R)
26 28 30 32 34 36 38
Salinity
6080
100120140160180200220240260280
DO
C (
M
)
0.0
0.2
0.4
0.6
0.8
1.0
1.2
1.4
aCD
OM
355
(m
-1)
April 2003
DOC(L)
aCDOM355(R)
26 28 30 32 34 36 38
Salinity
6080
100120140160180200220240260280
DO
C (
M
)
0.0
0.2
0.4
0.6
0.8
1.0
1.2
1.4
aCD
OM
355
(m
-1)
May 2003
DOC(L)
aCDOM355(R)
26 28 30 32 34 36 38
Salinity
100
120
140
160
180
200
220
240
260
280
DO
C (
M
)
0.0
0.2
0.4
0.6
0.8
1.0
1.2
1.4
aCD
OM
355
(m
-1)
r2 = 0,370; p <0.05(DOC) r2 = 0.370 p <0.05
February 2004
DO
C (
M
)
DOC(L)
aCDOM355(R)
26 28 30 32 34 36 38
Salinity
6080
100120140160180200220240260280
0.0
0.2
0.4
0.6
0.8
1.0
1.2
1.4
aCD
OM
355
(m
-1)
March 2004
DO
C (
M
)
DOC(L) aCDOM355(R)
28 30 32 34 36 38
Salinity
6080
100120140160180200220240260280
0.0
0.2
0.4
0.6
0.8
1.0
1.2
1.4aC
DO
M 3
55 (
m-1
)
April 2004
DOC(L)
aCDOM355(R)
28 30 32 34 36 38
Salinity
6080
100120140160180200220240260280
DO
C (
M
)
0.0
0.2
0.4
0.6
0.8
1.0
1.2
1.4
aCD
OM
355
(m
-1)
May-Jun 2004
DOC(L) aCDOM355(R)
26 28 30 32 34 36 38
Salinity
6080
100120140160180200220240260280
DO
C (
M
)
0.0
0.2
0.4
0.6
0.8
1.0
1.2
1.4
aCD
OM
355
(m
-1)
(DOC) r2 = 0.637 p <0.05
(DOC) r2 = 0.445 p<0.05
(aCDOM355) r2 = 0.723 p<0.05
Fig.6