Influence Of Dissolved Hydrogen On The Fatigue Crack ...
196
Wayne State University Wayne State University Dissertations 1-1-2014 Influence Of Dissolved Hydrogen On e Fatigue Crack Growth Behaviour Of Aisi 4140 Steel Varun Ramasagara Nagarajan Wayne State University, Follow this and additional works at: hp://digitalcommons.wayne.edu/oa_dissertations is Open Access Dissertation is brought to you for free and open access by DigitalCommons@WayneState. It has been accepted for inclusion in Wayne State University Dissertations by an authorized administrator of DigitalCommons@WayneState. Recommended Citation Ramasagara Nagarajan, Varun, "Influence Of Dissolved Hydrogen On e Fatigue Crack Growth Behaviour Of Aisi 4140 Steel" (2014). Wayne State University Dissertations. Paper 973.
-
Upload
khangminh22 -
Category
Documents
-
view
2 -
download
0
Transcript of Influence Of Dissolved Hydrogen On The Fatigue Crack ...

Wayne State University
Wayne State University Dissertations
1-1-2014
Influence Of Dissolved Hydrogen On The FatigueCrack Growth Behaviour Of Aisi 4140 SteelVarun Ramasagara NagarajanWayne State University,
Follow this and additional works at: http://digitalcommons.wayne.edu/oa_dissertations
This Open Access Dissertation is brought to you for free and open access by DigitalCommons@WayneState. It has been accepted for inclusion inWayne State University Dissertations by an authorized administrator of DigitalCommons@WayneState.
Recommended CitationRamasagara Nagarajan, Varun, "Influence Of Dissolved Hydrogen On The Fatigue Crack Growth Behaviour Of Aisi 4140 Steel"(2014). Wayne State University Dissertations. Paper 973.

INFLUENCE OF DISSOLVED HYDROGEN ON THE FATIGUE CRACK GROWTH
BEHAVIOUR OF AISI 4140 STEEL
by
VARUN RAMASAGARA NAGARAJAN
DISSERTATION
Submitted to the Graduate School
of Wayne State University,
Detroit, Michigan
in partial fulfillment of the requirements
for the degree of
DOCTOR OF PHILOSOPHY
2014
MAJOR: MATERIALS SCIENCE AND
ENGINEERING
Approved by:
Advisor Date

ii
DEDICATION
This dissertation work is dedicated to my beloved wife, my lovely mother, my inspiring father,
my sweet sister and all my family members and my friends.

iii
ACKNOWLEDGEMENTS
This investigation was carried out under a grant from Office of Naval Research (ONR) - ONR
grant No: N 00014-09-1-0535. I would like to express my sincere thanks and gratitude to Dr.
Asuri K. Vasudevan, Program Manager at ONR for the financial support of this research. I am
deeply indebted to my mentor, teacher and advisor Prof. Susil K. Putatunda for his continuous
financial and technical support in bringing this work to its current state. This work would have
remained only as a research proposal had it not for his efforts to apply, struggle and secure
funding for this research. In addition, after advising my Master’s degree thesis, I would like to
thank him again for the having confidence, faith and patience to assign this project to me.
I want to thank Mr. Eugene Snowden and Mr. Marvin Santure, the technicians at the engineering
workshop for their work in preparing all the test samples. I am very thankful to Dr. James M.
Boileau and Mr. John Kelly from Ford Motor Company, Dearborn, MI for all their support to
allow me to complete part of my work at Ford Research Labs for sharing of knowledge and also
for the machining support to make the test samples. I am immensely thankful to Prof.
Eswarahalli Sundararajan Dwarakadasa, retired professor at Indian Institute of Science (IISc),
Bangalore, India for his advice on my fatigue experiments. I want to express my appreciation to
Dr. Srinivasan Venkatesan who was a part time faculty at Wayne State for his inputs on
electrochemical aspects of my studies. I am grateful to my committee members, Prof. Howard
W. Matthew, Prof. Golam M. Newaz, Prof. Gavin Lawes and Dr. James M. Boileau for their
suggestions, feedback, taking time to review my work and for serving on my graduate defence
committee.

iv
My sincere thanks to my father, G.V. Nagarajan, who initiated and advised me to pursue my
Ph.D. degree. This endeavor was possible only due to his belief in my ability and strength. My
Ph.D. journey was achievable due to encouragement and emotional support from my mother,
R. Vagadevi, whose words helped me a lot during difficult times. I would have given up my
degree if not for my mother’s strong words of encouragement. The final dissertation report was
largely possible, in this final form, only due pressing support from my dear wife Archana
Nagarajan. She was instrumental in supporting me throughout my degree and I appreciate her
efforts in bearing down on me to complete this report as quickly as possible. The list is not
complete without appreciating my sweet sister, Varsha Ramasagara Nagarajan, for her
encouragement and support. I want to say thanks to my mother in law, M.S. Sharadamma, and
father in law, Prof. K. Nagarajan, for their prayers and blessings. In addition, I am grateful to my
grandparents for being very supportive of my career.
This dissertation reached completion only due to the assistance, support and advice from my dear
lab mates, Codrick J. Martis and Saranya Panneerselvam. I appreciate their efforts to assist in my
experiments, to assist me with my paperwork in my absence and for assistance in organizing the
prospectus and final defence meetings.

v
FOREWORD
A lot of work has been done on understanding the influence of hydrogen on the fatigue
behaviour of high and low strength steels. Though many studies tend to develop a theoretical
equation based mechanism to explain the experimental observations, these equation tend to give
unsatisfactory trends when the process conditions are slightly modified than the initial conditions
even after accounting for the expected change due to modification of process conditions.
Therefore, it is my sincere effort, through this study, to explain my experimental observations
and correlate them to any observable evidence which might throw light on the mechanistic
process involved. In addition, an honest attempt has been made to explore austempering as a
possible route to obtaining high strength steel and verify its susceptibility to hydrogen in a cyclic
loading condition.

vi
TABLE OF CONTENTS
Dedication ....................................................................................................................................... ii
Acknowledgements ........................................................................................................................ iii
Foreword ......................................................................................................................................... v
List of Figures ................................................................................................................................ ix
List of Tables ............................................................................................................................... xiv
CHAPTER 1 - INTRODUCTION .................................................................................................. 1
Fatigue Behaviour and Corrosion Fatigue .................................................................................. 1
Stress Corrosion Cracking .......................................................................................................... 3
CHAPTER 2 - LITERATURE REVIEW ....................................................................................... 6
Fatigue Behaviour of Metallic Materials .................................................................................... 6
Stress Corrosion Cracking .......................................................................................................... 8
Hydrogen Embrittlement .......................................................................................................... 11
AISI 4140 .................................................................................................................................. 16
Austempering Heat Treatment .................................................................................................. 18
CHAPTER 3 - OBJECTIVES ...................................................................................................... 20
CHAPTER 4 - EXPERIMENTAL MATERIALS AND METHODS ......................................... 21
Material ..................................................................................................................................... 21
Heat Treatment.......................................................................................................................... 23
Microstructural Analysis ........................................................................................................... 25

vii
X-Ray Diffraction (XRD) Analysis .......................................................................................... 35
TEM Imaging ............................................................................................................................ 37
External Hydrogen Charging .................................................................................................... 46
Hydrogen Concentration Analysis (Vacuum Hot Extraction) .................................................. 47
Fatigue Testing.......................................................................................................................... 48
Stress Corrosion Cracking Testing ........................................................................................... 49
Fractography ............................................................................................................................. 49
CHAPTER 5 - RESULTS ............................................................................................................. 51
Influence of Time on dissolved hydrogen concentration .......................................................... 51
Fatigue crack growth behaviour of the material in Annealed (as-received) condition ............. 54
Fatigue crack growth behaviour of the material in Austempered Batch - 1 (AB1) condition .. 63
Fatigue crack growth behaviour of the material in Austempered Batch 2 (AB2) condition .... 71
Comparison of Fatigue Crack Growth Behaviour among different heat treatment conditions 80
Stress Corrosion Cracking ........................................................................................................ 98
Qualitative mechanism to explain the FCGRs in the Intermediate growth rate (10-8
˜ 10-7
m/cycle) region ....................................................................................................................... 107
Mechanistic explanation of Fatigue Threshold Stress Intensity Factor (ΔKth) and Near
Threshold Fatigue Crack Growth Rates .................................................................................. 121
Mechanistic explanation of Linear Region Fatigue Crack Growth Rates .............................. 149
CHAPTER 6 - CONCLUSIONS ................................................................................................ 161

viii
CHAPTER 7 – FUTURE WORK .............................................................................................. 164
References ................................................................................................................................... 165
Abstract ....................................................................................................................................... 177
Autobiographical Statement........................................................................................................ 180

ix
LIST OF FIGURES
Figure 1: Schematic representation of fatigue crack growth rate vs. stress intensity factor ............2
Figure 2: Schematic representation of SCC curve of crack growth rate vs. stress intensity
factor[4] ...........................................................................................................................5
Figure 3: Dimensions of the CT specimen used for fracture toughness (KIC) testing (all
dimensions are in inches) ..............................................................................................22
Figure 4: Dimensions of the tensile specimen (all dimensions are in inches) ...............................23
Figure 5: Microstructure of the annealed sample (Magnification: 1000X) ...................................27
Figure 6: Microstructure (SEM) and X-ray map of inclusions of the annealed sample
(a, b: SEM image - 1000X and 5000X respectively; c, d and e: X-ray map of Fe,
Al and O respectively at the void location in a) ............................................................28
Figure 7: Microstructure of the AB1 sample (Magnification: 1000X) ..........................................30
Figure 8: Microstructure (SEM) and X-ray maps of the AB1 sample (Magnification: a, b -
1000X, 5000X respectively; c - inclusion; d - Fe (Red); e - Mn (Purple); f - S
(Yellow); g - Al (Blue) and h - O (green) .....................................................................31
Figure 9: Microstructure of the AB2 sample (Magnification: 1000X) ..........................................32
Figure 10: Microstructure (SEM and X-ray maps) of the AB2 sample (Magnification: a, b -
1000X, 5000X respectively; c - inclusion; d - Fe (Red); e - Mn (Blue); f - S
(Green); g - Al (Green dot) and h - O (orange dot) .......................................................33
Figure 11: XRD peak identification for the 4140 steel samples: Annealed - AI-10 (Blue),
Austempered AB1 (349°C) - HT -2 (Red) and Austempered AB2 (332°C) - AU -
1 (Black) ........................................................................................................................37
Figure 12: (a): Bright field image of AB1 material; (b): dark field image of spot 1 - α(011)
reflection; (c): dark field image of spot 2 - α(121) reflection; and (d): dark field
image of spot 6 - α(110)II [Magnification: 25000X] ....................................................39

x
Figure 13: (a): Bright field image of AB2 material; (b): Dark field image of Spot 1 -
α(110); (c): Dark field image of Spot 4 - α(200)II; and (d): dark field image of
Spot 6 - Fe3C(130) [Magnification: 25000X] ...............................................................43
Figure 14: Experimental setup of external hydrogen charging ......................................................47
Figure 15: Comparison of fatigue crack growth rate in the linear region for annealed
samples ..........................................................................................................................55
Figure 16: Fatigue surface images of annealed material in linear region (ΔK (SIF) are in
MPa√m) [Note: Crack propagation from right to left in all images;
Magnification: 1000X] ..................................................................................................57
Figure 17: Comparison of fatigue crack growth rate in the near threshold region for
annealed samples ...........................................................................................................60
Figure 18: Fatigue surface images of annealed material in threshold region (ΔK (SIF) are in
MPa√m [Note: crack propagation from right to left in all images; Magnification:
1000X] ...........................................................................................................................61
Figure 19: Comparison of fatigue crack growth rates in the linear region for AB1 samples ........64
Figure 20: Fatigue surface images of AB1 material in linear region (ΔK (SIF) are in
MPa√m) [Note: Crack propagation from right to left in all images;
Magnification: 1000X] ..................................................................................................65
Figure 21: Comparison of fatigue crack growth rate in the near threshold region for AB1
samples ..........................................................................................................................67
Figure 22: Fatigue surface images of AB1 material in threshold region (ΔK (SIF) are in
MPa√m) [Note: crack propagation from right to left in all image; Magnification:
1000X] ...........................................................................................................................69
Figure 23: Comparison of fatigue crack growth rate in the linear region for AB2 samples ..........72
Figure 24: Fatigue surface images of AB2 material in linear region (ΔK (SIF) are in
MPa√m) [Note: crack propagation from right to left in all images; Magnification:
1000X] ...........................................................................................................................74

xi
Figure 25: Comparison of fatigue crack growth rate in the near threshold region for AB2
samples ..........................................................................................................................76
Figure 26: Fatigue surface images of AB2 material (ΔK (SIF) are in MPa√m)
[Note: crack propagation from right to left in all images; Magnification: 1000X] .......78
Figure 27: Near threshold fatigue crack growth behavior of the material with no exposure
to hydrogen charging .....................................................................................................82
Figure 28: Near threshold fatigue crack growth behavior of the material with 150 hrs of
exposure to hydrogen ....................................................................................................86
Figure 29: Near threshold fatigue crack growth behavior of the material with 200 hrs
exposure to hydrogen ....................................................................................................87
Figure 30: Near threshold fatigue crack growth behavior of the material with 250 hrs
exposure to hydrogen ....................................................................................................88
Figure 31: Comparison of the fatigue crack growth behavior of the annealed and
austempered samples with no exposure to hydrogen charging .....................................91
Figure 32: Comparison of the fatigue crack growth behavior of the annealed and
austempered samples with 150hrs of exposure to hydrogen .........................................94
Figure 33: Comparison of the fatigue crack growth behavior of the annealed and
austempered samples with 200 hrs of exposure to hydrogen ........................................95
Figure 34: Comparison of the fatigue crack growth behavior of the annealed and
austempered samples with 250hrs of exposure to hydrogen .........................................96
Figure 35: SCC behaviour of annealed material at different charging times of dissolved
hydrogen (150 hrs – red; 200 hrs – green; 250 hrs – black) ..........................................99
Figure 36: SCC behaviour of AB1 material at different charging times of dissolved
hydrogen (150 hrs – red; 200 hrs – green; 250 hrs – black) ........................................100
Figure 37: Influence of Hydrogen Concentration on Incubation period at different stress
intensity levels in AB1 material ..................................................................................103

xii
Figure 38: Influence of hydrogen concentration (Co) on KISCC (blue – AB1 material (heat
treated – HT; red - annealed) .......................................................................................105
Figure 39: Influence of hydrogen concentration (Co) on da/dt in Region 2 (blue – AB1
material (heat treated – HT); red - annealed) ..............................................................106
Figure 40: Classification of plateau region by McEvily and Wei [97, 98] ..................................107
Figure 41: Comparison of FCGRs in Annealed material in Intermediate region
(10-8 ˜ 10-7 m/cycle) ...................................................................................................110
Figure 42: Fatigue surface images of annealed material (ΔK (SIF) are in MPa√m) [Note:
Crack propagation from right to left in all images; Magnification: 1000X] ...............111
Figure 43: Comparison of FCGRs in AB1 material in Intermediate region
(10-8 ˜ 10-7 m/cycle) ...................................................................................................114
Figure 44: Fatigue surface images of AB1 material (ΔK (SIF) are in MPa√m)
[Note: Crack propagation from right to left in all images; Magnification: 1000X] ....117
Figure 45: Comparison of FCGRs in AB2 material in Intermediate region (10-8 ˜ 10-7
m/cycle) .......................................................................................................................119
Figure 46: Fatigue surface images of AB2 material (ΔK (SIF) are in MPa√m) [Note: Crack
propagation from right to left in all images; Magnification: 1500X] ..........................120
Figure 47: Fatigue surface images of annealed material in threshold region (ΔK (SIF) are in
MPa√m) [Note: Crack propagation from right to left in all images;
Magnification: 1000X] ................................................................................................123
Figure 48: Macro photograph of the near threshold region to check for oxide products in
annealed material; (a) No hydrogen, (b) 150 hrs, (c) 200 hrs and (d) 250 hrs
[Note: Crack propagation from right to left in all images; Magnifications: (a)
25X, (b) - (d) 23X] ......................................................................................................130
Figure 49: Fatigue surface images of AB1 material in threshold region (ΔK (SIF) are in
MPa√m [Note: Crack propagation from right to left in all images; Magnification:
1000X] .........................................................................................................................133

xiii
Figure 50: Banded microstructure of the AB1 material with MnS inclusion (bright white
elongated feature at lower left section; Magnification: 500X) ....................................134
Figure 51: EDS map of the banded feature from the fracture surface showing MnS
inclusions in AB1 material ..........................................................................................134
Figure 52: Macro photograph of the near threshold region to check for oxide products in
AB1 material; (a) No hydrogen, (b) 150 hrs, (c) 200 hrs and (d) 250 hrs [Note:
Crack propagation from right to left in all images; Magnification: 25X] ..................138
Figure 53: Fractographs of AB1 material showing the peak in IG facets at the start of the
near threshold region; ΔK ≈ 19 MPa√m [Note: Crack propagation from right to
left in all images; Magnification: 1000 X] ..................................................................140
Figure 54: Crack propagation plane in AB2 material of the sample charged with hydrogen
for 200 hrs showing the appearance of shear lips near the crack starter notch
(Magnification: 27X) ...................................................................................................141
Figure 55: Fatigue surface images of AB2 material (ΔK (SIF) are in MPa√m)
[Note: Crack propagation from right to left in all images; Magnification: 1000X] ....145
Figure 56: SEM image (Magnification: 1500X) and EDS spectrum of Iron Oxide found in
the threshold region of the AB2 sample charged with hydrogen for 250 hrs .............146
Figure 57: Fatigue surface images of annealed material in linear region (ΔK (SIF) are in
MPa√m) [Note: Crack propagation from right to left in all images;
Magnification: 600X: (k) and 1000 X: rest of the images] .........................................151
Figure 58: Fatigue surface images of AB1 material in linear region (ΔK (SIF) are in
MPa√m) [Note: Crack propagation from right to left in all images;
Magnification: 1000X] ................................................................................................156
Figure 59: Fatigue surface images of AB2 material in linear region (ΔK (SIF) are in
MPa√m) [Note: Crack propagation from right to left in all images;
Magnification: (c) – 500X, all other images – 1000X] ...............................................160

xiv
LIST OF TABLES
Table 1: Chemical composition of the material (in wt %) .............................................................21
Table 2: Mechanical properties of AISI 4140 alloy after heat treatment ......................................24
Table 3: Volume fraction of phases (in %) present in the Annealed condition .............................34
Table 4: Volume fraction of phases present in the Austempered condition ..................................35
Table 5: Diffraction indices of AB1 material ................................................................................40
Table 6: Diffraction indexing of AB2 material..............................................................................44
Table 7: Influence of charging time on hydrogen concentration ...................................................53
Table 8: ΔKth for annealed and heat treated samples without any dissolved hydrogen ................83
Table 9: ΔKth for annealed and heat treated samples for different hydrogen exposure times ......89
Table 10: Comparison of Paris Constants for annealed and austempered samples .......................92
Table 11: Paris constants for different hydrogen exposure time ...................................................97
Table 12: KISCC parameter of the annealed material for different hydrogen charging time .....101
Table 13: Values of Monotonic and Cyclic Plastic Zone Size at corresponding SIFs where
Maximum Transgranular (TG) features (brittle or ductile) takes place with or
without dissolved hydrogen in Annealed Material at Near Threshold FCGRs ........127
Table 14: Values of Monotonic and Cyclic Plastic Zone Size at corresponding SIFs where
Maximum Intergranular or Transgranular features (brittle or ductile) takes
place with or without dissolved hydrogen in AB1 Material at Near Threshold
FCGRs ......................................................................................................................135
Table 15: Length of shear lip observed in the transition region (end of intermediate – start
of threshold region) in the AB2 material ..................................................................142

xv
Table 16: Values of Monotonic and Cyclic Plastic Zone Size at corresponding SIFs where
Maximum Intergranular or Transgranular features (brittle or ductile) takes
place with or without dissolved hydrogen in AB2 Material at Near Threshold
FCGRs ......................................................................................................................146
Table 17: Paris constants (C and m) in the annealed material at different hydrogen charging
conditions .................................................................................................................152
Table 18: Paris constants (C and m) in the AB1 material at different hydrogen charging
conditions .................................................................................................................155
Table 19: Paris constants (C and m) in the AB2 material at different hydrogen charging
conditions .................................................................................................................159

1
CHAPTER 1 - INTRODUCTION
The primary focus of this investigation was to examine the influence of dissolved hydrogen on
the stress corrosion cracking and fatigue crack growth behavior on the alloy steel (AISI 4140).
The secondary objective was to examine the influence of microstructure on the fatigue crack
growth and stress corrosion cracking behaviour of this material.
Fatigue Behaviour and Corrosion Fatigue
Damage caused due to repetitive or cyclic loading in materials is known as Fatigue. Materials
with preexisting flaws or cracks can fail under the influence of cyclic loads often with
catastrophic consequence. Under cyclic loading, preexisting flaws present in the structural
components can grow and lead ultimately to failure in service. The fatigue crack growth rate
(FCGR), (da/dN), has been related to the stress intensity factor (SIF), (ΔK), and Paris equation
[1] has been found very useful to characterize the fatigue crack growth behaviour. The Paris
equation relates the fatigue crack growth rate (da/dN) with the stress intensity range (ΔK) in the
form of a power law:
- (1)
Here C and m are material constants and ΔK = Kmax - Kmin, the difference between the maximum
(Kmax) and the minimum (Kmin) stress intensity factor in a fatigue cycle.
However, when the crack growth rate is plotted against ΔK in a log scale it shows three distinct
regions. In region I, or the threshold region, the crack growth rate is low and deviates from the
Paris equation. In the linear region or region II, the Paris equation is generally obeyed by most
materials whereas in the region III or the fast fracture region, the crack growth rate accelerates

2
and again deviates from the Paris equation. In addition to all these regions, there is a threshold
stress intensity factor (ΔKth) below which the crack growth rate approaches a zero value. This is
illustrated in Figure 1.
Figure 1: Schematic representation of fatigue crack growth rate vs. stress intensity factor
Fatigue threshold is a very important parameter for structural design since structural components
designed on the basis of fatigue threshold are expected to survive in service without undergoing
any catastrophic failure. This process of crack initiation and crack growth is accelerated in the
Region III –
Unstable
crack
growth
fast fracture
behaviour
Region II – Linear Region
Linear relation between da/dN and ΔK
Paris law: 𝑑𝑎
𝑑𝑁= 𝐶(𝛥𝐾)𝑚
Region I –
Threshold Region
Slow crack
propagation
Fati
gu
e C
rack
Gro
wth
Rate
(d
a/d
N)
(m/c
ycl
e)
Fatigue
Threshold
(ΔKth)
Fracture
Toughness
(KC)
Stress Intensity Factor (ΔK) (MPa√m)
Large influence
of:
Microstructure
Environment
Little influence of:
Microstructure
Environment
Thickness

3
presence of chemically reactive medium or corrosive environment. Corrosion fatigue is thus the
material failure mechanism under the combined influence of cyclic loading in service as well as
that of a chemically reactive medium or species present in the vicinity or surrounding
environment of the material. One of the most commonly encountered and widely studied
corrosion fatigue phenomena is that of hydrogen embrittlement (HE) or hydrogen induced
cracking (HIC). Understanding how dissolved hydrogen affects the fatigue life of the structural
components is crucial for safe life prediction and prevention of fatigue failure in the materials. In
addition to this, microstructure can significantly affect the fatigue crack growth rate and fatigue
threshold. This is especially important for structural components used in marine or offshore
transport industries [2-3] where the dissolved hydrogen can significantly affect the fatigue life of
these structural components often leading to unexpected failures in service.
Stress Corrosion Cracking
Stress corrosion cracking is a very serious problem which drastically reduces the life of the
structural components. Under combined actions of stress and corrosion, crack growth rate often
accelerates and this can lead to failure of structures, often with catastrophic consequences.
In recent years, the linear elastic fracture mechanics parameter stress intensity factor, K, has been
found to be useful in characterizing stress corrosion crack growth behavior of materials.
Specifically, the stress intensity factor (K) can be used to describe the crack tip stress-strain field
and thus the mechanical driving force necessary for the growth of cracks in stress corrosion
cracking situations.

4
The stress corrosion crack growth rate (da/dt) when plotted in terms of log (da/dt) versus K
(stress intensity factor) shows three distinct regions as shown in figure 2. In region I or the linear
region, the crack growth rate increases with increase in K, whereas in region II, the steady state
crack growth region, the crack growth rate is usually independent of stress intensity factor. In
region III, the fast fracture region, the crack growth rate again increases rapidly with increase in
stress intensity level. Besides the above three regions, there are two other important parameters
in stress corrosion cracking: (a) The incubation period, tinc, defined as the period necessary for
the start of crack growth at a fixed value of stress intensity factor in a specific material-
environment system and (b) the critical stress intensity factor for the onset of crack growth,
KISCC. This parameter is defined as the value of stress intensity factor below which the crack
growth rate will approach a zero value and is considered a material property for a particular
material-environment system. All of these parameters have practical significance. Once the
appropriate values of these parameters have been determined, they can be used for structural
design to establish the critical combination of applied stress and defect size below which stress
corrosion cracking will not occur in a given material-environment system.

5
Figure 2: Schematic representation of SCC curve of crack growth rate vs. stress intensity
factor [4]
AISI 4140 is used in many naval structural and offshore applications where they are subjected to
cyclic and static loading in presence of hydrogen bearing environment. Therefore corrosion
fatigue and stress corrosion crack growth behavior of this material is important and needed for
safe life prediction and maintaining structural integrity of these components.

6
CHAPTER 2 - LITERATURE REVIEW
Fatigue Behaviour of Metallic Materials
Fatigue is defined as a term which “applies to changes in properties which can occur in a
metallic material due to the repeated application of stresses or strains, although usually this term
applies specially to those changes which lead to cracking or failure” as per the report ‘General
Principles for Fatigue Testing of Metals’ published in 1964 by the International Organization for
Standardization in Geneva [5].
Overview of Fatigue Failures
In the past one and half century, since the first instance of research on fatigue behaviour of iron
hoist chains used in mines by W.A.J. Albert in the 1830s and the first comprehensive railway
accident investigation in France in the 1840s which claimed countless lives, there has been a lot
of research focused on fatigue behaviour (or influence of cyclic loading) on structural materials
[5]. Due to countless number of such research and accidental failure investigations, we have to
come to realize the nature and severity of fatigue failures and its impact on human lives. Failure
of components in service due to fatigue or failure due to repetitive loading is a very serious
problem and can be disastrous when it involves materials used in critical applications up on
which human life depends. Under the cyclic loading conditions, preexisting flaws in the material
can grow and lead ultimately to service failures. In fatigue loading, there is minimum load (σmin)
or stress intensity (Kmin) and a maximum load (σmax) or stress intensity (Kmax). This difference of
maximum and minimum stress (σmax - σmin) is termed as stress range (Δσ) whereas stress
amplitude (σa) is based on Δσ/2.

7
With the advancement in steel technologies and the increased use of alloy steels such as AISI
4140 as a structural member, due to their economic viability and ease of tailoring their material
properties with a variety of heat treatment processes, it becomes extremely important to
characterize their fatigue properties. A damage tolerant based approach to characterizing fatigue
behaviour involves characterizing the fatigue threshold and consequently the fatigue crack
growth rate of this material for a given material – environment system. This information is
critical in design of structural parts of the material to survive in service without undergoing
catastrophic failure.
Types of Fatigue Failures
1. Mechanical Fatigue are due to fluctuations purely in the externally applied stresses and
strains.
2. Creep Fatigue are associated cyclic loads at high temperatures.
3. When the temperature as well as the load fluctuates, it is termed as Thermomechanical
Fatigue.
4. Load cycling in the presence of chemically aggressive environment are called as Corrosion
Fatigue.
5. Repetitive application of loads along with sliding or rolling contact between materials are
called as Sliding and Rolling Contact Fatigue while frictional contact between surfaces gives
rise to Fretting Fatigue.

8
Approaches to Fatigue Life Predictions [5]
1. Cyclic loads involving low stress cycles where the material deforms plastically and takes high
number of cycles to failure is characterized as High Cycle Fatigue which is based on stress
range.
2. Cyclic loads involving high stress cycles with the material undergoing appreciable plastic
deformation is termed as Low Cycle Fatigue and the fatigue life is calculated based on strain
range.
3. Fatigue life predictions based on useful fatigue life is defined as the number of fatigue cycles
to propagate the dominant crack from its initial size to a critical dimension. The critical crack
size is usually based on the fracture toughness of the material. This approach is called as
Fault Tolerance or Defect Tolerance Approach or Fracture Mechanics based Approach.
The underlying requirements, for the applicability of this method to satisfy the linear elastic
fracture mechanics criteria, are that the conditions of small scale yielding are met where the
plastic zone size at the crack tip or notch is small compared to characteristic dimension of the
component.
Stress Corrosion Cracking
Stress Corrosion Cracking (SCC) is a phenomenon associated with the combination of sustained
tensile stress and aggressive (corrosive) environment. The material subjected to static tensile
loads in chemically reactive environments fail below the yield strength of the material. These
tensile loads may occur in the form of external forces [6], thermal stresses [7-8] and also residual

9
stresses [9-10]. The greater the stress occurring at or near the crack tip, the lesser the time
required to initiate SCC (incubation period - Tinc).
The kinetics of SCC also depends on the chemical and metallurgical state of the material (i.e.
chemical composition, thermal condition, grain size, presence of secondary phases [11-16] and
precipitates, etc [17-19]); on environmental conditions (e.g. environment composition,
temperature, pressure, pH, electrochemical potential, solution viscosity and mixing, etc.); and on
crack geometry and stress state (i.e. uniaxial, triaxial, etc.) [20-21].
Hydrogen Embrittlement (HE) and SCC may be distinguished from each other by consideration
of the background information; the extent, nature, and distribution of corrosion; the sites of crack
initiation; and other factors. Factors which favor SCC as a failure mechanism include: (1) an in-
service environment capable of producing SCC, and conversely, an absence of pre-treatments
which could introduce hydrogen into the steel prior to service; (2) multiple cracks initiated from
corrosion pits; and (3) corrosion products on the fracture surface, which become thicker closer to
the origin. Factors which favor HE include: (1) inadequate baking following coating, or the use
of other treatments that could introduce hydrogen into the steel; and (2) exposure of a component
to low-humidity air in service [22].
Fractures produced by HE could become corroded after cracking, but such corrosion is generally
manifested by patches of rust on both intergranular (IG) and dimpled overload areas rather than
by the more uniform, often black, corrosion film found on SCC fractures. HE failures sometimes
initiate from subsurface inclusions, but it is often not possible to distinguish between surface
initiation sites and initiation sites at small inclusions close to the surface. Moreover, SCC often
exhibits more crack branching and less pronounced, partially-formed, dimples than cracking
produced by HE. However, the extent of crack branching and dimples also depends on the stress

10
intensity at the crack tip, on hydrogen concentration or environment, and on the composition and
thermal condition of the steel. Because some of this information is often not known for in-service
failures, these features cannot be reliably used to distinguish between HE and SCC [22].Hence
the SCC term is often used to describe environmental assisted cracking or hydrogen
embrittlement.
An essential step in failure analysis is the determination of the failure mechanism. Identifying
whether failure occurred by over load, metallurgical embrittlement or environmental assisted
cracking allows the determination of underlining cause of failure and recommendation on proper
action to prevent failure recurrence.
The growth of crack during SCC can be either intergranular (IG) [23-24] or trans-granular (TG)
[25-27], depending on the alloy, its microstructure, and the environment. However, the crack
follows a general macroscopic path that is always normal to the tensile component of stress.
While TG failures are less common than the IG ones, both can exist in the same system or even
in the same failed part, depending on external conditions. The IG failure mode suggests some in-
homogeneity at the grain-boundaries. For example, segregation of S and P at grain-boundaries
has been observed as the cause of IG SCC of low alloy steels [20].
There are several mechanisms by which SCC can occur in metals and alloys. Among these
mechanisms the hydrogen embrittlement [6], adsorption-induced cleavage [28], atomic surface
mobility [8-10], film rupture [12], stress-accelerated dissolution [13], film-induced cleavage
[14], tunnel pitting [15] and tearing and localized surface plasticity mechanisms [16] are most
prominent. There has been some evidence that the solution within the micro volume of the crack
becomes acidified, due to hydrolysis reactions similar to those which occur in pits. In case of
high strength steels the presence of hydrogen in the crack and the brittle cleavage characteristics

11
of TG cracks indicate hydrogen embrittlement (HE) as the mechanism for crack growth during
SCC in most cases.
In the case of high strength steels, the mechanisms for SCC is not yet clear. The general
classification under two categories of mechanisms (anodic dissolution on one hand and hydrogen
effects on the other) is not sufficient. Available models such as the slip dissolution model cannot
completely characterize the SCC behaviour of these materials. Recently new models of
corrosion-deformation interactions have been proposed. They take into account the interactions
between dislocations at the stress corrosion crack tip and corrosion products, such as vacancies
injected by dissolution and/or absorbed hydrogen.
Hydrogen Embrittlement
Structural components during the manufacturing processes and forming operations are often
exposed to hydrogen rich environments. This can result in absorption of hydrogen, especially in
low alloy steel such as AISI 4140, and can have a marked influence over the fatigue life of the
alloy often leading to unexpected failures in service. Hydrogen enters the material, lodges at
interstitial locations in the crystal lattice causing localized stress gradients and cause failure in
the material at stresses well below the design stress for a particular application. A typical
example of hydrogen uptake is during hot stamping operations of automotive body parts or in the
case of marine or offshore industry. Understanding how dissolved hydrogen affects the fatigue
life of these structural components is crucial for safe life prediction and prevention of fatigue
failure in service for these materials.

12
Even though hydrogen embrittlement has been known to cause damage to metallic materials
since more than 60 – 70 years, very little progress has been made to understand and explain
clearly the mechanism of hydrogen induced failures. Till date, there is no single mechanism to
fully explain the hydrogen degradation applicable to all structural materials due to the
complexity of hydrogen embrittlement problem.
Hydrogen embrittlement, as defined by Nelson [17] and other investigator [29], is the material
degradation caused by the presence of hydrogen under load. The load may be in form of a static,
cyclic or shear loads. The degradation may manifest itself in the material on the various
mechanical properties such as loss of ductility, reduction in area, loss of strength (tensile and
yield), increase in stress corrosion crack growth rate or decrease m – the Paris equation slope
parameter, fatigue threshold and fracture toughness, increase in fatigue crack propagation rate,
fatigue life reduction etc. This degradation causes failure in the material prematurely. Also, the
degradation has been reported quite strongly influenced by microstructure [30] and also by the
other metallurgical factors of the material or alloy such as chemical composition, grain size and
heat treatment methods [31].
Hydrogen embrittlement is a broad term used to describe degradation of material property. This
phenomenon can be broadly classified into the following categories [32-33]:
1. Hydrogen Induced Cracking: This is also referred as Internal Hydrogen embrittlement.
Hydrogen enters the metal surface, in a variety of ways as explained above, lodges itself
as an interstitial solute only in the atomic form [33-34]. This reduces the load bearing
capacity of the material. Even ductile materials fail by this method at stresses below their
nominal design stresses. This is the most severe form of embrittlement and there is an
incubation time after which the material fractures unexpectedly.

13
2. Hydrogen Environment Embrittlement: This form of degradation and failure occurs in the
steels which are exposed to hydrogen rich environments. The hydrogen absorbed from
the surroundings cause deformation in the alloy leading to reduction in the functional life
of the material.
3. Hydride formation: The hydrogen absorbed in metals like Nb, Ti, V and their alloys
undergoes a chemical reaction with the host metal forming hydrides. These hydrides are
extremely brittle, reduces the ability of the material to undergo plastic deformation and
thus decrease the fracture toughness causing catastrophic failures in the material.
4. Hydrogen attack: This type of failure occurs in low alloy steels used in chemical and
petrochemical industries where it is subjected to high temperatures. The dissolved
hydrogen in the material attacks the carbides in the iron alloy matrix which provide
strength to the alloy. The hydrogen causes decomposition of these carbides like Iron
carbide (Fe3C) or Cementite to iron and methane gas.
2Fe3C + 3H2 → 6Fe + 2C2H4 - (2)
Alloy deterioration occurs due to the disappearance of strengthening carbides particles
leading to very low ductility and causing failures in the material.
5. Hydrogen blistering: In high strength alloys, the solute hydrogen resides as hydrogen
atoms. However, when the concentration of this nascent hydrogen increases in the alloy
matrix due to continuous contact of the metal in a solution, the hydrogen migrates into
the inner lattice from the metal surface. When this lattice activity of the hydrogen gas
phase becomes sufficiently high and equals to the hydrogen ion activity in the vicinity of
the solution, this atomic hydrogen can recombine to form more stable molecular
hydrogen giving rising to bubbling and cracking at the surface. This occurs due to the fact

14
that the molecular hydrogen in sufficiently large in size to accommodate in the metal
lattice. The same phenomenon can be initiated at internal surface (grain boundaries,
inclusions, dislocations and voids in the material) within the metallic matrix. This gives
rise to internal and surface cracks or fissures which act the initiation center for brittle
failures.
Hydrogen embrittlement mechanisms
Though the exact nature of hydrogen embrittlement is still unclear and subject to a lot of
controversy, some of the mechanisms explained below are generally applied while investigating
or studying hydrogen embrittlement. One or more of these theories may be applicable while
analyzing a particular material and none of these theories are applicable to all metallic systems in
general.
1. Hydrogen Enhanced Localized Plasticity (HELP) [35]: Hydrogen related failures are
often termed as “brittle in nature” due to loss in macroscopic ductility or reduction in
flow stress. By fractographic examination, Beachem [23] proposed that embrittlement of
steels is linked to locally enhanced plasticity at the crack tip. This concept, over the
years, has been accepted as a possible mechanism for fracture in ductile materials. The
HELP mechanism can be applied to metal systems with hydrogen in solid solution
(dissolved hydrogen), as in our case, and also for gaseous hydrogen bearing
environments. According to this model, the application of a stress field at the crack tip
results in a highly non-uniform distribution of hydrogen in the material. The chemical
potential of hydrogen at the crack tip is reduced and thereby attracting the neighboring
hydrogen atoms from the bulk of the material due to concentration gradients. The high
hydrogen concentration at the crack tip causes an elastic singularity at the crack tip

15
causing reduction in dislocation motion and hence reducing the local yield stress in the
material. Slip localization occurs in the material at the vicinity of the crack tip leading to
crack tip plasticity at stresses well below the critical stress needed for plastic
deformation. Hence, the fracture process proceeds by a highly localized ductile process
which manifest as a brittle fracture macroscopically.
2. Hydrogen Enhanced DEcohesion (HEDE): This model was proposed by Troiano [6] and
later modified by Oriani [36]. The model states that the high concentration of dissolved
hydrogen in the crack tip vicinity reduces the cohesive force between the interatomic
bonds and thereby causing decohesion at the crack tip. This model has inherent problems
in correlating the cohesive energy to the critical hydrogen concentration needed to cause
decohesion between the atoms. There is also lack of experimental evidence to support
this mechanism.
3. Internal pressure theory: This theory was developed by Zapffe and Sims [37]. Large
concentration of dissolved hydrogen in the material results in precipitation of hydrogen
molecules at internal defects such as cracks, fissures and inclusions. Hydrogen bubbles
form inside these defects raising the internal pressure and adding on to the applied stress
lowering the fracture stress in the material. However, failures have occurred at very low
concentration of dissolved hydrogen. Hence, this theory is not widely accepted.
4. Surface energy (adsorption) model: Modification of surface energy concept for crack
propagation was introduced by Petch [38-39]. This model states the hydrogen migration
to a crack tip lowers the surface energy needed to create new surface for crack
propagation and thus alters the fracture stress in the material. Lack of experimental
observations coupled with paucity of equations to calculate the reduction of surface

16
energy projects this model to be insufficient to explain the phenomenological
characteristics of hydrogen embrittlement.
Existence of hydrogen traps
Diffused or dissolved hydrogen are known to exist in the metal lattice sites known as Normal
Lattice Interstitial Sites (NILS) as well as in imperfections such as dislocations, vacancies, grain
boundaries, inclusions or second phase particles [40]. These imperfections in the material are
known as traps. These traps are distinguished as reversible traps (low binding energy < 60
kJ/mol) in which H atom can diffuse in and out and irreversible strong traps (high binding energy
> 60 kj/mol) in which the H atom degasses out only at high temperatures [41-43]. Reversible
traps are defects such as vacancy [44], grain boundaries, dislocations and substitutional elements.
Irreversible traps are secondary phases like carbide precipitates, oxides and inclusion sites etc.
AISI 4140
AISI 4140 is one of the most commonly used and available low alloy steel (<8% alloying
elements). AISI 4140 is a medium carbon steel containing chromium, molybdenum and
manganese as the principal alloying elements having high hardenability with good fatigue
resistance. Owing to their strength and toughness properties, this steel has many
applications in mission critical structural components such as naval structural components
and other defense applications [45-46]. A close variety of AISI 4140 steel is being sought in
Japan as a candidate material for hydrogen storage tanks and cylinder to fuel the next
generation Hydrogen economy [47]. These steels can easily be nitrided to maximize the wear
and abrasion resistance. It can also by hardened by a variety of heat treatment processes to high

17
hardness offering good tensile strength and impact strength. Therefore they are used to
manufacture small gears, pinions, high strength studs and bolts, head screws which are employed
in severe service applications. They are commercially available in the hot and cold rolled
conditions in the form of sheets, strips, plates and bars along with some aircraft quality grade
bars and tubes [45].
While in service in many critical structural applications i.e., naval structural components and
other defence applications, this alloy can be exposed to hydrogen bearing environments.
Hydrogen induced fatigue crack growth data of this material is very important and is needed for
safe life prediction and design of these components. Although a significant number of studies
have been carried out on fatigue and corrosion behaviour of high strength steels, most of these
studies were carried out in 3.5% NaCl solutions [46, 48-53] in boiling sodium hydroxide [54], in
gaseous hydrogen [55]. Fatigue behaviour of 4140 has also been investigated on the effect of
magnetic treatment [56] and on the effect of ion nitriding [57]. However, not much information
is available in literature on the influence of dissolved hydrogen (ex situ hydrogen charging) on
the fatigue crack growth behaviour of AISI 4140 steel. It is quite common, in a practical
scenario, that this steel is exposed to hydrogen bearing environment while processing or in
service. The time of exposure to hydrogen environment may be continuous such as in aqueous
solutions or might be temporary when exposed to air after processing. Thus, it is very important
to examine the fatigue behaviour and SCC of this alloy when charged via ex situ hydrogen
charging which closely mimics the real world scenario than a controlled atmosphere such as
aqueous solution (in situ charging) or via gaseous hydrogen contained in a closed chamber.

18
In order to examine the influence of microstructure on the SCC and FCG behaviour, the material
was tested with different microstructures such as ferritic – pearlitic and tempered martensitic –
bainitic structures. The latter was produced by austempering process.
Austempering Heat Treatment
In recent years, austempering has generated a lot of interest as an alternate heat treatment process
than the traditional austenitize, quench and tempering process. This type of heat treatment is
generally preferred over quench and tempering process due to its reduced distortion and quench
cracking [58] in steels with sufficiently high carbon (in excess of 0.40%). This heat treatment
process can result in similar strength like quenched and tempered steel but with better fracture
toughness [59-60]. The typical microstructure expected in the austempering process is bainite
with little or no martensite. The process involves heating the steel to austenitizing temperature
and then quenching in a molten salt bath to a temperature above or very close to the martensite
start temperature (Ms) to isothermally transform the austenite into bainite with little or no
martensite depending on the isothermal transformation temperature. The absence of sudden
quench cycle to form martensite before tempering, as in the traditional quench and tempering
process, results in removal of thermal gradients in the material. This reduces the distortion and
minimizes the appearance of quench cracks, especially in small parts like gears, bolts and clips
which are extensively used in the automotive industry and in naval applications. In addition, the
austempered material does not need a tempering step during the heat treatment process being an
inexpensive and shorter duration process. In a study involving a similar type low alloy steel
(4340), it was found that the austempered material had better high cycle fatigue compared to the
quenched and tempered material at the same hardness level of 45 HRc [60]. Another study [61]

19
revealed that the austempered 4340 material had better resistance to hydrogen embrittlement (in
terms of mechanical properties) when compared to quench and tempered material at the same
strength level.
Rationale behind this research
Not much information is available in literature [55, 62] on the structure – property relationship
for AISI 4140 steel in the austempered condition, especially for the fatigue crack growth (FCG)
behaviour and SCC behaviour. The paucity of information available on the FCG and SCC
behaviour of 4140 in presence of dissolved hydrogen and how austempering can affect the FCG
behaviour, with or without dissolved hydrogen in the alloy matrix is of great interest and
provided the rationale and thrust toward this investigation. It was shown by Tomita and others
[63-65] that heat treatment very close to the martensitic start (Ms) temperature or in the
borderline between the lower bainite and Ms temperature region for 4340 yielded a dual phase
microstructure consisting of lower bainite and tempered martensite with high strength, fracture
toughness and good fatigue properties. It was our understanding that in a similar way, by
austempering 4140 by changing the austempering time and temperature, a dual matrix structure
could be obtained and its SCC and FCG resistance could possibly be improved. In this way, the
fatigue behaviour and SCC behaviour of 4140 due to dissolved hydrogen in the annealed (as-
received) and austempered condition could be compared. This would pave a way to tailor the
right microstructure in this alloy having the best hydrogen embrittlement resistance in both static
as well as dynamic loading condition.

20
CHAPTER 3 - OBJECTIVES
The following were the objectives of this investigation -
1. The primary objectives of this investigation were:
a. to examine the influence of dissolved hydrogen on the fatigue crack growth
behaviour of AISI 4140 steel.
b. to examine the influence of microstructure on the fatigue crack growth behavior
of this steel and to investigate whether austempering can improve the fatigue
crack growth behaviour.
c. microstructure has significant influence on the static as well as dynamic loading
of materials and the interaction of microstructural features with hydrogen is of
great interest. Therefore, one of the objective was to determine the crack growth
mechanism in this steel during cyclic loading condition.
2. The secondary objective of this investigation was to determine the role of inclusions and
their influence in affecting the fatigue crack growth rate of this material.

21
CHAPTER 4 - EXPERIMENTAL MATERIALS AND METHODS
Material
The material used in this investigation is a low alloy steel AISI 4140. The material was available
in the form of cold rolled and annealed plate with identifiable rolling direction. The chemical
composition of the material is reported in Table 1. From this steel plate, compact tension (CT)
samples and tensile specimens were prepared as per ASTM E-647 and E-8 [66-68] respectively
with TL orientation. The aspect ratio (a/W) was kept about 0.3 whereas the width of the
specimens (W) were about 50.8 mm. The thickness of the specimens (B) was kept about 3 - 4
mm.
Table 1: Chemical composition of the material (in wt %)
C - 0.40
Cr - 1.12
Mo - 0.18
Mn - 0.93
Si - 0.33
S - 0.031
P - 0.025
Cu - 0.02
Ni - 0.17
Fe - Balance
Figure 3 shows the dimensions of the CT specimen used for fracture toughness testing. The
aspect ratio (a/W) was kept about 0.4 whereas the width of the specimens (W) were about 37.6
mm. The thickness of the specimens (B) was kept about 19 – 20 mm for the plane strain fracture
toughness (KIC) specimen.

22
A similar type of specimen was used for SCC and corrosion fatigue crack growth testing. The
aspect ratio (a/W) in the fatigue CT specimen was kept about 0.3 with the width (W) being about
50 mm. A thinner specimen having a thickness of about 4 mm was utilized for this study.
Figure 3: Dimensions of the CT specimen used for fracture toughness (KIC) testing (all
dimensions are in inches)
Figure 4 shows the tensile specimen used in this study. The diameter (d) in the thin middle
section was kept at 6.35 mm and the length (L) of this section was 32.13 mm giving the aspect
ratio (L/d) of about 5.

23
Figure 4: Dimensions of the tensile specimen (all dimensions are in inches)
Heat Treatment
The material was used in three different heat treated conditions: the first batch of samples were
used in the as received cold rolled and annealed condition and while the second and the third
batch of samples were used in austempered conditions (heat treated). The specimens were
austempered in two different austempering temperatures. For the first batch of heat treated
samples (here after referred as AB1), the specimens were initially austenitized at 885°C for 1
hour then austempered at 349°C for 1 hour in a molten salt bath. The second batch of heat treated
samples (here after referred as AB2) was done by austenitizing at 882°C for 45 min and then
austempered at 332°C for 60 min. The austempering temperatures chosen for the heat treatment
0.5000
0.7500 0.2500 + 0.0001
0.6325 0.6800
4.6250
R1.9150
0.5000
0.5000
16

24
are close to each other. However, these temperatures were chosen such that they were slightly
above and below the martensitic start (Ms) temperature of 4140 alloy. More specific details
about the Ms temperature of 4140 alloy is discussed in the TEM analysis section. After
austempering, the specimens were air cooled to room temperature. The specimens were then
ground on both surfaces and polished with 600 grit emery paper. Finally, they were cleaned and
degreased in acetone. Table 2 reports the mechanical properties of the material in annealed and
austempered condition.
Table 2: Mechanical properties of AISI 4140 alloy after heat treatment
Material
Condition
Yield
strength
(MPa)
Ultimate Tensile
Strength*
(MPa)
%
Elongation Hardness
(HRc)
Fracture
Toughness
(MPa√m)
Annealed 757 ± 20 1031 ± 5 5.63 28 ± 3 65 ± 2.2
Austempered –
AB1 (349°C)
1368.5 ± 4 1526.6 ± 9 5.92 41±3 78 ± 2.3
Austempered –
AB2 (332°C) 1481 ± 12 1646 ± 8.62 5.5 45±1 72 ± 5.8

25
Microstructural Analysis
A through microstructural analysis was carried out to reveal and characterize the microstructural
features in each of the three heat treatment conditions. From the fabricated fatigue CT specimen,
a sample about 1-2 cm in length and width was cut from the annealed, AB1 and AB2 specimens.
These samples were then mounted on Copper impregnated phenolic powder based mounts. The
samples underwent a series of grinding steps starting from 180 to 2400 Grit emery paper to
prepare a smooth surfaces which followed by series of polishing steps using Alumina powder
having the grain size of 5, 3, 1 and 0.5 microns respectively in that order. At the end of the
polishing step, each of the these samples were visually examined under an optical microscope to
make sure a uniformly flat smooth shiny surface with a mirror like appearance was obtained and
ready for etching.
Annealed Microstructure
The microstructure of the annealed sample after polishing was etched with 3% Nital solution for
about 8-10 s. The microstructure was then examined using a Nikon Epiphot optical microscope
and a JEOL JSM – 6610LV scanning electron microscope fitted with an Oxford Instruments X-
Max 80 energy dispersive X-ray analysis (EDAX) gun to get X-ray mapping information. Since
the dissolved hydrogen can lodge at inclusions and voids in the material, X-Ray mapping was
done around any void or inclusion areas found on the polished and etched surface to analyze the
chemical makeup in and around void areas to characterize any possible impurities, inclusions
and/or secondary phase particles which may affect the hydrogen uptake in the material and
thereby influence the FCG and SCC behaviour of the material.

26
The microstructure of the annealed samples is reported in Figure 5. The coarse pearlitic lamellae
can be found as dark areas in the matrix with the surrounding light area (fully dark area being
Cementite - Fe3C and the surrounding light phase being α phase). The ferrite phase appears as
the complete white area Figure 6a shows the SEM microstructure of the annealed (as-received)
sample has coarse pearlitic (white broken dendritic phase) microstructure in a predominantly
ferritic background matrix (grey background). Figure 6b is a higher magnification of the
observed area to indicate the coarse nature of the pearlitic lamellae. There were some voids
observed on the etched sample which are seen in Figure 6a as holes on the surface. X-ray
mapping revealed these voids to be composed of Aluminum Oxide. Figures 6c, d, and e shows
the X-ray maps obtained for Fe (red), Al (green) and O (yellow) respectively at the void area.
However, the presence of voids in the material shows that it is possible for dissolved hydrogen to
be trapped at one of these locations. It is also important to note that though the pearlitic lamellae
are not very distinct even at high magnification, the grain size distribution of the alloy in the
annealed condition was estimated to be between 8 – 12 microns from the microstructure (grain
boundaries very faintly visible in Figure 6a) and also from some of the facets observed in the
fractographs discussed later.

27
Figure 5: Microstructure of the annealed sample (Magnification: 1000X)

28
Figure 6: Microstructure (SEM) and X-ray map of inclusions of the annealed sample
(a, b: SEM image - 1000X and 5000X respectively; c, d and e: X-ray map of Fe, Al and O
respectively at the void location in a)
Austempered Batch -1 (AB1) microstructure
As discussed earlier, the austempering heat treatment resulted in a microstructure consisting of
predominantly bainite with a small amount of tempered martensite and retained austenite. Since
the grain size as observed in the annealed condition was very small in nature and also the bainite
and martensite formed during the austempering process occurs by shear mechanism, it was
expected that the differentiating between these two phases in the material would be very
difficult.
In order to resolve this issue, tint etching process was used with a 15% Sodium Metabisulphite
(SMB) solution. This tint etch characteristically gives a bluish tint for Bainite (B), dark brown

29
and straw yellow tint for Martensite (M) and leaving the Retained Austenite (RA) as white
phase. Both the AB1 and AB2 samples were etched with this solution for about 40-50 s to get a
distinguishable tint checking periodically under an optical microscope. After the tint etch, both
the samples were washed in water and then cleaned with a small amount of alcohol and
immediately dried under compressed air. A 200 g microindent was made at the center and on one
edge of the specimen using LECO Microhardness Tester - LM 248 AT. This indent mark was
used as a reference marker so that the voids and the microstructure around this indent could be
obtained by optical and SEM imaging. These then could be compared in order to help identify
the microstructural features at around the same point. After this procedure, the micrographs and
X-ray maps were obtained in the same manner as explained earlier.
The optical micrographs showing the tint obtained at 1000X magnification for the AB1 sample is
shown in Figure 7. From the Figure 7, it is evident that all the three expected phases – B, M and
RA are present based on the tint characteristics explained earlier. It is also noted from the Figure
7 that the B islets and the M laths or plates, which are predominantly expected, cannot be
differentiated clearly owing to the very fine scale microstructure of the material and also due to
their formation by the shear mechanism explained earlier. By initial examination of Figure 7, it
may be concluded that the AB1 material has predominantly the B phase due to bluish tint visible
in larger area with little M (dark brown to brick red) phase and very little RA present (white
phase).

30
Figure 7: Microstructure of the AB1 sample (Magnification: 1000X)
The SEM micrographs and X-ray maps of AB1 are shown in the Figure 8. Figure 8a and 8b
show the bainitic and martensitic structures although they look similar even a very high
magnification. Figure 8c shows an inclusion visible in the Figure 8a (top left corner). In the AB1
sample, the inclusion was found to be Manganese Sulphide (MnS) in the Figures 8e and 8f.

31
Figure 8: Microstructure (SEM) and X-ray maps of the AB1 sample (Magnification: a, b -
1000X, 5000X respectively; c - inclusion; d - Fe (Red); e - Mn (Purple); f - S (Yellow); g - Al
(Blue) and h - O (green)
Austempered Batch -2 (AB2) microstructure
Figure 9 shows the optical micrographs of the AB2 sample. A similar microstructure consisting
of B, M and RA phases are seen in the micrographs. However, since the austempering
temperature is less than AB1 sample, a higher fraction of brown/reddish brown M phase is
together with the RA phase as very small white phase in the micrograph.

32
Figure 9: Microstructure of the AB2 sample (Magnification: 1000X)
Figure 10 shows the SEM and X-ray micrographs of the AB2 sample. The AB2 sample has B
and M phase (Figure 10a and 10b), but a clear distinction could not be made like in the AB1
sample. AB2 also had MnS inclusions as seen in Figure 10e and 10f.
It is clear that there are inclusions present in the matrix in all the three batches of samples used
for the fatigue crack growth rate tests and SCC tests. The main inclusion present in this steel is
MnS as seen from the X-ray maps and very small amount of Aluminum Oxide (Al2O3).

33
Figure 10: Microstructure (SEM and X-ray maps) of the AB2 sample (Magnification: a, b -
1000X, 5000X respectively; c - inclusion; d - Fe (Red); e - Mn (Blue); f - S (Green); g - Al
(Green dot) and h - O (orange dot)
Volume fraction analyses
It was clear from the microstructural analysis that the annealed microstructure had a coarse
pearlitic microstructure surrounded by a minor component of ferrite and that the austempered
materials (AB1 and AB2) had a duplex microstructure composed of lower bainite and tempered
martensite with very small amount of retained austenite (RA) phase. As seen from the figure 7
and 9, these B and M phases varied from AB1 to AB2 materials in relative amounts due to the
difference in austempering temperatures. This could have a bearing on the resulting FCGRs and
SCC behaviour with or without hydrogen.

34
Using the previously obtained metallographs, at a constant magnification, the relative volume
fraction of each component was obtained using Image Pro 6.0 image analyzer. A set of five
images was taken for each material at a constant magnification - 400 X for the annealed and
200X for the austempered material. These images were processed by the image analyzer to get
the volume fraction based on morphology and color in the case of annealed material and based
on color in the case of austempered material. The average of the relative amounts obtained from
the five images was taken as the final volume fraction for each phase. This method also gave the
volume fraction of inclusions in each of these materials.
Table 3 shows the volume fraction of ferrite as well as of pearlite (ferrite + Fe3C). As evident
from the microstructure in figure 1, the ferritic (α) phase is only about 7% in volume and the
matrix is composed of pearlitic phase (about 92%) with a minor fraction of inclusion of about
1%.
Table 3: Volume fraction of phases (in %) present in the Annealed condition
Material Volume fraction of
Ferrite (%)
Volume fraction of
Pearlite (%)
Volume fraction of
Inclusions (%)
Annealed 7.2 91.9 0.9
Table 4 lists the volume fraction of the B and M phases along with the percentage of inclusions
present. It was noted that the B phase was more in volume in both the austempered conditions
with the M phase in increasing with decrease in austempering temperature. All the three batches
had nearly the equal amount of inclusions since it was from the same batch of steel and with the
same orientation of rolling direction. The RA phase does not appear in appreciable amounts (less

35
than about 0.5%) in both austempered conditions and hence has not been calculated in the final
analysis. This is validated by XRD and TEM analysis discussed later.
Table 4: Volume fraction of phases present in the Austempered condition
Material Volume fraction of
Tempered
Martensite (%)
Volume fraction of
Bainite (%)
Volume fraction of
Inclusions (%)
AB-1 (349°C) 20.5 77.8 1.7
AB-2 (332°C) 38.6 60.2 1.2
X-Ray Diffraction (XRD) Analysis
In order to reveal the phases present in the annealed (as-received) and the austempered material
in the 4140 steel, a detailed XRD analysis was performed. The samples were sectioned from the
CT specimens, one in each heat treated condition, about 15mm*15mm in size having a thickness
of about 4 mm. The samples were labeled in annealed and in austempered condition (AB1 and
AB2) as AI-10, HT-2 and AU-1 respectively in that order. These specimens were ground and
polished in the same manner as explained in the microstructural analysis and then mounted in a
sample holder using putty recessed below the focal plan of X-ray beam. For the XRD, a Miniflex
diffractometer using Cu Kα radiation was utilized. The scan rate for each specimen was held
constant at 1°/min between the 2θ range of 2 – 90°. The obtained data was plotted and analyzed
using PDXL software. The scan intensity was normalized using the strongest peak. In order to

36
improve the clarity of the figures, the peaks were smoothed using an extended Gaussian
convolution algorithm.
The scans taken from AI-10, HT-2 and AU-1 are shown in Figure 11. The XRD peaks show that
all the peaks correspond only to the α phase of iron (ferrite) (ICDD #04-016-4758) with no
evidence of γ phase (austenite). It about 40.1° 2θ, there is weak peak corresponding to a very
small amount of Fe4C (ICDD #04-007-9963). However, the peak intensity is not strong enough
to perform a solid identification. Figure 11 also shows an overlay (faint green line) that shows
where the minor radiation peak should diffract based on the observed (110) peak. The faint line
(that of 110 Kβ peak) coincides with the position of the small peaks of Fe4C. Though the small
presence of Fe4C cannot be ruled out, it might also be due to non-monochromatic radiation
source. The peaks associated the γ – Austenite phase were not detected by XRD possibly due to
very low volume fraction of Retained Austenite phase in the alloy in all three heat treated
conditions.

37
Figure 11: XRD peak identification for the 4140 steel samples: Annealed - AI-10 (Blue),
Austempered AB1 (349°C) - HT -2 (Red) and Austempered AB2 (332°C) - AU - 1 (Black)
TEM Imaging
Transmission Electron Microscopy (TEM) was performed to identify and confirm the phases
present in the AISI 4140 material in the two austempered conditions. This was done as a
secondary as well as confirmatory step to identify the phases (Martensite and Bainite) observed
in the metallographic analysis via Tint Etching technique using Optical Microscope (OM) and
confirm the absence of the Austenite (γ) phase with the FCC crystal structure observed in the X-
Ray Diffraction (XRD) analysis.
To prepare the TEM grids for imaging, a 15 mm x 15 mm sample was cut out of the CT
specimen used for the fatigue crack growth rate testing from each of the austempered material
(AB-1 and AB-2) using a Struers abrasive cutter. From the 4 mm thick sample obtained, one
each from the AB-1 and AB-2 material, a thin sample about 0.5 mm was sectioned using a

38
Buehler low speed cutting saw. These thin samples were then ground to about 90 - 100 μm
thickness by grinding with Silicon Carbide (SiC) emery paper from Grit 60 to 2400 to obtain a
smooth surface and then polished to obtain a mirror finish, having a final thickness of about 50 –
75 μm foils, using a series of alumina polishing powders with a particle size from 5 – 0.05 μm. A
3 mm diameter discs are cut out from the thin foils (about 10 - 15 discs from each of AB-1 and
AB-2 thin foils) slightly varying in thickness from 50 – 75 μm using a TEM disc punch. The
foils were then subjected to electro polishing using 10% perchloric acid solution as electrolyte
maintained at -30°C in a Fischione Instruments Model – 110 Twin Jet electropolisher wired to
Fischione Instruments Model – 120 Automatic Power Control to supply a steady voltage of 27+/-
1 VDC for a time period of 30 – 35 sec to obtain a small perforation in the center of the 3mm
discs. Finally, the perforated discs are used for TEM imaging using a JEOL - 2010 TEM at a
voltage of 200 kV.

39
Austempered Batch - 1 (AB1) TEM imaging
Figure 12: (a): Bright field image of AB1 material; (b): dark field image of spot 1 - α(011)
reflection; (c): dark field image of spot 2 - α(121) reflection; and (d): dark field image of
spot 6 - α(110)II [Magnification: 25000X]

40
Figure 12: (e): Dark field image of spot 5 - α(020)II [Magnification: 25000X]; (f): SAD
pattern of AB1 material from bright field image (figure 12 (a))
Table 5: Diffraction indices of AB1 material
Spot Measured d spacing
(Å)
(hkl) Calculated d
spacing (Å)
1 2.0827 α(01 ̅) 2.0293
2 1.2027 α(12 ̅) 1.1717
3 2.0938 α(110) 2.0293
4 2.0957 α(101) 2.0293
5 1.4733 α(0 ̅0)II 1.4350
6 2.0920 α(1 ̅0)II 2.0293
7 1.4807 α(200)II 1.4350
Note: Spots 1-4 have zone axis [1 ̅ ̅] and spots 4-7 have zone axis [002]

41
Figure 12 (a) – (f) shows the bright field, dark field and the SAD pattern of the austempered
4140 material at 349°C (AB1). Table 1 lists the indices of the SAD pattern in Figure 12 (f). It is
evident from the figure 12 and table 5 that the material has predominantly α phase as seen in the
XRD analysis. All the diffraction spots obtained were linked to α phase having BCC crystal
structure. Since Austenite (γ) phase could not be resolved in the obtained SAD patterns, the α
phase could not be characterized into Tempered Martensite (α’) and Bainite (α) distinctly which
have the BCT and BCC crystal structure respectively. The γ phase shares specific orientation
relationship with the α’ and α phases in order to effectively characterize them separately [69].
Due to lack of γ phase (almost less than 1% in volume fraction), the diffraction patterns of α
phase were not able to be differentiated into α’ and α phases distinctly. However, going by the
single orientation of carbides within the lath (Figure 12(a) and (d)), it could said they are from
the lower Bainite (α) phase [55] and considering the fact the austempering temperature was very
close to the Ms temperature, both theoretical [70,71] and from the CCT diagram [72]. From the
table 5, the spots from 1 to 4 were found to be parallel to the electron beam having a zone axis of
[1 ̅ ̅] and the other spots from 5 to 7 were oriented parallel to the zone axis [002]. The
calculated d spacing for all the spots were based on considering that α’ and α phases both had
BCC crystal structure. Even though tempered martensite (α’) has a BCT crystal structure, the
calculated c/a ratio for 4140 steel was found to be 1.0213 (≈ 1) from the martensite parameter
equations [73]. Hence, it was considered to have a BCC crystal structure and the measured d
spacing values are in agreement with the calculated d spacing values. This proves that it is a
valid assumption. Although the Austenite (γ) phase could not be resolved in the TEM analysis
due to extremely small volume fraction, the relative closeness of the austempering temperature to
the Ms temperature of this steel, the existence of only α diffraction spots in the SAD pattern

42
predominantly; and the single orientation of carbides particles could be satisfactorily used as
evidence for the presence of tempered martensite and lower bainite phases in this material AB1
austempered at 349°C.

43
Austempered Batch - 2 (AB2) TEM imaging
Figure 13: (a): Bright field image of AB2 material; (b): Dark field image of Spot 1 - α(110);
(c): Dark field image of Spot 4 - α(200)II; and (d): dark field image of Spot 6 - Fe3C(130)
[Magnification: 25000X]

44
Figure 13: (e): Dark field image of Spot 4 - α(200)II reflection [Magnification: 25000X];
(f): SAD pattern of AB2 material from bright field image (figure 13(a))
Table 6: Diffraction indexing of AB2 material
Spot Measured d spacing
(Å)
(hkl) Calculated d
spacing (Å)
1 2.0882 α(110) 2.0293
2 1.1954 α(112) 1.1716
3 1.4632 α(002) 1.4350
4 1.4623 α(200)II 1.4350
5 2.0919 α(011)II 2.0293
6 1.5834 Fe3C(130) 1.5878
Note: Spots 1 – 3 have zone axis [1 ̅0] and spots 4 – 5 have zone axis [0 ̅1]

45
Figure 13 (a) – (f) shows the bright and dark field TEM images of the AB2 material austempered
at 332°C (630°F). It is seen from the figure 13(a) that the material has a lath structure
corresponding to that of tempered martensite and bainite with the small carbides suspended in
the matrix. The SAD pattern in figure 13(f) showed mainly α and α’ peaks as listed in the table 6
in a similar fashion as in the AB1 material. The indexed patterns are parallel to two different
zone axes. The spots 1 – 3 have the electron beam parallel to the zone axis [1 ̅0] and the other
spots 4-5 have the zone axis [0 ̅1]. The dark field images of spots 1 and 4 are shown in figure 13
(b), (c) and (e). In addition, to the α’ and α phase having a BCC crystal structure, a Fe3C carbide
having an orthorhombic crystal structure [74] was indexed from the SAD pattern in figure 13(f)
having a direction of (130) from a faint diffraction spot in between spot 3 and 5 and its
reflections (not shown in figure 13(f)). The zone axis for the Fe3C could not be found as carbides
oriented in the other directions were not resolved for the obtained SAD pattern. However, the
presence of Fe3C in the lath structure proves that the lower bainite phase is present in this
material [69]. A similar argument from the AB1 material can be used for the AB2 material with
reference to identifying the tempered martensite and bainite phases due to relatively very low
volume fraction of Austenite phase (γ) which was not resolved in the analysis. Since the
austempering temperature (332°C) is much closer to the calculated Ms temperature [70-71] of
322 °C and slightly below the Ms temperature from the CCT diagram of 4140 (≈ about 350°C), a
higher volume fraction percentage of tempered martensite (α’) would be expected in the AB2
material.
In this analysis, in the AB1 and AB2 materials, based on the evidence of the lath structure
observed from the bright field image (figure 12(a) and 13(a) and the single orientation of
carbides within the lath structure, it may be concluded that both the tempered martensite and

46
lower bainite are the phases present with relative differences in the volume fraction of these
phases with the austempering temperature.
External Hydrogen Charging
After machining and cleaning, all these batches of samples (annealed as well as austempered)
were then externally charged with hydrogen before conducting the fatigue crack growth tests.
The experimental setup consisted of two DC power supplies: Agilent E3616A and Sorensen
XPL-30-2D capable of providing a steady source of electric current of about 1-1.5 A, a Pyrex
glass dish for the electrolyte and a stainless steel bar of about 4 mm thickness acting as the
anode. The samples (annealed and austempered) to be charged with Hydrogen was used as a
cathode. Sodium Hydroxide with a concentration of 1N was used as the electrolyte for charging
hydrogen into the samples. Deionized water obtained from Barnstead Nanopure Diamond
D11911 having a resistivity of about 16.5+/-0.5 MΩ-cm was used to dissolve the electrolyte.
This was done to avoid the uptake of deleterious ions interfering with the fatigue crack growth
rate test during the external hydrogen charging. The current density was maintained steady at
300 A/m2 or 0.03 A/cm
2 and the samples were charged with hydrogen for different time periods
ranging from 150-250 hours. A minimum of three samples were charged from each batch for
each exposure time. A photograph of the experimental setup is shown in Figure 14.

47
Figure 14: Experimental setup of external hydrogen charging
Hydrogen Concentration Analysis (Vacuum Hot Extraction)
The precharged samples with hydrogen were analyzed for the hydrogen concentration via a
Vacuum Hot Extraction (VHE) method using NRC model 917. The precharged sample was first
weighed out, cleaned with ether to remove surface contaminants and then introduced into an
evacuated chamber surrounded by induction heating coil. The sample was then heated to a point
just below the melting point of the sample to degas hydrogen from the sample which is collected
in a separate chamber in the system. The amount of hydrogen is then measured by McLeod
gauge. All the measurements were accurate to within 0.1 ppm.

48
Fatigue Testing
After precharging with hydrogen, the specimens were precracked in fatigue to produce a 2 mm
sharp crack front in accordance with ASTM standard E-647 [66]. Fatigue testing of these
samples was carried out in a servo hydraulic Material Test System (MTS 810) test machine
under load control mode in room temperature and ambient atmosphere. All fatigue testing was
carried out at a cyclic loading frequency of 5 cycles per second. A constant amplitude sinusoidal
waveform was applied and the tests were carried out at a load ratio R = Kmax/Kmin =0.10.
Crack lengths were measured on the specimen surface using an optical microscope. At the same
time, the number of fatigue cycles was also recorded. The crack growth rate, da/dN, was
determined as per ASTM standard E-647 [66].
The threshold was obtained using a load shedding decreasing ΔK procedure of ASTM E-647
standard [66]. The load was periodically decreased until the crack growth rate reached a level of
10-10
m/cycle. The reduction of load at any ΔK level was done in such a way that no more than
10% of the load was reduced at any ΔK level. This load shedding was also done after the crack
has grown at least 0.5 mm at any ΔK level. In this way any retardation effect due to previous
higher ΔK level was avoided.
The fatigue crack growth rate data in the linear region was obtained using the increasing ΔK
procedure of ASTM E-647 standard [66]. The cyclic load was estimated initially at a given ΔK
level at the start of the test. It was cycled and held constantly at the same initial value as test
progressed. As the crack propagated with time, the ΔK at the notch increased with the increase in
crack length. The test was continued until the specimen fractured.

49
Three specimens were tested from each condition in identical manner in the threshold region and
three specimens were tested in the linear region for each hydrogen concentration and the average
values from three test specimens were taken as the representative of the crack growth rate at any
ΔK level. These average data from three test samples were plotted on the log-log scale for the
threshold region and the linear region. A best fit line was drawn in the linear region through
these data points.
Stress Corrosion Cracking Testing
The samples (annealed and austempered) were initially precracked in fatigue for 2 mm in a
servo-hydraulic MTS test machine to produce a sharp crack front. After precracking, the samples
were charged internally with hydrogen using the method mentioned earlier. After hydrogen
charging the samples were tested at a constant load at various initial stress intensity levels.
The crack extensions on the surface of specimens were monitored constantly by an optical
travelling microscope and a timer was used to record the corresponding time intervals for the
crack growth rate. The incubation time period for the crack growth was also determined and
crack extensions were recorded periodically. Crack length versus time was plotted and a
polynomial was fitted through these data. Crack growth rates were henceforth determined by
differentiating these polynomials.
Fractography
The fracture surfaces obtained after the fatigue crack growth testing were analyzed using the
JEOL JSM – 6510 LV SEM. In addition to this, some images were also obtained using JEOL

50
JSM - 6610 LV SEM and JEOL JSM – 7600 FESEM. The fracture images obtained were then
used to analyze the fracture surface morphology and crack growth mechanism in annealed and
the two batches of austempered specimens to characterize the corrosion fatigue behaviour.

51
CHAPTER 5 - RESULTS
Influence of Time on dissolved hydrogen concentration
Both the annealed and austempered (AB1 and AB2) specimens were charged with hydrogen for
same periods of time namely 150, 200, and 250 hrs respectively. Table 3 shows the effect of
charging times on the hydrogen concentration. It is evident from the table that both annealed and
AB1 had similar concentration of dissolved of hydrogen. Both the microstructure had
predominantly body centered cubic structure as X-ray showed. While there was some difference
in microstructure of the samples; the annealed material had ferritic pearlite and austempered
samples at 349°C and 332°C had tempered martensite and bainite structure. But, all of the
samples had BCC structure. Since the diffusion of hydrogen in low alloy ferritic steels is
relatively the same and occurs at fast rates [42, 75-76], this small microstructural difference did
not affect significantly the dissolved hydrogen content in the annealed and the austempered AB1
sample. However, in the case of AB2 sample, it was found to have significantly higher amounts
of dissolved hydrogen. The thickness of the AB2 were slightly thinner than those of annealed as
well as the AB1sample. The following equations [77] describe the concentration of hydrogen in
exposed specimens:
=
- (3)
=
- (4)
=
- (5)

52
Where, J∞ = Hydrogen permeation flux
I∞ = Saturation current density
A = Area of specimen through which diffusion occurs
F = Faraday constant
Deff = Effective hydrogen diffusivity
d = specimen thickness
tL = time-lag in seconds for 0.63 saturation extrapolated from the permeation curve
C0 = Hydrogen concentration on the cathodic side
All other things being constant or almost same due to similar nature of microstructure, except for
thickness which is slightly lower in austempered samples at 332°C (AB2), it would be expected
that this samples must have lower C0 based on equations (3) and (4) for the same charging time.
However, a contrasting behaviour is observed in this study. A threefold explanation could be
offered for such behaviour. Firstly, the martensitic start (Ms) temperature for this alloy, as
calculated from the following theoretical equation [71] below yields 322°C which is comparable
to the published value of 345°C for AISI 4140 [45]:
MS = 512 – (453 x %C) – (16.9 x %Ni) + (15 x %Cr) – (9.5 x %Mo) + (217 x (%C)2 – (71.5 x
%C x %Mn) – (67.6 x %C x %Cr) - (4)
Since the austempering temperature for this sample (AB2) is 332°C, very close to the Ms
temperature, it is expected that this batch of austempered samples have a higher fraction of
tempered martensite along with the bainite.

53
Secondly, martensitic structures have a higher dislocation density than the bainitic structure [42].
Henceforth, these dislocations act as hydrogen traps in the material. The presence of the traps
reduce the diffusivity of hydrogen to lower value than estimated by equation (3). Evidence in
literature [78] also points that diffusivity of hydrogen in steel cannot be determined by
application of Fick’s law (as in equation (3)) in the presence of traps in the material. In this case,
it is reasonable to state that sufficiently large number of traps are present in the material
austempered at 332°C (AB2) purely based on the higher concentration values of hydrogen
obtained in this material. In addition, in other Cr-Mo steels [42], the diffusion coefficient of
martensite was found to be marginally lower than bainite and also the diffusion coefficient
reduces with the increased strength of the alloy [76]. Owing to all these reasons, the samples
austempered at 332°C (AB2) had almost a two fold increase in the hydrogen concentration for
the same charging time compared to the other two batches.
Table 7: Influence of charging time on hydrogen concentration
Material Condition Charging time (hrs) Hydrogen Concentration
(ppm)
Annealed
150 0.7
200 1.5
250 2.9
Austempered
(Batch 1 - 349°C) – AB1
150 0.7
200 1.5
250 2.9
Austempered
(Batch 2 - 332°C) – AB2
150 1.6
200 3.6
250 8.1

54
Fatigue crack growth behaviour of the material in Annealed (as-received)
condition
Linear region
Figure 15 compares the fatigue crack growth rates in the linear region of annealed specimens
with different dissolved hydrogen concentration. All the data for the fatigue crack growth
behaviour is shown on a log-log scale. It is evident that the dissolved hydrogen causes increase
in the crack propagation rates in the linear region. It is seen that as the dissolved hydrogen
concentration increases the slope (m) of the Fatigue Crack Growth Rate (FCGR) curves
increases indicating the degradation effects of hydrogen at higher concentration in the annealed
condition. However, the effect is not as significant as in the threshold region (explained in the
next section). This is indicated by the closeness of the fitted curves to one another at various
increasing levels of dissolved hydrogen. In the annealed material treated for 250 hrs, it is seen
from the graph that the FCGRs are very high until about 40 MPa√m compared to all other
hydrogen charging condition and then begins to marginally decline to lower crack growth rate
than the 150 hrs samples. Also, it is worthwhile to note that in the case of 250hrs exposure to
hydrogen, the value of C and m in annealed specimen is lower than those exposed to hydrogen
for 200 hrs (shown later in Tables 10 and 11). This effect can be attributed to the diminished
influence of diffused hydrogen to the crack tip on fatigue crack growth rates at high ΔK levels. It
must be pointed out that the higher fatigue threshold and lower near threshold crack growth rate
in 250 hrs exposed annealed specimen can be attributed to the similar effect. Above 1.5 ppm
hydrogen concentration, hydrogen does not appear to significantly affect the fatigue crack
growth rate in the lower strength (annealed) material as observed in the linear region. Above this

55
value for the annealed specimen, the effect of hydrogen may be beneficial in the alloy with very
minimal degradation effects. Further investigations are necessary to verify this behaviour.
Figure 15: Comparison of fatigue crack growth rate in the linear region for annealed
samples
10-5
10-6
10-7
10-8
10 100
da/
dN
(m
/cyc
les)
ΔK (MPa√m)
Uncharged
150 hrs
200 hrs
250 hrs

56
Linear Region Fractographs
The fracture surface of the annealed specimen is shown in Figure 16. The annealed specimens
show crystallographic failure. However, the annealed specimen show increasingly brittle features
with increasing hydrogen concentration with crack branching visible at 250hrs exposure with
some transgranular (TG) facets.

57
Figure 16: Fatigue surface images of annealed material in linear region (ΔK (SIF) are in
MPa√m) [Note: Crack propagation from right to left in all images; Magnification: 1000X]

58
Threshold Region
Figure 17 shows the effect of dissolved hydrogen on the near threshold fatigue crack growth
behaviour of annealed samples. Owing to the lower strength in the annealed specimens, the
difference in the fatigue crack growth rate between the samples having no hydrogen and samples
with dissolved hydrogen was not very significant. In Table 8, the fatigue threshold values for the
annealed samples with different hydrogen exposure times are compared. Figure 17 and Tables 8
and 9 show that the crack growth rate and the fatigue threshold in annealed specimens are not
significantly affected by dissolved hydrogen content.
In case of annealed specimens, the 250 hrs charged samples shows an interesting behaviour. The
crack growth rate in 250 hrs charged samples are lower than the samples without any hydrogen.
It is very interesting to note that the annealed specimens charged with hydrogen for 250 hrs had a
higher threshold than the annealed specimens without any dissolved hydrogen content. This
behavior is quite interesting as hydrogen is well known to degrade the fatigue life of the alloy
steels [79]. The reason for this unusual behaviour is not yet clear. However, it appears that there
is a threshold limit for dissolved hydrogen in a material and beyond that limit, it could be
beneficial. This limit in the annealed samples appears to be 1.5 ppm as seen in the linear and as
well as threshold region.
A possible explanation for this kind of behaviour is based on the combined influence of strength
of the alloy in annealed condition and the influence of hydrogen in the lower ΔK region. Other
investigators [80] have also reported that hydrogen does not play a significant role in the fatigue
crack propagation in low yield strength materials. They have reported that [80] the fatigue
threshold stress intensity factor is higher in hydrogen than in air in low strength steels. In
addition, it is also reported [81] that the fatigue crack growth rate is lower in hydrogen

59
environment than in air in some low strength materials upto a ΔK of about 12 MPa√m. Hence, a
combined effect of the lower strength of the 4140 alloy in the annealed condition and a
diminished effect of hydrogen in the lower ΔK of about 12 MPa√m is the reason why the fatigue
threshold is higher and the fatigue crack growth rate is lower for the 250 hrs hydrogen exposed
specimen than in air as seen from the Figure 17 and Table 9. A similar behaviour has been
reported elsewhere for 4140 steel (SCM 440) [82] for the annealed condition. It was reported that
there was no reduction in area during a tensile test in hydrogen environment upto a pressure of
10 MPa. Since ductility is not reduced, fatigue threshold will not be affected. The fatigue
threshold depends on the cyclic plasticity of the material which in turn depends on the ductility
of the material. Therefore, this is a preliminary supportive evidence that hydrogen may be
beneficial in 4140 steel in the annealed condition upto a threshold limit wherein the fatigue and
tensile properties may be enhanced due to the presence of small amounts of hydrogen in the
material.

60
Figure 17: Comparison of fatigue crack growth rate in the near threshold region for
annealed samples
Threshold region fractographs
Fractographs of the annealed specimens (Figure 18) without any dissolved hydrogen show
typical crystallographic striation like crack growth surfaces with some TG features in the middle,
while the specimens with dissolved hydrogen show the presence of quasi cleavage fracture (150
hrs) with micro cracks, crack branching (200 hrs) and TG features (250 hrs).
10-7
10-8
10-9
10-10
10-11
1 10
da/
dN
(m
/cyc
les)
ΔK (MPa√m)
Uncharged
150 hrs
200 hrs
250 hrs

61
Figure 18: Fatigue surface images of annealed material in threshold region (ΔK (SIF) are
in MPa√m [Note: crack propagation from right to left in all images; Magnification: 1000X]

62
Summary of observations for Annealed material:
1. The FCGRs in the linear region are accelerated in presence of hydrogen compared to the
specimens without any dissolved hydrogen. The FCGRs in the linear region are increased
with increasing hydrogen concentration until about 1.5 ppm concentration above which there
is little effect of hydrogen. The fractographs show increasing brittle features with crack
branching with the increase in hydrogen concentration.
2. The near threshold FCGRs are also accelerated and the fatigue thresholds decrease with
increasing hydrogen concentration upto 200 hrs of charging time. At 250 hrs, the fatigue
threshold had unusually high value greater than the uncharged specimen. This again indicates
that above 1.5 ppm of hydrogen in the material it may be beneficial in the material. The
fractographs show signs of quasi cleavage fracture on increasing the dissolved hydrogen
concentration.

63
Fatigue crack growth behaviour of the material in Austempered Batch - 1
(AB1) condition
Linear region
Figure 19 shows the linear FCGRs for the austempered AB1 specimens. It is evident that the
dissolved hydrogen affects the crack propagation rates at high ΔK region until the final fracture
in the AB1 specimens. It is apparent that the hydrogen influences the fatigue crack growth rate
much more significantly in the austempered (AB1) samples based on the steep curves (higher
slopes) obtained in the linear region. Also, it is worthwhile to note that in the case of 250hrs
exposure to hydrogen, the value of C and m in austempered (AB1) (explained in the comparison
of different heat treatments – Tables 10 and 11) is lower than those exposed to hydrogen for 200
hrs. This effect can be attributed to the diminished influence of diffused hydrogen to the crack tip
on fatigue crack growth rates at high ΔK levels.
Generally, the higher strength (AB1) specimens are affected more by the diffused hydrogen than
the annealed samples. Previous investigators [81] have reported that an increase in the strength
of steel causes intense stress gradients at the cyclic plastic zone ahead of the crack tip region.
During cyclic loading, a cyclic plastic zone forms ahead of the crack tip. In higher strength
material, there is intense stress gradients in the vicinity of the crack tip in this plastic zone. This
intense stress gradient also affects the crack growth rate in the higher strength materials. The
steep crack growth rate curve of the austempered samples over annealed specimen is therefore
attributable to combined effect of two reactions: 1) due to degradation effect of hydrogen and 2)
due to intense stress gradients at the crack tip.

64
Figure 19: Comparison of fatigue crack growth rates in the linear region for AB1 samples
Linear region fractographs
The AB1 specimens show extensive crack branching with increasing the hydrogen concentration
and brittle mode of failure (Figure 20). It is evident that at 150, 200 and 250 hrs exposure time,
the formation of transgranular facets with quasi cleavage is clear from the fractographs in the
case of austempered specimens (AB1). This again points to the high strength of the alloy along
10-5
10-6
10-7
10-8
10 100
da/
dN
(m
/cyc
les)
ΔK (MPa√m)
Uncharged
150 hrs
200 hrs
250 hrs

65
with the degradation effects of hydrogen in high strength materials which is responsible for this
kind of fracture behaviour.
Figure 20: Fatigue surface images of AB1 material in linear region (ΔK (SIF) are in
MPa√m) [Note: Crack propagation from right to left in all images; Magnification: 1000X]

66
Threshold region
Figure 21 reports the near threshold fatigue crack growth behaviour of the austempered (AB1)
samples with different hydrogen concentration. It is apparent that the near threshold fatigue crack
growth increases with increase in hydrogen concentration in the heat treated samples. It is
evident also from this plot that the fatigue threshold stress intensity is reduced quite significantly
as the dissolved hydrogen concentration increases in the AB1 specimens. This behaviour is seen
through the threshold region. However, the effect of dissolved hydrogen is more clearly evident
in the near threshold region (da/dN - 10-9
– 10-11
m/cycle) with the significant increase in FCGRs
and drastic drop in ΔKth. The transition region (da/dN - 10-7
– 10-9
m/cycle) shows the
embrittlement effect of hydrogen though the concentration effects of hydrogen is diminished
compared to the near threshold region.
The embrittlement effect of hydrogen is very significant in the lower ΔK or the threshold region.
Several investigators [79-80] have reported that the embrittlement effect of hydrogen is more
prominent in the threshold region than the linear or fast fracture region. Moreover, this effect
increases with the hydrogen concentration [83]. An accumulation of hydrogen causes lattice
dilation in the steel resulting in the generation of strain fields that increase the internal energy.
The dissolved hydrogen can migrate to the crack tip during cyclic loading or fatigue easily due to
low loads encountered in the threshold region. Sufficient time is available for hydrogen to
diffuse from the bulk of the specimen to the vicinity of the crack tip between the low stress
cycles which is common in this region. This hydrogen accumulation ahead of the crack tip will
increase energy and consequently will increase the crack driving force for crack propagation [79]
since crack can now propagate at lower applied stress. This has resulted in higher near threshold
crack growth rate in the heat treated samples (AB1) with increased hydrogen concentration.

67
Figure 21: Comparison of fatigue crack growth rate in the near threshold region for AB1
samples
Threshold region fractographs
Figure 22 shows the fractographs of the AB1 samples at different dissolved hydrogen
concentrations in the threshold region. The uncharged AB1 specimens show typical ductile mode
striation like crystallographic failure but the samples with dissolved hydrogen had presence of
10-7
10-8
10-9
10-10
10-11
1 10
da/
dN
(m
/cyc
les)
ΔK (MPa√m)
Uncharged
150 hrs
200 hrs
250 hrs

68
intergranular fracture which is characteristic of hydrogen embrittlement. Some crack branching
was also observed in austempered specimens. The number of IG facets increased with hydrogen
concentration upto 200 hrs. At 250 hrs, a mixed mode having many IG facets, some
transgranular (TG) and cleavage like features with crack branching was observed.

69
Figure 22: Fatigue surface images of AB1 material in threshold region (ΔK (SIF) are in
MPa√m) [Note: crack propagation from right to left in all image; Magnification: 1000X]

70
Summary of observations for Austempered Batch 1 (AB1) material:
1. On increasing the dissolved hydrogen concentration in the AB1 material, the linear FCGRs
are greatly affected and increases with the hydrogen charging time. The 250 hrs charged
specimen had a lower FCGR than the 200 hrs charged specimen. However, the charged
FCGRs at all times were significantly higher than the uncharged specimen. The fractographs
showed signs of embrittlement with brittle like features on the fracture surface.
2. The near threshold FCGRs are increased and the fatigue thresholds reduce in the AB1
material upon increasing the dissolved hydrogen concentration and to a greater extent than the
annealed material. The ΔKth at all charged conditions is lower than the uncharged condition.
The higher strength might be responsible for this behaviour. The embrittlement effects are
much severe in the threshold condition as indicated by the highly faceted fracture surface.

71
Fatigue crack growth behaviour of the material in Austempered Batch 2
(AB2) condition
Linear region
The linear FCGRs for AB2 material is shown in Figure 23. Higher FCGRs are seen in the
specimens charged with hydrogen than the uncharged specimens. The higher the dissolved
hydrogen concentration the faster the crack growth rate at the low ΔK region. The effect of
hydrogen on the linear FCGRs is diminished at higher ΔK region. The slope of fatigue curves
does not change significantly up on increasing the hydrogen concentration unlike the previous
other two conditions (annealed and AB1) indicating the AB1 material, though degraded by
hydrogen, plays a minimal role on the fatigue crack propagation at high ΔK. It is observed that
the fatigue growth rate curves converge to a single point just before the fracture occurs. Several
investigators [2, 80, 84] in the past have studied the influence of hydrogen on the fatigue
behaviour of high strength alloys in the fast fatigue crack propagation region and has indicated
that the curves converge to the same value of crack growth rate irrespective of concentration of
dissolved hydrogen in the matrix or has less influence at high ΔK. However in the present
investigation, we find that the curves do not converge to a single point in the case of annealed
and AB1. All the fatigue curves converge to a single point in the austempered AB2 specimen. It
is evident that the curves with different hydrogen concentrations are very close. The reason for
this is that it takes sufficient time for hydrogen to diffuse from the bulk of the sample into the
crack tip region, where it causes decohesion at the crack tip leading to fast fracture. At high ΔK
levels, the crack growth is faster and diffusion rate of hydrogen is not fast enough to keep in pace
with the crack growth or in other words, there is not enough time for hydrogen to accumulate and
cause decohesion to break the lattice bonds. Hence, the degradation effect of hydrogen is

72
diminished in the linear region causing the crack growth rate curves to vary minimally at all
dissolved hydrogen concentrations. Hence, it can be concluded that the FCGRs and the
degradation caused by hydrogen are mutually coupled.
Figure 23: Comparison of fatigue crack growth rate in the linear region for AB2 samples
10-5
10-6
10-7
10-8
10 100
da/
dN
(m
/cyc
les)
ΔK (MPa√m)
Uncharged
150 hrs
200 hrs
250 hrs

73
Linear Region Fractographs
In the AB2 sample (Figure 24) with no hydrogen, the fracture surface shows typical fatigue
ductile striations with a few TG facets whereas in the dissolved hydrogen samples, there is a
mixed mode fracture surface consisting of TG features, extensive IG facets with extensive crack
branching. The degree of IG facets increases in the order of 150 hrs and 200 hrs, but then
switches over to a mixed mode type of failure at 250 hrs. This might be the reason why the crack
growth rate reduces in the ΔK = 60 – 70 MPa√m region to less than the crack growth rate of 150
hrs charged specimen.

74
Figure 24: Fatigue surface images of AB2 material in linear region (ΔK (SIF) are in
MPa√m) [Note: crack propagation from right to left in all images; Magnification: 1000X]

75
Threshold region
Figure 25 shows the near threshold FCP behaviour in the austempered (Batch 2) – AB2 samples.
This batch had the highest concentration of hydrogen among all the three batches for the same
treatment times. The fatigue thresholds are greatly affected as the hydrogen concentration
increases. Similar to the AB1 samples, it is seen that the near threshold region (da/dN > 10-9
–
10-11
m/cycle) is greatly affected. However, at higher FCGRs (da/dN > 10-9
m/cycle), it is
interesting to note that they are not affected significantly upon increasing the dissolved hydrogen
concentration almost like the previous batch of austempered samples. Unlike the AB1 samples,
there is a clear cut distinction between the dissolved hydrogen curves and that with no
precharging at all FCGRs fully well into the linear region. This suggests that the dissolved
hydrogen in this material (AB2) is causing sufficient lattice strains to raise the local SIFs during
each fatigue cycling to cause crack propagation at a lower applied stress thus degrading the
fatigue life of this material (AB2). On the other hand, the likelihood of presence of more TM to
B ratio than the AB1 material yielding the highest hydrogen concentration, due to the enhanced
dislocation density, did not cause suppression of ΔKth to such a large extent as it did in the other
two batches. Inspite of a threefold jump in dissolved hydrogen in the AB2 material at 250 hrs,
the ΔKth obtained was much higher than the AB1 material with no cathodic precharging and very
close to that of uncharged annealed material. It could be said that the presence of a higher TM
volume fraction in this material was responsible for such a behaviour and that a higher TM
presence in B matrix along with the RA yielded one of the most resistant material to hydrogen
induced cracking among the three tested batch of samples. Though the near threshold FCGRs of
AB2 are in between that of annealed and the AB1 material, it requires a higher threshold to

76
initiate fatigue crack propagation with a preexisting flaw under the influence of dissolved
hydrogen, taking into account the high concentration of dissolved hydrogen in the material.
Figure 25: Comparison of fatigue crack growth rate in the near threshold region for AB2
samples
10-7
10-8
10-9
10-10
10-11
1 10
da/
dN
(m
/cyc
les)
ΔK (MPa√m)
Uncharged
150 hrs
200 hrs
250 hrs

77
Threshold region fractographs
Figure 26 shows the fracture surface imaging of the AB2 samples. The uncharged AB2 sample
shows crystallographic type ductile mode fracture surface with some TG features in the middle
while the hydrogen charged specimens shows increasing presence of IG facets, some
transgranular features along with crack branching at 150 hrs and 200 hrs charging time.
However, the 250 hrs specimen show a brittle flat like fracture surface with IG and TG facets.

78
Figure 26: Fatigue surface images of AB2 material (ΔK (SIF) are in MPa√m)
[Note: crack propagation from right to left in all images; Magnification: 1000X]

79
Summary of observations for Austempered Batch 2 (AB2) material:
1. The linear region FCGRs are affected by the influence of dissolved hydrogen. As the
dissolved hydrogen concentration increases, the FCGRs also increases. However, the linear
FCGRs converge to a single point unlike the annealed and AB1 material showing minimal
influence of hydrogen as the SIF increases. The fractographs indicate an increasing degree of
IG facets with increased charging time except for the 250 hrs which changes to mixed mode
type of failure.
2. The near threshold FCGRs are much faster with the dissolved hydrogen content than the
uncharged specimens. However, the change in FCGRs upon increasing the hydrogen
concentration is not very prominent except for suppression of fatigue thresholds. The fracture
surface shows severe embrittlement in the hydrogen charged specimens The 250 hrs
specimens had a flat brittle like appearance with IG and TG facets.
3. The AB2 material had the highest fatigue threshold with dissolved hydrogen in the matrix
among the three batches of specimens tested. It was much higher than the fatigue threshold of
uncharged annealed and AB1 materials.

80
Comparison of Fatigue Crack Growth Behaviour among different heat
treatment conditions
Near Threshold Fatigue Crack Growth Behavior
Figure 27 compares the fatigue crack growth behavior of the annealed (as received) and heat
treated (austempered – AB1 and AB2) samples in the threshold region without any dissolved
hydrogen. The near threshold crack growth rate of AB1 samples are higher and the fatigue
threshold (ΔKth) was lower than the annealed and the AB2 samples. Table 8 reports the fatigue
threshold values of all the specimens without any dissolved hydrogen. The austempered samples
(AB1) had higher hardness and strength as seen in Table 2. This higher strength may have
resulted making the material more susceptible for accelerated crack growth [75, 78, 83-85].
Consequently, the crack growth rate in the austempered samples (AB1) were higher than the
annealed. The FCGRs of AB1 in the threshold region was higher at all SIFs.
In contrast, the austempered specimen (AB2) which had the highest hardness among all the three
batches of specimens tested and strength showed a reversing trend. It is seen from Figure 27 and
Table 8, that the AB2 had the highest threshold and the lowest fatigue crack growth rate among
all three tested specimens with no precharging (dissolved hydrogen). Upon initial observation,
this may seem to contradict the earlier discussion that higher strength material should have lower
fatigue threshold and higher fatigue crack growth rates in the threshold regime.
In the microstructural analysis, it was discussed that the AB2 samples would possess a relatively
higher fraction of Tempered Martensite (TM) to Bainite ratio than the AB1 samples due to the
relative closeness of austempering temperature in AB2 to the Ms temperature. This may be the
reason for the AB2 sample to have a higher ΔKth and lower FCGR than the other two samples.

81
This also proves that a direct relation between ΔKth and the strength or hardness of this alloy
cannot be made. This is seen to be true, in the current investigation, dealing with different
microstructures (F-P and TM-B) or within the same microstructure (TM-B) having a minor
variation in their relative volume fraction. Upon closer examination, this trend is particularly true
in the case of TM structures. In a similar variety of low alloy steel (AISI 4130) [86], the ΔKth has
little or no influence on the strength level in tempered martensitic structures. More generally,
many workers [87-90] have also observed very little influence of strength level on ΔKth
especially in low alloy steels. Prior investigation by Yu [91] have shown that there is no one to
one relation of strength to ΔKth in TM structures while F-P structures [92] show an inverse
relation between strength and fatigue thresholds. The fatigue thresholds obtained in this
investigation for the three different heat treatment conditions validate all these observations in
the case of AISI 4140. When the fatigue threshold of lower strength annealed specimen is
compared with high strength austempered (AB1) specimen, the inverse relation between strength
and ΔKth holds. However, the same conclusion cannot be drawn by comparing either Batch 1 and
Batch 2 austempered samples or the annealed specimen with the Batch 2 austempered samples.
A similar argument can also be made on the threshold FCGRs of these three samples as seen in
Figure 27.

82
Figure 27: Near threshold fatigue crack growth behavior of the material with no exposure
to hydrogen charging
10-7
10-8
10-9
10-10
10-11
1 10
da/
dN
(m
/cyc
les)
ΔK (MPa√m)
Annealed
AB1 - 349°C
AB2 - 332°C

83
Table 8: ΔKth for annealed and heat treated samples without any dissolved hydrogen
Material Condition ΔKth (MPa√m)
Austempered (Batch 1 - 349°C) – AB1 5.54
Annealed 6.68
Austempered (Batch 2 - 332°C) –AB2 8.12
In Figures 28, 29 and 30, the threshold fatigue crack growth behaviour of annealed and
austempered (AB1 and AB2) samples with different hydrogen concentrations are compared. It is
evident that at all exposure time periods, the fatigue crack growth rate of AB1 samples are higher
than the annealed and the AB2 samples. Even though both the annealed and AB1 samples had
similar level of hydrogen concentration, the crack growth rates in the heat treated samples were
significantly higher than the annealed samples. Moreover this difference in crack growth rates of
these two sets of samples increases with increased dissolved hydrogen content. This might be a
preliminary indication that the heat treated samples (AB1) having higher hardness and strength
are more susceptible to hydrogen induced cracking than the annealed samples. A similar
conclusion cannot be reached with respect to the AB2 samples. This batch had the lowest FCGRs
and highest thresholds of all the three batches in specimens without any dissolved hydrogen.
However, upon increasing the charging time and thereby the hydrogen concentration, the fatigue
thresholds are considerably reduced and the FCGRs though slower in the near threshold region
(da/dN - 10-11
– 10-9
m/cycle), is considerably higher than the annealed samples in the transition
region (da/dN - 10-7
– 10-9
m/cycle). It is evident from this behaviour that the alloy in AB2
condition, though embrittled by hydrogen through the reduction in ΔKth, needs sufficient crack

84
driving force (or crack length) to cause further cracking even with the higher concentration of
hydrogen in the material. In other words, the AB2 material needs sufficient SIF (or stress
gradient) of about 8-8.5 MPa√m (at all hydrogen concentration to reduce the chemical potential
of hydrogen near the crack tip so that the dissolved hydrogen in the bulk of the specimen can
move to the crack tip to cause decohesion. This initial hypothesis stems from the fact that AB2
sample has a higher fraction of TM to B ratio than the AB1. This TM in AB2 sample has a
higher dislocation density, hence a greater amount of dissolved hydrogen is present at these
dislocations and grain boundaries as reversibly trapped hydrogen [42, 92] having the binding
energies of 20-50 kJ/mol. These trapped hydrogen needs sufficient driving force or chemical
potential in the form of stress gradient (or SIF) to diffuse to the crack tip to cause further
cracking and accelerate crack propagation. It seems that this is a very valid assumption for the
AB2 specimen because the same trend is observed at all dissolved hydrogen concentration.
It might be questionable as to why the AB1 sample had the lowest threshold and highest FCGRs
among all the three batches with dissolved hydrogen despite not having the highest strength and
higher concentration of hydrogen than the AB2. One possible explanation is the AB1 sample had
a higher B to TM fraction where bainite has been attributed to cracking along the inter-lath
carbide particles. The morphology of bainite composed of ferrite and carbides is known to
reduce the susceptibility of steel to hydrogen assisted cracking than tempered martensite [93]. It
must also be pointed out the Thomson and others [94] work on 4140 showed a remarkable
decrease in load needed for crack initiation in hydrogen charged bend samples in quenched and
tempered martensite structure as opposed to bainitic structure. The austempered samples utilized
in this study has a predominantly bainitic structure with varying tempered martensite formed
during the shear transformation of bainite formation. So, the trend observed is quite convincing

85
and agrees with this study. On the contrary, another researcher [95] pointed out that the F-P
microstructure in the 4140 steel was the most severely embrittled and showed loss in strength
and % elongation. However, in this research, it was clear that the F-P structure did not show such
characteristics in terms of fatigue threshold nor in terms near threshold FCGRs. In fact, it was
also seen that the annealed (F-P) microstructure did not exhibit many intergranular (IG) facets in
the fractographs explained later. The only difference in the material used between these two
studies were that our material was annealed and having a coarse F-P microstructure while that
used by the other researchers were normalized at 750°C for 1 hr and then air cooled. No
information was provided regarding the hardness value after normalizing.
At this point, it could be safely told that not only subtle variations in the microstructure, as in this
case, make a huge variation in the fatigue properties (ΔKth and FCGRs) and other mechanical
properties in presence of dissolved hydrogen especially in the near threshold regime, but also the
heat treatment methods involved to get that particular microstructure may be involved. It should
also not be ignored that some of these effects such as yield strength, microstructure and type of
heat treatment, hardness and various other metallurgical factors become coupled that one
parameter cannot be taken as the sole contributor to fatigue crack growth behaviour. However
from the results obtained, decreasing the austempering temperature in the 4140 alloy increases
the fatigue threshold and lowers near threshold FCGRs with or without the dissolved hydrogen.

86
Figure 28: Near threshold fatigue crack growth behavior of the material with 150 hrs of
exposure to hydrogen
10-7
10-8
10-9
10-10
10-11
1 10
da/
dN
(m
/cyc
les)
ΔK (MPa√m)
Annealed
AB1 - 349°C
AB2 - 332°C

87
Figure 29: Near threshold fatigue crack growth behavior of the material with 200 hrs
exposure to hydrogen
10-7
10-8
10-9
10-10
10-11
1 10
da/
dN
(m
/cyc
les)
ΔK (MPa√m)
Annealed
AB1 - 349°C
AB2 - 332°C

88
Figure 30: Near threshold fatigue crack growth behavior of the material with 250 hrs
exposure to hydrogen
10-7
10-8
10-9
10-10
10-11
1 10
da/
dN
(m
/cyc
les)
ΔK (MPa√m)
Annealed
AB1 - 349°C
AB2 - 332°C

89
Table 9: ΔKth for annealed and heat treated samples for different hydrogen exposure times
Material Condition Charging time (hrs) ΔKth (MPa√m)
Annealed 150 5.58
200 5.49
250 7.85
Austempered
(Batch 1 - 349°C) – AB1
150 5.29
200 4.17
250 3.70
Austempered
(Batch 2 - 332°C) – AB2
150 6.59
200 6.17
250 6.01
Fatigue Crack Growth Behavior in the Linear Region
Figure 31 reports the fatigue crack growth behaviour of annealed and austempered (AB1 and
AB2) specimens in the linear region at da/dN > 10-7
m/cycle. It is evident from the plot that the
austempered (Batch 1) – AB1 specimens has higher crack growth rate than the annealed
specimen. This higher crack propagation behaviour in austempered AB1 specimens could be
attributed to higher strength and hardness. In comparison, the austempered (Batch 2) – AB2
specimens had the lowest FCGRs among the three batches despite the higher hardness and
strength. This behaviour is similar to what is seen in the threshold region and can be attributed to
the strength independence of FCGRs in B and TM type microstructures. It is worthwhile to take
note that the lower austempering temperature of 332°C (AB2 samples) gives better fatigue crack

90
growth (FCG) resistance in the linear region just as observed in the threshold region. In fact, it
gives the best crack growth resistance even when compared with the low strength annealed
material with a good combination of strength and hardness. Hence, upon comparing the FCGRs
and ΔKth in the linear region as well as the threshold region, it is now known that lower the
austempering temperature better the FCG resistance in the 4140 alloy with no precharged
hydrogen. It is good to point out that Kondo and others [61] showed a similar trend in quenched
and tempered SCM440H. The lower the tempering temperature yielded low FCGR with the only
difference being the microstructure was completely tempered martensite (TM). Table 10 shows
the Paris constants for austempered (Batch 1 and 2) and annealed specimens. Austempered
specimens (AB1) had lowest C and highest m values.

91
Figure 31: Comparison of the fatigue crack growth behavior of the annealed and
austempered samples with no exposure to hydrogen charging
10-5
10-6
10-7
10-8
10 100
da/
dN
(m
/cyc
les)
ΔK (MPa√m)
Annealed
AB1 - 349°C
AB2 - 332°C

92
Table 10: Comparison of Paris Constants for annealed and austempered samples
Material Condition C m
Annealed 1*10-10
2.08
Austempered (Batch 1 - 349°C) – AB1 2*10-12
3.45
Austempered (Batch 2 - 332°C) – AB2 5*10-11
2.14
Figures 32, 33 and 34 show the crack growth behaviour of annealed and austempered (AB1 and
AB2) samples for 150, 200 and 250 hrs of exposure to hydrogen charging respectively. The
austempered samples (AB1) have higher crack growth rates at all levels of dissolved hydrogen
on comparison with the annealed specimens. Moreover, it is observed that the effect of hydrogen
on the fatigue crack growth increases with increased hydrogen concentration in the alloy in both
the specimens. The dissolved hydrogen affects the fatigue behaviour of the alloy in the linear
region significantly in both the annealed and austempered (AB1) specimens. This is apparent in
the figures 30 through 31. As the hydrogen concentration increases the slope of the curves
becomes steeper and also in the AB1 specimens the shift in the crack growth curves is much
more pronounced than the annealed specimens. Both of these patterns indicate a drastic reduction
in the fatigue resistance in the AB1 specimens compared to the annealed specimens due to
dissolved hydrogen even in the linear region. On the other hand, the AB2 specimens are only
marginally affected in the linear region. The linear FCGRs in AB2 are higher than the AB1
samples in the ΔK region of 20-30 MPa√m but then at higher ΔK = 30 - 55 MPa√m, the FCGRs
decrease to less than that observed in AB1 samples. At the corresponding crack growth rates
(da/dN ≈ 1-3*10-7
m/cycle), these are seen as a sudden rise in crack growth rates before falling

93
off shortly after (da/dN ≈ 3*10-7
m/cycle). For the 150 hrs and 250 hrs, the point of inflection
from the sudden rise to a straight line curve occurs at the same point (da/dN ≈ 2*10-7
m/cycle),
but for the 250 hrs specimen this occurs at marginally higher (da/dN ≈ 3*10-7
m/cycle) crack
growth rate. These changes in cracking behaviour or bursts of cracking is not seen in the
untreated AB2 sample. This might be due to the embrittling nature of hydrogen and hence it is
seen to marginally increase in the 250 hrs AB2 sample. Ritchie [96] has also reported this nature
for another low alloy steel. Also, at all concentrations of dissolved hydrogen, the FCGRs of
austempered (Batch 2) samples merge the FCGRs of annealed samples at a ΔK > 55 MPa√m.

94
Figure 32: Comparison of the fatigue crack growth behavior of the annealed and
austempered samples with 150hrs of exposure to hydrogen
10-5
10-6
10-7
10-8
10 100
da/
dN
(m
/cyc
les)
ΔK (MPa√m)
Annealed
AB1 - 349°C
AB2 - 332°C

95
Figure 33: Comparison of the fatigue crack growth behavior of the annealed and
austempered samples with 200 hrs of exposure to hydrogen
10-5
10-6
10-7
10-8
10 100
da/
dN
(m
/cyc
les)
ΔK (MPa√m)
Annealed
AB1 - 349°C
AB2 - 332°C

96
Figure 34: Comparison of the fatigue crack growth behavior of the annealed and
austempered samples with 250hrs of exposure to hydrogen
Table 11 reports the C and m constants for the austempered (AB1 and AB2) and annealed
specimens at different dissolved hydrogen concentration. In the annealed as well as austempered
(AB1) specimens, as the hydrogen concentration increases, the value of m increases and the
value of C decreases in both of the specimens indicating the degradation effects of hydrogen
through end of the threshold region and well into the start of the linear regime (at da/dN rates
10-5
10-6
10-7
10-8
10 100
da/
dN
(m
/cyc
les)
ΔK (MPa√m)
Annealed
AB1 - 349°C
AB2 - 332°C

97
more than 10-7
m/cycle). As the hydrogen concentration increases, the C and m values increases
significantly in the austempered specimens (AB1) specimens. However in the annealed
specimens, C and m are not significantly affected with increased dissolved hydrogen
concentration. While the annealed and as well as the AB1 specimen are affected in the linear
region, the same cannot told about the AB2 specimen. As the hydrogen concentration increases,
their C value increases in the AB2 specimen, but their m value gradually decreases. This shows
that the AB2 specimen is not significantly affected in the linear region as the other two
conditions. The degradation effects though slightly present at low ΔK diminishes after ΔK > 55
MPa√m.
Table 11: Paris constants for different hydrogen exposure time
Material Condition
Charging time
(hrs)
C m
Annealed
150 1*10-11
2.25
200 4*10-11
2.45
250 9*10-11
2.16
Austempered (Batch 1 - 349°C) –
AB1
150 2*10-12
3.53
200 7*10-13
3.86
250 9*10-13
3.72
Austempered (Batch 2 - 332°C) –
AB2
150 1*10-09
1.54
200 2*10-09
1.39
250 2*10-09
1.33

98
Stress Corrosion Cracking
Annealed Material
The stress corrosion cracking (SCC) behaviour of annealed material are shown in figure 35.
From the figure 35, it is clear that the KISCC value and the stress corrosion CGRs do not show any
particular trend. It is evident that the material is undergoing stress corrosion cracking from the
nature of the graph. However, the concentration of dissolved hydrogen did not have any
significant effect on the KISCC values. Numerous tests were conducted with different stress
intensity in the range of K ≈ 30 – 45 MPa√m. No crack propagation was observed at these SIFs
even after 200 hrs at constant load. Therefore the SIF was increased and the curves reported in
figure 35 were observed. Due to the dynamic nature of the experiment via ex situ hydrogen
charging, the dissolved hydrogen might have degassed from the material during the constant load
tests that not enough concentration of hydrogen is present at the crack tip to cause delayed
cracking in this material. This might be the case in the specimen charged with hydrogen for 200
hrs (red curve in figure 35) where the crack growth rate increases more than the specimen
charged for 150 hrs above the K ≈ 52 MPa√m. But, below this K value, the CGRs are less than
the specimen charged for 150 hrs. This might suggest that only above K ≈ 52 MPa√m there is
sufficient driving force to cause hydrogen induced cracking at the crack tip. In other words, until
this particular K value is attained, there is not enough driving force for hydrogen to diffuse from
the bulk the material to the crack tip to increase the crack growth rate. Table 12 lists the KISCC
values for the annealed material. Due to nature of the results obtained, it was thought that the
corrosion fatigue behaviour might be more useful than the static SCC where the cyclic loads
severely reduce the fatigue life of the alloy. Hence, more emphasis was given towards corrosion
fatigue behaviour of the alloy.

99
Figure 35: SCC behaviour of annealed material at different charging times of dissolved
hydrogen (150 hrs – red; 200 hrs – green; 250 hrs – black)
1.E-08
1.E-07
1.E-06
1.E-05
1.E-04
40 44 48 52 56 60 64
log
da/
dt
(m/s
ec)
K (MPa√m)
0.7 ppm
1.5 ppm
2.9 ppm

100
Austempered Batch -1 (AB1) material
A similar behaviour as observed in the annealed material was seen in the austempered batch 1
(AB1) material as shown in the figure 36. Although the specimen treated for 200 hrs had higher
CGRs at all K level, it had a higher KISCC than the sample charged for 150 hrs. Table 12 lists
the KISCC values for the AB1 material as a function of charging time.
Figure 36: SCC behaviour of AB1 material at different charging times of dissolved
hydrogen (150 hrs – red; 200 hrs – green; 250 hrs – black)
1.E-08
1.E-07
1.E-06
1.E-05
1.E-04
40 44 48 52 56 60 64
log
da/
dt
(m/s
ec)
K (MPa√m)
0.7 ppm
1.5 ppm
2.9 ppm

101
When the KISCC value of the annealed and AB1 samples were compared, it is evident that the
annealed material had higher KISCC value at lower hydrogen concentration. On the other hand,
interestingly at very high hydrogen concentration, austempered (AB1) samples had higher KISCC.
Generally KISCC decreases with increase in yield strength. But here the AB1 samples have high
yield strength and high KISCC. This indicates austempering may be a better heat treatment process
than conventional quench and tempering. Therefore, the Bainitic – Tempered Martensitic mixed
microstructure instead of pure martensitic or tempered martensitic structure will have better
KISCC value.
Table 12: KISCC parameter of the annealed material for different hydrogen charging time
Material
Condition
Charging time (hrs) Dissolved
Hydrogen
Concentration
(CH) (ppm)
KISCC (MPa√m)
Austempered
(Batch 1 - 349°C)
– AB1
150 0.7 43.4
200 1.5 45.2
250 2.9 52.3
Annealed 150 0.7 50.5
200 1.5 52.4
250 2.9 51.4

102
Influence of Hydrogen Concentration on Incubation period at different stress intensity
levels
The variation of incubation period with dissolved hydrogen concentration at different SIF for the
AB1 material are shown in Figure 37. Incubation period (Tinc) for the crack growth was found to
decrease with the increase in stress intensities (K) and also with increase in Hydrogen
concentration for the Heat Treated samples. Tinc was found to decrease exponentially as the K
increased.
The corresponding equations for the variation of incubation period due to increase in hydrogen
concentration as a result of increase in charging time are as follows:
For 150 hrs: Tinc = 1x10¹¹
e-0.461(K)
- (6)
For 200 hrs: Tinc = 1x10¹³
e-0.604(K)
- (7)

103
Figure 37: Influence of Hydrogen Concentration on Incubation period at different stress
intensity levels in AB1 material
1
10
100
1000
10000
35 40 45 50
log
T in
c (s
ecs
)
K (MPa√m)
0.7 ppm
1.5 ppm

104
Influence of Hydrogen Concentration (CH) on KIscc and crack growth rate in region 2
(da/dt)II
The influence of hydrogen concentration on KISCC and the region 2 CGRs are shown in figures
38 and 39. KISCC was found to vary with CH in the following manner (figure 38):
For the annealed material: KISCC = 51.051 x (CH) -0.3129
- (8)
For the AB1 material: KISCC = 46.372 x (CH) -0.4733
- (9)
Crack growth rate (da/dt) was found to increase with increase in stress intensity level. Also, the
crack growth rate increased as the hydrogen concentration (CH) increased up to a certain level
(1.5 ppm) and after that was found to have less influence (figure 39). The same phenomenon was
observed in both AB1 as well as annealed steel samples. Crack growth rate varies with CH in the
following manner (figure 39):
For the annealed material: (
) = ( )
- (10)
For the AB1 material: (
) = ( )
- (11)

105
Figure 38: Influence of hydrogen concentration (Co) on KISCC (blue – AB1 material (heat
treated – HT; red - annealed)
10
100
0.1 1 10
KIs
cc (
MP
a√m
)
Hydrogen Concentration, CH (ppm)
HT
Annealed

106
Figure 39: Influence of hydrogen concentration (Co) on da/dt in Region 2 (blue – AB1
material (heat treated – HT); red - annealed)
We wanted to investigate whether SCC behaviour can be predicted from the corrosion fatigue
crack growth rate data. This is explained in the following section.
1.E-07
1.E-06
1.E-05
1.E-04
0.1 1 10
Cra
ck G
row
th R
ate
(da/
dt)
, (m
/se
c)
Hydrogen Concentration , Co (ppm)
HT
Annealed

107
Qualitative mechanism to explain the FCGRs in the Intermediate growth rate
(10-8
˜ 10-7
m/cycle) region
Existence of a plateau region and its relation to SCC
The fatigue crack growth rate behaviour (FCGRs) in the intermediate growth rate region i.e.,
between (10-8
˜ 10-7
m/cycle) has been characterized by McEvily and Wei [97] into three
different classes: (a) Type A – true corrosion fatigue, (b) Type B – stress corrosion fatigue and
(c) Type C – mixed corrosion fatigue. These are illustrated in the following figure 40. The da/dN
regimes of interest are circled in green in figure 40.
Figure 40: Classification of plateau region by McEvily and Wei [97, 98]
The type A behaviour is characterized by the significant influence by the environment at low
FCGRs followed by the gradual merging of the environmental curve with the inert curve at high

108
FCGRs with minimal influence from the environment or shows a strong dependence on time or
frequency. Type A behaviour is termed as True Corrosion Fatigue. In the type B behaviour, the
material shows little influence due to environment until a characteristic “KISCC” stress intensity
factor is attained and then shows a marked influence on FCGRs after a SIF greater than the
“KISCC” value is attained. This is characterized as Stress Corrosion Fatigue. Type C is a mixed
mode behaviour where the material is influenced by both time dependent (fatigue) and stress
corrosion dependent (SCC) processes.
In the current investigation, it is necessary to mechanistically relate the obtained FCGRs via one
of the three above mentioned mechanisms since the study was also based on SCC of 4140 alloy.
This characterization mainly based on the existence of or Kmax, a characteristic SIF based
on the particular material – environment system which manifests as an inflexion point on the
da/dN vs ΔK curve in the intermediate region very close to the start of Region 2 in fatigue (Paris
regime). This mechanistic process is explained in regards to each of the three batches of material
utilized in this study by means of obtained FCG curves correlated by a detailed fractographic
analysis which could be linked possibly to the limited SCC curves obtained.
Annealed
The annealed 4140 material has a ferritic – pearlitic microstructure and is the only low strength
(σys = 757 MPa) material used in this study. In the figure 41, the intermediate FCGRs are plotted
against ΔK for the annealed material at four different hydrogen charging times starting with no
charging until 250 hrs. It is evident from the figure that hydrogen has very little or minimal
influence on the crack growth rates at all SIF ranging from 10 – 90 MPa√m. The only plateau
observed in this material exist between da/dN ≈ 4 – 5 x 10⁻⁸
m/cycle (ΔK ≈ 17 – 20 MPa√m) for

109
the 150 hrs hydrogen charged condition. This is also seen in the figure 40 (e) and 40 (f) taken
around the same SIF with the fracture morphology changing from transgranular to transgranular
plus quasi cleavage like features. However, the inflection point is not distinct after about ΔK ≈
20 MPa√m. Upon increasing the charging time to 200 hrs, there is minimal fatigue damage to the
material at ΔK ≈ 20 MPa√m as shown in the figure 42 (i) and (j) and at higher SIFs, the damage
is only due to cyclic loading as in figure 42 (k) and (l) and almost resembles the material in
uncharged condition (figure 42 (c) and (d)).

110
Figure 41: Comparison of FCGRs in Annealed material in Intermediate region
(10-8 ˜ 10-7 m/cycle)
10-6
10-7
10-8
20 30 40 50 60 70 80 90 10
da/
dN
(m
/cyc
le)
ΔK (MPa√m)
Untreated
150 hrs
200 hrs
250 hrs
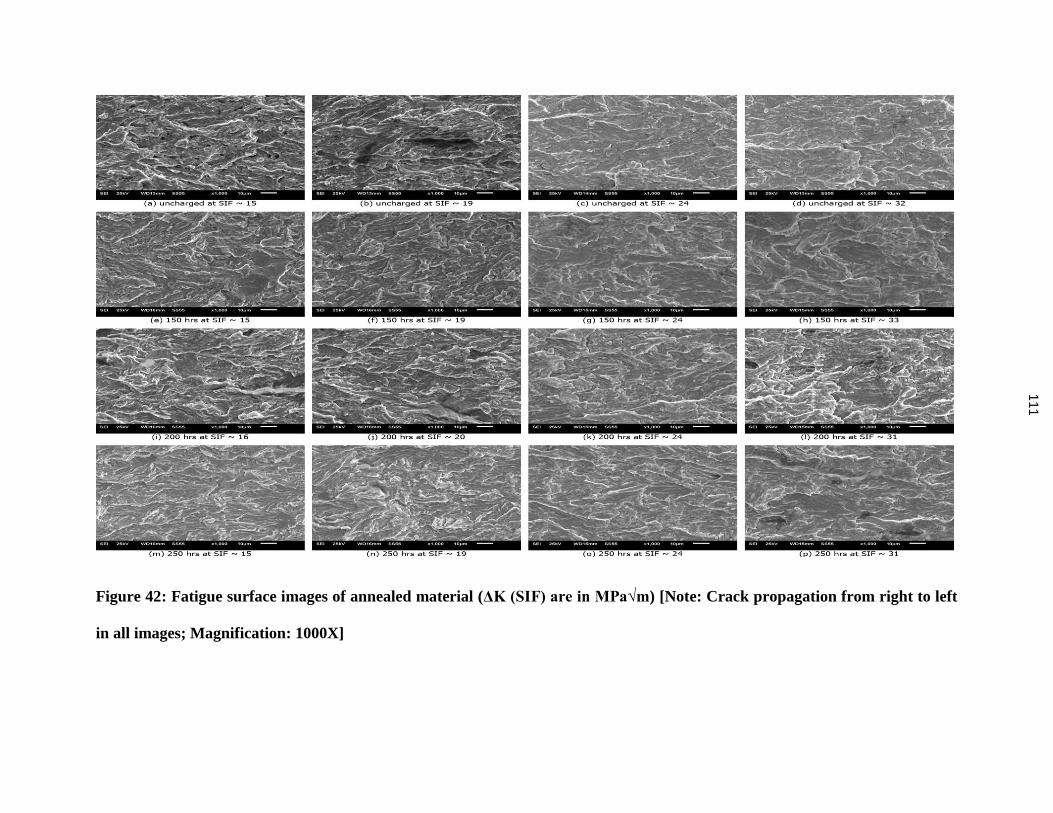
11
1
Figure 42: Fatigue surface images of annealed material (ΔK (SIF) are in MPa√m) [Note: Crack propagation from right to left
in all images; Magnification: 1000X]

112
It is interesting however, that the material charged at 250 hrs exhibits minor retardation in the
FCGRs compared to the uncharged specimen until da/dN ≈ 5 x 10⁻⁸
m/ cycle (ΔK ≈ 20 MPa√m)
and then continue to grow at about the same rate or more than the uncharged specimen. This is
again supported by the fractographs (figure 42(m) and (n)) resembling the uncharged specimen
(figure 42(a) and (b)) and only at exhibiting cleavage features at ΔK ≈ 24 MPa√m (figure 42(o))
then finally microplastic tearing at higher ΔK. It has been shown by Suresh and Ritchie [99], that
the lower strength steels show Kmax < KISCC due to the strain rate sensitivity which is not
encountered in high strength materials and Kmax can be markedly reduced in presence of cyclic
loading. The current study shows that the annealed material could be categorized as type B
behaviour, that of “stress corrosion fatigue” just by the closeness of the hydrogen charged curve
to the uncharged curve (although the uncharged curve cannot be purely regarded as “inert
curve”), but the absence of a clear inflection point in the FCG curves indicating the Kmax value
either at, above or below the KISCC value corroborated by the absence of predominantly IG facets
at any high ΔK in the figure 3 shows that it is case of type A behaviour. It was also these absence
of any predominant brittle like features – either TG, IG or cleavage in the fracture images (figure
42), that this material yielded very little or no data in delayed brittle cracking (SCC) tests. In
other words, the amount of dissolved hydrogen in this material at all charging times, either in
static or cyclic loading, did not reach the critical concentration needed at or ahead of the crack tip
to cause HIC and increase the CGRs significantly. Though it was considered that lower strength
steels exhibit very high KISCC comparable to high strength steels in presence of gaseous hydrogen
due to static loading and that the FCGRs are markedly increased much below the KISCC due to
synergistic action cyclic load and hydrogen at the crack tip [99], it has not been observed in this
material in either scenario (static or dynamic loading).

113
Austempered (Batch 1) – AB1
The AB1 material had a predominantly α phase with almost no γ phase after austenitizing and
austempering at 349°C. The austempered materials had a duplex – bainite + tempered martensite
microstructure varying only in the relative volume fraction amounts. The AB1 material had a
very high strength (σys ≈ 1370 MPa) and displayed significant differences in the FCGRs
compared to the uncharged material (Figure 43) in the intermediate region well into the onset of
the Paris region.

114
Figure 43: Comparison of FCGRs in AB1 material in Intermediate region
(10-8 ˜ 10-7 m/cycle)
This behaviour could be typified as type A – “pure corrosion fatigue” from the apparent
differences in the FCGRs at low ΔK approaching the fatigue threshold and merging to the
uncharged curve at high ΔK approaching failure. The CGRs increase steadily with the increase in
hydrogen charging times until 200 hrs with the 250 hrs charged specimen exhibiting marginally
lower CGRs than the other two. The onset of the plateau region occurs at da/dN ≈ 1 x 10⁻⁷
10-6
10-7
10-8
10 20 30 40 5 50
da/
dN
(m
/cyc
le)
ΔK (MPa√m)
Untreated
150 hrs
200 hrs
250 hrs

115
m/cycle (ΔK ≈ 17 MPa√m) in all the three charging conditions until a ΔK ≈ 25 – 27 MPa√m.
The fracture images taken at different ΔK shown in figure 42 qualify this behaviour. In the
material charged at 150 hrs and 200 hrs, the fracture behaviour changes from predominantly IG
plus some TG facets to TG cleavage to quasi cleavage at SIFs 22, 24, 31 MPa√m respectively
moving from left to right in the figure 44 (d) – 44 (i). However, there is a decrease in number of
IG facets at 250 hrs starting at 22 MPa√m which is mainly TG plus cleavage. The same is
manifested in the figure 44 for the 250 hrs charged material. Noting the inflection point from the
same figure 43 for all three hydrogen charged condition is around ΔK ≈ 27 MPa√m (Kmax = 30
MPa√m) and by comparing with the KISCC of the same material at 150 hrs hydrogen charged
condition to be 43 MPa√m, it seems that Kmax < KISCC which is quite unlikely for AB1 material
for two reasons [100]: one that the material has high strength and two that the material has a
martensitic structure. The widely accepted idea that hydrogen concentrates at dislocations near
the prior austenitic grain boundaries and/or due to concentration of hydrogen around inclusions
such as MnS which was shown to be present during the microstructural analysis in this material
and cause extensive IG cracking along these prior austenitic grain boundaries by decohesion at
the grain interface. Though this statement is found partially true in this case due to observance of
IG facets at ΔK ≈ 20 MPa√m, it is not effective at high SIFs around the KISCC value in this
material.
For the dissolved hydrogen present in the material at each hydrogen charged condition during
cyclic loading to migrate to the stressed centers such as the crack tip represents a definite time
lag for diffusion from within the matrix. The cyclic loading conditions at high ΔK might not give
enough time for hydrogen ion migration to cause brittle cracking as observed in SCC testing at
higher ΔK levels. This rate limiting step of hydrogen diffusion causes less HIC damage at high

116
cyclic ΔK, but lower than the observed KISCC value. In addition to it, the material has a duplex
microstructure of bainite and tempered martensite instead of a single microstructure quite
normally observed in the case of high strength steels. This also has an additional influence on the
absence of a stress corrosion type behaviour (type B) and subsequently on the superposition of
corrosion fatigue behaviour on the SCC behaviour encountered in this steel.

117
Figure 44: Fatigue surface images of AB1 material (ΔK (SIF) are in MPa√m)
[Note: Crack propagation from right to left in all images; Magnification: 1000X]

118
Austempered (Batch 2) – AB2
The AB2 material austempered at 630°F exhibits a similar behaviour as the AB1 material.
Owing to the lower austempering temperature, this material has a higher strength (σys ≈ 1481
MPa). The FCGRs of this material is shown in Figure 45. Even in this material, type A behaviour
is observed, although the differences in the CGRs occur at a higher ΔK ≈ 10 MPa√m at the lower
end of the crack growth curve. The extent of difference in the CGRs is more pronounced in the
da/dN range ≈ 1x10⁻⁸
– 1x10⁻⁷
m/cycle than the AB1 material. Significant changes corresponding
to the increased CGRs are seen in the fractographs shown in Figure 46. At all three charging
conditions, the fracture surfaces show increasingly brittle failures mode starting with IG, mixed
mode (TG plus IG) and finally TG with cleavage at ΔK ≈ 22, 24, 31 MPa√m respectively. The
plateau region occurs at SIFs 17 - 31 MPa√m. In addition to this, there is significant variation in
the FCGRs even at very high ΔK of 60 MPa√m which is not evident in the other two batches of
the 4140 alloy. It must be pointed out that the brittle nature of fracture surface explains the
sudden surge in the FCGRs in the intermediate region when compared with the other two batches
of specimens used in this study in the linear region fatigue crack growth behaviour.

119
Figure 45: Comparison of FCGRs in AB2 material in Intermediate region (10-8 ˜ 10-7
m/cycle)
10-7
10-8
10 20 30 40 50 60
da/
dN
(m
/cyc
le)
ΔK (MPa√m)
Untreated
150 hrs
200 hrs
250 hrs

120
Figure 46: Fatigue surface images of AB2 material (ΔK (SIF) are in MPa√m) [Note: Crack
propagation from right to left in all images; Magnification: 1500X]

121
Mechanistic explanation of Fatigue Threshold Stress Intensity Factor (ΔKth)
and Near Threshold Fatigue Crack Growth Rates
Annealed
The explanation of fatigue threshold and near threshold fatigue crack growth rate in the annealed
material were based on the observed FCGRs curves and the corresponding fracture surface
images taken at each specified ΔK as shown in the figure 47. The overall fracture behaviour in
the annealed material seems to be of transgranular nature in specimens with or without dissolved
hydrogen as seen from the fractographs in figure 47. However, there was a difference observed
in the nature of crack propagation within the grain structure. In the annealed material with no
dissolved hydrogen, as the fatigue threshold is approached, the fracture surface transitions from a
ductile like transgranular feature to more flat like appearance from ΔK ≈ 9 – 10 MPa√m. The
typical crystallographic fracture features were less evident as the fatigue threshold was reached.
As expected, there was no presence of IG facets at any ΔK due to the absence of dissolved
hydrogen in the matrix. However, at a ΔK ≈ 9 – 10 MPa√m, a prominent transgranular feature
was observed as seen in figure 47(b) (center of the picture). This feature was from the matrix of
the material as confirmed by Energy Dispersive Spectroscopy (EDS) and not due to crack
propagation through or via grain pullout from an inclusion (MnS). Upon increasing the
concentration of dissolved hydrogen, more brittle like transgranular features were observed until
a ΔK ≈ 9 – 10 MPa√m at all dissolved hydrogen concentrations. Unlike the specimen with no
dissolved hydrogen, the mode of crack propagation thru the matrix appears to be quasi cleavage
in the specimens with dissolved hydrogen. The degree of quasi cleavage features increased upon
increasing the dissolved hydrogen concentration until about 1.5 ppm (200 hrs of external
hydrogen charging) until a SIF of about 9 – 10 MPa√m and thereafter decreased as the ΔKth was

122
approached (Figures 47(d) - (i)). Though some quasi cleavage features was evident at 2.9 ppm
(250 hrs of external hydrogen charging) at higher SIF of 12 -13 MPa√m, but it was greatly
reduced at lower SIF of 9 – 10 MPa√m with some features observed at the ΔKth. This may
partially explain as to why this specimen had a lower crack growth rate and a higher ΔKth than
the specimen without any external hydrogen charging. From the figures 47(a), (d), (g) and (j) at
the ΔKth, a flat featureless surface was observed in specimens with or without hydrogen.

123
Figure 47: Fatigue surface images of annealed material in threshold region (ΔK (SIF) are
in MPa√m) [Note: Crack propagation from right to left in all images; Magnification:
1000X]

124
The monotonic and cyclic plastic zone size were calculated from Rice’s formula [101] as given
below:
Monotonic plastic zone size =
(
)
- (1)
Cyclic plastic zone size =
(
)
- (2)
The monotonic and cyclic plastic zone size were computed based on the SIFs where maximum
number of IG facets were found or where maximum amount of transgranular (TG) features
(either ductile or brittle features) were observed from the fractographs. Table 13 lists the
computed values of monotonic as well as cyclic plastic zone size along with the corresponding
SIFs (ΔK and Kmax) at which maximum TG features (either ductile or brittle features) were seen
in the fractographs in figure 47. The grain size distribution in the annealed material is also listed
in table 13 for comparison with the monotonic and cyclic plastic zone sizes in the near threshold
region. It is evident from table 13 that the maximum amount of brittle features peaks at ΔK
where the cyclic plastic zone size almost equals the grain size of the matrix. A similar trend can
be attributed to the specimen with no dissolved hydrogen in terms of ductile TG features.
However, the monotonic plastic zone size is found to be much larger than the grain size of the
matrix. This suggests that the fatigue crack propagation where the maximum TG morphology
was observed with or without dissolved hydrogen is controlled by ΔK rather than Kmax. In other
words, the damage caused by dissolved hydrogen which manifests in the form of cleavage type
TG features affects the fatigue crack propagation (FCP) until the plastic zone size is almost equal
to the grain size in the annealed material. This behaviour is seen in the specimens externally
charged with hydrogen for 150 hrs and 200 hrs. In the specimen charged with hydrogen for 250

125
hrs, the plastic zone size is comparatively larger than the grain size of the matrix and also the
largest among all the annealed specimen. It may be for this reason that the some cleavage
features were observed in this specimen at the fatigue threshold. This specimen also had
comparatively lower FCGRs and highest threshold among all the specimens in the annealed
material. The lack of significant difference in the fatigue crack growth morphology from the
fractographs, in terms of lack of IG facets in specimens with dissolved hydrogen, could be used
to explain the relative closeness of the near threshold FCGRs in specimens with and without
dissolved hydrogen in the annealed material. Though the fractographic evidence cannot be linked
directly to the observed near threshold FCGRs [81], a qualitative mechanistic explanation using
the cyclic plastic zone size effects calculated based on the fractographic observations can yield
much information about the crack tip triaxiality encountered at near threshold CGRs with or
without the influence of dissolved hydrogen. Noting the values of the cyclic plastic zone with or
without dissolved hydrogen, it is clear that the dissolved hydrogen has not caused significant
reduction of the cyclic plastic zone size which in turn is responsible for 1) the fatigue crack to
propagate further on the cleavage fracture plane and 2) to setup a steep stress gradient to diffuse
hydrogen from the matrix to the freshly created crack tip to continue this repetitive cyclic
damage process. This could be the reason, in addition to the fracture morphology, why the CGRs
are not greatly affected in the presence of dissolved hydrogen in the material. Though the change
in fracture morphology appears to be ΔK controlled, it does not throw light on the how the
fatigue threshold is reached. A two part fracture process[102]: one leading to formation of facets
(IG or TG) which is ΔK controlled and the second leading to the connection of these facets for
crack advance by tensile tearing which is Kmax controlled could be used to describe the
approaching of the fatigue threshold. Upon reaching the point of maximum transgranularity at

126
the ΔK ≈ 9 – 10 MPa√m, the influence of ΔK on facet formation is reduced and is reflected in
the fracture images (Figure 47). After this point, the Kmax component becomes more prominent
in maintaining the crack front until the ΔKth is approached. This is due to the fact that the crack
closure may or may not be operative at such low growth rates that the Kmin value might be
different than expected and hence affect the ΔK experienced at the crack tip. When the fatigue
threshold value was being approached, the effects of dissolved hydrogen were greatly reduced as
characterized by a rather featureless smooth fracture surface which is similar to the uncharged
sample. At this point, it is still unclear why such a phenomenon occurs and it remains to be seen
why this kind of behaviour occurs.

127
Table 13: Values of Monotonic and Cyclic Plastic Zone Size at corresponding SIFs where
Maximum Transgranular (TG) features (brittle or ductile) takes place with or without
dissolved hydrogen in Annealed Material at Near Threshold FCGRs
Hydrogen
Charging
Time
(hrs)
Crack
length
(mm)
ΔK
(MPa√m)
Kmax
(MPa√m)
Yield
Strength,
σys
(MPa)1*
Monotonic
Plastic
Zone Size
(μm)
Cyclic
Plastic
Zone
Size
(μm)
Grain
Size
(μm)2*
Fatigue
Threshold,
ΔKth
(MPa√m)
No
hydrogen
10.16 9.03 10.03 757 69 14 8 - 22 6.68
150 hrs 9.525 8.99 9.99 757 68 14 8 - 22 5.58
200 hrs 10.033 10.06 11.18 757 86 17 8 - 22 5.49
250 hrs 8.0645 12.43 13.81 757 131 26 8 - 22 7.85
1* - Yield strength based on tensile tests conducted in uncharged condition; 2* - grain size
calculation was done from the fractographs based on the approximate size of the transgranular
(TG) facets observed
Some macro photographs were taken in the threshold region and EDS analysis was performed
close to the fatigue threshold (crack arrest) region in order to check for the possibility of crack
closure effects. Since the fatigue test was conducted in the ambient atmosphere, the oxide
induced (corrosion deposit) type crack closure was thought to have the most influence on the
near threshold FCGRs and the resulting fatigue threshold. This was hypothesized due to
influence of environmental moisture surrounding the fatigue specimen which might have
resulted in oxide products by the reaction of freshly exposed crack surface and moisture which

128
might get wedged at the crack tip during the closing cycle of the fatigue test reducing the
effective SIF experienced at the crack tip. In addition, some oxide debris might have also formed
by plasticity induced crack closure due to fretting action between the crack tip surfaces owing to
the low strength material (σys = 757 MPa for this material) as reported elsewhere [81]. The macro
photos are shown in Figure 48. No evidence of any oxides formed during the near threshold
crack propagation was observed from the figure 48 in any samples in the annealed material.
Some fatigue striations due to the load decreasing procedure performed during the fatigue test
was observed in the sample with no hydrogen, but these were less prominent in the samples with
dissolved hydrogen. EDS analysis yielded similar results showing no corrosion deposits (oxides)
wedging between the crack tip very close to the fatigue threshold (at very low growth rate
region). This was an interesting finding contrasting the results found by Ritchie and others [81,
103-105] when these oxides formed by corrosion or fretting action were readily observed in low
strength steels (σys ≈ 600 MPa) in air and hydrogen gas environments especially in the near
threshold region at low R ratios. To add to this, the damage due to hydrogen environment was
also minimal in the lower strength materials. In fact, these oxides were used as evidence to
explain the larger fatigue threshold (ΔKth) value observed in air than in dry hydrogen or argon
environments [103-105]. Though all the samples (with or without hydrogen) were tested in ex-
situ condition, none of the samples were affected at very low FCGRs and very low ΔKs due to
the ambient moisture present. The absence of any corrosion debris proved that the crack tip
reaction between steel and water (in moisture) was minimal or not very significant to produce
more atomic hydrogen in addition to that present in the dissolved form in the matrix of the
material. As a consequence, the crack closure effect, though not measured experimentally using
force – displacement compliance technique, appears to have less influence on the near threshold

129
FCGRs and also on the ΔKth value. Hence, the fatigue crack propagation in the near threshold
region is believed to occur mainly through the cyclic crack tip plasticity mechanism in the
sample with no hydrogen charging and through the influence of hydrogen assisted cracking by
cleavage through the grain thereby reducing the crack tip plasticity in the samples with dissolved
hydrogen. Due to the low strength of the annealed material, the effect of dissolved hydrogen on
the crack propagation is diminished and the CGRs are almost comparable to the sample with no
hydrogen.

130
Figure 48: Macro photograph of the near threshold region to check for oxide products in
annealed material; (a) No hydrogen, (b) 150 hrs, (c) 200 hrs and (d) 250 hrs [Note: Crack
propagation from right to left in all images; Magnifications: (a) 25X, (b) - (d) 23X]
Austempered Batch - 1 (AB1) material
The Austempered Batch 1 (AB-1) material had a higher strength and toughness compared to the
annealed material. The AB1 material was severely embrittled during the near threshold fatigue
test. Figure 49 shows the effect of dissolved hydrogen on the fracture behaviour captured at each
specified ΔK. After a careful examination of the fracture images, a lot can be said about the
influence of hydrogen on near threshold fatigue behaviour in the AB1 material and how this can

131
be linked to the observed near threshold FCGRs and fatigue threshold. In the specimen with no
dissolved hydrogen of the AB1 material, the overall fatigue failure is mainly of transgranular
nature with no IG facets present at the low ΔK region. The maximum crystallographic type
transgranular features were seen at a SIF of about 12 MPa√m. After this ΔK, these transgranular
were reduced as the crack propagated into the near threshold region which is shown in Figure
49(b). Some banding which was seen in the microstructure contributed to cracking along these
bands (figure 49(b)) which may be responsible for faster FCGRs in the AB1 material in the
uncharged condition compared to the annealed material. This cracking along the banded
structure occurred even at very low SIF close to the fatigue threshold. At the fatigue threshold, a
TG facet was seen in figure 49(a) in the uncharged sample on a background of the fracture
surface with less features similar to the annealed material. Now, this TG facet may indicate
cyclic plastic damage occurring in the AB1 uncharged sample at the proximity just before the
crack approaches the fatigue threshold. A possible explanation could be that the crack tip
experiences sufficient stress gradient due to the higher strength of AB1 material, even at such
low loads at the vicinity of the fatigue threshold, to cause the crack to propagate through the
grain. Now that, transgranular cracking requires sufficient energy to occur in general, the smaller
plastic zone size of this material (due to high strength) may be responsible to provide the driving
force for the crack to advance through the grain to reach the low ΔKth value. In contrast with the
4140 annealed material, the AB1 samples with dissolved hydrogen was affected to a large extent
by the nature and high degree of IG fracture seen readily in the low CGR region in Figure 49.
The number of IG facets reaches a maximum at a SIF of about 12 MPa√m in all of the samples
with dissolved hydrogen increasing in number with the increase in the concentration of dissolved
hydrogen as shown in the figures 49(f), (i) and (l). A clear cut distinction was seen among these

132
images as a function of increasing external hydrogen charging time (or concentration of
dissolved hydrogen). This showed the effect of hydrogen on the fatigue behaviour at low ΔK
region in the AB1 material. As described earlier, though the degree of IG facets cannot be taken
as a direct link to the CGRs [102], the fracture morphology sheds light on the effects of external
factors such as dissolved hydrogen (in this case), ambient environment on the fatigue behaviour
in the near threshold region at each particular ΔK. Intergranular fracture has been considered as
the microstructurally sensitive crack path and also ΔK dependent in other studies [81]. This
aspect could be exploited in understanding the role how hydrogen affects the crack growth rate
and also what SIF by this mechanism. By referring to the obtained fatigue fracture images in
figure 49(f), (i) and (l), the crack growth occurs under ΔK control until about 12 MPa√m causing
intergranular fracture at the crack tip due to the presence of hydrogen. The acceleration of CGRs
are faster in this AB1 material as crack growth rate takes takes place in a banded micro structure
as explained in the microstructure section for this material. A metallograph of the AB1 material
is shown in Figure 50 with the banded structure visible along with the MnS inclusion visible as a
bright white feature in the lower left part of the picture. An EDS map in Figure 51 confirms the
presence of MnS on the banded feature present on the fracture surface similar to the one visible
in figure 49(i). In figure 49(i), the crack propagation occurs along this banded structure in a
transgranular fashion with the crack branching off on either side of the

133
Figure 49: Fatigue surface images of AB1 material in threshold region (ΔK (SIF) are in
MPa√m [Note: Crack propagation from right to left in all images; Magnification: 1000X]

134
Figure 50: Banded microstructure of the AB1 material with MnS inclusion (bright white
elongated feature at lower left section; Magnification: 500X)
Figure 51: EDS map of the banded feature from the fracture surface showing MnS
inclusions in AB1 material

135
of the banded structure providing an easy path for crack propagation even at low SIF particularly
in the samples with dissolved hydrogen. To understand the peak in IG facets at this SIF (≈ 12
MPa√m), a plastic zone size estimation was performed similar to the 4140 alloy in annealed
condition. These are listed in Table 14. Two important observations arise from the table 2: (a) the
yield strength effect resulting in a very small plastic zone size near the minimum grain size even
at a higher SIF (≈ 12 MPa√m) in the AB1 material compared to the annealed material (≈ 9 – 10
MPa√m), (b) the plastic zone size becomes equal to the minimum grain size of the material with
a minimal reduction in ΔK, except in the sample charged for 150 hrs, all other variables being
constant.
Table 14: Values of Monotonic and Cyclic Plastic Zone Size at corresponding SIFs where
Maximum Intergranular or Transgranular features (brittle or ductile) takes place with or
without dissolved hydrogen in AB1 Material at Near Threshold FCGRs
Hydrogen
Charging
Time
(hrs)
Crack
length
(mm)
ΔK
(MPa√m)
Kmax
(MPa√m)
Yield
Strength,
σys
(MPa)1*
Monotonic
Plastic
Zone Size
(μm)
Cyclic
Plastic
Zone
Size
(μm)
Grain
Size
(μm)2*
Fatigue
Threshold,
ΔKth
(MPa√m)
No
hydrogen
7.45 12.56 13.96 1369 41 8 8 - 22 5.54
150 hrs 6.1 13.28 14.76 1369 46 9 8 - 22 5.29
200 hrs 7.47 12.34 13.71 1369 39 8 8 - 22 4.17
250 hrs 7.45 12.31 13.68 1369 39 8 8 - 22 3.70

136
1* - Yield strength based on tensile tests conducted in uncharged condition; 2* - grain size
calculation was done from the fractographs based on the approximate size of the intergranular
(IG) facets observed
This is a strong indication of the effects of dissolved hydrogen in the material which upon
increasing the concentration in the AB1 material diffuses under a stress gradient at a faster rate
due to increased volume fraction of bainite in this material, accumulates at the grain boundary,
causes FCP to proceed via IG mode (microstructurally sensitive crack path) and thereby
increases the FCGRs at comparatively lower SIFs than the uncharged sample. The banded
microstructure also contributes to provide a less resistant path for crack propagation by confining
the crack plane almost along this band to a greater extent in the samples with dissolved hydrogen
at near threshold FCG region. The greatest difference in the CGRs between the charged and
uncharged samples occur also at the same ΔK ≈ 12 MPa√m and there after continues to decrease
marginally but is significant when the ΔKth is reached. The two part fracture process [102],
explained earlier in the discussion on the near threshold FCGRs in the annealed material, with
ΔK and Kmax control parameters was also applicable to this material. The ΔK control responsible
for formation of facets operated until about a SIF of 12 MPa√m and thereafter had less influence
on the FCP process, though some effects were seen even at the fatigue threshold in the sample
charged for 250 hours in the form of IG facets and also CGRs along the banded structure which
may have had MnS inclusions. The two implications of this behaviour were that: (a) it was
significantly different from the annealed material which was characterized by a rather smooth
featureless fracture surface at the fatigue threshold, and (b) there was a combined influence of
both ΔK (to a much less degree) and Kmax at the ΔKth. The influence of Kmax after ΔK ≈ 12
MPa√m were evident in the figure 49(b), (e), (h) and (k) characterized by the typical
transgranular morphology though the ΔK effects were experienced to a less degree by the sample
charged for 250 hrs in figure 49(k). The reduced but prevalent influence of ΔK effects almost

137
until the fatigue threshold might be construed as a reason why crack closure effects in the AB1
material could be expected to be minimal or negligible. It is seen that this is true in the AB1
material as documented in the figure 6. No corrosion products or oxides resulting from steel -
environment interactions were observed in any of the samples in AB1 material. It was therefore
concluded that the effect of crack closure on the effective SIF (ΔKeff = Kmax - Kcl) was almost
equal to the ΔK utilized in the testing. The experimental FCGRs showed a trend that followed
this complete mechanistic behaviour as explained above and the corresponding evidence in the
manner of fractographs and plastic zone size effects supported this argument. However, at the
fatigue threshold, the fracture behaviour was not one of the featureless transgranular type
observed in the annealed material. At the fatigue threshold SIFs obtained, a simple calculation of
monotonic plastic zone size yields a value much less than the grain size of the AB1 material in
the sample precharged for 200 and 250 hours. Though the maximum SIF (Kmax) is thought to be
responsible at ΔK < 12 MPa√m in facilitating the crack front to propagate by connection of
facets via tensile tearing which is evident at ΔK ≈ 9 MPa√m in Figure 49, the same cannot be
said when the fatigue threshold is approached. In this AB1 material, the ΔK is thought to
influence the facet formation at the threshold which appears in the Figure 49(j) in some
unspecified manner. To better understand this phenomenon, experiments involving mean stress
effects which is thought to affect adversely the fatigue behaviour in the near-threshold region
[81, 102, 106] might shed some new light on this behaviour.

138
Figure 52: Macro photograph of the near threshold region to check for oxide products in
AB1 material; (a) No hydrogen, (b) 150 hrs, (c) 200 hrs and (d) 250 hrs [Note: Crack
propagation from right to left in all images; Magnification: 25X]
Austempered Batch – 2 (AB2) material
The AB2 material shows a very different and distinct near threshold fatigue crack growth
behaviour than the annealed and AB1 material. At the start of the threshold region (da/dN ≈ 10-8
m/cycle), the FCGRs are greater than in the annealed material in the samples with dissolved
hydrogen but lesser than in the AB2 material. However at the near threshold region (da/dN ≈ 10-9
m/cycle), a transition occurs in the FCGRs in the AB2 material showing diminished influence

139
compared to the annealed material in the samples with dissolved hydrogen. Though this material
had the highest yield strength and was expected to be greatly affected in presence of dissolved
hydrogen especially in the low ΔK region, such typical behaviour was not seen in this material.
In the discussion on the fatigue behaviour at intermediate rates (da/dN ≈ 10-8
˜ 10-7
m/cycle), it
was seen that significant differences exist in the FCGRs of the annealed material and the AB2
material in samples with dissolved hydrogen until the crossover occurs at a ΔK ≈ 7 – 8 MPa√m
after which the fatigue crack in AB2 material propagates at much less velocity than the annealed
material regardless of the concentration of dissolved hydrogen present in the material. This
behaviour can be explained based on the observed fracture imaging work at the end of the
intermediate region and well until the fatigue threshold is reached. At the end of the intermediate
region, just before the low growth rate region (da/dN ≈ 10-8
m/cycle) starts, a peak in IG facets is
observed in the AB2 samples with dissolved hydrogen. This occurs at a comparatively high
stress intensity factor (ΔK ≈ 19 MPa√m) than in the annealed and as well as the AB1 material.
Figure 53 shows the extent of IG damage caused by dissolved hydrogen at increasing charging
duration (or increasing hydrogen concentration). The most damage in terms of IG cracking
occurs in the specimen charged with hydrogen for 200 hours and after that reduces marginally in
the specimen charged for 250 hours. This type of cracking behaviour accelerates the crack
growth rate whereby hydrogen present in the material concentrates at the crack tip due to intense
cyclic loading stress gradients and causes decohesion along the grain boundaries leading to crack
propagation with this dissolved hydrogen migrating again to the crack tip setting up the repetitive
damage cycle. In the threshold region FCGRs of AB2 material at about da/dN ≈ 10-8
m/cycle, the
above mentioned trend was noted. Increasing the dissolved hydrogen concentration up until a
charging time of 200 hrs increased the near threshold FCGRs, but at a charging time of 250 hrs

140
the FCGRs had a slight reduction at comparable stress intensities. The fractographic evidence
supports this finding with a marginally reduction in brittle crack morphology in terms of IG
facets as seen in the figure 53(c).
Figure 53: Fractographs of AB1 material showing the peak in IG facets at the start of the
near threshold region; ΔK ≈ 19 MPa√m [Note: Crack propagation from right to left in all
images; Magnification: 1000 X]
In addition to this, the FCP behaviour in the threshold region is believed to occur in plane strain
conditions regardless of the specimen thickness as long as the linear elastic conditions exist at
the crack tip [106]. A lack of the appearance of shear lips at the end of the specimen thickness is
a manifestation of plane strain conditions and therefore indicates the FCP in the low growth rate
region (or threshold region). On the other hand, the longer the length of the shear lip appearing
on the low magnification fracture images the later will be the commencement of the threshold
region (or the faster will be the CGRs) or the end of the fast CGR intermediate – linear
behaviour. A low magnification image showing crack propagation plane at the start of the
threshold region fatigue test of the sample charged for 200 hrs is shown in Figure 54 illustrating
the appearance of shear lips starting from the crack notch. This observation was taken as

141
evidence to show the higher CGRs in the AB2 material in all the samples containing dissolved
hydrogen in the mid growth rate region (transition region - da/dN ≈ 10-8
˜ 10-7
m/cycle) until the
start of threshold region. In addition, the length of the shear lip were noted in all of the
precharged samples in an effort to correlate to the observed CGRs. These are recorded in Table
15.
Figure 54: Crack propagation plane in AB2 material of the sample charged with hydrogen
for 200 hrs showing the appearance of shear lips near the crack starter notch
(Magnification: 27X)
The effect of increasing dissolved hydrogen concentration was seen to increase the intermediate
FCGRs until a certain limit (200 hrs of precharging time – 3.6 ppm) and after that limit the
fatigue damage effects were less pronounced from the shear lip data (table 15). The same
behaviour was explained earlier in the fractographs taken at the SIF where the peak in IG facets

142
takes place which was also reflected in the threshold FCGRs of the AB2 material. In addition,
the appearance of shear lip at the beginning of the threshold region in the AB2 samples, which
was not readily observed in the other two batches namely annealed and AB1 samples, shows
why the FCGRs are higher in AB2 until the transition region than the annealed samples. In a
similar fashion, the peak in IG facets at the higher ΔK elaborates how faster FCGRs are
encountered in the AB2 material at mid crack growth rates and thereafter decreases quite
significantly than the annealed material due to crack propagation via microstructure sensitive
crack path.
Table 15: Length of shear lip observed in the transition region (end of intermediate – start
of threshold region) in the AB2 material
Hydrogen
Charging
Time
(hrs)
Observed
length of
shear lip
(mm)
Approximate
ΔK at the end
of the shear
lip (MPa√m)
Approximate
da/dN at the
end of the shear
lip (m/cycle)
150 hrs 4.26 18.5 - 19.0 1.1 - 1.3x10⁻⁷
200 hrs 6.536 15.5 8.3-8.5x10⁻⁸
250 hrs 4.288 18.5 - 19.0 1.0 - 1.1x10⁻⁷
At a ΔK < 19 MPa√m, the degree of IG facets decreases in the samples charged with dissolved
hydrogen the crack propagates into the threshold region and so does the influence of dissolved
hydrogen. At very low SIFs (9-7 MPa√m), the fracture images show a rather different
morphology than the other two batches of steel specimens (figure 55(c), (f), (i) and (l)). The

143
uncharged specimen shows a featureless surface as seen in the annealed material whereas the
samples precharged with hydrogen show minimal TG or IG features, unlike the AB1 material,
except in the case of sample charged for 200 hrs in which some intergranularity was visible
(figure 55(i)). For this sample, at ΔK ≈ 9-7 MPa√m was the region where marginally high near
threshold FCGRs were observed and thereafter was reduced by a small extent. As the SIF was
stepped down to about 6 MPa√m, some transgranularity was evident in all the specimens of AB2
material (figure 55 (b), (e), (h) and (k)). The uncharged specimen switched from a featureless to
more crystallographic failure type having some ductile features with some cracking along MnS
stringers while the precharged specimens transitioned from a ductile – brittle fracture surface to a
flat fracture surface with brittle features with MnS stringers and finally to one resembling the
uncharged specimen but with some oxide like spots as the dissolved hydrogen concentration was
increased. An EDS spectrum on a similar feature in the 250 hours charged specimen revealed the
presence of iron oxide as is shown in figure 56. Though some oxides were found close at the
threshold region, these oxides were only observed in very few random locations to be of concern
to cause any significant contribution to the effective SIF experienced at the crack tip even at the
low ΔK values. There was good reasoning to believe this claim because the AB2 material had a
very high strength among all the three batches of steel specimens tested which means that it had
the smallest cyclic plastic zone size at comparable near threshold stress intensities. To add to this
effect, the AB2 material approached the fatigue threshold at moderately higher SIFs (6 – 7
MPa√m) than the other two batches of steel samples. Therefore, a greater load was felt between
the crack tip surfaces in which case oxide wedging does not appear to be a major factor in the
diminishing the effect of the applied SIF. Vasudeven et. al [107] have also commented, in the
review on crack closure and fatigue threshold, that the crack closure contribution arising from

144
oxide formation via fretting action and these oxide asperities wedging at the crack tip are random
processes whose influence is very less on the effective SIFs at the crack tip. A plastic zone size
analysis was also carried out like in the other two batches of samples to see how the high yield
strength played a role in the crack propagation in the very low da/dN region especially in
presence of dissolved hydrogen which is listed in Table 16.

145
Figure 55: Fatigue surface images of AB2 material (ΔK (SIF) are in MPa√m)
[Note: Crack propagation from right to left in all images; Magnification: 1000X]

146
Figure 56: SEM image (Magnification: 1500X) and EDS spectrum of Iron Oxide found in
the threshold region of the AB2 sample charged with hydrogen for 250 hrs
Table 16: Values of Monotonic and Cyclic Plastic Zone Size at corresponding SIFs where
Maximum Intergranular or Transgranular features (brittle or ductile) takes place with or
without dissolved hydrogen in AB2 Material at Near Threshold FCGRs
Hydrogen
Charging
Time
(hrs)
Crack
length
(mm)
ΔK
(MPa√m)
Kmax
(MPa√m)
Yield
Strength,
σys (Mpa)
Monotonic
Plastic
Zone Size
(μm)
Cyclic
Plastic
Zone
Size
(μm)
Grain
Size
(μm)
Fatigue
Threshold,
ΔKth
(MPa√m)
No
hydrogen
- - - - - - - 8.12
150 3.937 19.94 22.16 1481 88 18 8 - 22 6.59
200 3.937 19.96 22.18 1481 88 18 8 - 22 6.17
250 3.937 19.93 22.14 1481 88 18 8- 22 6.01

147
The AB2 material had the largest plastic zone size inspite of its very high strength based on the
SIF where maximum IG features were observed or until the point where the degradation due to
dissolved hydrogen on the FCP was the greatest. The occurrence of IG maxima at high SIF can
be attributed to this behaviour. The change in plastic zone size with increase in dissolved
hydrogen concentration was not seen in the AB2 material unlike the other two batches. After the
point of IG maxima, the reduced influence of dissolved hydrogen was reflected in the observed
FCGRs as well as the fatigue crack growth morphologies (figure 55). The lack of yield strength
effect resulting in smaller cyclic plastic zone size leading to faster FCGRs in the AB2 material is
quite interesting. The AB2 material had a higher volume fraction of martensite from the volume
fraction analysis explained earlier and also much less banded structure than the AB1 material as
shown in the figure 10. The relative diffusion coefficient of hydrogen in martensite was lesser
than the bainite phase [76]. At sufficiently high SIF (>= 19 MPa√m), there is enough stress
gradient to provide the crack driving force for crack propagation. When hydrogen is present, the
high stress gradient provides the necessary concentration gradient through minor differences in
diffusivities in each phase to maintain FCP by crack advance through prior austenite grain
boundaries. As the crack propagates into lower SIF region (<= 19 MPa√m), the stress gradient is
not strong enough to provide the concentration gradient to diffuse hydrogen fast enough ahead of
the crack tip to cause grain boundary cracking. Hence, the CGR reduce quite fast after a SIF of
about 19 MPa√m. More volume fraction of martensite cause irreversible hydrogen trapping
which have high binding energy to remove hydrogen from one trap and move ahead to next trap
in the vicinity of the crack tip. A possible location would be an inclusion such as MnS. Very
large number of repetitive loading cycles (a characteristic of near threshold region) is needed to
cause crack propagation via an inclusion pullout in the wake of reduced influence of hydrogen,

148
even when present in higher concentration in the AB2 material. Hence, the relatively higher
fatigue threshold and lower CGRs are seen in the AB2 material.
Figure 57: Microstructure of the AB2 material showing uniformly dispersed martensite
and bainite phases with MnS stringers (white streak); Magnification: 500X

149
Mechanistic explanation of Linear Region Fatigue Crack Growth Rates
Annealed material
In the annealed material, the high ΔK linear region shows a very different fracture morphology
than the threshold region in both the charged and uncharged specimens (Figure 57). In the
uncharged specimen, the fatigue surface was characterized by a rough ductile surface with some
cellular fracture at a ΔK ≈ 47 MPa√m (figure 57a). As the SIF increased, the fracture behaviour
changed to ductile tearing with pit like crack initiation sites, possibly due to inclusions as seen in
the Figure 57b. The morphology became rougher due to crack propagation through multiple
adjacent crystallographic planes in the annealed material resulting in crack branching at some
localized regions (Figure 57b). No striations like growth patterns could be distinctly
characterized to link the fracture behaviour to the observed CGRs. At the failure region in figure
57c, the failure occurred via a predominantly ductile mode characterized by dimples and some
TG like facets. Upon charging with dissolved hydrogen, the crack propagation in the fast crack
propagation region changed to a more flat like appearance dotted with brittle like features. On
increasing the hydrogen charging time, the crack plane is confined to a single plane to a greater
extent until 200 hours (Figure 57d, g) and thereafter at 250 hours has a mixed mode behaviour
with a fragmented surface (Figure 57j) mimicking that of the uncharged specimen but also with
some brittle feature like the sample charged for 150 hours. This indicates the decrease in the
influence of dissolved hydrogen after reaching a certain concentration of about 1.5 ppm (at 200
hours) in this case. This behaviour is clearly reflected in the linear region FCGRs in the annealed
material for 250 hrs. At a point close to ΔK ≈ 45 MPa√m in the sample precharged for 250
hours, there is shift in the FCGRs line to lower crack growth rates than the other two samples.
Even after this point, some damage due to dissolved hydrogen was evident at a high ΔK of about

150
65 MPa√m in figure 11k in the form of transgranular features. It was explained earlier that the
hydrogen effect at a high ΔK region is not so significant compared to the mechanical damage
due to cyclic plasticity [2] at the vicinity of the crack tip which seems to be the case until this
point (ΔK ≈ 65 MPa√m). However, this fracture behavior of shearing through some of the grains
in the steel matrix at this high CGR region shows some influence of dissolved hydrogen in the
annealed material. Some microstructural influence was believed to cause such a behavior. From
prior investigations [108-109], the permeability of hydrogen was higher in pearlite compared to
bainitic structures which was found in the other two austempered steels (with varying volume
fraction of tempered martensite) used in this investigation. Hence, at this higher concentration of
2.9 ppm (charging time of 250 hours) in the annealed material, the migration of dissolved
hydrogen was fast enough to keep pace with the fast moving crack front (the high stress intensity
might have also played a role in increased stress assisted diffusion of hydrogen from the
surrounding matrix to the crack tip). When this fast crack front with the ability to concentrate
hydrogen at fast rates due to the microstructure met a grain boundary, the very high load
experienced at the crack tip was sufficient enough to plastically tear through the grain in a
localized fashion with the hydrogen playing its role to aid in the cleaving process. This might
have given rise to the localized TG facets observed at these crack growth rates. As a
consequence of this process, though the linear CGRs in the 250 hours charged specimen dips to a
value less than the other two charging conditions (150 and 200 hours) at ΔK ≈ 45 MPa√m, the
CGRs are high enough at high SIFs than the uncharged specimen until the point of fracture. This
is reflected in table 17 in the comparison of C and m values of the Paris constants.

151
Figure 57: Fatigue surface images of annealed material in linear region (ΔK (SIF) are in
MPa√m) [Note: Crack propagation from right to left in all images; Magnification: 600X:
(k) and 1000 X: rest of the images]

152
Table 17: Paris constants (C and m) in the annealed material at different hydrogen
charging conditions
Charging time
(hrs)
C m
No hydrogen 1*10-10
2.08
150 1*10-11
2.25
200 4*10-11
2.45
250 9*10-11
2.16
Austempered Batch – 1 (AB1) material
The AB – 1 material with its banded structure had a higher rate of crack propagation at all
charging conditions as was seen in the linear region results earlier. The fractographic evidence
gathered was able to elucidate this behavior as shown in Figure 58. The uncharged specimen
shows a ductile type fracture surface populated with micro void coalescence (MVC) on a heavily
fragmented background at a SIF of 46 MPa√m (Figure 58a). The linear region fatigue crack
propagation in AB1 material was mediated by cracking along the banded structure with some
matrix separation occurring from the MnS inclusions lying along the banding lines. However,
from the metallographic studies conducted, it was unclear whether these features i.e., the peak
and the valley in the band belonged to a purely bainitic or purely martensitic phase or a
combination of the two. On the other hand, since the relative amount of each of this phase in the
material was known, some useful observations can be drawn correlating the FCGRs to the
fracture images. As the SIF increased in the uncharged specimen to 60 MPa√m, the fracture

153
behavior showed reduction in micro voids and the crack propagation across multiple planes
leading to plastic tearing as seen in the middle of figure 58b. The crack front progressed to
failure with extensive plastic tearing across adjacent bands dotted with micro voids with a flatter
ductile background (figure 58c). Evidence pointing to crack propagation across multiple planes
at all SIFs, which was not seen in the uncharged annealed material, in the high ΔK region
suggested that the crack propagation rate increased as the cyclic crack front proceeded to failure.
The higher yield strength lead to greater cyclic plasticity experienced at the crack tip for fast
crack propagation. As the dissolved hydrogen concentration was increased, a mixed mode
characterized by flat featureless surface with ductile + brittle like features scattered through the
fracture surface with a few TG facets (even at this high ΔK region) at 150 hours charging time, a
predominantly brittle surface at 200 hrs and showing diminished influence at 250 hrs at SIF of 46
MPa√m. Upon further crack progression, at 60 MPa√m, the CGRs were faster due to increased
brittle failure modes at 150 hours and 200 hours which showed some TG facets and transgranular
cleavage. In contrast, the 250 hours charged specimen showed less influence due to the increased
hydrogen concentration with the fracture morphology lying in between the mostly ductile
uncharged specimen and having some brittle morphology like the sample charged for 200 hours.
The micro voids reappeared at certain regions within the 250 hours charges specimen which
were not present, for most part, in the 200 hours charged specimen with flat surface showing the
brittle nature, occurring as the crack progressed, as was noted earlier in the latter specimen. In
short, the effect of causing brittle fatigue failure from dissolved hydrogen while still in effect,
was lessened to a certain degree than the specimen with lower concentration of dissolved
hydrogen. As a consequence, this also suggested that there may be a threshold concentration of
dissolved hydrogen in the steel matrix over which the embrittlement effects were minimal or

154
caused no addition acceleration of CGRs. The common denominator in the charged specimens
were that the crack propagated across multiple planes with crack branching and/or having
multiple crack origins but all leading to the fracture at inclusion sites. The cyclic plasticity
effects in causing FCP were superimposed with that of the underlying banding structure and the
inclusion sites (possibly elongated along these banding lines) either leading to grain pullouts
from within multiple planes of the steel matrix or separation of the two mating crack planes
around the inclusion boundaries. The resultant of these superimposed effects were the micro
voids, usually left in the wake of the crack tip, indicating where the crack would propagate
without a banded structure and inclusions sites by ductile failure mode and the flat surface (or the
brittle features), lying at the point (or slightly ahead) of the crack tip, showing the brittle
characteristics due to presence of inclusions. Aiding in the grain pullout or decohesion across the
inclusion boundary or at certain areas at the grain boundary was the dissolved hydrogen present
in the matrix. This hydrogen atom trapped irreversibly at the inclusion or void sites [40 – 44] and
does not readily diffuse under cyclic stress fields because of high binding energies in releasing
the atom from the trapped site. The inherent microstructure of bainite (higher volume fraction in
AB1 material) and tempered martensite (lower volume fraction in the AB1 material) plays a key
role in the diffusion process. The higher volume fraction bainite aids in faster diffusion of
dissolved hydrogen (diffusible or reversibly) trapped, accentuated more by very steep stress
gradients in the high ΔK region, in the neighboring tempered martensite which has good trapping
efficiency due to its large dislocation density [42]. In general, though the diffusion rates are not
able to keep up with the fast CGRs in the linear region [79, 80] showing less damage to the steel
matrix, when the crack front approaches an inclusion site in its crack path or in the vicinity
(several adjacent planes parallel to the crack path) the high load in the linear region causes

155
plastic damage by tearing at an inclusion site. The reason being the difference in strength of the
steel matrix and the inclusion itself which provides a path of least resistance for crack rupture.
The localized hydrogen trapped at these sites get released by the grain pullout or inclusion
separation from the matrix and thereby ease the crack propagation further by causing localized
transgranular (TG) or cleavage thru the adjacent grains leading to brittle mode failure. Since the
bainite phase has a higher volume fraction in the material, the probability of bainitic phase
boundary occurring adjacent to the inclusion site is quite high. That being the case, the diffusion
effects of bainitic phase was believed to transport hydrogen from the adjacent matrix locally to
crack tip vicinity: firstly due to localized concentration differences via diffusion and secondly
promoting the diffusion to increased rates due to stress assisted effects. This leads to fast crack
propagation via brittle mode fracture ahead of the inclusion area. This mechanism is seen to be
valid from the fractographs in figure 58. Hence, the m values were seen to increase with respect
to increase in the charging time in the AB1 material as displayed in Table 18.
Table 18: Paris constants (C and m) in the AB1 material at different hydrogen charging
conditions
Charging time
(hrs)
C m
No hydrogen 5*10-11
3.45
150 2*10-12
3.53
200 7*10-13
3.86
250 9*10-13
3.72

156
Figure 58: Fatigue surface images of AB1 material in linear region (ΔK (SIF) are in
MPa√m) [Note: Crack propagation from right to left in all images; Magnification: 1000X]

157
Austempered Batch – 2 (AB2) material
The AB2 material had a distinct behaviour in regard to the effect of dissolved hydrogen
especially in the linear fast crack growth region. The microstructure was similar to be AB1
material varying only in the relative volume fraction of tempered martensite and bainite. Due to
the lower austempering temperature, a higher fraction of tempered martensite to bainite ratio
exists in this steel. The fracture morphology of the AB2 material at charged and uncharged
conditions have been outlined in the figure 59. The uncharged specimen at SIF of 46 MPa√m
shows a fragmented fracture surface (figure 59a), with much flat background than the AB1
material, with grain pullouts from inclusion spots. The fragmentation of the fracture surface
appears to show a much brittle nature of the alloy in the AB2 condition. However, if the brittle
surface is to be an artifact of the higher strength in this alloy which might point towards faster
FCGRs in the linear region than the AB1 material, we would expect this material to show more
brittle like features in the fracture images as the crack advances ahead raising the crack tip SIF.
On the contrary, upon comparing the fracture images in figure 59a and 59b, we see that this is
not the case. Even a high SIF of 60 MPa√m in figure 59b, it shows a similarity to the behaviour
at 46 MPa√m. This suggests that the crack growth rate doesn’t increase drastically or change
significantly with drastic increase in the SIF as was observed in the other two steels particularly
in the high ΔK region. This might be an indication that there is cyclic stability taking place [16],
to some degree, in the AB2 material. Though some degree of cyclic plastic deformation takes
place as the crack advances under the influence of high SIF in the linear region, it was observed
that the crack growth was slowed to some extent as the crack progressed to failure. In the
samples charged with hydrogen, the fracture behaviour showed some damage in the form of
brittle features which were not seen in the uncharged specimens. As the SIF increased from 46 to

158
60 MPa√m, at all the three charging conditions, there were brittle features observed in the
specimens (figures 59 (d), (e), (g), (h), (j) and (k)) with no significant changes with the increase
in SIF. Significant damage from crack nucleation from inclusions were observed extensively in
all of these specimens. A similar mechanism as explained for the AB1 material was thought to be
valid for the AB2 material. Some isolated intergranular (IG) facets were seen in all the charged
specimens at 45 and 60 MPa√m but for the one charged for 250 hours at 60 MPa√m (figure
59(k)). It was believed that the higher concentration of dissolved hydrogen, for the same
charging time in comparison with the other two batches of steel, due to higher volume fraction of
tempered martensite and the influence of inclusions (explained in the AB1 material) were
responsible for the appearance of isolated IG facets in this material. The high dislocation density
of tempered martensite with its relatively higher hardness might have caused this localized
failure. On the brighter side, the appearance of IG facets only at locations where the crack front
encountered inclusions suggested that the fatigue crack growth resistance of this AB2 material
can be improvised just by reducing the inclusion volume fraction in the matrix. It is still fully
unclear as to why the m values reduce in the samples charged with dissolved hydrogen as listed
in Table 19.

159
Table 19: Paris constants (C and m) in the AB2 material at different hydrogen charging
conditions
Charging time
(hrs)
C m
No hydrogen 5*10-11
2.14
150 1*10-09
1.54
200 2*10-09
1.39
250 2*10-09
1.33

160
Figure 59: Fatigue surface images of AB2 material in linear region (ΔK (SIF) are in
MPa√m) [Note: Crack propagation from right to left in all images; Magnification: (c) –
500X, all other images – 1000X]

161
CHAPTER 6 - CONCLUSIONS
1. The test results show that the dissolved hydrogen content increases with the exposure time in
both annealed and austempered materials, but to a greater extent in the austempered (AB2)
samples which may be due to marginally higher volume fraction of tempered martensite to
bainite ratio.
2. In the annealed material:
a. The linear region FCGRs are accelerated in presence of hydrogen compared to the
specimens with no hydrogen precharging. The linear region FCGRs are increased with
increasing hydrogen concentration until about 1.5 ppm concentration above which there is
little effect of hydrogen. The fractographs show increasing brittle features with crack
branching with the increase in hydrogen concentration.
b. The near threshold FCGRs are also accelerated and the fatigue thresholds decrease with
increasing hydrogen concentration upto 200 hrs of charging time. This again indicates that
above 1.5 ppm of hydrogen in the material it may be beneficial in the material. The
fractographs show signs of quasi cleavage fracture on increasing the dissolved hydrogen
concentration.
c. An interesting phenomenon was observed in the case of annealed specimens charged with
hydrogen for 250 hrs. The fatigue threshold stress intensity (ΔKth) was found to be higher
in the 250 hrs charged specimens than the uncharged specimens. There appears to be a
threshold value of hydrogen concentration of 1.5 ppm in the annealed material above
which the degradation effects of hydrogen diminishes and is found to be beneficial in the
material. Further investigation is necessary to resolve this issue.

162
3. In the austempered (AB1) material:
a. On increasing the dissolved hydrogen concentration in the AB1 material, the linear
FCGRs are greatly affected and increases with the hydrogen charging time. The 250 hrs
charged specimen had a lower FCGR than the 200 hrs charged specimen. However, the
charged FCGRs at all times were significantly higher than the uncharged specimen. The
fractographs showed signs of embrittlement with brittle like features on the fracture
surface.
b. The near threshold FCGRs are increased and the fatigue thresholds are decreased in the
AB1 material upon increasing the dissolved hydrogen concentration and to a greater
extent than the annealed material. The ΔKth at all charged conditions is lower than the
uncharged condition. The higher strength might be responsible for this behaviour. The
embrittlement effects are much severe in the threshold condition as indicated by the highly
faceted fracture surface.
4. In the austempered (AB2) material:
a. The linear region FCGRs are affected by the influence of dissolved hydrogen. Faster the
FCGRs on increasing the dissolved hydrogen concentration. However, the linear FCGRs
converge to a single point unlike the annealed and AB1 material showing minimal
influence of hydrogen as the SIF increases. The fractographs indicate an increasing degree
of IG facets with increased charging time except for the 250 hrs which changes to mixed
mode type of failure.
b. The near threshold FCGRs are much faster with the dissolved hydrogen specimens than
the uncharged specimens. However, the change in FCGRs upon increasing the hydrogen
concentration is not very prominent except for suppression of fatigue thresholds. The

163
fracture surface shows severe embrittlement in the hydrogen charged specimens The 250
hrs specimens had a flat brittle like appearance with IG and TG facets.
c. The AB2 material had the highest fatigue threshold with dissolved hydrogen at 250 hrs
charging time in the matrix among the three batches of specimens tested. It was much
higher than the fatigue threshold of uncharged annealed and AB1 materials.
d. The near threshold fatigue crack growth rate of austempered (AB1) specimens is
significantly higher in presence of dissolved hydrogen than the annealed specimens and
the fatigue threshold stress intensity (ΔKth) decreases with increased dissolved hydrogen
content. However, the near threshold FCGRs of AB2 are less than the annealed samples
and is only higher in the transition region (da/dN between 10-9 to 10-7 m/cycle).
e. The fatigue crack growth rate in the linear region is also found to accelerate as a function
of increasing dissolved hydrogen concentration for annealed as well as austempered AB1
materials whereas it has a diminished effect on the austempered AB2 samples.
f. Higher the austempering temperature lower is the effect of hydrogen on the fatigue crack
growth behaviour and fatigue threshold. Hence, the austempered (AB2) samples are found
to possess the best strength and fatigue resistance to hydrogen even with very high
concentration of dissolved hydrogen in the material.
This is a promising initial finding that AISI 4140 austempered at 332°C could be explored as
a good candidate for hydrogen bearing environments to serve possibly in wide variety of
applications for the upcoming Hydrogen Economy.

164
CHAPTER 7 – FUTURE WORK
Some of the aspects that could be explored further based on the current work are to check the
influence of dissolved hydrogen on the tensile and fracture toughness properties in the annealed
and austempered conditions. In order to gain a better insight on the near threshold fatigue crack
growth behaviour in presence of dissolved hydrogen, it is also important to check the effect of
load ratio and cycling frequency in annealed as well as austempered conditions. Austempering at
various other temperatures than the ones used in this study would be very helpful to understand
the influence of austempering temperature on the fatigue behaviour of 4140. It was our initial
understanding that a small variation in the volume fraction of inclusions in the steel could lead to
drastic changes in the fatigue behaviour of the alloy as observed in the austempered batch – 1
material. Hence, a study needs to be conducted to know the effect of impurity levels of the steel
on the fatigue behaviour possibly at the same austempering temperatures utilized in this work. A
statistical analysis could be worked to check the number of samples required to obtain a
reasonable estimate of the fatigue threshold and the paris law constants and also to know the
tolerance levels of the variation in fatigue threshold and the paris law constants. An in-situ study
mimicking this work would be beneficial to assess how the austempered materials perform under
continuous exposure to hydrogen environments. As a final note, some theoretical considerations
should be looked into to develop equation based models to correlate the experimental fatigue
behaviour which may help refine the fatigue behaviour, especially of austempered materials, in
presence of hydrogen bearing environments.

165
REFERENCES
1. P.C. Paris, F. Erdogan, A critical analysis of crack propagation laws, Journal of Basic
Engineering, Volume 85, pp 528-534, (1963).
2. P. Fassina, F. Brunella, L. Lazzari, G. Re, L. Vergani, A. Sciuccati, Fatigue Behavior Of
Pipeline Steel Under Hydrogen Environment And Low Temperature, Procedia Engineering,
Volume 10, pp 3345-3352, (2011).
3. K. Banerjee, U.K. Chatterjee, Effect of microstructure on hydrogen embrittlement of weld-
simulated HSLA-80 and HSLA-100 steels, Metallurgical and Materials Transactions A,
Volume 34A, pp 1297-1309, (2003).
4. S.K. Putatunda, V. Venugopal, Influence of Overload Plastic Zone Size on Stress Corrosion
Crack Growth Behaviour of a Low Alloy Steel in 3.0% NaCl Solution, Journal of Testing
and Evaluation, Volume 18 (3), pp 182-190, (1990).
5. S. Suresh, Fatigue of Materials, 2nd
Edition, University Press, Cambridge, (1998).
6. A.R. Troiano, The role of hydrogen and other interstitials in the mechanical behaviour of
metals, Transactions of ASM, Volume 52, pp 54-80, (1960).
7. J.G. Morlet, H.A. Johnson and A.R. Troiano, A new concept of hydrogen embrittlement in
steel, Journal of Iron and Steel Institute, Volume 189, p 37, (1958).
8. W. Beck, E.J. Jankowsky, and P. Fisher, Hydrogen Stress Cracking of High Strength Steels,
NADC-MA-7140, Naval Air Development Center, Pennsylvania, (1971).
9. G. Sandoz, Stress Corrosion Cracking of high Strength Steels, NRL, Washington, D.C.,
(1972)
10. O.E. Wheller, Spectrum Loading and Crack Growth, journal of Basic Engineering, ASME,
Volume 94 (1972), pp. 181-186.

166
11. S.E. Gurevich : Proceedings of 3rd International Conference on Mechanical Behavior of
Materials , Cambridge, England , (August 20-24, 1979), p.457
12. D.A. Jones, Principles and prevention of corrosion. , Macmillan, New York (1992) (p. 234–
89; 333–55).
13. S.P. Lynch, Failures of structures and components by environmentally assisted cracking.
Eng. Failure Analysis Volume 1(2), pp. 77–90, (1994).
14. C.L. Briant and S.K. Banerji, Intergranular failure in steel: the role of grain-boundary
composition. International Materials Reviews, Volume 23(4), pp. 164–199, (1978).
15. C.L. Briant and S.K. Banerji, Intergranular fracture in ferrous alloys in nonaggressive
environments. In: C.L. Briant and S.K. Banerji, Editors, Treatise on materials science and
technology, vol. 25, Academic Press, New York (1983), pp. 21–58.
16. Hertzberg RW. Deformation and fracture mechanics of engineering materials. 4th ed. New
York: John Wiley & Sons, 1996. p. 460–4; 485–520.
17. H.G. Nelson, Hydrogen Embrittlement, Treatise on Materials Science and Technology,
Embrittlement of Engineering Alloys, Volume 25, pp 275-359, (Editors: C.L. Briant, S.K.
Banerji), Academic Press, New York, (1983).
18. J.K. Tien, A.W. Thompson, I.M. Bernstein and R.J. Richards, Hydrogen transport by
dislocations, Metallurgical Transactions A, Volume 7A(6), pp. 821–829, (1976).
19. A.N. Stroh, A theory of the fracture of metals. Adv. Phys. 6(24), pp. 418–465, (1957).
20. H.H. Johnson and P.C. Paris: Journal of Engineering Fracture Mechanics., Volume 1,
(1968) p.3
21. W.J. Mills and R.W.Hertzberg: Engineering Fracture Mechanics., 7, (1975) p.705
22. H.R. Smith, B.E. Piper and F.K. Downey: Engineering Fracture Mechanics 1,( 1968) p.123

167
23. C.D. Beachem, A new model for hydrogen assisted cracking (Hydrogen “Embrittlement”),
Metallurugical Transactions, Volume 3, pp 437-451, (1972).
24. D.S. Shih, I.M. Robertson and H.K. Birnbaum, Hydrogen embrittlement of alpha titanium:
in situ TEM studies. Acta Metallurgica Volume 36(1), pp. 111–124, (1988).
25. H.K. Birnbaum, Mechanisms of hydrogen related fracture of metals. In: N.R. Moody and
A.W. Thompson, Editors, Proceedings of the Fourth International Conference on the Effect
of Hydrogen on the Behavior of Materials, Warrendale: TMS, Wyoming, 1990 (1989), pp.
639–660.
26. M. Beghini, G. Benamati and L. Bertini, Hydrogen embrittlement characterization by disk
pressure tests: test analysis and application to high chromium martensitic steels. J. Eng.
Mater. Technol. 118 2 (1996), pp. 179–185.
27. P. Jung, Compositional variation of hydrogen permeability in ferritic alloys and steels. J.
Nucl. Mater. 238 2-3 (1996), pp. 189–197.
28. R. Padmanabham and W.E. Wood, Corrosion NACE 41, (1985), p.12.
29. H.H. Johnson, Hydrogen gas embrittlement, Hydrogen in Metals, ASM International,
Metals Park, OH, pp 35-49, (1974).
30. A.W. Thomson, I.M. Bernstein, Microstructure and hydrogen embrittlement, Hydrogen
effects in metals, Metallurgical Society of AIME, New York, pp 291-308, (1981).
31. I.M. Bernstein, A. W. Thomson, Effect of metallurgical variables on environmental fracture
of steels, International Materials Reviews, Volume 21, pp 269-287, (1976).
32. P. Sofronis, Mechanics of hydrogen embrittlement, Ph.D. Thesis, Univeristy of Illinois -
Urbana-Champaign, (1987),
http://www.osti.gov/energycitations/product.biblio.jsp?osti_id=6408952.

168
33. H. C. Rogers, Hydrogen Embrittlement of Metals, Science, Volume 159 (3819), pp1057-
1064, (1968).
34. R.K. Dayal, N. Parvathavarthini, Hydrogen embrittlement in power plant steels, Sadhana,
Volume 28, Parts 3 & 4, pp 431–451, (2003).
35. H.K. Birmbaum, Mechanisms of hydrogen related fracture of metals, Technical Report,
Office of Naval Research, Contract No. USN – 00014 – 83 – K – 0468, (1989),
http://www.dtic.mil/dtic/tr/fulltext/u2/a208210.pdf
36. R.A. Oriani, Hydrogen embrittlement of steels, Annual Reviews of Materials Science,
Volume 8, pp 327-357, (1978).
37. C.A. Zapffe, C.E. Sims, Hydrogen embrittlement, internal stress and defects in steels,
Transactions of Metal Society of AIME, Volume 145, pp 225-261, (1941).
38. N.J. Petch, The lowering of fracture-stress due to surface adsorption, Philosophical
Magazine, Volume 1, pp 331-337, (1956).
39. N.J. Petch, P. Stables, Delayed fracture of metals under static load, Nature, Volume 169, pp
842-843, (1952).
40. A.H.M. Krom, A. Bakker, Hydrogen trapping models in steel, Metallurgical and Materials
Transactions B, Volume 31(6), pp 1475-1482, (2000).
41. T. Michler, J. Naumann, Microstructural aspects upon hydrogen environment embrittlement
of various bcc steels, International Journal of Hydrogen Energy, Volume 35 (2), pp 821-
832, (2010).
42. N. Parvathavarthini, S. Saroja, R.K. Dayal, H.S. Khatak, Studies on hydrogen permeability
of 2.25% Cr–1% Mo ferritic steel: correlation with microstructure, Journal of Nuclear
Materials, Volume 288, Issues 2–3, pp 187-196, (2001).

169
43. A.W. DeVillier, Microstructural Effects on the Hydrogen Embrittlement of High Strength
Steels, M.S. Thesis, (2010), http://idea.library.drexel.edu/handle/1860/3405?mode=full.
44. M. Nagumo, H. Shimura, T. Chaya, H. Hayashi, I. Ochiai, Fatigue damage and its
interaction with hydrogen in martensitic steels, Materials Science and Engineering: A,
Volume 348, Issues 1–2, pp 192-200, (2003).
45. P. Harvey, Material Data Sheet for 4140; 4140H, Engineering Properties of Steel, pp 113-
116, (1982).
46. H. Lee, H. Uhlig, Corrosion fatigue of type 4140 high strength steel, Metallurgical and
Materials Transactions B, Volume3(11), pp 2949-2957, (1972).
47. Y. Kondo, M. Kubota, K. Shimada, Hydrogen enhanced crack propagation of SCM440H
low-alloy steel under long tern varying load, Engineering Fracture Mechanics, Volume 77,
pp 1963-1974, (2010).
48. J. L. Evins, Dependence of Strength on Corrosion-Fatigue Resistance of AISI 4130 Steel,
Thesis, (2004), http://smartech.gatech.edu/handle/1853/5265?show=full.
49. J. Lukács, Fatigue Crack Propagation Limit Curves for Different Metallic and Non-Metallic
Materials, Materials Science Forum, Volume 31, pp 414-415, (2003).
50. S.K. Putatunda, Effect of overload on corrosion fatigue crack growth behavior of a low
alloy steel, Journal of Materials Engineering, Volume 13, pp 229-236, (1991).
51. S.K. Putatunda, Corrosion fatigue crack growth behavior of a low alloy steel in threshold
region, Transactions of Indian Institute of Metals, Volume 42, pp 207-211, (1989).
52. R.A. Karim, Cathodic hydrogen charging of high strength low alloy 4140 steel, Materials
Performance, Volume 45 (8), pp 58-63, (2006).

170
53. K. Genel, M. Demirkol, T. Gulmez, Corrosion fatigue behaviour of ion nitrided AISI 4140
steel, Materials Science and Engineering A, Volume 288, pp 91–100, (2000).
54. F. Sarioglu, The effect of tempering on susceptibility to stress corrosion cracking of AISI
4140 steel in 33% sodium hydroxide at 80°C, Materials Science and Engineering A,
Volume 315, pp 98-102, (2001).
55. J.H. Chuang, L.W. Tsay, C. Chen, Crack growth behaviour of heat-treated 4140 steel in air
and gaseous hydrogen, International Journal of Fatigue, Volume 20(7), pp 531-536, (1998).
56. A. Çelik, A.F. Yetim, A. Alsaran, M. Karakan, Effect of magnetic treatment on fatigue life
of AISI 4140 steel, Materials & Design, Volume 26(8), pp 700-704, (2005).
57. K. Genel, M. Demirkol, M. Çapa, Effect of ion nitriding on fatigue behaviour of AISI 4140
steel, Materials Science and Engineering: A, Volume 279(1–2), pp 207-216, (2000).
58. S. K. Putatunda, A.V. Singar, R. Tackett, G. Lawes, Development of a high strength high
toughness ausferritic steel, Materials Science and Engineering: A, Volume 513–514, pp
329-339, (2009).
59. S. K. Putatunda, C. Martis, J. Boileau, Influence of austempering temperature on the
mechanical properties of a low carbon low alloy steel, Materials Science and Engineering:
A, Volume 528, Issue 15, pp 5053-5059, (2011).
60. J.M. Tartaglia, K.L. Hayrynen, A Comparison of Fatigue Properties of Austempered Versus
Quenched and Tempered 4340 Steel, Journal of Materials Engineering and Performance,
Volume 21(6), pp 1008-1024, (2012).
61. J.M. Tartaglia, K.A. Lazzari, G.P. Hui, K.L. Hayrynen, A Comparison of Mechanical
Properties and Hydrogen Embrittlement Resistance of Austempered vs Quenched and

171
Tempered 4340 Steel, Metallurgical and Materials Transactions A, Volume 39(3), pp 559-
576, (2008).
62. N.E. Nanninga, Effect of Microstructure and Alloying Elements on the Resistance of
Fastener Grade Steels to Hydrogen Assisted Cracking, Thesis, (2005),
http://services.lib.mtu.edu/etd/THESIS/2005/MaterialsSci%26Eng/nanninga/thesis.pdf
63. Y. Tomita, K. Okabayashi, Improvement in lower temperature mechanical properties of
0.40 pct C-Ni-Cr-Mo ultrahigh strength steel with the second phase lower bainite,
Metallurgical Transactions A, Volume 14(2), pp 485-492, (1983).
64. Y. Tomita, K. Okabayashi, Mechanical properties of 0.40 pct C-Ni-Cr-Mo high strength
steel having a mixed structure of martensite and bainite, Metallurgical Transactions A,
Volume 16(1), pp 73-82, (1985).
65. Y. Tomita, Improved lower temperature fracture toughness of ultrahigh strength 4340 steel
through modified heat treatment, Metallurgical Transactions A, Volume 18(8), pp 1495-
1501, (1987).
66. ASTM Standard E-647-08, (2010), “Standard Test Method for Measurement of Fatigue
Crack Growth Rates”, ASTM International, West Conshohocken, PA, www.astm.org.
67. ASTM Standard E-399, (2011), “Standard Test Methods for Tension Testing of Metallic
Materials”, ASTM International, West Conshohocken, PA, www.astm.org.
68. ASTM Standard E-8/E-8M-11, (2011), “Standard Test Methods for Tension Testing of
Metallic Materials”, ASTM International, West Conshohocken, PA, www.astm.org.
69. H.K.D.H. Bhadeshia, Bainite in steels: transformations, microstructure and properties,
(2001), IOM Communications, London

172
70. E.W. Institute, Get TTT and CCT Diagram with Steel Composition. Available from:
http://calculations.ewi.org/vjp/secure/TTTCCTPlots.asp.
71. K.W. Andrews, Empirical formulas for the calculation of some transformation temperatures.
Journal of Iron and Steel Institute, Volume 203, pp 721-727, (1965).
72. Heat Treating Data Sheet for 4140; 4140H, in Heat Treater's Guide: Practices and
Procedures for Irons and Steels, 2nd Edition. 1995, ASM International. p. 319-325.
73. D.A. Porter, K.E. Easterling, Phase transformations in metals and alloys. (1981), Chapman
and Hall, London.
74. B.D. Cullity, Elements of X-ray diffraction. (1956), Addison-Wesley Publication Co,
Reading, MA.
75. N. Eliaz, A. Shachar, B. Tal, D. Eliezer, Characteristics of hydrogen embrittlement, stress
corrosion cracking and tempered martensite embrittlement in high-strength steels,
Engineering Failure Analysis, Volume 9, Issue 2, pp 167-184, (2002).
76. C.D. Kim, A. W. Longinow, Techniques for investigating Hydrogen – Induced Cracking of
steels with high yield strength, Corrosion, Volume 24, No. 10, pp 313-318, (1968).
77. C.F. Dong, X.G. Li, Z. Y. Liu, Y. R. Zhang, Hydrogen – induced cracking and healing
behaviour of X70 steel, Journal of Alloys and Compounds, Volume 484, pp 966-972,
(2009).
78. L.S. Darken, R.P. Smith, Behaviour of Hydrogen in Steel during and after immersion in
acid, Corrosion, Volume 5, pp 1-16, (1949).
79. K.A. Esaklul, W.W. Gerberich., Influence of internal hydrogen on fatigue thresholds of
HSLA steel, Scripta Metallurgica, Volume 17, pp 1079-1082, (1983).

173
80. H. Nykyforchyn, Effect of hydrogen on the kinetics and mechanism of fatigue crack growth
in structural steels, Materials Science, Volume 33(4), pp 504-515, (1997).
81. P. K. Liaw, S. J. Hudak JR., J. K. Donald, Influence of gaseous environments on rates of
near-threshold fatigue crack propagation in nicrmov steel, Metallurgical Transactions A:
Physical Metallurgy and Materials Science, Volume 13A(9), pp 1633-1645, (1982).
82. M. Imade, S. Fukuyama, L. Zhang, M. Wen, K. Yokogawa, Hydrogen environment
embrittlement of SCM440 steel in high pressure hydrogen at room temperature, Journal of
Japan Institute of Metals, Volume 69(2), pp 190–193, (2005).
83. J. Ćwiek, Hydrogen degradation of high-strength steels, Journal of Achievements in
Materials and Manufacturing Engineering, Volume 37(2), pp 193-212, (2009).
84. L.W. Tsay, C.C. Liu, Y.H. Chao, Y.H. Shieh, Fatigue crack propagation in 2.25Cr – 1.0Mo
steel weldments in air and hydrogen, Materials Science and Engineering A, Volume 299, pp
16-26, (2001).
85. S. Homrossukon, S. Mostovoy, J.A. Todd, Investigation of Hydrogen Assisted Cracking in
High and Low Strength Steels, Journal of Pressure Vessel Technology, Volume 131, pp
041405-1 – 041405-11, (2009).
86. J. Ćwiek, Prevention methods against hydrogen degradation of steel, Journal of
Achievements in Materials and Manufacturing Engineering, Volume 43(1), pp 214-221,
(2010).
87. S.K. Putatunda, Influence of material strength level on fatigue crack closure, Engineering
Fracture Mechanics, Volume 30, No 5, pp 627-639, (1988).

174
88. L. Nian, D. Bai-ping, Z. Hui-jiu, On the relationship between fatigue limit, threshold and
microstructure of a low-carbon Cr-Ni steel, International Journal of Fatigue, Volume 6(2),
pp 89-94, (1984).
89. F. Heubaum, M.E. Eine, Short fatigue crack growth behavior in a high strength low alloy
steel, Scripta Metallurgica, Volume 18(11), pp 1235-1240, (1984).
90. L. Guerra-Rosa, C. Moura Branco, J.C. Radon, Monotonic and cyclic crack tip plasticity,
International Journal of Fatigue, Volume 6(1), pp 17-24, (1984).
91. M.T. Yu, T.H. Topper, The Effects of Material Strength, Stress Ratio, and Compressive
Overload on the Threshold Behavior of a SAE1045 Steel, Journal of Engineering Materials
and Technology, Volume 107(1), pp19-25, (1985).
92. J.I. Dickson, Mou-Chih Lu, J.P. Bailon, The influence of strain aging on the fatigue crack
propagation threshold, Scripta Metallurgica, Volume 17(1), pp 49-52, (1983).
93. Y. Li, Z. Yang, S. Li, et al, Effect of Hydrogen on fatigue strength of high strength steels in
the VHCF regime, Advanced Engineering Materials, Volume 11(7), pp 561-567, (2009).
94. A.W. Thomson, I.M. Bernstein, Microstructure and Hydrogen Embrittlement, Hydrogen
Effects in Metals, AIME, pp 291-308, (1981).
95. R.A. Karim, Cathodic Hydrogen Charging of High Strength Low Alloyed AISI 4140 steel,
Materials Performance, pp 58-63, (2006).
96. R.O. Ritchie, J.F. Knott, Mechanisms of fatigue crack growth in low alloy steels, Acta
Metallurgica, Volume 21, pp 639-648, (1973).
97. R.P. Wei, A.J. McEvily, Fracture Mechanics and Corrosion Fatigue. in Proceedings of
NACE conference on "Corrosion fatigue, chemistry, mechanics and microstructure", pp
381-395, (1972).

175
98. A.K. Vasudevan, K. Sadananda, Classification of environmentally assisted fatigue crack
growth behavior. International Journal of Fatigue, Volume 31(11–12), pp 1696-1708,
(2009).
99. S. Suresh, R.O. Ritchie, Mechanistic dissimilarities between environmentally-influenced
fatigue-crack propagation at near-threshold and higher growth rates in lower-strength steels.
Metal Science, Volume 16, pp 529-538, (1981).
100. S.A. Shipilov, Mechanisms for corrosion fatigue crack propagation. Fatigue & Fracture of
Engineering Materials & Structures, Volume 25(3), pp 243-259, (2002).
101. J.R. Rice, in Fatigue Crack Propagation, ASTM STP 415, p. 247, (1967).
102. R.J. Cooke, P.E. Irving, G.S. Booth and C.J. Beevers, The slow fatigue crack growth and
threshold behaviour of a medium carbon alloy steel in air and vacuum, Engineering Fracture
Mechanics, Volume 7, pp 69-77, (1975).
103. R.O. Ritchie, S. Suresh, and J. Toplosky: MIT Fatigue and Plasticity Laboratory, Report No.
FPL/R/80/1030, Cambridge, MA, (1980).
104. R.O. Ritchie, Proceedings of the International Conference on Analytical and Experimental
Fracture Mechanics, Rome, June 1980, G.C. Sih, ed., Sijthoff and Noordhoff, the
Netherlands, p 81.
105. R.O. Ritchie, C.M. Moss, and S. Suresh: MIT Fatigue and Plasticity Laboratory, Report No.
FPL/R/79/1025, Cambridge, MA, (1979).
106. R.O. Ritchie, Near-threshold fatigue propagation in steels, International Metal Reviews,
Review 245, Nos. 5 and 6, pp 205-230, (1979).

176
107. A.K. Vasudeven, K. Sadananda, N. Louat, A review of crack closure, fatigue crack
threshold and related phenomena, Materials Science and Engineering A, Volume 188, pp 1-
22, (1994).
108. G.T. Park, S.U. Koh, H.G. Jung, K.Y. Kim, Effect of microstructure on the hydrogen
trapping efficiency and hydrogen induced cracking of linepipe steel, Corrosion Science,
Volume 50 (7), pp 1865-1871, (2008).
109. N. Parvathavarthini, S. Saroja, R.K. Dayal, Influence of microstructure on the hydrogen
permeability of 9%Cr–1%Mo ferritic steel, Journal of Nuclear Materials, Volume 264 (1–2),
pp 35-47, (1999).

177
ABSTRACT
INFLUENCE OF DISSOLVED HYDROGEN ON THE FATIGUE CRACK GROWTH
BEHAVIOUR OF AISI 4140 STEEL
by
VARUN RAMASAGARA NAGARAJAN
May 2014
Advisor: Prof. Susil K. Putatunda
Major: Materials Science and Engineering
Degree: Doctor of Philosophy
Many metallic structural components come into contact with hydrogen during
manufacturing processes or forming operations such as hot stamping of auto body frames and
while in service. This interaction of metallic parts with hydrogen can occur due to various
reasons such as water molecule dissociation during plating operations, interaction with
atmospheric hydrogen due to the moisture present in air during stamping operations or due to
prevailing conditions in service (e.g.: acidic or marine environments). Hydrogen, being much
smaller in size compared to other metallic elements such as Iron in steels, can enter the material
and become dissolved in the steel matrix. It can lodge itself in interstitials locations of the metal
atoms, at vacancies or dislocations in the metallic matrix or at grain boundaries or inclusions
(impurities) in the alloy. This dissolved hydrogen can affect the functional life of these structural
components leading to catastrophic failures in mission critical applications resulting in loss of
lives and structural component. Therefore, it is very important to understand the influence of the
dissolved hydrogen on the failure of these structural materials due to cyclic loading (fatigue). For

178
the next generation of hydrogen based fuel cell vehicles and energy systems, it is very crucial to
develop structural materials for hydrogen storage and containment which are highly resistant to
hydrogen embrittlement. These materials should also be able to provide good long term life in
cyclic loading, without undergoing degradation, even when exposed to hydrogen rich
environments for extended periods of time.
The primary focus of this investigation was to examine the influence of dissolved
hydrogen on the fatigue crack growth behaviour of a commercially available high strength
medium carbon low alloy (AISI 4140) steel, to examine the influence of microstructure on the
fatigue crack growth behaviour of this material and to determine the hydrogen induced failure
mechanism in this material during cyclic loading. The secondary objective of this investigation
was to determine the role of inclusions and their influence in affecting the fatigue crack growth
rate of this material.
The test results show that the dissolved hydrogen concentration increases with the
increase in charging time in all three heat treated conditions and the hydrogen uptake shows a
strong dependence on the microstructure of the alloy. It was also observed that the
microstructure has a significant influence of on the fatigue crack growth behaviour of the alloy
with dissolved hydrogen. As the dissolved hydrogen concentration increases, the fatigue
threshold was found to decrease and the near threshold crack growth rate increases in all three
heat treated conditions showing the deleterious effect of hydrogen, but to a different extent in
each condition. Current test results also indicate that the fatigue crack growth rates in the linear
region increases as the dissolved hydrogen content increases in all three heat treated conditions.
It is also observed that increasing the austempering temperature decreases the resistance to
hydrogen embrittlement. An interesting phenomenon was observed in annealed specimen

179
charged with hydrogen for 250 h which had an unusually high fatigue threshold (ΔKth). An
attempt has been satisfactorily made to explain these experimental observations and tie them
mechanistically to hydrogen induced fatigue damage based on fractographic as well as
metallographic evidences.

180
AUTOBIOGRAPHICAL STATEMENT
Varun Ramasagara Nagarajan is a final year graduate student completing his Ph.D. in Materials
Science and Engineering from Wayne State University, Detroit, MI, USA and currently working
as a Materials Engineer at Altair ProductDesign (assigned to Chrysler LLC). He received his
M.S. in Materials Science and Engineering from Wayne State University, Detroit, MI, USA in
August 2008 and his B.E. in Chemical Engineering from Dayananda Sagar College of
Engineering, Bangalore, India in August 2005.
Varun’s research has been focused on improving fatigue properties in high strength steels with
specific emphasis on using austempering heat treatments to minimize degradation of the alloy
due to influence of dissolved hydrogen.