Statistical evaluation of strain-life fatigue crack initiation ...
Upload
tu-freibergCategory
view
4download
0
ASSESSMENT OF METAL AND ALLOY RESISTANCE TO CRACKING.
STUDIES OF FATIGUE CRACK GROWTH AND KINETIC FATIGUE FRACTURE DIAGRAMS
S. Ya. Yarema UDC 620.178.3:620.191.33
Two main stages which can be most easily traced under conditions of prolonged loading can be distinguished in the process of fracture in structural materials (with the exception of rare cases close to ideally ductile fracture). In the first stage, after an incubation period, microdiscontinuities originate and develop [1-8] until one of them reaches particu- lar dimensions (for a more detailed treatment see [5]), becoming a dominant defect (macro- crack). The further development of the macrocrack accounts for the second stage of fracture, which ends in loss of carrying capacity by the body (usually as a result of breakthrough at the instant when the crack reaches critical dimensions). The contribution of the second stage to the overall duration of the process varies widely according to the nature and micro- and macrostructure of the material, the load parameters, and the dimensions and shape of the body, and in particular circumstances it may substantially exceed the contribution of the first stage. Special contributory factors are the presence of stress concentrators arising from the design, the technology, and the structure and of residual stresses, so characteristic of, for example, welded joints.
Thus it is always essential in engineering practice to take account of the presence in structural elements of cracks or similar pointed defects (cavities, areas of poor weld pene- tration, inclusions, and the like) which have developed either during operation or during the forming of the material and the manufacture of the structure. These cracks develop when acted upon by working loads and by any unfavorable changes in operating conditions (random overloads, especially alternating or dynamic loads, reduct$ons in temperature, the effect of external agents, and the like) and lead (in particular circumstances) to the sudden fracture of the whole structure at nominal stresses below the yield point or fatigue limit. Many such catastrophes (failures of bridges, reservoirs, pipelines, ships' hulls, and aircraft) have been described in the history of technology, especially in recent decades [9-11]. Consequent- ly, iris essential to know the laws governing crack origination, subcritical growth, and the onset of the critical state under prescribed conditions in order to work out measures to pre- vent this danger and to increase the life of structures. The ordinary standard stress-to- rupture and fatigue tests, which provide only for recording the time (number of cycles) to fracture at loads characterized by nominal stresses in an undamaged specimen, are quite in- sufficient for this purpose.
Starting in the 1960's, when the results of the first studies of fatigue crack growth which were to any extent systematic appeared [12-14], and up to the present day the journals and special collections have described numerous aspects of this process, deepening and broad- ening our knowledge considerably. It is, however, rare for any author to devote serious at- tention to experimental methods and the processing of results. As a result some experiments cannot be regarded as correct today, and the results of many others are not comparable. It therefore seems to us that the time is ripe to begin a debate on the principles of construct- ing a method for research on the development of fatigue cracks which would be adequate for our present knowledge of the nature of this phenomenon and of the laws governing it.
Experimental Scheme. Kinetic Fatigue Fracture Diagrams
The development of cracks (in the future we will use this simplified term for macro- cracks) is usually studied by the following scheme. A specimen with an initial crack is loaded by a pulsed harmonic cycle~ The crack, which is placed perpendicular to the maximum tensile stresses, develops in its own plane and this development is entirely described by the change in one parameter: its length. The length (growth) of the crack is measured periodic- ally during testing at the prescribed load, recording the member of loading cycles. The results
Institute of Physics and Mechanics, Academy of Sciences of the Ukrainian SSR. Translat- ed from Fiziko-Khimicheskaya Mekhanika Materialov, Vol. 13, No. 4, pp. 3-22, July-August, 1977. Original article submitted October 19, 1976.
0038-5565/77/1304-0351507.50 �9 1978 Plenum Publishing Corporation 351

are presented in the form of crack growth curves (graphs) showing the relationships of crack length to the number of cycles or the test time. Using these data to compute the speed of crack growth v as a function of the maximum valuesor amplitude of the nominal (gross or net) stresses ~ in the cycle (see, for example, [13-16]) was a step forward. As a result, empiri- cal relationships were established which were called fatigue crack propagation formulas or (provisionally) laws:
l=~t(N, a); Al/AN=v=f2(l, a): (I)
in the overwhelming majority of cases (see surveys [7, 17-20])
f2(l, ~)=Clm~', (2)
where I is the length of an edge crack or the half-length of an internal crack, Al is its growth in AN cycles, and C, m, and n are constants in the given experiment. Obviously, the applicability of these formulas is limited to bodies of a prescribed geometry and with a pre- scribed loading scheme.
An essentially new stage in research on crack development beganwhen fracture mechanics parameters began to be used, although the classic concepts of fracture mechanics could not be used to explain subcritical crack growth. It seems obvious now that speed of fracture must depend not upon the load in general but only upon the condition of the prefracture zones caused by the load near the crack tip. Head [21] was the first to concentrate upon the local volume of material in front of the crack; then McEvily and lllg [12] multiplied the nominal stresses by the stress concentration factor in their formula for crack growth speed; in cal- culating the stress concentration factor they had to introduce the radius of curvature of the crack tip, interpreted according Go Neuber [22] as the experimentally determinable size of the material structural element. However, Paris [23, 24] took the final step by linking the speed of crack growth with the maximum and minimum coefficients of stress intensity k and the crack tip
(3)
calculated by formulas obtained by solving the appropriate elasticity theory problems or based upon experiment, the so-called K-calibration. He then proposed the celebrated power function [25]
v=C(Ak)m (4)
(Ak = kma x --kmi n, the amplitude of the intensity coefficient per cycle, equal to its maximum value in a pulsating cycle, and C and n are constants) which, however, soon proved to be valid only for average load levels. Since that time it has been accepted that experimental results should be presented as a graph showing the relationship of crack speed to the ampli- tude of the stress intensity coefficient, as the principal factor controlling the fracture process. We will call such a graph a kinetic fatigue fracture diagram or, more simply, a fatigue fracture diagram or kinetic fatigue diagram, thus providing a link with the term "fracture diagram" introduced by Ya. B. Fridman, B. A. Drozdovskii, and V. M. Markochev for a curve showing the relationship of crack length to continuously increasing stresses [26] or the number of loading cycles [27].
A full fatigue fracture diagram in logarithmic coordinates (Fig. i) is an S-shaped curve enclosed between the threshold coefficient of stress intensity K t and its critical value Kfc, called the cyclic fracture toughness [28-30]. Incidentally, the latter should, in principle, be distinguished from the fracture toughness obtained with continuous short-term loading be- cause in determining it the material in front of the crack has time to pass through all the stages of change and damage caused by cyclic deformation. Although KIc(K c) and Kfc are usual- ly similar under normal test conditions (this was the justification for saying that they were equal [31]), they do differ substantially in particular cases [32, 33]. The diagram consists of three sectors: a low-amplitude sector (v ~ 5 �9 10 -6 mm/cycle), a straight middle sector described by the power function (4), and a high-amplitude sector (v ~ 10 -3 mm/cycle). Domi- nant fracture mechanisms distinguishable by their fractographic features correspond to these sectors [34-43]; these give each sector its own patterns of development and specific mechani- cal reaction to external factors (for example, temperature [40-42, 44]. These diagrams give
352

~.~i0- J r n m _ _
~[0"5 i
Fig. i. Typical full kinetic fatigue fracture diagram. The sectors of the diagram are de- noted by Roman numerals.
the basic information on fatigue fracture in a material, in the same way as stress--strain diagrams give the basic information on the deformation process. The effect of various me- chanical, metallurgical, physical, and chemical factors upon the fracture process is studied by comparing diagrams plotted under various conditions with one diagram taken as the basis; these diagrams are very sensitive to such factors [45, 46]. The diagrams are used to find the links between the results obtained in various branches of science (mechanics, solid-state physics, materials science) by various methods peculiar to those branches; for example, today one cannot speak of fracture micromechanisms or of the effect of material structure, tempera- ture, and environment without indicating the sector of the diagram to which this relates. The applied aspects of the diagrams for working out, assessing, and comparative analysis of the suitability of materials for work under prescribed operational conditions are no less vi- tal, as the basis for calculating the danger arising from cracks and for forecasting their development during periods between inspections, to ensure accident-free operation of struc- tures and to calculate their life (see, for example, [7, 45, 47-54]).
The Physical Meaning of Crack Growth Speed and of the Stress Intensity Coefficient
It is possible to see even at low magnifications that a crack, while propagating contin- uously and altering its direction in various ways in particular sectors of the path, is per- forming microoscillations relative to a median macrodirection of development; this is reflect- ed in the complex micro- and macrorelief of the fracture. Crack growth in time is also ex- tremely uneven [55, 56], and only in the medium-amplitude sector can one speak of systematic growth in each cycle within individual elements in the structure, equal to the distance be- tween the furrows observed in particular regions of the fracture [41, 57-60]. In the low- amplitude sector of the diagram, sudden advances of the crack alternate with periods of de- fect accumulation at its tip. These sudden movements are apparently equal to the spacing of specific furrows (which is a slowly varying function of load here), which substantially ex- ceeds the measured speed of the crack [41, 57-60]. In the high-amplitude sector, systematic crack growth accelerates in irregular jumps according to static fracture mechanisms. This stochastic pattern of crack development, caused by inhomogeneity in the material structure and the finite speed of prefracture zone formation, enables us to refer only to speed aver- aged over an interval of time greatly exceeding the periods between the sudden crack movements and over an interval of length substantially greater than an element of the material struc- ture.
Defining the mechanical state in the vicinity of the crack path by one parameter, the stress intensity coefficient, provides the opportunity for linking the fracture process localized in the microvolumes in the simplest possible way with the macroscopic parameters (the load and the geometry of the body weakened by the crack), transforming a particular ex- perimental relationship into the characteristics of the material. However, what we gain in simplicity we lose in precision. The stress intensity coefficient is calculated on the basis of a model of a linearly elastic homogeneous continuum with a notch on a smooth surface (usually a plane) on the assumption of an idealized state (for example, plane strain), and its
353

O
E S
-S fO
70-5
fo-8
km=~,kg/mm s/~ Fig. 2. Fatigue fracture dia- grams for DI6AT alloy sheets 5 mm thick (o) and 2.5 mm thick (A).
applicability is restricted by a number of conditions. In actual bodies a plastic zone which also includes the disintegrating prefracture region usually forms near the path of the crack. If this zone is sufficiently small compared with the elastic concentration region which sur- rounds it, its state (like that of the elastic region) will be defined by the stress inten- sity coefficient. Herein lies the essence of the condition of self-similarity (of fine struc- ture according to G. P. Cherepanov [45]), which is usually formulated as a requirement that the plastic inclusion should be small compared with the size of the crack and the distance of its tip from the boundary of the body. This requirement is largely satisfied in cyclic load- ing~ except perhaps for the high-amplitude sector, where a state of plane strain occurs ini- tially when testing materials which are fairly plastic and too thin; large zones of plastic- ity may then appea r. A transition to oblique fracture usually signals the onset of condi- tions close to a state of plane stress [61-63]; the speed of crack growth becomes sensitive to the thickness of the specimen, so that when it becomes thinner the upper part of the fa- tigue fracture diagram shifts to the right [64-67] (Fig. 2). With large plastic zones, the elastic coefficient of stress intensity loses its importance. Attempts are therefore made to replace it by more general characteristics: the elasticoplastic coefficient of stress inten- sity [68], crack opening [69], or the J integral [70, 71]. Let us note that repeated loading and release lead to the redistribution of plastic deformations both in front of and behind the crack tip and to the occurrence of residual stresses which cause the crack to close up to a specific tensile load [72-75]. These phenomena, which have an important effect upon crack growth (for example, they cause an anomalous slowing down when the load is reduced), are not taken into account at all when computing stress intensity coefficients.
On the other hand, thedimensions of the crack and the stress concentration region must substantially exceed the dimensions of the elements of the structure [76] which is inherent in the material or which has arisen as a result of structural transformations activated by deformation [77]. The cracks which satisfy these two conditions are the macrocracks which we are considering (stage II of crack development according to Forsyth [78]); as a rule, these de- velop in isotropic bodies in the planes of maximum tensile stresses [79]. Microcracks (stage I according to Forsyth), comparable in dimensions with the structural elements or smaller than these elements, are controlled by local stress fields (stresses of the second kind) and by the local properties of the material; the laws governing their development may therefore differ from those governing macrocrack development. In the low-amplitude sector the plastic zone near the crack tip becomes commensurate with or smaller than the dimensions of the structural elements; this causes the fracture processes to become more sensitive to micropeculiarities in the material structure [37, 80-83] and brings such a macrocrack close to the microcracks.
In addition, the crack surfaces and the configuration of its tip should not differ ex- cessively from the scheme adopted; this may occur, for example, when the crack branches or is blunted due to flow or dissolution of the material.
354

Thus, strictly speaking, the applicability of the stress intensity coefficient needs to be confirmed experimentally in each specific case, due to the presence of many circumstances not strictly taken into account and to the indeterminate nature of the limitations imposed and the difficulty in checking that these have been implemented. Fortunately, this applica- bility is indicated by the strong link observed in experiments between the speed of crack growth and the stress intensity coefficient and by special experiments which showed that the speed of crack growth is the same in various specimens with correspondingly various loads and crack lengths if the stress intensity coefficients are the same [84] and constant if they are constant [40, 85-87]. Most probably the only exceptions are cases where the initial model is obviously incompatible; this occurs in macroinhomogeneous bodies, with large plastic zones, and under special test conditions (high temperatures, environments with high chemical activ- ity, and the like) when the mechanical factors lose their dominant importance. However, even under normal conditions there is a certain measure of arbitrariness and ambiguity in describ- ing the state of stress near the tip of a crack by intensity coefficients, and we are com- pelled to attribute many effects linked with residual deformations, the environment, and other factors and caused by changes in the inelastic zones and in crack-tip configurations to changes in a certain resistance of the material to crack propagation. With such an approach it is possible to say that the fatigue fracture diagrams are unambiguous, meaning that each range of intensity coefficient under given conditions has its own corresponding speed of crack growth.
Stabilization of the Fracture Process
When the experimental conditions are altered, the dynamic equilibrium at the crack tip is disturbed; a definite time is therefore necessary for the formation of a new prefracture zone, when the speed of crack growth gradually alters from its initial level to a new stable value. This steady speed does not depend upon the previous history, as tests in a corrosive environment have shown [88], and will be the same irrespective of whether it was achieved by raising or lowering the load [89].
It is natural that only a steady speed of crack growth can define the process of frac- ture in a material under prescribed conditions, not some unsteady value dependent upon the preceding history in a transitional period. This problem becomes particularly acute in tests in active environment, the action of which is concentrated at the tip of the crack [46] and consequently has the greatest effect upon subcritical crack growth. The role of various in- terwoven and interlinked physical and chemical processes (adsorption, diffusion, electrical polarization, dissolution, formation of compounds, and the like) leading to substantial changes in the vicinity of the crack tip and predetermining the fracture mechanism in some measure becomes important in prefracture zone formation in this case more than in any others. Without going into details which are still not entirely clear today [90] it is logical to as- sume that the time necessary for stabilization of speed will depend upon the initial and cur- rent values of the experimental parameters, the intensity of the processes taking place, and the speed of crack advance, and also upon changes in the stress intensity coefficient if these occur. The extreme cases, when the speed of prefracture zone formation is either much greater or less than the speed of crack growth, will be the simplest. In the former case crack growth is stabilized practically instantaneously or in the time necessary for the crack to pass through a zone formed in the previous routine, which occurs, for example, when the load level is raised or lowered respectively (Fig. 3) and the relative speed of the main process (plastic deformation) is very high [91-94]. In the latter case changes near the crack tip will not be realized, and the new experimental conditions will not be reflected in the kinetics of frac- ture. Thus, the effect of the environment dies away when the speed of crack growth in time increases as a result of increasing the loading frequency or of transition to the high-ampli- tude fatigue region. Tests on various materials (steels [95], titanium alloys [96]) showed that the higher the loading frequency, the lower the load amplitudes at which a difference is apparent between the speed of crack growth in air and in a 3.5% solution of common salt (Fig. 4); it practically disappears at a particular (fairly high) frequency, at least within the median- and high-amplitude sectors of the kinetic fatigue diagram [95-98]. Similarly, the speed of crack growth in air of normal and low humidity is the same both at high [99-101] and at low values when there is sufficient time for the water vapor to react with the material even in weak moist air (Fig. 5). The drier the air, the lower the loads at which the speeds of crack growth in it and in laboratory air become the same [102]. The insensitivity of speed of fracture to the reduction in the pressure of air or of its constituents above the first critical value (the lower the value, the lower the speed), when there is sufficient agent for
355

~
!
,9 N'tO'*, cycles
Fig. 3. Graphs showing fatigue crack growth in sheet steel 65G 3 mm thick, as supplied (i) and after quenching with tempering at 580~ (2) in a pulsating cycle with maximum stress intensity coefficient values of 44 kg/mm 3/2 (�9 45 (O), 57 ~F]), 61 (A), 67 (A), and 81 kg/ mm 3/2 (x). The periods of crack re- tardation after reducing the load are designated AN3.
complete reaction with the metal in the prefracture zone, and below the second critical value, when the reaction becomes excessively slow due to the shortage of agent [86, 102, 103], can be explained similarly.
However, if the speeds of the processes accompanying fracture are greater than the speed of crack growth but corm~ensurate with it, they may stop at a particular intermediate stage. It must not be forgotten that the individual process speeds differ substantially from each other (for example, the speeds of adsorption and dissolution), and in an actual case this dif- ference may become more marked because of lack of active agent near the crack tip as a result of access being too slow or passivation of the reaction zone. Consequently, the stages of development reached by the various processes will differ, and it may happen that some re- actions will proceed more or less to completion while others do not take place at all. Here are the potential reasons for stable speed being dependent upon the sequence of the experi- ment; this possibility was indicated by G. P. Cherepanov [45].
Let us use the following example to clarify what has been said. Let the reaction be- tween the material and the agent lead to state A or B in the prefracture zone, the former state being achieved more quickly than the latter. It is not important here whether states A and B are the result of two consecutive stages of one process or the transition from state A to B is caused by the inclusion of some new processes in the action. Let us now mount two experiments with ordinary specimens in which the stress intensity coefficient rises as the crack advances. We begin the first experiment at a low load and a crack growth speed much lower than the speed at which both states are achieved, and the second experiment at a higher load and a speed intermediate between the speeds at which states A and B are formed. Obvious- ly, the speeds of crack growth at a fixed stress intensity coefficient greater than both the initial values will be different in the two experiments because in the latter, as distinct from the former, state B has not come into being. In these circumstances it will remain un- known whether these speeds will be stable, characteristic of states A and B, or not. Appar- ently, this type of relationship between speed of crack growth and previous history of test- ing and the speed of change in the stress intensity coefficient was observed recently by O.N. Romaniv and his co-workers in prolonged static loading of high-strength steels in isobutyl alcohol and distilled water; they came to the conclusion on this basis that the fracture dia- grams were noninvariant [104, 105].
356

i E
sO-a
10-,~
F~equency (Hz)
o- 10
a- o,;
v- 0,0~
i /
(
i l l l~ / I
I0 "5
10 " ~
jj 10"7 #
30 100 ak kg/mm a/~ 20 ~ . " a4 �9 kin= x ; kg/mm
Fig. 4 Fig. 5 Fig. 4. Fatigue fracture diagrams for specimens of 20G2-type steel in a 3.5% NaCI solution at various loading frequencies. The two dashed lines show the data scattering band from an experiment con- ducted in air with a loading frequency of 15 Hz [95].
Fig. 5. Fatigue fracture diagrams for DI6AT alloy sheets 5 mm thick: A) in moist air (relative humidity 60-80%); �9 in dried air (less than 1% relative humidity); ~) in vacuum (i0 -~ mm Hg).
Thus kinetic (time) effects have a considerable influence upon the fracture process, although the possibility that it would be necessary in a more detailed quantitative analysis of the phenomena examined here to bring in other factors also to explain them cannot be ruled out. Strictly speaking, stable speed should be defined by reference to the results of uni- form tests throughout which the whole range of external factors, including the amplitude of the stress intensity coefficient, remains unchanged; although in some cases, when, for ex- ample, the transition periods are very short, this condition can be eased, in others it may prove to be insufficient. Then there is a possibility of differences in the initial state of the prefracture zone caused by the previous history which, generally speaking, may lead to various end results. A sequence of experiments on a given specimen in which the speed of crack growth increases will help to achieve stable results in many cases.
When transition periods are present, the fatigue fracture diagrams give us information on an ultimate equilibrium process similar, for example, to phase diagrams in metallography. Such diagrams are obviously insufficient to describe crack growth under actual conditions, and research on unsteady processes therefore becomes a matter of extreme urgency; without this it is impossible to understand the fracture mechanism itself, especially in a corrosive agent.
Thus it is essential to observe certain rules which flow from the nature of the process and the laws which govern it, so that the fatigue fracture diagrams are indeed characteristic of the material, or more accurately of the material--environment system, which do not depend upon chances or the peculiarities of various methods of conducting the experiment.
Advantages of Uniform Tests
Since the kinetics of the subcritical crack are extremely sensitive to the experimental conditions and depend both upon the stress amplitude and in some measure upon many other
357

factors aswell (theasymmetry and form of the cycle, loading frequency, specimen thickness, temperature, and environment), it is essential to keep all these factors unchanged during the experiment, or at least to make certain in each specific case that changes in some of them within particular limits can be disregarded. This kind of uniformity in tests is one of the most important conditions for the correct use of mathematical methods of processing observations [106]; it is simply essential to use these methods, due to the stochastic na- ture of fracture. Mathematical processing yields statistical characteristics and correla- tions describing the process, and mathematical apparatus is applicable to the latter with attendant opportunities for analysis, generalization, and extrapolation of the experimental findings. A highly representative sample is achieved by multiple repetition of measurements on a moving crack with unaltered experimental conditions; gross errors are excluded, as are improbable events which, although they may occur, are nevertheless not typical of the given material (for example, random accumulations of inclusions leading to the crack jumping for- ward or being retarded, deviation or branching of the crack, and the llke). A linear rela- tionship between crack length during steady development and the number of cycles will be a consequence of constant experimental conditions; this greatly simplifies the statistical processing of data, which havebeen thoroughly worked out only for linear correlation, and im- proves the accuracy and reliability of the results. As Pook observes in his recently pub- lished survey [54], in tests with a variable stress intensity coefficient it has not been possible up to the present, in spite of the united efforts of American and British scientists, to produce a satisfactory computer program using experimental data to find the crack growth speeds which correspond to a prescribed stress intensity coefficient amplitude. Furthermore, uniform tests make it possible to distinguish unsteady periods precisely and to define the stable speeds of crack growth which correspond to the given experimental parameters. Final- ly, if one parameter (for example, temperature) is altered in these experiments after particu- lar intervals, its effect alone can be studied on one and the same specimen. The latter two circumstances are of fundamental importance, especially when studying various physical and physicochemical effects [46], because Continuous changes in the stress field make it very dif- ficult to distinguish the effect of the active factor, prevent stability of fracture from being achieved, and make it difficult to fix the instant at which it begins.
However, the above should not be taken to be a categorical repudiation of the experiment with continuous changes in the stress intensity coefficient. Such experiments are entirely permissible in ordinary cases, when crack growth stabilizes very quickly and the increments in the stress intensity coefficient throughout the tests in the prescribed routine are small (it is essential for this purpose that the specimen dimensions should be fairly large), al- though mathematical processing of their results is much more difficult. Tests with a contin- uously increasing intensity coefficient are quite appropriate in special cases when opera- tional conditions are being simulated or qualitative changes in crack growth mechanisms are being studied [18, 38, 107].
Stabilizing the Stress Intensity Coefficient. Specimens in Disk Form for Testing
Sheet Materials
Stabilizing the stress intensity coefficient is by no means an easy task, because in the specimens normally used (plates with a central or side crack, beam specimens, and compact specimens for off-center tension) it alters with crack growth. These changes can be elimi- nated byregulating the load according to the crack length (either manually or using follow-up systems). However, those methods in which stabilization occurs spontaneously are simpler and more convenient. It wasdemonstrated in [108] that a situation could be achieved with suffi- ciently severe loading at a constant displacement amplitude in which a spontaneous drop in load due to the increased pliability of the specimen with crack growth compensated for the growth in local stresses caused by the reduction in cross section. Stability in the inten- sity coefficient at a constant load level can also be achieved by appropriate choice of speci- men shape and loading scheme. The shaped twin-cantilever beams loaded by a force [109, ii0] or~a moment [iii] used for testing thick-walled materials [112] are examples of such speci- mens. To avoid the instability in linear crack development inherent in these specimens it is necessary to make lateral guide channels along the line of the crack; these increase the se- verity of the stress state substantially [113, 114]. Using round plates (disks) for testing sheet materials which are not too thick is worthy of attention. When they are subjected to tension by two forces applied perpendicularly to a central crack at a certain distance from its middle, the stress intensity coefficient is practically independent of the crack length in
358

t I I I
Fig. 6. Relationship of stress intensity coefficient k to rela- tive crack length % for various distances of points of applica- tion of force a.
a range equal to about one-third of the specimen diameter [115, 116] (Fig. 6). Disk speci- mens satisfy the following basic requirements, which should be imposed upon all specimens for the study of subcritical crack growth.
i. Stability in linear and symmetrical crack growth. As a result of meeting this re- quirement, small deviations from the ideal specimen and crack shape and dimensions and from the loading scheme adopted will only lead to small local disturbances in crack growth, with a tendency to disappear. In particular, the crack returns after a small random deviation to one side, and the asymmetry relative to the disk center evens out spontaneously; this does not occur, for example, in plates with one central crack or with collinear edge cracks.
2. Stability in the form of the crack path. In this case the speed of all its points will be the same, and consequently crack growth can be described by the change in one param- eter only. Failure to fulfill the stability conditions, which occurs in particular in tests on cylindrical specimens with an all-around crack in alternating tension+ when random causes may alter the crack front configuration substantially [32, 117], makes it impossible to sat- isfy the next requirement.
3. Precise determination of the stress intensity coefficient. A disk with a crack is one of that very small number of bodies for which analytical solutions have been obtained for two-dimensional problems concerning the state of stress taking account of the specific method of fixing in the machine clamps [116] and for problems of finding plasticity zones [118] and crack opening [119]. This has made it possible both to give precise formulas for calculat- ing stress intensity coefficients [116, 120] and to make a general analysis of the effect of various factors (for example, the position of the points of force application), to select the optimum relationships between dimensions, and also to take into account and analyze the ef- fect of deviations from the ideal specimen and the loading scheme.
4. Ease of manufacture and convenience in use. Round plates are easy to manufacture with a relatively small expenditure of material, and they do not require powerful test equip- ment. For example, provided that the plates are equal in thickness and width along the crack line, their manufacture calls for approximately one-third of the material that is required for a strip with a central crack under tension from evenly distributed forces, and one-third of the force is required on average to achieve the same stresses at the crack tip (or more precisely from 4.7 times less for small cracks of length 21 = 0.i W to 1.4 times less for large cracks with 21 = 0.8 W, where W is the width of the specimen).
Disk specimens have given a good account of themselves in research on subcritical crack growth in sheet materials from 2 to 8 mm thick [41, 42, 86, 87, 121-123]. During the experi- ments the working sector of the crack length (70 mm in extent for disks of diameter 230 mm), where the intensity coefficient is constant, was divided into several (usually 8-12) regions.
359

When the crack passed through these the experimental parameters were not altered, and on passage from one to another only the parameter being studied was altered. The choice of lengths for these regions was conditioned by many circumstances analyzed previously, and also by the accuracy of the measurement. A length was therefore selected for the crack stable growth sector in a given routine which was much greater (by at least one order of magnitude) than the characteristic size of the material structural element (grain) in order to ensure a sufficient number of measurements in the given routine at intervals substantially exceeding the resolving power of the instrument. Normally, these measurements were taken 10-16 times, and it was necessary to reduce their number only at high speeds in crack development. To minimize the time expended, it is better to conduct the experiment so that the load rises when the routine alters. However, it is necessary to reduce the load in research in the low- amplitude sector after crack initiation if the stresses necessary for generating the macro- crack are greater than the threshold values. In this case it is much more advantageous to make the reduction in small steps, firstly because the total time taken up by the periods of crack retardation (stabilization) will be less than in reduction in large steps, and secondly the risk of obtaining a false threshold value for the intensity coefficient caused by the crack delay effect will be reduced [124, 125].
The Effect of Experimental Conditions on Speed of Crack Growth and Their Regulation
We probably owe the considerable variation (of approximately one order of magnitude [126]) in the results of tests carried out by various authors for nominally identical mate- rials in no small measure to different experimental conditions (see, for example, [122], where the data available in the literature for certain aluminum alloys are compared). It be- comes necessary during the experiment both to stabilize and strictly regulate all the factors which may affect the fracture process. This problem Becomes particularly acute in the case of basic tests to plot a basic standard (cf. the English master curve [7]) fatigue fracture diagram for a material.
After the stress amplitude, the mean stress is the most important mechanical factor; it is usually defined by the asymmetry factor R, the ratio of the minimum to the maximum stress in the cycle. Even until recently the effect of mean stress was considered to be minor, on the basis of research by Frost and his co-workers [127] and other experiments which were re- stricted solely to the median-amplltude sector of the diagram. However, investigations in recent years have shown that it cannot be disregarded, especially at low and high load ampli- tudes [128-136]. A.t the same time a small number of experiments indicate that the compres- sive part of the cycle is not significant [128, 136-139], so that it is usually left entirely out of account in defining the cycle parameters [45]. It therefore seems desirable to us that pulsating (zero-to-zero) tension (R = kmin = 0) should be regarded as the principal cycle for tests. The following factors support this:
I. The overwhelming majority of research has been conducted with such a cycle (or, more precisely, with almost such a cycle).
2. Many formulas for calculating the speed of crack growth have been obtained with this cycle, and those which take asymmetry into account take a very simple form in the case of a pulsating cycle.
3. The implementation of an alternating cycle encounters considerable difficulties, due to the impact loads set up by the gaps in the test machine couplings when the direction of force changes and to the danger of loss of stability. The only exceptions in this re- spect are cylindrical specimens with an annular crack under conditions of cyclic bend- ing [140].
To avoid these unpleasant phenomena, the experiment is usually conducted with a small positive minimum stress intensity coefficient. Of the two values kmi n and R, it is more con- venient in practice to standardize the latter, for example, by setting R = 0.05; this should not (if the phenomenon of crack closure is taken into account) alter the result of the ex- periment by comparison with an ideal pulsating cycle.
Changes in the loading frequency entail changes both in deformation speed and crack open- ing time and in the time spent by the crack neighborhood under high stresses, as well as changes in the temperature field in the prefracture zone, as might have been expected. All this may substantially affect plastic flow in the material, stress relaxation, and reaction with the environment near the crack tip. Usually, the crack growth per cycle decreases [7,
360

i01, 141, 142] with an increase in the loading frequency. In various experiments the fre- quency is varied within very wide limits, from 10 -2 to 103 Hz, although in most cases it is close to i0 Hz. Carrying out tests over the whole range of stress-intensity-coefficient am- plitude (from the threshold value Kt to the critical value Kfc) at a constant frequency is extremely awkward, because in the low-amplitude region the experiment takes up a great deal of time and in the high-amplitude region the rapid advance of the crack makes it difficult to to measure, and to maintain constant load parameters. In view of this, the few foreign re- searchers who have plotted full fatigue fracture diagrams have reduced the loading frequency stepwise as the speed of fracture increased (for example, from 15 to 0.I Hz [95] and from 162 to 2 Hz [143]). In these circumstances the adjacent sectors of the diagram plotted at vari- ous frequencies partially overlapped. This procedure seems reasonable, but it calls for a machine or for a fleet of machines which makes it possible to alter the loading frequency over a wide range (even one order of magnitude). It is very desirable that the loading frequency in laboratory tests should not differ too much from the working load frequency characteris- tic of articles made from the given material, and that there should not be qualitative changes in the process of fracture on transition from one frequency to another. Probably, therefore, several frequencies should be allowed, from which the most suitable might be selected with each specific case.
Similar ways are used to implement the effect of cycle form, changes in which under spe- cial test conditions (corrosive environments [144], high temperatures [145]), may greatly af- fect the speed of crack growth. Since normal test machines generate a harmonic cycle it is natural to regard this as the basic cycle.
The effect of specimen thickness, which determines the degree of triaxiality in the state of stress in the concentration zone at the crack tip and consequently the containment of plas- tic deformation, has already been examined previously. Since this effect is apparent only in the high-amplitude sector controlled by the critical value of the stress intensity coeffi- cient, it is natural to assume that the fatigue fracture diagrams would certainly depend neither upon the thickness nor the other dimensions and shape of the test piece if the re- quirements imposed upon tests to find valid fracture toughness values in plane strain (see, for example, [146-150]) were met in the experiment. Otherwise one might expect essentially the same, but undoubtedly a weaker, effect of geometrical parameters in the high-amplitude region, as on Kc. This situation may arise when studying crack growth in semifinished prod- ucts and articles of limited thickness (rolled sheet, tubes, and the like). These cases re- quire more special-purpose research on the effect of specimen shape and dimensions upon the speed of crack growth, and the possibility that it will result in the necessity for stan- dardizing the test specimen cannot be ruled out.
The test temperature is a vital factor, which not only alters the material deformation processes but also activates the reaction between the material and the environment. Nonethe- less, there is no reliable information on the effect of temperature fluctuations in the labor- atory (approximately from l0 to 30~ upon test results. According to assessments by Wei [I01], changes in test temperature in the room temperature range may lead to changes of 3% in crack growth speed, and even of 20% in the low-amplitude region. Although these data appear to us to be greatly exaggerated, they indicate a necessity for special studies to establish the permissible limits of variation in test temperature.
The atmosphere which surrounds us is a very active environment, which has a significant influence upon the kinetics of material fracture, especially in the brittle high-strength state, and conditions the effect of the factors considered above (frequency, form of cycle, and temperature) to a considerable extent. It would therefore be ideal to carry out all basic tests in a vacuum or an inert atmosphere (for example, pure argon); unfortunately this is unrealistic at present because of the colossal complications in the experiment. Water vapor is regarded as the most active constituent of the air [90], although today one must not ignore other highly active impurities (sulfur compounds and the like) which are appearing in ever-increasing amounts in the atmosphere of industrial centers, especially near metallurgi- cal and chemical plants. Although the necessity for regulating the moisture content of the air intests withlong-term constantand alternatingloading has been mentioned long since, in practice all investigations are carried out without monitoring the composition of the atmo- sphere. Up to now there are no specific data on the extent to which ordinary fluctuations in the relative humidity of the air (approximately from 20 to 100%) affect experimental results, to say nothing of harmful impurities, which lead in particular to stress corrosion cracking
361

in aluminum alloys [151]. Although these problems still require careful study, one can now postulate the necessity for setting up definite norms for the composition of air (mainly its humidity), especially for tests in the low-amplitude region.
It is very important that the loading scheme upon which the experiment is based should be maintained throughout. Accurate setting of the specimens in the clamps is essential for this purpose. The clamp design must not introduce disturbances not taken into account in calculating the stress intensity coefficient; these disturbances arise, for example, as a result of placing the clamps too close to the crack when implementing tension in a strip (in reality a rectangular plate) at infinity or due to friction between the pin transmitting the load and the surface of the h01e in the specimen. Recent investigations have shown that sub- stantial distortion of experimental results may be a consequence of crack edge buckling in a plate under tension, i.e., loss of stability in its plane form of equilibrium caused by com- pressive stresses acting along the crack edges in areas perpendicular to them [152, 153].
We will dwell briefly upon the so-called laws of crack growth, which are represented graphically by the fatigue fracture diagrams, while omitting problems worthy of separate ex- amination: test machines and measuring instruments, initiating the crack in the specimen, planning the course of testing, and the mathematical processing method for the results.
Analytical Description.of Kinetic Fatisue Fracture Diagrams
About ten formulas for fatigue crack growth over the full range of speeds from zero to infinity have now been proposed [30, 126, 130, 135, 154-160]. They have been constructed to satisfy the following conditions. The speed of crack growth increases smoothly and continu- ously with an increase in the amplitude of the stress intensity coefficient;* at the maximum stress intensity coefficient below the threshold the speed is zero, it increases without re- striction as it approaches the critical magnitude, and in the median amplitude region it should be described by power function (4).
Most of the proposed formulas [30, 135, 154, 157-159] can be represented in the case of the pulsating cycle which we are considering (kmin = R = 0) as particular cases of the fol- lowing fractional-power relationship:
, ' n _ _ m q ( k , , , ~ K , ) k~ v - - vo - - ~ - - - , , - - -~ �9 ( 5 )
In these circumstances the number of independent parameters to be determined experimentally, except for vo, K t, and Kfc which are common to all, varies from one to three in the various formulas.
Up to now no comparative analysis of the crack growth speed formulas has been made from the point of view of their conformity with experimental data; one hears the opinion expressed that they should be selected on grounds of convenience, because they are all correct to the same extent and usually the same set of data on speed of crack growth can be described by laws of crack growth which are contradictory at first glance [7]. This opinion is due pri- marily to the fact that there are very few full diagrams as yet and the experimental data which we have at our disposal were obtained mostly in restricted ranges of speeds, when this opinion is completely justified. In addition, a high level of scattering is a feature of most experimental data; this is due not so much to the nature of the process as to the reasons con- sidered above, and levels out the distinctions between the various laws. Nonetheless the es- tablishment of optimum formulas for crack growth speed, if only for particular classes of ma- terials, is of great scientific and practical importance. The parameters of these formulas can serve as numerical characteristics of the resistance of the material to fatigue fracture (by analogy with the stress--strain diagram parameters: yield point, tensile strength, and so on). By using them it is possible to calculate the values of the threshold stress inten- sity coefficient Kt and the fracture toughness Kfc from a set of data on fatigue crack growth; this is extremely tempting in view of the known (often insurmountable) difficulties which arise in calculating them directly. However, it is essential for this purpose that as the maximum stress intensity coefficient in the cycle approaches K t and Kfc the speeds of crack
*Therefore these formulas cannot describe diagrams with the horizontal sectors which occur in particular cases (Figs. 3 and 4 [37, 96, 102]) as a result of some new factor taking effect.
362

TABLE !
Material
Alloy DI6T
Alloy V95ATI
Alloy V95AT2
Alloy V95AT3
Alloy 01420T
Steel 08kp
Steel 65G, normalizing
Steel 65G, quenching + tempering 580~
Steel 65G, quenching + tempering 340~
Steel 65G, quenching + tempering 180~
Steel 03KhI3AGI9
Steel A533VI
Vo'10 ~ , mm/cycle
4.10 4.11
4.08 4.20
Kt, kg/mm3/2
12.1 12.1
10.2 i0.I
Kfc, kg/mm3/2
112 112
86.0 86.5
1.70 1.68
1.65 1.69
8.80 8.90
7.26 7.31
8.50 8.48
6.50 6.49
i00 i00
127 127
1.63 1.65
1.55 1.57
9.38 9.43
1.90 1.90
10.8 10.8
9.55 9.56
2.42 2.41
3.54
4.16 4.30
8.40 8.50
7.35 7.34
25 .i 25 .i
24.0 24.0
20.5 20.5
23.4 23.5
16.3
155 155
224 224
419 418
392 392
17.6 17.7
25 .I 25.0
156 156
98
303 304
354 355
1.53 i .56
1.69 1.69
1.61 1.59
1.56 1.58
1.77 1.73
1.91
1.58 1.59
i .60 1.62
A
1.63 1.61
1.57 1.61
1.59 1.61
1.59 i .61
1.58 1.61
1.61 1.61
1.63 i .61
1.61 1.61
1.65 1.61
1.76
i .60 1.61
1.59 1.61
growth should not only approach zero and infinity, respectively, they should approach them in the proper way. It is in this respect that the formulas proposed by various authors differ substantially, so that special experiments are required to assess their forecasting capabil- ity. Finally, defining the formulas more precisely will help to reveal the patterns of the fracture process; we will illustrate this possibility by the following example. All the ma- terial fatigue fracture diagrams obtained by us [30, 40, 42, 44, 122, 123] are well described by the relationship
kmax -- Kt q, (6)
which defines the process of crack growth by four parameters: Kt, Kfc, vo, and q. Since vo and q, in contrast to K t and Kfc , have no definite physical meaning it will apparently be more convenient to define them by the familiar n and C values from formula (4), with which a particular relationship links them [30, 122]. Table 1 gives the values of Eq. (6) parameters found from the condition of minimum root-mean-square deviation of the logarithms of calculat- ed and experimental crack growth speed values (which is approximately equal to the deviation
363

!
t I I ~., . a 5 0 (
Fig. 7. Fatigue fracture diagrams in the logarithmic system "dimen- sionless coefficient of stress in- tensity (~) -- dimensionless speed of crack growth (q)": I) steel 65G after quenching and tempering at 180~ 2) diagrams for all the rest of the maEerials shown in Table i.
of the relative values of these speeds [22]) for the materials studied and for steel A533VI, on which a study unique in its completeness has been carried out by Paris and his co-workers [143].
Analysis of the data given in Table I showed that the complex
A = qP + 1 (p KI~ (7)
remained practically constant for all the materials except for steel 65G in the brittle, low- temperature tempered state; to be more precise, it varies by • 2% from its mean value of 1.61. Parameters recalculated on the assumption that A = 1.61 show almost no difference from their first values (see Table i), and the root-mean-square deviation increases but slightly in these circumstances. It is interesting to note that index q for the materials examined, ex- cept for low-temperature tempered steel 65G, fluctuates only in the • 5% range from the mean value of 1.65, which is not at all comparable with the changes in index n in Eq. (4).
The fatigue fracture diagrams for all the materials examined, plotted in the coor- ~ m a x
dlnates ~=~g VK__~clog-lp the logarithm of the maximum dimensionless coefficient of stress
to one line (Fig. 7), again with the exception of low-temperature tempered steel 65G. They are all symmetrical relative to the coordinate origin. The constant nature of complex A gives an opportunity for reducing the number of independent parameters in Eq. (6) to three, at least for a particular class of materials and to avoid, for example, experimental deter- mination of the threshold magnitude Kt, which takes up a great deal of time.
In conclusion, it is a pleasant duty to thank my colleagues, engineers G. S. Margolin, I. B. Polutranko, and V. V. Popovich, who carried out the research whose results are shown in Figs. 2, 5, and 3, respectively, and also A. I. Zboromirskii, who carried out all the neces- sary computer operations.
364
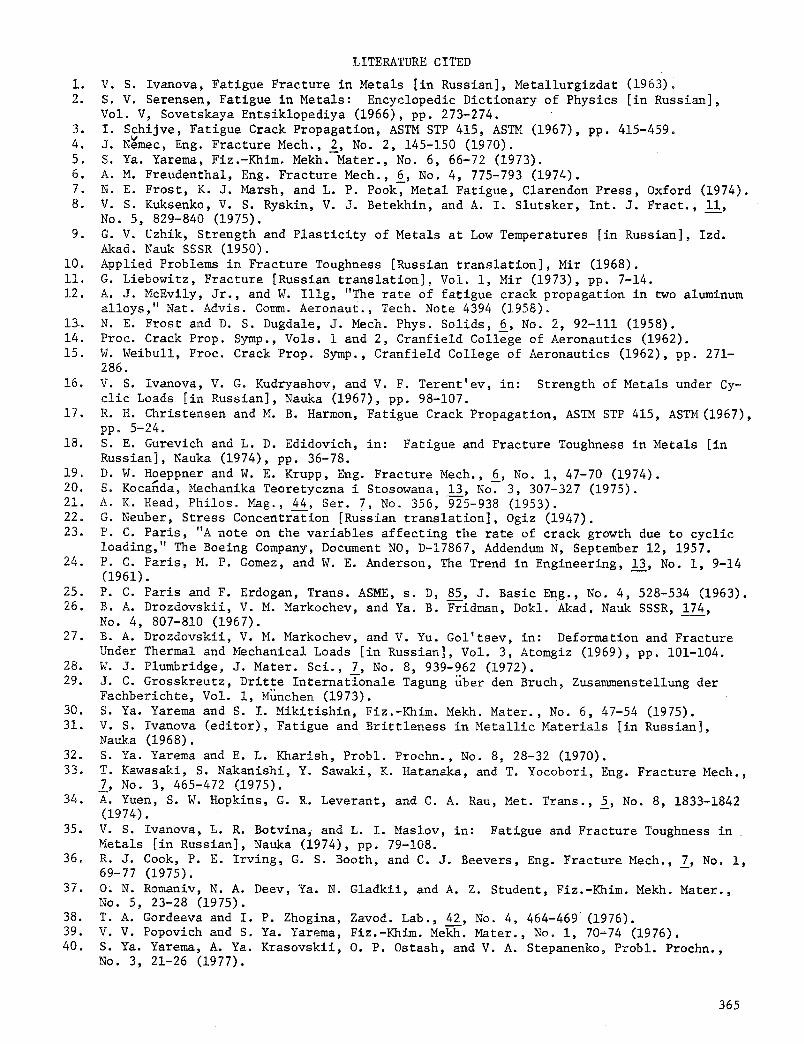
LITERATURE CITED
!. V. S. Ivanova, Fatigue Fracture in Metals [in Russian], Metallurgizdat (1963) 2. S.V. Serensen, Fatigue in Metals: Encyclopedic Dictionary of Physics [in Russian],
Vol. V, Sovetskaya Entsiklopediya (1966), pp. 273-274. 3. I. Schijve, Fatigue Crack Propagation, ASTM STP 415, ASTM (1967) pp. 415-459 4. J. Nemec, Eng. Fracture Mech., i, No. 2, 145-150 (1970). 5. S. Ya. Yarema, Fiz.-Khim. Mekh. Mater., No. 6, 66-72 (1973). 6. A. M. Freudenthal, Eng. Fracture Mech., 6, No. 4, 775-793 (1974). 7. N. E. Frost, K. J. Marsh, and L. P. Pook, Metal Fatigue, Clarendon Press, Oxford (1974). 8. V. S. Kuksenko, V. S. Ryskin, V. J. Betekhin, and A. I. Slutsker, Int. J. Fract., Ii,
No. 5, 829-840 (1975). 9. G. V. Uzhik, Strength and Plasticity of Metals at Low Temperatures [in Russian], Izd.
Akad. Nauk SSSR (1950). i0. Applied Problems in Fracture Toughness [Russian translation], Mir (1968). II. G. Liebowitz, Fracture [Russian translation], Vol. I, Mir (1973), pp. 7-14. 12. A. J. McEvily, Jr., and W. Illg, "The rate of fatigue crack propagation in two aluminum
alloys," Nat. Advis. Comm. Aeronaut., Tech. Note 4394 (1958). 13. N. E. Frost and D. S. Dugdale, J. Mech. Phys. Solids, 6, No. 2, 92-111 (1958). 14. Proc. Crack Prop. Symp., Vols. 1 and 2, Cranfield College of Aeronautics (1962). 15. W. Weibull, Proc. Crack Prop. Symp., Cranfield College of Aeronautics (1962), pp. 271-
286. 16. V. S. Ivanova, V. G. Kudryashov, and V. F. Terent'ev, in: Strength of Metals under Cy-
clic Loads [in Russian], Nauka (1967), pp. 98-107. 17. R. H. Christensen and M. B. Harmon, Fatigue Crack Propagation, ASTM STP 415, ASTM (1967),
pp. 5-24. 18. S. E. Gurevich and L. D. Edidovich, in: Fatigue and Fracture Toughness in Metals [in
Russian], Nauka (1974), pp. 36-78. 19. D. W. Hoeppner and W. E. Krupp, Eng. Fracture Mech., 6, No. i, 47-70 (1974). 20. S. Koca~da, Mechanika Teoretyczna i Stosowana, 13, No~ 3, 307-327 (1975). 21. A. K. Head, Philos. Meg., 44, Ser. 7, No. 356, 925-938 (1953). 22. G. Neuber, Stress Concentration [Russian translation], Ogiz (1947). 23. P. C. Paris, "A note on the variables affecting the rate of crack growth due to cyclic
loading," The Boeing Company, Document NO, D-17867, Addendum N, September 12, 1957. 24. P. C. Paris, M. P. Gomez, and W. E. Anderson, The Trend in Engineering, 13, No. i, 9-14
(1961). 25. P. C. Paris and F. Erdogan, Trans. ASME, s. D, 85, J. Basic Eng., No. 4, 528-534 (1963). 26. B. A. Drozdovskii, V. M. Markochev, and Ya. B. Fridman, Dokl. Akad. Nauk SSSR, 174,
No. 4, 807-810 (1967). 27. B. A. Drozdovskii, V. M. Markochev, and V. Yu. Gol'tsev, in: Deformation and Fracture
Under Thermal and Mechanical Loads [in Russian], Vol. 3, Atomgiz (1969), pp. 101-104. 28. W. J. Plumbridge, J. Mater. Sci., ~, No. 8, 939-962 (1972). 29. J. C. Grosskreutz, Dritte Internationale Tagung uber den Bruch, Zusammenstellung der
Fachberichte, Vol. i, Munchen (1973). 30. S. Ya. Yarema and S. I. Mikitishin, Fiz.-Khim. Mekh. Mater., No. 6, 47-54 (1975). 31. V. S. Ivanova (editor), Fatigue and Brittleness in Metallic Materials [in Russian],
Nauka (1968). 32. S. Ya. Yarema and E. L. Kharish, Probl. Prochn., No. 8, 28-32 (1970). 33. T. Kawasaki, S. Nakanishi, Y. Sawaki, K. Hatanaka, and T. Yocobori, Eng. Fracture Mech.,
!, No. 3, 465-472 (1975). 34. A. Yuen, S. W. Hopkins, G. R. Leverant, and C. A. Rau, Met. Trans., ~, No. 8, 1833-1842
(1974). 35. V. S. Ivanova, L. R. Botvina, and L. I. Maslov, in: Fatigue and Fracture Toughness in
Metals [in Russian], Nauka (1974), pp. 79-108. 36. R. J. Cook, P. E. Irving, G. S. Booth, and C. J. Beevers, Eng. Fracture Mech., !, No. i,
69-77 (1975). 37. O; N. Romaniv, N. A. Deev, Ya. N. Gladkii, and A. Z. Student, Fiz.-Khim. Mekh. Mater.,
No. 5, 23-28 (1975). 38. T. A. Gordeeva and I. P. Zhogina, Zavod. Lab., 42, No. 4, 464-469 (1976). 39. V. V. Popovich and S. Ya. Yarema, Fiz.-Khim. Me~. Mater., No. i, 70-74 (1976). 40. S. Ya. Yarema, A. Ya. Krasovskii, O. P. Ostash, and V. A. Stepanenko, Probl. Prochn.,
No. 3, 21-26 (1977).
365

41. A. Ya..Krasovskii, O. P. Ostash, V. A. Stepanenko, and S. Ya. u Probl. Prochn., No. 4, 74-78 (1977).
42. O. P. Ostash, S. Ya. Yarema, and V. A. Stepanenko, Fiz.-Khim. Mekh. Mater. No. 3, 26- 30 (1977).
43. T. C. Lindley, C. E. Richards, and R. O. Ritchie, Metallurgy and Metal Forming, 43, No. 9, 268-280 (1976).
44. S. Ya. Yarema and O. P. Ostash, Fiz.-Khim. Mekh. Mater., No. 2, 48-52 (1975). 45. G. P. Cherepanov, Mechanics of Brittle Fracture [in Russian], Nauka (1974). 46. V.V. Panasyuk, Fiz.-Khim. Mekh. Mater., No. 4, 3-13 (1974). 47. N. E. Frost, Proc. of the First Intern. Conf. Fracture, Vol. 3, Sendai(1966), pp.1433-1459. 48. E. Bessel, W. Clark, and W. Prail, in: New Methods of Assessing the Resistance of Met-
als to Brittle Fracture [Russian translation], Mir (1972), pp. 213-244. 49. A. R. Jack and A. T. Price, Metal Constr., Brit. Weld. J., ~, No. ii, 416-419 (1971). 50. N. M. Borodachev, in: Strength and Life of Aircraft Structures [in Russian], Issue 4
(1971), pp. 62-65. 51. W. G. Clark, Jr., Met. Eng. Q., 14, No. 3, 16-22 (1974). 52. S.V. Serensen, Resistance of Materials to Fatigue and Brittle Fracture [in Russian],
Atomizdat (1975). 53. H. A. Wood, Eng. Fracture Mech., Z, No. 3, 557-564 (1975). 54. L. P. Pook, J. Strain Anal., IO, No. 4, 242-250 (1975). 55. R. H. Christensen, Proc. Crack Prop. Symp., Cranfield College of Aeronautics
(1962), pp. 326-375. 56. T. Yokobori, M. Tanaka, H. Hayakawa, T. Yoshimura, and S. Sasahira, Rep. Res. Inst.
Strength Fract. Mater., Tohoku Univ., 3, No. 2, 39-71 (1967). 57. G. A. Miller, Trans. ASM, 62, No. 3, 651-658 (1969). 58. M. Castagna and M. Sarracino, Met. Ital., 64, No. 9, 415-420 (1972). 59. Koterazawa, Mori, Matsui, and Simo, Trans. ASME, Ser. D, 95, Theor. Principles Eng.
Calc., No. 4, 7-18 (1973). 60. V. A. Stepanenko and A, Ya. Krasovskii, Probl. Prochn., No. 7, 52-54 (1974). 61. D. P. Wilhem, Fatigue Crack Propagation, ASTM STP 415, ASTM (1967), pp. 363-383. 62. L. P. Pook, Metal Sci., iO, No. 9, 334-335 (1976). 63. D. Brock and J. Schijve, Aircraft Eng., 38, No. ii, 31-33 (1966). 64. J. M. Barsom, E. J. Imhof, and S. T. Rolfe, Eng. Fracture Mech., ~, No. 4, 301-317 (1971). 65. G. E. Nordmark and J. G. Kaufman, Eng. Fracture Mech., 4, No. 2, 193-204 (1972). 66. F. A. Heiser and W. Mortimer, Met. Trans., ~, No. 8, 2119-2123 (1972). 67. R. O. Ritchie, R. F. Smith, and J. F. Knott, Met. Sci., 9, No. ii, 485-492 (1975). 68. S. V. Serensen and N. A. Makhutov, in: Mechanics of Deformed Solids and Structures
[in Russian], Mashinostroenie (1975), pp. 443-448. 69. B. Edmondson, K. Formby, P. Yurkevich, and M. Stagg, in: New Methods of Assessing the
Resistance of Metals to Brittle Fracture [Russian translation], Mir (1972), pp. 256-271. 70. N. E. Dowling, Cracks and Fracture, ASTM STP 601, ASTM <1976), pp. 19-32. 71. R. L. Tobler, ibid., pp. 346-370. 72. W. Elber, Eng. Fracture Mech., ~, No. i, 37-45 (1970). 73. N. J. I. Adams, Eng. Fracture Mech., 4, No. 3, 543-554 (1972). 74. T. T. Shih and R. P. Wei, Eng. Fracture Mech., 6, No. i, 19-32 (1974). 75. H. L. Marcus, W. L. Morris, O. Buck, and J. D. Frandsen, Prospects of Fracture Mechan-
ics, Leyden (1974), pp. 179-191. 76. Yu. N. Rabotnov, Foreword to: V. Z. Parton and E. M. Morozov, Mechanics of Elasto-
plastic Fracture [in Russian], Nauka (1974), pp. 6-12. 77. A. G. Pineau and R. M. Pelloux, Met. Trans., ~, No. 5, 1103-1112 (1974). 78. P. J. E. Forsyth, Proc. Crack Prop. Symp., Cranfield College of Aeronautics (1962),
pp. 76-94. 79. K. Tanaka, Eng. Fracture Mech., 6, No. 3, 493-507 (1974). 80. J. L. Robinson and C. J. Beevers, Met. Sci. J., ~, Sept., 153-159 (1973). 81. P. E. Irving and C. J. Beevers, Met. Trans., ~, No. 2, 391-398 (1974). 82. J. Masounave and J. P. Bailon, Scrip. Met., iO, No. 2, 165-170 (1976). 83. E. Hornbogen and K. H. Zum Gahr, Acta Met., 24, 581-592 (1976). 84. P. C. Paris, Fatigue: Proc. Tenth SagamoreArmy Mater. Res. Conf. Syracuse Univ. Press
(1964), pp. 107-132. 85. S. R. Swanson, F. Cicci, and W. Hoppe, Fatigue Crack Propagation, ASTM STP 415, ASTM
(1967), pp. 312-362.
366

86. S. Ya. Yarema, !. B. Polutranko, and L. V. Ratych, Fiz.-Khim. Mekh. Mater., No. 3, 18- 23 (1973).
87 S. Ya. Yarema, L. V. Ratych, and V. V. Popovich, Fiz.-Khim. Mekh. Mater., No. 3, 45-51 (1975).
88. W. C. Harrigan, Jr., D. L. Dull, and L. Raymond, Progress in Flaw Growth and Fracture Toughness Testing, ASTM STP 536, ASTM (1973), pp. 171-181.
89 So Ya. Yarema and V. V. Popovich, Fiz.-Khim. Mekh. Mater., No. 6, 23-27 (1976). 90. C. M. Hudson and S. K. Seward, Eng. Fracture Mech., 8, No. 2, 315-329 (1976). 91 V. W. Trebules, Jr., R. Roberts, and R. W. Hertzberg, Progress in Flaw Growth and Frac-
ture Toughness Testing, ASTM STP 536, ASTM (1973), pp. 115-146. 92. E. F. J. Von Euw, R. W. Hertzberg, and R. Roberts, Stress Analysis and Crack Growth,
Part i, ASTM STP 513, ASTM (1972), pp. 230-259. 93 R. C. Rice and R. I. Stephens, Progress in Flaw Growth and Fracture Toughness Testing,
ASTM STP 536, ASTM (1973), pp. 95-114. 94 R. P. Wei and T. T. Shih, Int. J. Fract., iO, No. i, 77-85 (1974). 95. Wosikowsky, Trans. ASME, Ser. D, 97, Theor. Principles Eng. Calc., No. 4, 12-20 (1975). 96. D. A. Meyn, Met. Trans., 2A, No. 3, 853-865 (1971). 97. E. J. Imhof and J. M. Barsom, Progress in Flaw Growth and Fracture Toughness Testing
ASTM STP 536, ASTM (1973), pp. 182-205. 98. J. C. Radon, C. M. Branco, and L. E. Culver, Int. J. Fract., 12, No. 3, 467-469 (1976). 99. A. Hartman, Int. J. Fract. Mech., ~, No. 3, 167-183 (1965).
i00. A. Hartman and J. Schijve, Eng. Fracture Mech., i, No. 4, 615-631 (1970). i01. R. P. Wei, Eng. Fracture Mech., ~, No. 4, 633-651 (1970). 102. F. J. Bradshaw and C. Wheeler, Int. J. Fract. Mech., ~, No. 4, 255-268 (1969). 103. M. W. Mahoney and N. E. Paton, Nucl. Technol., 23, No. 3, 290-297 (1974). 104. O. N. Romaniv, G. N. Nikiforchin. and N. L. Kuklyak, Fiz.-Khim. Mekh. Mater., No. i,
25-31 (1976). 105. O. N. Romaniv, G. N. Nikiforchin, and N, A. Deev, Fiz.-Khim. Mekh. Mater., No. 4, 9-24
(1976). 106. E. I. Pustyl'nik, Statistical Methods of Analyzing and Processing Observations [in Rus-
sian], Nauka (1968). 107. V. S. Ivanova and V. F. Terent'ev, The Nature of Fatigue [in Russian], Metallurgiya,
(1975). 108. S. Ya. Yarema, Probl. Prochn., No. 8, 15-18 (1975). 109. J. E. Srawley and B. Gross, Mater. Res. Stand., ~, No. 4, 155-162 (1967). ii0. R. C. Schwab, Paper ASME, N Met-16 (1969). iii. V. Z. Parton and E. M. Morozov, Mechanics of Elastoplastic Fracture [in Russian], Nauka
1974. 112. V. M. Markochev and A. G. Kraev, Zavod. Lab., No. 4, 469-473 (1976). 113. C. N. Freed and J. M. Krafft, J. Mat., ~, No. 4, 770-790 (1966). 114. W. F. Kirkwood and M. E. Prado, Cracks and Fracture, ASTM STP 601, ASTM (1976), pp. 262-
273. 115. S. Ya. Yarema and L. V. Ratych, Inventor's Certificate No. 415546; Byull. Izobr.
Otkrytii, No. 6 (1974). 116. S. Yao Yarema, Fiz.-Khim. Mekh. Mater., No. 4, 25-39 (1976). 117. S. Ya. Yarema, Fiz.-Khim. Mekh. Mater., No. i, 87-89 (1970). 118. S. Ya. Yarema, P. M. Vitvitskii, A. I. Zboromirskii, and O. P. 0stash, Fiz.-Khim. Mekho
Mater., No. 5, 34-39 (1974). 119. S. Ya. Yarema, G. S. Krestin, and A. I. Zboromirskii, Fiz.-Khim. Mekh. Mater., No. i,
31-36 (1975). 120. S. Ya. Yarema and G. S. Krestin, Prikl. Mekh., II, No. 9, 50-56 (1975). 121. N. N. Tkachenko, B. I. Kultan, and R. P. Svistun, Fiz.-Khim. Mekh. Mater., No. i, 74-81
(1976). 122. S. Ya. Yarema, O. P. Ostash, V. P. Rychik, V. M. Beletskii, A. I. Zboromirskii, I. B.
Polutranko, V. N. Belyaev, and G. S. Margolin, Fiz.-Khim. Mekh. Mater., No. i, 46-51 (1977).
123. S. Ya. Yarema, O. P. Ostash, V. M. Beletskii, V. N. Belyaev, and A. I. Zboromirskii, Fiz.-Khim. Mekh. Mater., No. 2, 5-10 (1977).
124o Mo Klesniland P. Luke', Eng. Fracture Mech., 4, No. I, 77-92 (1972). 125. W. C. Harrigan, Jr., D. L. Dull, and L. Raymond, Progress in Flaw Growth and Fracture
Toughness Testing, ASTM STP 536, ASTM (1973), pp. 171-181.
367

126. A. M. Freudenthal, Eng. Fracture Mech., ~, No. 2, 403-414 (1973). 127. N. E. Frost, J. Mech. Eng. Sci., ~, No. I, 22-35 (1962). 128. C. M. Hudson and J. T. Scardina, Eng. Fracture Mech., ~, No. 3, 429-446 (1969). 129. S. Pearson, Eng. Fracture Mech., ~, No. i, 9-24 (1972). 130. M. Klesnil and P. Luke', Mat. Sci. Eng.~ 9, No. 4, 231-240 (1972). 131. P. R. V. Evans, N. B. Owen, and L. N. McCartney, Eng. Fracture Mech., 6, No. i, 183-193
(1974). 132. T. Kanazawa, S. Machlda, and K. Itoga, Eng. Fracture Mech., ~, No. 3, 445-455 (1975). 133. W. E. K. Walker, Effects of Environment and Complex Load History, ASTM STP 462, ASTM
(1970), pp. 1-15. 134. J. Mautz and V. Weiss, Cracks and Fracture, ASTM STP 601, ASTM (1976), pp. 154-168. 135. C. M. Branco, J. C. Radon, and L. E. Culver, J. Test. Eval., 3, No. 6, 407-413 (1975). 136. S. J. Maddox, Int. J. Fract., ii, No. 3, 389-408 (1975). 137. T. W. Crooker, Paper ASME, N PVP-2 (1971). 138. Hubbard, Trans. ASME, Set. D, 91, Theor. Principles Eng. Calc., No. 4, 67-76 (1969). 139. H. Saal, Trans. ASME, Set. D, 94, J. Basic Eng., No. I, 243-247. 140. V. V. Panasyuk, A. E. Andreiklv, S. E. Kovchik, I. N. Pan'ko, and V. A. Zazulyak, Fiz.-
Khim. Mekh. Mater., No. i, 98-i05 (1977). 141. R. A. Schmidt and P. C. Paris, Progress in Flaw Growth and Fracture Toughness Testing,
ASTM STP 536, ASTM (1973), pp. 79-94. 142. T. Yokobori and K. Sato, Eng. Fracture Mech., 8, No. i, 81-88 (1976). 143. P. C. Paris, R. J. Bucci, E. T. Wessel, W. G. Clark, and T. R. Mager, Stress Analysis
and Growth of Cracks, ~, ASTM STP 513, ASTM (1972), pp. 141-176. 144. J. M. Barson, Corrosion Fatigue: Chemistry, Mechanics, and Microstructure, NACE (1973),
pp. 424-436. �9 145. J. R. Haigh, Eng. Fracture Mech., ~, No. 2, 271-284 (1975). 146. W. Brown and J. E. Srawley, Fracture Toughness Testing of High-Strength Metallic Mate-
rials in Plane Strain [Russian translation], Mir, (1972). 147. Standard Method of Test for Plane Strain Fracture. Toughness of Metallic Materials,
1975 Annual Book of Standards, ASTM (1975), pp. 561-569. 148. V. V. Panasyuk, A. E. Andreikiv, and S. E. Kovchik, Fiz.-Khim. Mekh. Mater., No. 2,
10-17 (1976). 149. V. M. Markochev and E. M. Morozov, Fiz.-Khim. Mekh. Mater., No. 2, 21-23 (1976). 150. E. M. Morozov and B. A. Drozdovskli, Zavod. Lab., No. 8, 995-1004 (1976). 151. A. M. Shlyafirner, A. V. Pastoev, and A. G. Bordacheva, Fiz.-Khim. Mekh. Mater., No. 3,
42-47 (1977). 152. J. R. Dixon and J. S. Stranningen, Fracture 1969: Proc. Second Int. Conf. Fracture,
Chapman and Hall, London (1969). 153. D. S. Thompson and R. E. Zinkham, Eng. Fracture Mech., ~, No. 3, 389-409 (1975). 154. F. Erdogan and M. Ratwani, Int. J. Fract. Mech., 6, No. 4, 379-392 (1970). 155. M. P. Wnuk, Eng. Fracture Mech., ~, No. 2, 379-396 (1973). 156. K. B. Davies and C. E. Feddersen, AIAA Pap., No. 74-368 (1974). 157. Chew, Trans. ASME, Ser. D, 96, Theor. Principles Eng. Calc., No. 4, 21-27 (1974). 158. V. G. Kudryashov and V. I. Smolentsev, Fracture Toughness in Aluminum Alloys [in Rus-
sian], Metallurgiya, (1976). 159. W. D. Dover, J. Soc. Environ. Eng., 15, No. i, 3-9 (1976). 160. A. E. Andreikiv, Fiz.-Khim. Mekh. Mater., No. 6, 27-30 (1976).
368
Copyright © 2022 FDOKUMEN