The effect of stress ratio on fatigue crack growth rate in the absence of closure
11
Int. J. Fatigue Vol. 19, Supp. No. 1, pp. S211–S221, 1997 1998. Published by Elsevier Science Ltd. All rights reserved Printed in Great Britain 0142–1123/97/$17.00+ .00 PII: S0142-1123(97)00043-1 The effect of stress ratio on fatigue crack growth rate in the absence of closure R. Sunder*, J. Porter and N.E. Ashbaugh *BiSS Research, 99, 14A Cross, Malleswaram, Bangalore 560 003, India University of Dayton Research Institute, 300 College Park, Dayton, OH 45469, USA A fractographic study² was performed on Al-alloy fatigue fracture surfaces produced by programmed load sequences. The load sequences included steps of constant amplitude cycles at three different stress ratios, each step is preceded by a small number of high amplitude cycles designed to avoid the influence of crack closure and to serve as fractographic markers. The experiments were conducted on different specimen geometries to produce conditions associated with a long crack under fully elastic conditions and a short crack in a notched coupon seeing high local post yield stress conditions. Crack sizes covered in the study ranged from 0.02 to 12 mm, and growth rates ranged from 2 × 10 2 7 to 4 × 10 2 5 mm cycle 2 1 . Fractographic evidence from the study suggests that the crack growth rate can vary by up to a factor of five with applied stress ratio change from 0.64 to 0.73. In the case of the long crack, the effect is less noticeable or totally absent. In the case of naturally initiating notch root cracks, the effect is more pronounced at higher stress level and lower crack growth rate. 1998. Published by Elsevier Science Ltd. (Keywords: fractography; fatigue crack growth; stress ratio; crack closure; small cracks) INTRODUCTION Load history effects in metal fatigue under random service loading are closely linked with mean stress effects in crack formation and stress ratio effects in fatigue crack growth. Most predictive models would indicate that in the absence of mean stress or stress ratio effects, cumulative fatigue damage will be load sequence (history) insensitive. In general, stress ratio effects in fatigue crack growth have been associated with fatigue crack closure 1 . Crack growth rate (da/dN) equations also account for the rapid increase in da/dN as K max approaches K 1c 2,3 . Several mechanisms may be responsible for the stress ratio effect on fatigue crack growth rate 4–6 . Of these, fatigue crack closure has emerged as by far the most ‘popular’ to explain the effect in terms of trunc- ation of applied stress intensity range, DK, to an effec- tive range, DK eff . This reduction in DK is a conse- quence of closure in the wake of the crack, effectively working like a wedge, that does not allow stress inten- sity to drop below a certain level. The closure of the fatigue crack can be attributed to one or more mechanisms – crack tip plasticity, roughness, asperities, oxide layer formation, etc. 1,7 . The first three of these ²This investigation was conducted at the Materials Directorate of Wright Laboratory at Wright-Patterson Air Force Base, OH, USA, under contract F33615-94-C-5200. S211 are load history sensitive, making crack closure a widely accepted phenomenon to model load interaction effects in fatigue life prediction for random, service load conditions 3 . Oxide layer formation can have a major influence on stress ratio effects on threshold stress intensity, DK th . The objective of this study was to examine fracto- graphically the effect of stress ratio on crack growth rate in the absence of fatigue crack closure. For ease of measurements, a ‘fractography friendly’ Al-alloy 2014-T6511 with an average grain size of approxi- mately 15 mm was chosen for the study. The tests were conducted on different specimen types to cover a wide range of stress levels. EXPERIMENTAL PROCEDURE Two different coupons were tested. One was a 5 mm thick, 45 mm wide single edge tension, SE(T), coupon. The other was a specially designed 10 mm thick, 23 mm wide notched SE(T) coupon with K t = 2.5. Figure 1 shows drawings of the two specimens used in testing. The load sequence used in the experiments appears in Figure 2. Each block consists of three steps of 2000 load cycles, each step is preceded by 10 marker cycles. The stress range for each of the steps is the same. Step #1 is at applied stress ratio R = 0.73, Step #2 at R = 0.69 and Step #3 at R = 0.64. Thus, even at the
-
Upload
independent -
Category
Documents
-
view
1 -
download
0
Transcript of The effect of stress ratio on fatigue crack growth rate in the absence of closure
Int. J. Fatigue Vol. 19, Supp. No. 1, pp. S211–S221, 1997 1998. Published by Elsevier Science Ltd. All rights reserved
Printed in Great Britain0142–1123/97/$17.00+.00
PII: S0142-1123(97)00043-1
The effect of stress ratio on fatigue crackgrowth rate in the absence of closure
R. Sunder*, J. Porter† and N.E. Ashbaugh†
*BiSS Research, 99, 14A Cross, Malleswaram, Bangalore 560 003, India†University of Dayton Research Institute, 300 College Park, Dayton, OH 45469,USA
A fractographic study† was performed on Al-alloy fatigue fracture surfaces produced by programmedload sequences. The load sequences included steps of constant amplitude cycles at three different stressratios, each step is preceded by a small number of high amplitude cycles designed to avoid the influenceof crack closure and to serve as fractographic markers. The experiments were conducted on differentspecimen geometries to produce conditions associated with a long crack underfully elastic conditionsand a short crack in a notched coupon seeinghigh local post yieldstress conditions. Crack sizes coveredin the study ranged from 0.02 to 12 mm, and growth rates ranged from 2× 10 2 7 to 4 × 10 2 5
mm cycle2 1. Fractographic evidence from the study suggests that the crack growth rate can vary byup to a factor of five with applied stress ratio change from 0.64 to 0.73. In the case of the long crack,the effect is less noticeable or totally absent. In the case of naturally initiating notch root cracks, theeffect is more pronounced at higher stress level and lower crack growth rate. 1998. Published byElsevier Science Ltd.
(Keywords: fractography; fatigue crack growth; stress ratio; crack closure; small cracks)
INTRODUCTION
Load history effects in metal fatigue under randomservice loading are closely linked with mean stresseffects in crack formation and stress ratio effects infatigue crack growth. Most predictive models wouldindicate that in the absence of mean stress or stressratio effects, cumulative fatigue damage will be loadsequence (history) insensitive. In general, stress ratioeffects in fatigue crack growth have been associatedwith fatigue crack closure1. Crack growth rate (da/dN)equations also account for the rapid increase in da/dNas Kmax approachesK1c
2,3.Several mechanisms may be responsible for the
stress ratio effect on fatigue crack growth rate4–6. Ofthese, fatigue crack closure has emerged as by far themost ‘popular’ to explain the effect in terms of trunc-ation of applied stress intensity range,DK, to an effec-tive range, DKeff. This reduction inDK is a conse-quence of closure in the wake of the crack, effectivelyworking like a wedge, that does not allow stress inten-sity to drop below a certain level. The closure ofthe fatigue crack can be attributed to one or moremechanisms – crack tip plasticity, roughness, asperities,oxide layer formation, etc.1,7. The first three of these
†This investigation was conducted at the Materials Directorate ofWright Laboratory at Wright-Patterson Air Force Base, OH, USA,under contract F33615-94-C-5200.
S211
are load history sensitive, making crack closure awidely accepted phenomenon to model load interactioneffects in fatigue life prediction for random, serviceload conditions3. Oxide layer formation can have amajor influence on stress ratio effects on thresholdstress intensity,DKth.
The objective of this study was to examine fracto-graphically the effect of stress ratio on crack growthrate in theabsenceof fatigue crack closure. For easeof measurements, a ‘fractography friendly’ Al-alloy2014-T6511 with an average grain size of approxi-mately 15mm was chosen for the study. The testswere conducted on different specimen types to covera wide range of stress levels.
EXPERIMENTAL PROCEDURE
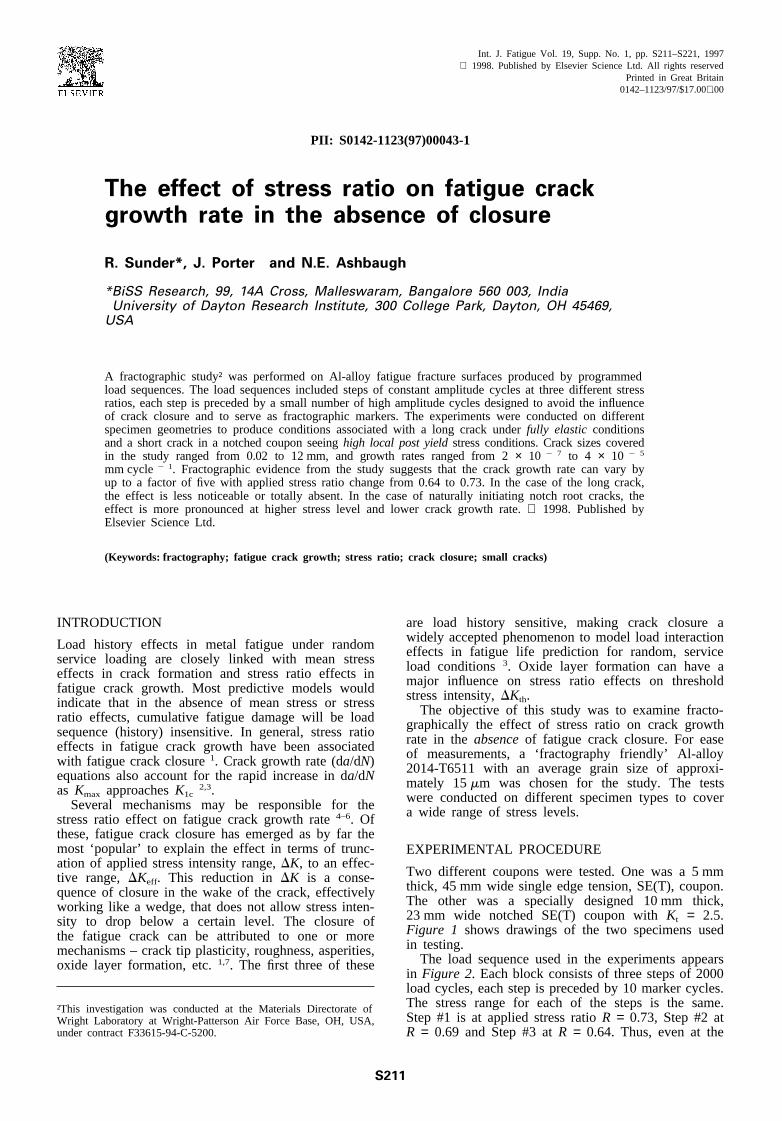
Two different coupons were tested. One was a 5 mmthick, 45 mm wide single edge tension, SE(T), coupon.The other was a specially designed 10 mm thick,23 mm wide notched SE(T) coupon withKt = 2.5.Figure 1 shows drawings of the two specimens usedin testing.
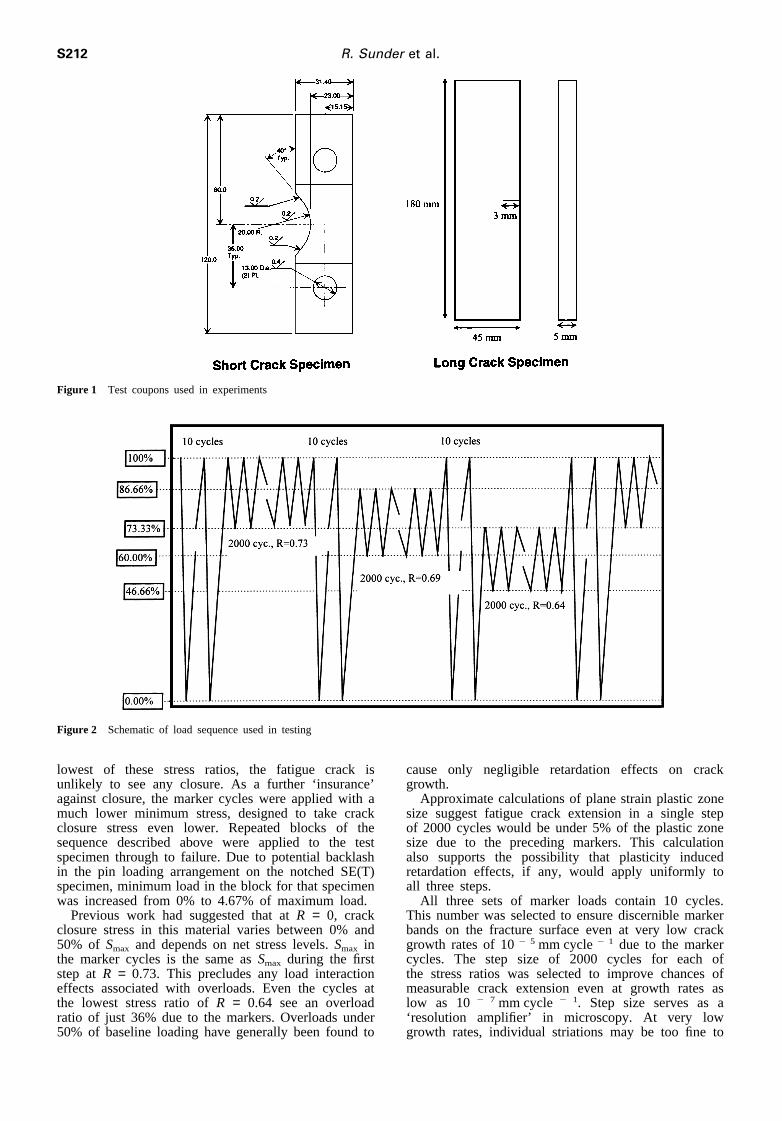
The load sequence used in the experiments appearsin Figure 2. Each block consists of three steps of 2000load cycles, each step is preceded by 10 marker cycles.The stress range for each of the steps is the same.Step #1 is at applied stress ratioR = 0.73, Step #2 atR = 0.69 and Step #3 atR = 0.64. Thus, even at the
S212 R. Sunder et al.
Figure 1 Test coupons used in experiments
Figure 2 Schematic of load sequence used in testing
lowest of these stress ratios, the fatigue crack isunlikely to see any closure. As a further ‘insurance’against closure, the marker cycles were applied with amuch lower minimum stress, designed to take crackclosure stress even lower. Repeated blocks of thesequence described above were applied to the testspecimen through to failure. Due to potential backlashin the pin loading arrangement on the notched SE(T)specimen, minimum load in the block for that specimenwas increased from 0% to 4.67% of maximum load.
Previous work had suggested that atR = 0, crackclosure stress in this material varies between 0% and50% of Smax and depends on net stress levels.Smax inthe marker cycles is the same asSmax during the firststep atR = 0.73. This precludes any load interactioneffects associated with overloads. Even the cycles atthe lowest stress ratio ofR = 0.64 see an overloadratio of just 36% due to the markers. Overloads under50% of baseline loading have generally been found to
cause only negligible retardation effects on crackgrowth.
Approximate calculations of plane strain plastic zonesize suggest fatigue crack extension in a single stepof 2000 cycles would be under 5% of the plastic zonesize due to the preceding markers. This calculationalso supports the possibility that plasticity inducedretardation effects, if any, would apply uniformly toall three steps.
All three sets of marker loads contain 10 cycles.This number was selected to ensure discernible markerbands on the fracture surface even at very low crackgrowth rates of 102 5 mm cycle2 1 due to the markercycles. The step size of 2000 cycles for each ofthe stress ratios was selected to improve chances ofmeasurable crack extension even at growth rates aslow as 102 7 mm cycle 2 1. Step size serves as a‘resolution amplifier’ in microscopy. At very lowgrowth rates, individual striations may be too fine to
S213The effect of stress ratio on fatigue crack growth rate in the absence of closure
be picked up under the microscope. Ref.8 noted thatstriation spacings indicating crack growth rate under10 2 4 mm cycle2 1 have not been observed. However,a band of multiple such striations is more readilyidentified when spaced with marker cycles that leavebehind their own bands with contrasting morphology.
In the process of ensuring minimum load interactioneffects and absence of fatigue crack closure, variationof applied stress ratio was restricted to between 0.64and 0.73. It was assumed, however, that even thisinterval is wide enough to show any stress ratio effecton crack growth rate.
A total of three tests were conducted. Applied loadlevels and estimated stress responses are listed inTable1. The da/dN measurements are shown inTable 2. Aplot of these results is shown inFigure 3. The materialconstants on the same material from Ref.9 are givenin Table 3. The constantsE, Sf, and ef are Young’smodulus, tensile strength and failure strain, respect-ively. K9 and n9 are the cyclic strength coefficient andcyclic strain hardening exponent, respectively. For theK levels considered inTable 2, C and m are thecoefficient and exponent, respectively, for the Pariscrack growth law andKc is the operational fracturetoughness. These constants were used in analysis ofinelastic specimen response and fatigue crack growthanalysis. Due to inelastic response, the effective stressratios in the tests on the notched SE(T) specimenswere slightly different from applied stress ratios. Whenthe material yields under tensile loading and subsequentstress reversal are totally elastic, the effective stressratio will be less than the applied stress ratio.
Test 1 was on an SE(T) specimen with an edgecrack. A 3 mm saw cut served as the crack initiator.The test was atSmax = 100 MPa to simulate long crackfully elastic conditions. Tests 2 and 3 were conductedon a specially designed notched coupon (seeFigure 1for details) with Kt = 2.5. The purpose of these testswas to simulate the behavior of real engineering
Table 1 Loading conditions and estimated specimen response. Refer toFigure 2 for load sequence
Test 1 2 3Specimen geometry SE(T) W45/T5 mm Notched SE(T) (Kt = 2.5) Notched SE(T) (Kt = 2.5)
W23/T10 mm W23/T10 mmReference loading (100%) 100 MPa 50 kN 75 kNMaximum net stress (MPa) 100 217 326Maximum notch local stress — 515 670(MPa)
Step #1 (2000 cycles)Applied stress ratio R = 0.73Effective stress ratio 0.73 0.72 0.683Smax (MPa) 100 515 670DS (MPa) 26.67 145 217
Step #2 (2000 cycles)Applied stress ratio R = 0.69Effective stress ratio 0.69 0.67 0.624Smax (MPa) 86.66 442.5 564DS (MPa) 26.67 145 217
Step #3 (2000 cycles)Applied stress ratio R = 0.64Effective stress ratio 0.64 0.61 0.537Smax (MPa) 73.33 370 458DS (MPa) 26.67 145 217
Step #4 (10 cycles)Applied stress ratio R = 0 R = 0.0467Effective stress ratio 0.00 0 2 0.16Smax (MPa) 100 515 670DS (MPa) 100 518 777
components with stress raiser and associated stressgradient. The specimen was designed with a notchenforcing natural crack initiation under conditions ofcontrolled local inelasticity. The maximum applied load(50 kN) in Test 2 was selected to induce notch rootyield, with estimated notch root maximum stress reach-ing 515 MPa compared to a material yield stress of420 MPa. This maximum load caused limited residualstresses upon unloading, thereby reducing the effectivestress ratio from 0.73 to 0.72 in Step #1. Test 3used a higher maximum applied load (75 kN), therebyproducing considerable inelastic deformation of thenotch root, leading to formation of noticeable residualstresses and associated reduction in effective stressratio (seeTable 1).
Table 1summarizes the estimated stress response ofthe test coupon in the three tests. Stress levels forTests 2 and 3 were estimated as notch surface localstresses after Neuber conversion. The maximum stressvaried from 100 to 670 MPa to cover both fully elasticand inelastic loading conditions. As mentioned earlier,subsequent cycling after initial inelastic deformationproduced a purely elastic response. As seen fromTable1 and Figure 2, the programmed pattern of loading inall three tests was identical, though stress levels variedconsiderably. A minor difference was the minimum4.67% tensile load component in the notched couponsto avoid loading pin backlash at zero load. The otherdifference was in crack initiation. The SE(T) specimenhad a saw-cut crack initiator, while the notched cou-pons saw natural crack initiation.
In all the tests, the specimen was cycled to failurethrough repeated cycling with the programmed loadsequence shown inFigure 2. After the test, the fracturesurface was trimmed for observation on a Leica Cam-bridge 360FE 0303 Scanning Electron Microscope.
S214 R. Sunder et al.
Table 2 da/dN data
a (mm) DK (MPa√m) da/dN (mm cycle2 1) Test
Step #1 Step #3
4.5 3.55 1.89× 10 2 6 1.89 × 10 2 6 17.8 4.68 1.21× 10 2 5 1.21 × 10 2 5
11.9 5.77 3.68× 10 2 5 2.65 × 10 2 5
0.04 1.1 2.69× 10 2 7 9.6 × 10 2 8 20.05 1.27 5.17× 10 2 7 1.55 × 10 2 7
0.065 1.4 8.18× 10 2 7 3.73 × 10 2 7
0.15 2.18 1.97× 10 2 6 1.64 × 10 2 6
0.024 1.3 6.25× 10 2 7 2.4 × 10 2 7 30.028 1.4 7.69× 10 2 7 2.89 × 10 2 7
0.032 1.48 1.06× 10 2 6 3.85 × 10 2 7
0.037 1.6 1.15× 10 2 6 4.81 × 10 2 7
0.042 1.7 1.35× 10 2 6 6.73 × 10 2 7
0.049 1.9 1.44× 10 2 6 8.65 × 10 2 7
0.058 2.08 1.46× 10 2 6 9.0 × 10 2 7
0.066 2.15 1.49× 10 2 6 9.33 × 10 2 7
0.076 2.3 1.87× 10 2 6 1.31 × 10 2 6
0.087 2.5 2.24× 10 2 6 1.49 × 10 2 6
0.099 2.7 2.43× 10 2 6 1.68 × 10 2 6
0.11 2.8 2.61× 10 2 6 1.87 × 10 2 6
0.125 3.1 2.61× 10 2 6 2.43 × 10 2 6
0.136 3.2 2.49× 10 2 6 2.49 × 10 2 6
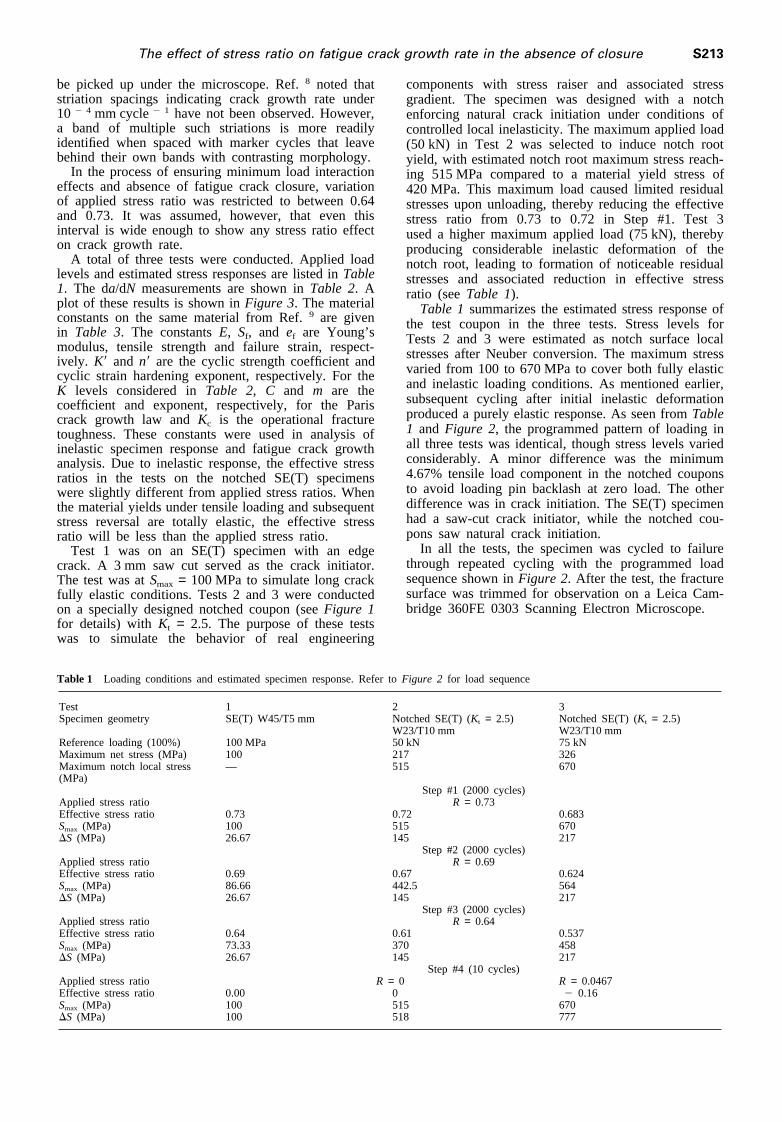
Figure 3 Comparison of long and small crack growth rates
Table 3 Material constants 2014-T65119
E (MPa) Sf (MPa) ef K9 (MPa) n9 C (mm(MPa√m) m Kc (MPa√m)2 1)
70800 1075.0 0.25 1479 0.148 102 7 3.27 60
RESULTS AND DISCUSSION
Test 1: long crack under elastic loadingAll the fractographs from this test show the fatigue
crack growing from right to left. For consistency inmeasurements, they are all from the mid-thicknessregion, at least 1 mm from the specimen surfaces.
At crack size 4.5 mm (DK = 3.6 MPa√m, the mid-thickness area largely shows uniformly spaced striationbands, that in fact make it difficult to identify the bandcorresponding to the highest stress ratio (seeFigure4). The crack growth rate over each of the 2000 cyclesteps was estimated to be 1.891× 10 2 6 mm cycle2
1. In Figure 4, we find crevices along some of themarker bands, indicating that the fatigue crackattempted to change direction during the 10 markercycles. This was not apparent at lower crack growthrates and appears to indicate a point where the pre-ferred plane of crack extension is no longer the samefor the marker cycles and those in Steps #1–3.
Figure 5 shows equally spaced striation bands fromall three steps. This fractograph is from a mid-thicknesssite corresponding toa = 7.8 mm. Towards the left endof the fractograph, we find an increasing contribution ofthe marker cycles to fatigue crack extension. Themarker bands now show a width of their own. Thegrowth rate in each of the 2000 cycle steps is 1.207× 10 2 5 mm cycle2 1, while in the marker cycles itis 6.03 × 10 2 4 mm cycle 2 1. These do not differgreatly from the computed values of 1.549× 10 2 5
and 4.53× 10 2 4 mm cycle2 1 from material constants.However, the marker cycle component is steadily
S215The effect of stress ratio on fatigue crack growth rate in the absence of closure
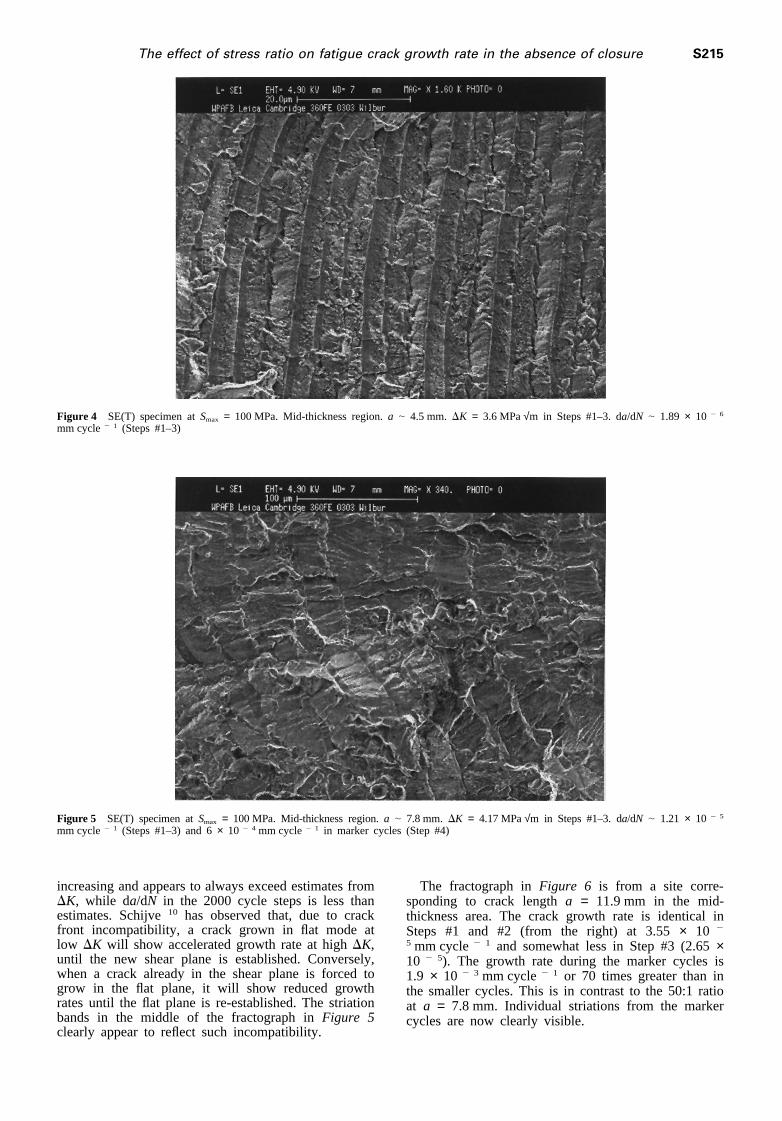
Figure 4 SE(T) specimen atSmax = 100 MPa. Mid-thickness region.a | 4.5 mm. DK = 3.6 MPa√m in Steps #1–3. da/dN | 1.89 × 10 2 6
mm cycle2 1 (Steps #1–3)
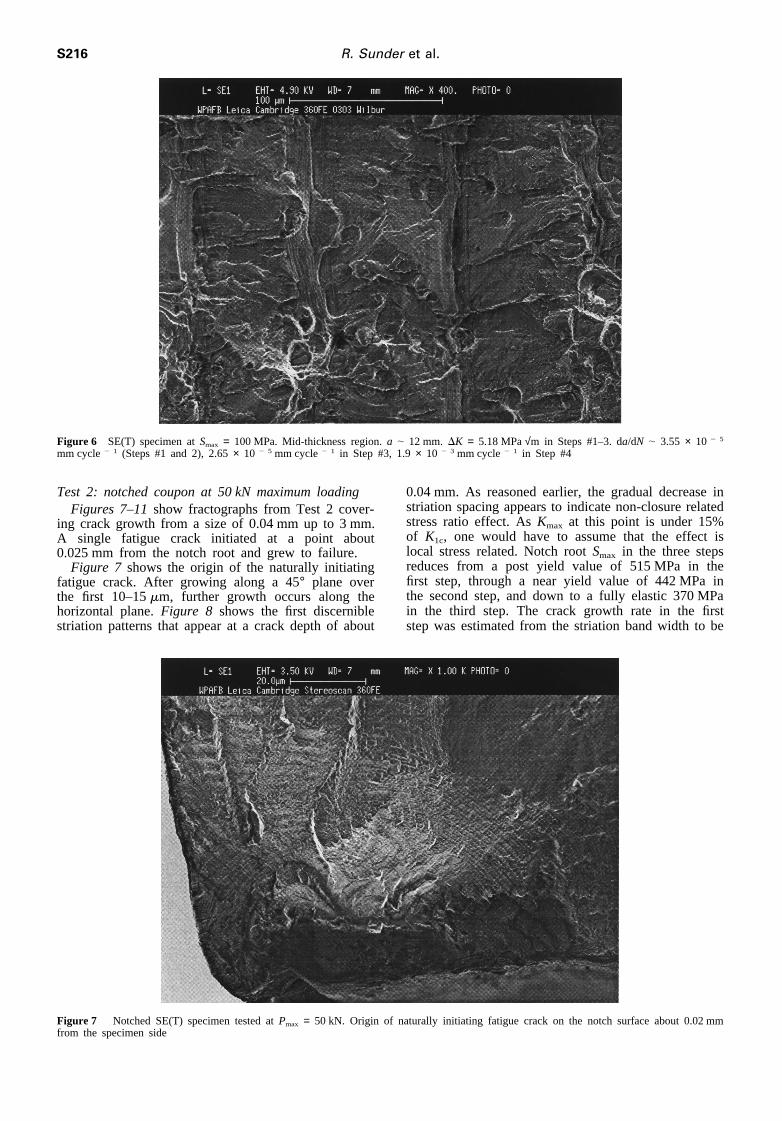
Figure 5 SE(T) specimen atSmax = 100 MPa. Mid-thickness region.a | 7.8 mm. DK = 4.17 MPa√m in Steps #1–3. da/dN | 1.21 × 10 2 5
mm cycle2 1 (Steps #1–3) and 6× 10 2 4 mm cycle2 1 in marker cycles (Step #4)
increasing and appears to always exceed estimates fromDK, while da/dN in the 2000 cycle steps is less thanestimates. Schijve10 has observed that, due to crackfront incompatibility, a crack grown in flat mode atlow DK will show accelerated growth rate at highDK,until the new shear plane is established. Conversely,when a crack already in the shear plane is forced togrow in the flat plane, it will show reduced growthrates until the flat plane is re-established. The striationbands in the middle of the fractograph inFigure 5clearly appear to reflect such incompatibility.
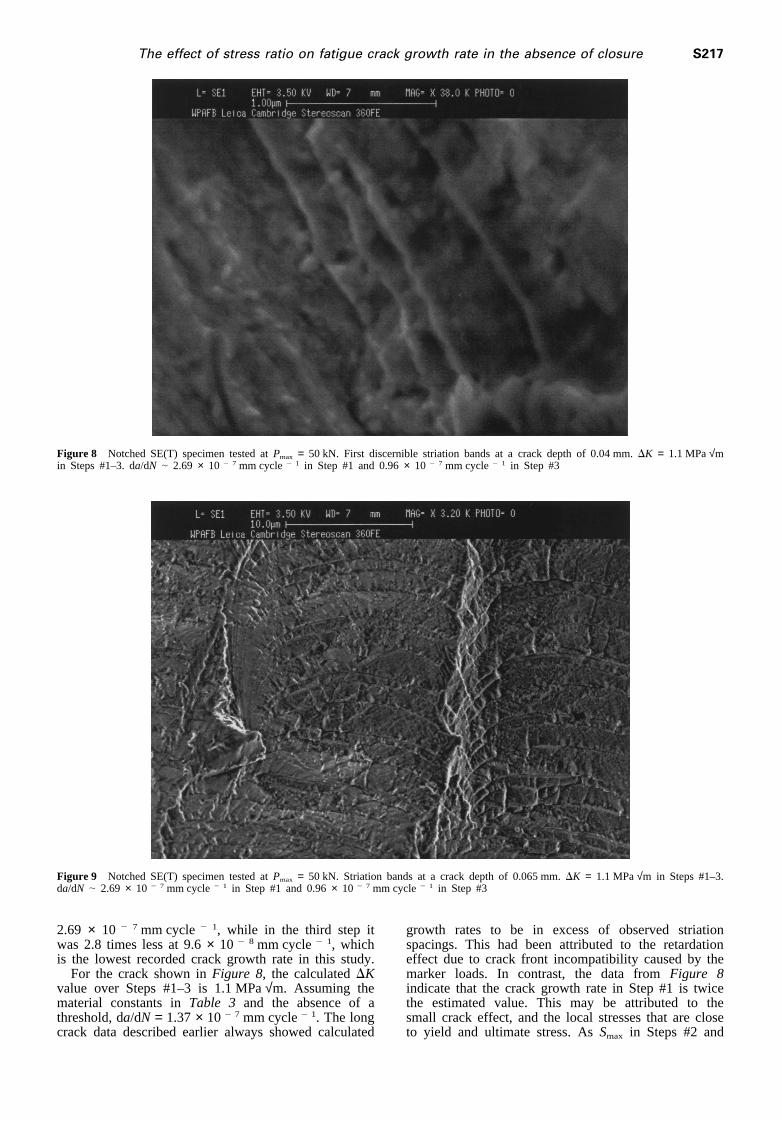
The fractograph inFigure 6 is from a site corre-sponding to crack lengtha = 11.9 mm in the mid-thickness area. The crack growth rate is identical inSteps #1 and #2 (from the right) at 3.55× 10 2
5 mm cycle2 1 and somewhat less in Step #3 (2.65×10 2 5). The growth rate during the marker cycles is1.9 × 10 2 3 mm cycle2 1 or 70 times greater than inthe smaller cycles. This is in contrast to the 50:1 ratioat a = 7.8 mm. Individual striations from the markercycles are now clearly visible.
S216 R. Sunder et al.
Figure 6 SE(T) specimen atSmax = 100 MPa. Mid-thickness region.a | 12 mm. DK = 5.18 MPa√m in Steps #1–3. da/dN | 3.55 × 10 2 5
mm cycle2 1 (Steps #1 and 2), 2.65× 10 2 5 mm cycle2 1 in Step #3, 1.9× 10 2 3 mm cycle2 1 in Step #4
Test 2: notched coupon at 50 kN maximum loadingFigures 7–11show fractographs from Test 2 cover-
ing crack growth from a size of 0.04 mm up to 3 mm.A single fatigue crack initiated at a point about0.025 mm from the notch root and grew to failure.
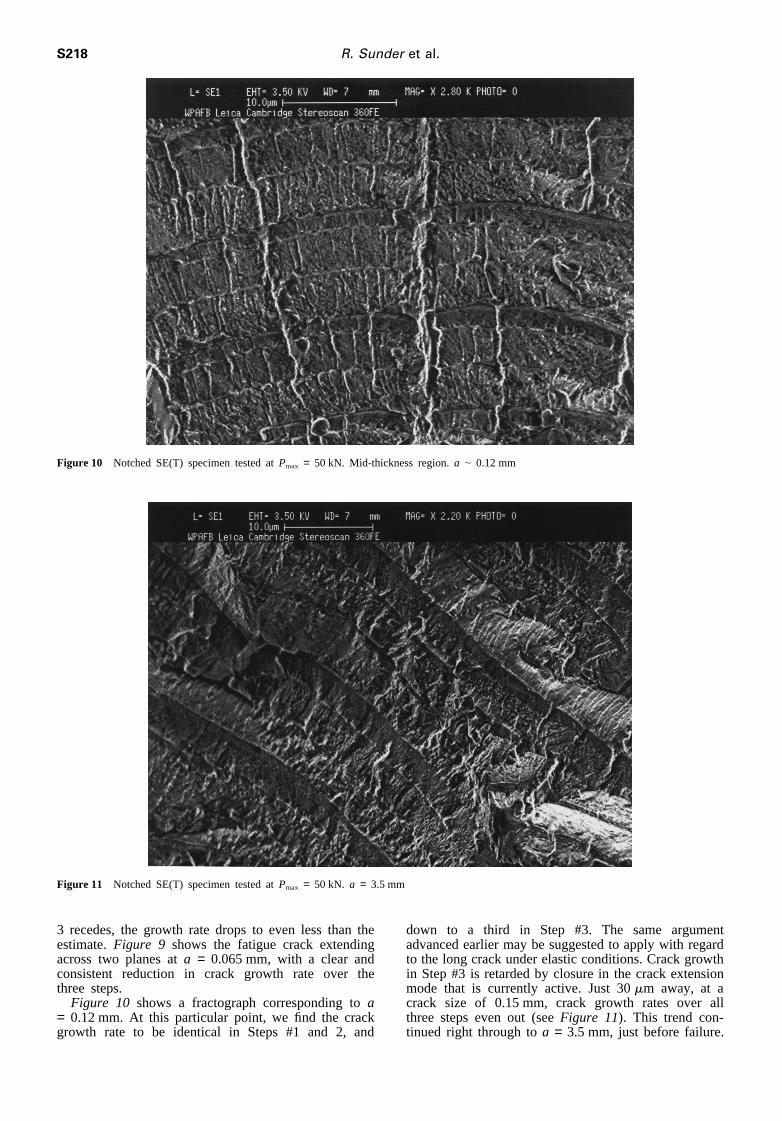
Figure 7 shows the origin of the naturally initiatingfatigue crack. After growing along a 45° plane overthe first 10–15mm, further growth occurs along thehorizontal plane.Figure 8 shows the first discerniblestriation patterns that appear at a crack depth of about
Figure 7 Notched SE(T) specimen tested atPmax = 50 kN. Origin of naturally initiating fatigue crack on the notch surface about 0.02 mmfrom the specimen side
0.04 mm. As reasoned earlier, the gradual decrease instriation spacing appears to indicate non-closure relatedstress ratio effect. AsKmax at this point is under 15%of K1c, one would have to assume that the effect islocal stress related. Notch rootSmax in the three stepsreduces from a post yield value of 515 MPa in thefirst step, through a near yield value of 442 MPa inthe second step, and down to a fully elastic 370 MPain the third step. The crack growth rate in the firststep was estimated from the striation band width to be
S217The effect of stress ratio on fatigue crack growth rate in the absence of closure
Figure 8 Notched SE(T) specimen tested atPmax = 50 kN. First discernible striation bands at a crack depth of 0.04 mm.DK = 1.1 MPa√min Steps #1–3. da/dN | 2.69 × 10 2 7 mm cycle2 1 in Step #1 and 0.96× 10 2 7 mm cycle2 1 in Step #3
Figure 9 Notched SE(T) specimen tested atPmax = 50 kN. Striation bands at a crack depth of 0.065 mm.DK = 1.1 MPa√m in Steps #1–3.da/dN | 2.69 × 10 2 7 mm cycle2 1 in Step #1 and 0.96× 10 2 7 mm cycle2 1 in Step #3
2.69 × 10 2 7 mm cycle2 1, while in the third step itwas 2.8 times less at 9.6× 10 2 8 mm cycle2 1, whichis the lowest recorded crack growth rate in this study.
For the crack shown inFigure 8, the calculatedDKvalue over Steps #1–3 is 1.1 MPa√m. Assuming thematerial constants inTable 3 and the absence of athreshold, da/dN = 1.37× 10² 7 mm cycle2 1. The longcrack data described earlier always showed calculated
growth rates to be in excess of observed striationspacings. This had been attributed to the retardationeffect due to crack front incompatibility caused by themarker loads. In contrast, the data fromFigure 8indicate that the crack growth rate in Step #1 is twicethe estimated value. This may be attributed to thesmall crack effect, and the local stresses that are closeto yield and ultimate stress. AsSmax in Steps #2 and
S218 R. Sunder et al.
Figure 10 Notched SE(T) specimen tested atPmax = 50 kN. Mid-thickness region.a | 0.12 mm
Figure 11 Notched SE(T) specimen tested atPmax = 50 kN. a = 3.5 mm
3 recedes, the growth rate drops to even less than theestimate.Figure 9 shows the fatigue crack extendingacross two planes ata = 0.065 mm, with a clear andconsistent reduction in crack growth rate over thethree steps.
Figure 10 shows a fractograph corresponding toa= 0.12 mm. At this particular point, we find the crackgrowth rate to be identical in Steps #1 and 2, and
down to a third in Step #3. The same argumentadvanced earlier may be suggested to apply with regardto the long crack under elastic conditions. Crack growthin Step #3 is retarded by closure in the crack extensionmode that is currently active. Just 30mm away, at acrack size of 0.15 mm, crack growth rates over allthree steps even out (seeFigure 11). This trend con-tinued right through toa = 3.5 mm, just before failure.
S219The effect of stress ratio on fatigue crack growth rate in the absence of closure
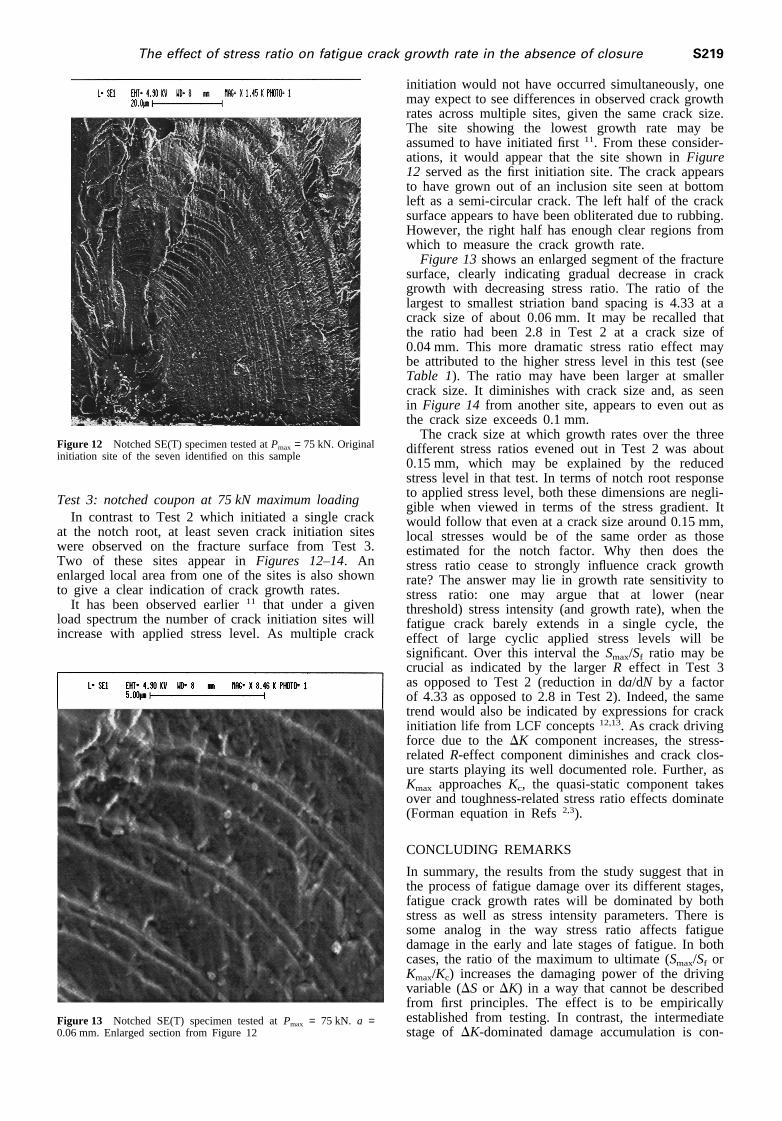
Figure 12 Notched SE(T) specimen tested atPmax = 75 kN. Originalinitiation site of the seven identified on this sample
Test 3: notched coupon at 75 kN maximum loadingIn contrast to Test 2 which initiated a single crack
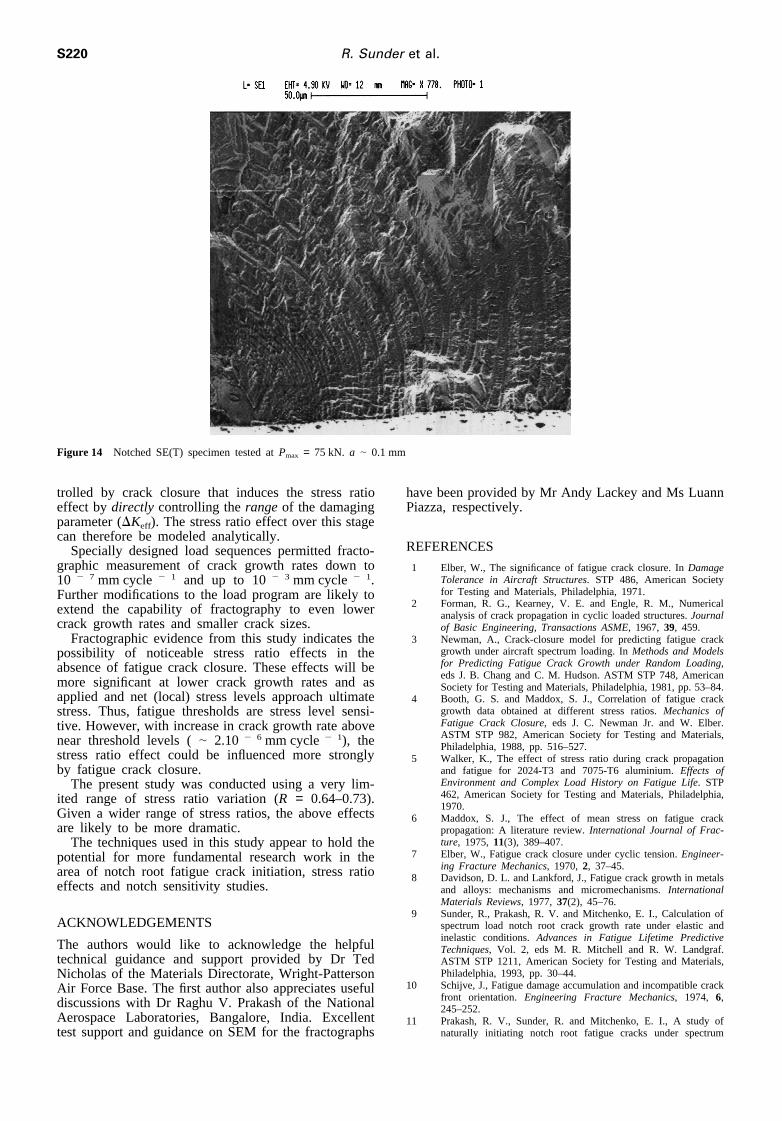
at the notch root, at least seven crack initiation siteswere observed on the fracture surface from Test 3.Two of these sites appear inFigures 12–14. Anenlarged local area from one of the sites is also shownto give a clear indication of crack growth rates.
It has been observed earlier11 that under a givenload spectrum the number of crack initiation sites willincrease with applied stress level. As multiple crack
Figure 13 Notched SE(T) specimen tested atPmax = 75 kN. a =0.06 mm. Enlarged section from Figure 12
initiation would not have occurred simultaneously, onemay expect to see differences in observed crack growthrates across multiple sites, given the same crack size.The site showing the lowest growth rate may beassumed to have initiated first11. From these consider-ations, it would appear that the site shown inFigure12 served as the first initiation site. The crack appearsto have grown out of an inclusion site seen at bottomleft as a semi-circular crack. The left half of the cracksurface appears to have been obliterated due to rubbing.However, the right half has enough clear regions fromwhich to measure the crack growth rate.
Figure 13shows an enlarged segment of the fracturesurface, clearly indicating gradual decrease in crackgrowth with decreasing stress ratio. The ratio of thelargest to smallest striation band spacing is 4.33 at acrack size of about 0.06 mm. It may be recalled thatthe ratio had been 2.8 in Test 2 at a crack size of0.04 mm. This more dramatic stress ratio effect maybe attributed to the higher stress level in this test (seeTable 1). The ratio may have been larger at smallercrack size. It diminishes with crack size and, as seenin Figure 14 from another site, appears to even out asthe crack size exceeds 0.1 mm.
The crack size at which growth rates over the threedifferent stress ratios evened out in Test 2 was about0.15 mm, which may be explained by the reducedstress level in that test. In terms of notch root responseto applied stress level, both these dimensions are negli-gible when viewed in terms of the stress gradient. Itwould follow that even at a crack size around 0.15 mm,local stresses would be of the same order as thoseestimated for the notch factor. Why then does thestress ratio cease to strongly influence crack growthrate? The answer may lie in growth rate sensitivity tostress ratio: one may argue that at lower (nearthreshold) stress intensity (and growth rate), when thefatigue crack barely extends in a single cycle, theeffect of large cyclic applied stress levels will besignificant. Over this interval theSmax/Sf ratio may becrucial as indicated by the largerR effect in Test 3as opposed to Test 2 (reduction in da/dN by a factorof 4.33 as opposed to 2.8 in Test 2). Indeed, the sametrend would also be indicated by expressions for crackinitiation life from LCF concepts12,13. As crack drivingforce due to theDK component increases, the stress-relatedR-effect component diminishes and crack clos-ure starts playing its well documented role. Further, asKmax approachesKc, the quasi-static component takesover and toughness-related stress ratio effects dominate(Forman equation in Refs2,3).
CONCLUDING REMARKS
In summary, the results from the study suggest that inthe process of fatigue damage over its different stages,fatigue crack growth rates will be dominated by bothstress as well as stress intensity parameters. There issome analog in the way stress ratio affects fatiguedamage in the early and late stages of fatigue. In bothcases, the ratio of the maximum to ultimate (Smax/Sf orKmax/Kc) increases the damaging power of the drivingvariable (DS or DK) in a way that cannot be describedfrom first principles. The effect is to be empiricallyestablished from testing. In contrast, the intermediatestage ofDK-dominated damage accumulation is con-
S220 R. Sunder et al.
Figure 14 Notched SE(T) specimen tested atPmax = 75 kN. a | 0.1 mm
trolled by crack closure that induces the stress ratioeffect bydirectly controlling therangeof the damagingparameter (DKeff). The stress ratio effect over this stagecan therefore be modeled analytically.
Specially designed load sequences permitted fracto-graphic measurement of crack growth rates down to10 2 7 mm cycle 2 1 and up to 102 3 mm cycle2 1.Further modifications to the load program are likely toextend the capability of fractography to even lowercrack growth rates and smaller crack sizes.
Fractographic evidence from this study indicates thepossibility of noticeable stress ratio effects in theabsence of fatigue crack closure. These effects will bemore significant at lower crack growth rates and asapplied and net (local) stress levels approach ultimatestress. Thus, fatigue thresholds are stress level sensi-tive. However, with increase in crack growth rate abovenear threshold levels (| 2.10 2 6 mm cycle2 1), thestress ratio effect could be influenced more stronglyby fatigue crack closure.
The present study was conducted using a very lim-ited range of stress ratio variation (R = 0.64–0.73).Given a wider range of stress ratios, the above effectsare likely to be more dramatic.
The techniques used in this study appear to hold thepotential for more fundamental research work in thearea of notch root fatigue crack initiation, stress ratioeffects and notch sensitivity studies.
ACKNOWLEDGEMENTS
The authors would like to acknowledge the helpfultechnical guidance and support provided by Dr TedNicholas of the Materials Directorate, Wright-PattersonAir Force Base. The first author also appreciates usefuldiscussions with Dr Raghu V. Prakash of the NationalAerospace Laboratories, Bangalore, India. Excellenttest support and guidance on SEM for the fractographs
have been provided by Mr Andy Lackey and Ms LuannPiazza, respectively.
REFERENCES
1 Elber, W., The significance of fatigue crack closure. InDamageTolerance in Aircraft Structures. STP 486, American Societyfor Testing and Materials, Philadelphia, 1971.
2 Forman, R. G., Kearney, V. E. and Engle, R. M., Numericalanalysis of crack propagation in cyclic loaded structures.Journalof Basic Engineering, Transactions ASME, 1967, 39, 459.
3 Newman, A., Crack-closure model for predicting fatigue crackgrowth under aircraft spectrum loading. InMethods and Modelsfor Predicting Fatigue Crack Growth under Random Loading,eds J. B. Chang and C. M. Hudson. ASTM STP 748, AmericanSociety for Testing and Materials, Philadelphia, 1981, pp. 53–84.
4 Booth, G. S. and Maddox, S. J., Correlation of fatigue crackgrowth data obtained at different stress ratios.Mechanics ofFatigue Crack Closure, eds J. C. Newman Jr. and W. Elber.ASTM STP 982, American Society for Testing and Materials,Philadelphia, 1988, pp. 516–527.
5 Walker, K., The effect of stress ratio during crack propagationand fatigue for 2024-T3 and 7075-T6 aluminium.Effects ofEnvironment and Complex Load History on Fatigue Life. STP462, American Society for Testing and Materials, Philadelphia,1970.
6 Maddox, S. J., The effect of mean stress on fatigue crackpropagation: A literature review.International Journal of Frac-ture, 1975, 11(3), 389–407.
7 Elber, W., Fatigue crack closure under cyclic tension.Engineer-ing Fracture Mechanics, 1970, 2, 37–45.
8 Davidson, D. L. and Lankford, J., Fatigue crack growth in metalsand alloys: mechanisms and micromechanisms.InternationalMaterials Reviews, 1977, 37(2), 45–76.
9 Sunder, R., Prakash, R. V. and Mitchenko, E. I., Calculation ofspectrum load notch root crack growth rate under elastic andinelastic conditions.Advances in Fatigue Lifetime PredictiveTechniques, Vol. 2, eds M. R. Mitchell and R. W. Landgraf.ASTM STP 1211, American Society for Testing and Materials,Philadelphia, 1993, pp. 30–44.
10 Schijve, J., Fatigue damage accumulation and incompatible crackfront orientation. Engineering Fracture Mechanics, 1974, 6,245–252.
11 Prakash, R. V., Sunder, R. and Mitchenko, E. I., A study ofnaturally initiating notch root fatigue cracks under spectrum

S221The effect of stress ratio on fatigue crack growth rate in the absence of closure
loading. In Advances in Fatigue Lifetime Predictive Techniques,Vol. 3, eds M. R. Mitchell and R. W. Landgraf. ASTM STP1292, American Society for Testing and Materials, Philadelphia,1995, pp. 136–160.
12 Manson, S. S. and Muralidharan, U., A single expression formula
for inverting strain–life and stress–strain relationships.Fatigueand Fracture of Engineering Materials and Structures, 1987,9(5), 343–356.
13 Morrow, J. D., Fatigue properties of metals. InFatigue DesignHandbook, Section 3.2. Society of Automotive Engineers, 1968.