Crack Propagation Directions in Unfilled Resins
11
http://jdr.sagepub.com/ Journal of Dental Research http://jdr.sagepub.com/content/77/11/1864 The online version of this article can be found at: DOI: 10.1177/00220345980770110201 1998 77: 1864 J DENT RES G. Baran, K. Sadeghipour, S. Jayaraman, D. Silage, D. Paul and K. Boberick Crack Propagation Directions in Unfilled Resins Published by: http://www.sagepublications.com On behalf of: International and American Associations for Dental Research can be found at: Journal of Dental Research Additional services and information for http://jdr.sagepub.com/cgi/alerts Email Alerts: http://jdr.sagepub.com/subscriptions Subscriptions: http://www.sagepub.com/journalsReprints.nav Reprints: http://www.sagepub.com/journalsPermissions.nav Permissions: http://jdr.sagepub.com/content/77/11/1864.refs.html Citations: What is This? - Nov 1, 1998 Version of Record >> by guest on October 13, 2011 For personal use only. No other uses without permission. jdr.sagepub.com Downloaded from
Transcript of Crack Propagation Directions in Unfilled Resins

http://jdr.sagepub.com/Journal of Dental Research
http://jdr.sagepub.com/content/77/11/1864The online version of this article can be found at:
DOI: 10.1177/00220345980770110201
1998 77: 1864J DENT RESG. Baran, K. Sadeghipour, S. Jayaraman, D. Silage, D. Paul and K. Boberick
Crack Propagation Directions in Unfilled Resins
Published by:
http://www.sagepublications.com
On behalf of:
International and American Associations for Dental Research
can be found at:Journal of Dental ResearchAdditional services and information for
http://jdr.sagepub.com/cgi/alertsEmail Alerts:
http://jdr.sagepub.com/subscriptionsSubscriptions:
http://www.sagepub.com/journalsReprints.navReprints:
http://www.sagepub.com/journalsPermissions.navPermissions:
http://jdr.sagepub.com/content/77/11/1864.refs.htmlCitations:
What is This?
- Nov 1, 1998Version of Record >>
by guest on October 13, 2011 For personal use only. No other uses without permission.jdr.sagepub.comDownloaded from

J Dent Res 77(11): 1864-1873, November, 1998
Crack Propagation Directionsin Unfilled ResinsG. Baranl*, K. Sadeghipour2, S. Jayaraman2, D. Silage2, D. Paul3, and K. Boberick'
'School of Dentistry and 2College of Engineering, Temple University, 3223 N. Broad St., Philadelphia, Pennsylvania 19140; 3Synthes, Malvem,Pennsylvania 19301,USA
Abstract. Posterior composite restorative materials undergoaccelerated wear in the occlusal contact area, primarilythrough a fatigue mechanism. To facilitate the timelydevelopment of new and improved materials, a predictivewear model is desirable. The objective of this study was todevelop a finite element model enabling investigators topredict crack propagation directions in resins used as thematrix material in composites, and to verify thesepredictions by observing cracks formed during the pin-on-disc wear of a 60:40 BISGMA:TEGDMA resin and anEBPADMA resin. Laser confocal scanning microscopy wasused to measure crack locations. Finite element studies weredone by means of ABAQUS software, modeling a cylindersliding on a material with pre-existing surface-breakingcracks. Variables included modulus, cylinder/materialfriction coefficient, crack face friction, and yield behavior.Experimental results were surprising, since most crackdirections were opposite previously published observations.The majority of surface cracks, though initially orthogonalto the surface, changed direction to run 20 to 300 from thehorizontal in the direction of indenter movement. Finiteelement modeling established the importance of subsurfaceshear stresses, since calculations provided evidence thatcracks propagate in the direction of maximum KII(O), in thesame direction as the motion of the indenter, and at an angleof approximately 200. These findings provide thefoundation for a predictive model of sliding wear in unfilledglassy resins.
Key words: cracks, resins, composites, modeling, finiteelement.
Received January 17, 1997; Last Revision December 10, 1997;Accepted February 5, 1998
Introduction
For restorative dental composites, an area of concern relatedto the longevity of posterior restorations has been the wearbehavior of the material (Willems et al., 1993; Taylor et al.,1994). Because the materials are intended for many years ofservice, there is interest in developing acceleratedlaboratory and clinical test protocols. Many studies haveattempted to correlate physical and mechanical propertiesof materials with their wear behavior, and some havesucceeded in predicting the relative wear performance ofmaterials in clinical settings using a fracture mechanicsapproach (Truong and Tyas, 1988; Truong et al., 1990). Stillothers have utilized statistical approaches to predictingwear lifetimes (van der Varst et al., 1991, 1993).
Two distinct wear regimes are recognized: one in theocclusal contact area, the other in the contact-free area (Lutzet al., 1984). The greatest depth of composite wear occurs inthe more highly stressed occlusal contact area. Wear here isbelieved to occur primarily through a fatigue mechanism,whereby a pre-existing flaw grows into a crack whichpropagates under the influence of cyclic occlusal stresses.Pin-on-disc testing has been used to simulate wear duringsliding cuspal contact (McKinney and Wu, 1982; Wassell etal., 1994).
The direction of crack propagation strongly influencesthe wear process by affecting the location and therefore thetime for crack intersection and debris generation. Previousanalytical studies of crack propagation directions in slidingcontact have all assumed elastic (Hertzian) contact betweenthe indenter and the half-space below. Five interactionmechanisms for a two-crack configuration under slidingcontact were identified that depended on the distancebetween the cracks, the position of the loading zone, anddifferent combinations of shear (mode II) and tensile (modeI) stresses acting on the system (Dubourg and Villechaise,1992). Significant changes in the modes I and II stressintensity factors are due to load transfer between cracks
1864 by guest on October 13, 2011 For personal use only. No other uses without permission.jdr.sagepub.comDownloaded from

Crack Directions in Resins
Table. Description and properties of experimental materials
Degree of Elastic Modulus 0.1% Yield Strengthc Crack Angled (degrees)Sample Namea Conversion (%)b (GPa) (N = 12) (MPa) (N = 12) (N = 30-40)
B1 75 3.1 ± 0.1 30.7 ± 4AA 28 + 5B2 92 4.1 ± 0.3 42.6 ± 3.2B 26 + 4B2skd 92 1.4 ± 0.2 9.9 ±1.2 28 ± 7B4 93 3.5 +0.4 38.4 ±3.1B 24 +5El 72 2.0 ± 0.2 17.5 ±1.0 27 + 6E 91 2.8 + 0.2 28.5 ± 13A 21 +5
a B1 was polymerized at 65°C for 1 hr in an oil bath. B2, B2skd, B4, and E2 were polymerized as follows: 1 hr in oil bath at 70'C, then 24 hrsat 100°C. Sample E1 was polymerized by being heated at 55°C for 68 hr. Sample B2Skd was placed in a 50:50 ethanol:water solution andexperienced a 12% weight gain when soaked to equilibrium.
b Degree of conversion obtained by FT-Raman spectroscopy as described by Shin et al. (1993).c For yield strength, data were first compared by ANOVA; upper-case superscript letters identify data subsets whose means do not differ
at p < 0.05 when compared by Bonferroni's post hoc procedure utilizing the t distribution (Minitab, 1994).d No significant differences were found between the means of crack angle measurements evaluated by ANOVA for p < 0.05.
(Dubourg et al., 1992). For the case of surface crackpropagation in a rotating inner raceway of high-speed rollerbearings, the boundary integral method was used, and theeffect of the varying mean stress elucidated by consideringthe crack driving force to be the product of the mean stressintensity factor times the range (Ghosn, 1988). Followingthis approach, vertical surface-breaking cracks of lengthequal to the half-contact width will propagate at an angle of71° from the vertical opposing the roller direction. In a studyof vertical surface cracks in a non-lubricated, two-dimensional, layered medium subject to normal and slidingHertzian loads, negative values of KI were found for anycylinder location with respect to the crack (Eberhardt andPeri, 1995). Numerical analysis of horizontal subsurface andsurface-breaking vertical cracks in an elastic half-spaceloaded by Hertzian contact stresses indicated that the crackswould follow the path of maximum normal stress andpropagate away from the direction of sliding at an angle ofapproximately 69° (Keer et al., 1982).
The J-integral approach has also been used to investigatethe influence of crack depth and the crack tip plasticity ofvertical surface cracks on crack propagation (Sadeghipour etal., 1996). Results suggest that the appearance of surfacecracks inclined closer to the horizontal is due to an increasein crack tip plastic deformation. Analysis of near-surfacecracks in metals (ductile materials) assumes that these areshear cracks driven by plastic strain rather than elastic stressenergy (Johnson, 1995).
The purpose of this study was to model the non-proportional loading occurring during sliding contact, andto ascertain the role of Mode I and Mode II types of loadingduring sliding. Thus, the stress intensity (K) approach wasused.
Materials and methods
Laboratory studiesThe experimental materials are shown in the Table, togetherwith their mechanical properties and the method of their
preparation. Briefly, the "B" series of materials consisted of a60:40 wt% mixture of bisphenol A glycidyl methacrylate:triethylene glycol dimethacrylate with 1% benzoyl peroxideadded as a catalyst for heat-curing (Baran et al., 1994). Forsample B4, 3 vol% of colloidal silica (OX50, Degussa, RidgefieldPark, NJ) was added. Sample B2Skd was identical to sample B2,but was soaked in a 50:50 ethanol:water mixture to equilibriumweight gain. The "E" series of materials consisted ofethoxylated bisphenol A glycidyl methacrylate with 1% benzoylperoxide. All resin materials were provided by ESSTECH(Essington, PA).
The elastic modulus in compression was obtained fromcylindrical specimens 6 mm in diameter and 25 mm long (Baranet al., 1994). Yield strengths were collected in tension fromdumbbell-shaped specimens having a central gauge section 3mm in diameter and 35 mm long (Baran et al., 1994). These datawere collected for comparison of the effects of differences incure and soaking on the mechanical properties of theexperimental materials.
Pin-on-disc tests were carried out with a 0.5-mm-diameterruby sphere sliding on discs of experimental materials at aneffective sliding rate of 60 mm/sec. The load on the sphericalindenter was 4.9 N. Discs were finished with 600-grit siliconcarbide paper, i.e., surface scratches could be up to 20 pm deep;however, subsequent measurements with a Scanning LaserConfocal Microscope (SLCM) showed the surfaces to have aprofile roughness Rq of less than 1.5 pm. Samples were insertedinto a six-station pin-on-disc wear machine and run for variouslengths of time to elicit surface crack formation and propaga-tion. The coefficient of friction was measured with strain gaugescemented onto the pins holding the ruby sphere, and calibratedfor the angular force measurements made during operationwhen the indenter was in contact with the material. Samplesremained secured in a sample holder that was screwed into atapped disc. The holder could be removed periodically to allowfor examination of the wear surface, and could then berepositioned at one of the six stations. Any misalignment of thereplaced holder would be evident during the next visualexamination, when an additional wear track would be present.Testing was stopped after a complete pitted wear track was
J Dent Res 77(11) 1998 1865
by guest on October 13, 2011 For personal use only. No other uses without permission.jdr.sagepub.comDownloaded from

J Dent Res 77(11) 1998
Indenter Motion
L
D - crack depth L - crack length 0 - crack propagation angle
Figure 1. Drawing of subsurface cracks with labels describingmethod of obtaining 0.
present; those times were approximately 30 min for B1, 2 hrs forB2skd, 3 hrs for B2, 3.3 hrs for B4, 40 min for E, and 3 hrs for E2.
Because visual examination of worn surfaces by reflectedlight microscopy revealed the presence of subsurface cracks,optical sectioning techniques were used to quantify thesefeatures, which would be useful for verification of the analyticalmodel. A laser scanning confocal microscope (SLCM) (LSM 410,Carl Zeiss Inc., Thornwood, NY) was used. Excitation wasprovided by a HeNe laser (633 nm, 0.5 mW), and a wide fieldobjective (LD Epiplan 5OX/0.50, Carl Zeiss Inc., Thornwood,NY) produced high-resolution (512 x 512, 8-bit pixels) digitalimages of scenes that were typically 204.8 pm2 (0.4-pmresolution). In some cases, fluorochromes such as propidiumiodide were used to enhance the surface-penetrating cracks andsubsurface voids in the worn samples. The performance andthree-dimensional calibration of the SLCM 410 were verified bymeasurement of a profile standard (STM-440A, VLSI Standards,Mountain View, CA). We made additional calibration testsamples by embedding fine transmission electron microscopesupport grids at defined angles into the surfaces of studymaterials, to establish limits for optical sectioning. Similarly,fine pinholes were introduced into samples of study materialsat defined angles to establish the ability of the laser to measurethe position of a void accurately. It was found that the beampenetrated more than 50 pm, and that sectioning could estimatethe boundary of the void to within 0.2 pm. We later usedarchival data to analyze the digital scene by measuring point-to-point distances (Global Lab Image, Data Translation, Marlboro,MA).
Serial optical sections were first obtained of tested wearspecimens (removed prior to development of extensive pitting)at 0.4-pm step sizes for assessment of the technique formeasuring subsurface features. The brightness and contrast ofthe digital scene were adjusted interactively. A subjective set offeatures was measured by definition of fiducial points as shownin Fig. 1. Total depth of penetration (D) is the observed maximallength of the subsurface voids that emanated from the crack.Maximum length (L) is the length from the midpoint of thesurface crack to an estimate of the maximal void along thebisected center line of the wear track at any level. The crack
a
b
Figure 2. (a) Finite element mesh including cylinder/indenter. (b)Finite element mesh in vicinity of vertical crack showing crackopening. The way of measuring 0 in the finite element model isalso diagrammed.
propagation angle 0 was determined from the direction of cracktip movement, as diagramed by the dashed lines in Fig. 1. From30 to 40 cracks were measured at each of several time intervalsfor each specimen.
Finite element studies
A two-dimensional finite element model was developed bymeans of the software package ABAQUS (HKS, Providence, RI).The pin-on-disc experiment was modeled as a cylinder slidingon a material with a surface-breaking vertical crack (as infinishing scratches). Surface cracks have also been observed onposterior composite restorations in vivo (Roulet, 1987). Fig. 2ashows the plane strain finite element model used for thispurpose. A closer view of the mesh adjacent to the crack tips isshown in Fig. 2b. The crack has a length of 2.5 pm and thecylinder a radius of 250 pm, for a radius/crack length ratio of100. This compares with the real dimensions of sphere radius of250 pm and surface roughness of 1.5 pm.
To avoid boundary effects on the deformation field abuttingthe crack tip, we used "infinite" elements (Zienkiewicz Ct al.,1983), implemented in ABAQUS, to cover the model boundary.We modeled the 1/r'/ singularity of the vertical crack tip byshifting the midpoint nodes of the eight-noded quadratic plane
1866 Baran et al.
by guest on October 13, 2011 For personal use only. No other uses without permission.jdr.sagepub.comDownloaded from
J Dent Res 77(11)1998 Crack Directions in Resins 1867
--- -
½
(a) (b)
- S
(c) (d)
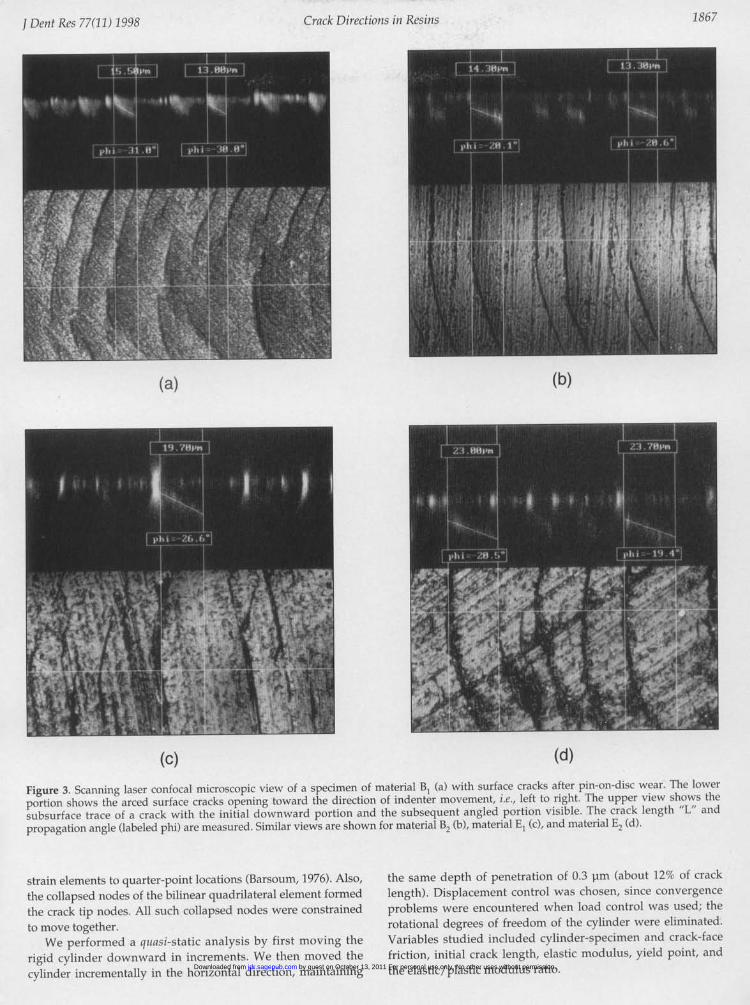
Figure 3. Scanning laser confocal microscopic view of a specimen of material Bl (a) with surface cracks after pin-on-disc wear. The lower
portion shows the arced surface cracks opening toward the direction of indenter movement, i.e., left to right. The upper view shows the
subsurface trace of a crack with the initial downward portion and the subsequent angled portion visible. The crack length "L" andpropagation angle (labeled phi) are measured. Similar views are shown for material B2 (b), material El (c), and material E (d).
strain elements to quarter-point locations (Barsoum, 1976). Also,the collapsed nodes of the bilinear quadrilateral element formedthe crack tip nodes. All such collapsed nodes were constrainedto move together.
We performed a qauasi-static analysis by first moving therigid cylinder downward in increments. We then moved thecylinder incrementally in the horizontal direction, maintaining
the same depth of penetration of 0.3 vim (about 12'S. of cracklength). Displacement control was chosen, since convergenceproblems were encountered when load control was used; therotational degrees of freedom of the cylinder were eliminated.Variables studied included cylinder-specimen and crack-facefriction, initial crack length, elastic modulus, yield point, andthe elastic/plastic modulus ratio. by guest on October 13, 2011 For personal use only. No other uses without permission.jdr.sagepub.comDownloaded from

J Dent Res 77(11) 1998
0.200
0.150
0.100
0.050
0.000
-0.050 L-
-0.100
-0.150 -
-0.200 K-40
lI I IlII I I I
-30 -20 -10 0 10 20 30
Cylinder Position (ptm)
Figure 4. Variation in KI and KII with cylinder location for an initial cracis located at position 0. The cylinder/surface friction coefficient is p1; crai
A plasticity model (Drucker and Prager, 1952) involving (i)pressure-dependent yield and (ii) different yield strengths intension and compression was used. Such behavior is charac-teristic of polymers. A detailed description of the model is givenin the ABAQUS manual (Hibbit et al., 1994). In the absence ofother data, the material angle of friction was taken as 450, andthe ratio of yield stress in tension to compression as 0.8. Thecoefficient of friction between the pin and materials understudy was found to be 0.18, and did not vary between materials.
The mode I and mode II stress intensity factors (KI and KII)were determined from the displacement of the quarter-pointnodes located behind the crack tip in the horizontal (U.) andvertical (Uy) directions (Salehizadeh and Saka, 1992). Thecorresponding equations are:
K = AU 4(1EV2) /7
KII =AUX 4(1-V2) L
(la)
(lb)
where E is the elastic modulus of the material, v is the Poisson'sratio (here taken to be 0.3), and L is the length of the crack tipelement.
Results
Wear experimentThe two types of cracks observed after pin-on-disc tests areshown schematically in Fig. 1. The dominant crack, in termsof both size and frequency (accounting for some 80% of all
KI -0KIICrack depth D = 3.5 pmFrictional coefficient g,L = 0.3Frictional coefficient gc = 0.3
Because experimental datashowed cracks initially
k depth of 3.5 pm. The crack propagating down andk face friction is pc. orthogonal to the specimen
surface, we first examined theeffect of crack length on stressintensity factors. Figs. 4 and 5
show the variation in KI and KII with cylinder position fortwo values of crack length: 3.5 and 1.5 pm. The effects ofchanges in coefficient of friction on stress intensity factorsare depicted in Figs. 5 to 8; we varied both the frictioncoefficient for indenter-surface contact and the crack facefriction coefficient. Reducing crack face friction (pc) from 0.3to 0.0 increases KII for cracks 1.5 pm deep that lie in front ofthe moving cylinder (Figs. 5-6). Increasing the coefficient ofcylinder-surface friction (p,) causes the crack tip toexperience tensile loading in the wake of the cylinder and inproportion to the increase in friction (Fig. 7). In contrast, Fig.8 shows that the crack tip experiences shear loading bothahead of and behind the moving cylinder; increases infriction cause an increase in K1I ahead of the cylinder, and adecrease in KII behind the cylinder. Results obtained whenthe elastic modulus was varied show that increasing themodulus from 3.8 GPa (Fig. 9) to 38 GPa (Fig. 10) increasesstress intensities at the crack tip. In Fig. 11, the effects ofchanging the elastic/plastic modulus ratio on both KI andKII are shown, while Fig. 12 shows the effect of changingyield strength by a factor of 10.
Discussion
Wear experimentExamination of worn samples showed arced cracks formingat the trailing edge of the sliding pin. This observation hasbeen made previously with inorganic glasses (Mouginot,1987). Studies have also shown that subsurface cracks maypropagate in opposite directions, i.e., a few cracks propagatein the direction of indenter movement, while the great
cracks), is one that propagatesin the direction of indentermotion. Fig. 3 shows cross-section views of specimens ofB1, B2/ E1, and E2 obtained byconfocal microscopy whichvalidate the schematic drawingshown in Fig. 1. The profiles inthe "z" direction show thesubsurface aspects of the arcedcracks seen on the samplesurface. Representative cracksare shown with their measuredlength and crack propagationangles. The average crackpropagation angles for theexperimental materials aregiven in the Table.
40 Finite element studies
1868 Baran et al.
by guest on October 13, 2011 For personal use only. No other uses without permission.jdr.sagepub.comDownloaded from

Crack Directions in Resins
majority of cracks propagate inthe direction away fromindenter movement (Lawn etal., 1984). However, here weobserve that the majority ofcracks propagate in the direc-tion of indenter movement.These different observationscould be explained by thedifference in scale; with theresins studied here, crackspenetrated to approximately 20pm, rather than some 200 to 300pm below the surface (Lawn,1983). It is interesting too thatthe angle formed by the crackas it turns in the direction ofindenter movement rangesfrom 20 to 300 for all materialsstudied, even though themoduli and yield strengthsdiffer between several of thematerials.
0.100- KI KII
Crack depthD= 1.5 gm0.050 Frictional coefficient , = 0.3Frictional coefficient gc 0.3
0.000
-0.050
-0.100-40 -30 -20 -10 0 10 20 30 40
Cylinder Position (pm)
Figure 5. Variation in KI and KII with cylinder location for an initial crack depth of 1.5 pm. The crackis located at position 0. The cylinder/surface friction coefficient is p,; crack face friction is pc
Finite element modelAssuming that the vertical surface crack forms an infini-tesimal kink at an angle 0 from the crack plane (Anderson,1995), the variation of the modes I and II stress intensityfactors with angle 0, measured in the counterclockwisedirection ahead of the crack tip, is given by (Ghosn, 1988):
KI(0) = K,cos3(o) 3KIIsin(2)cos2Q()
KII(0) = K,sin(2) COS2(2) + K11Cos(') (1 - 3sin2(2))
Fig. 13 depicts these equationsgraphically for cracks behindthe sliding cylinder. When oneinterprets this Fig. to find thepreferred propagation angle, itis useful to realize that thecurve's maxima and minimaare somewhat flat, and so awide variation in anglecorresponds to only a smallvariation in K11(0). In Fig. 13, forexample, the maximum valueof KII(0) is found at 700, yet a
range of angle from 60° to 800implies a narrow range of K11(0)of 0.36 to 0.375, i.e., a dif-ferenceof approximately 4%.
It is important to ascertainthe driving force behind thepropagation of vertical surfacecracks in these materials. Asillustrated in Figs. 4 and 5,
Cl
S4
0.200
0.150
0.100
0.050
0.000
-0.050
-0.100
(2a)
(2b)
when the crack depth is low, the crack tip experiences shearat the leading edge of the cylinder, and significant ten-sionin the wake of the cylinder. Because we know that the crackinitiates behind the cylinder, we use Fig. 14 to obtain thepreferred crack propagation angle, and find that KI ismaximum at 0 = 0°. That is, for short cracks, the greateststresses are tensile, and the crack continues to propagatedirectly downward and orthogonal to the specimen surface.As the crack depth increases-for example, from 1.5 to 3.5pm-the stress intensity factor with the greatest magnitudeis KII for the crack, regardless of its location: before or
-0.150 - i-0.200 I, I, I I I, I,
-40 -30 -20 -10 0 10 20 30 40
Cylinder Position (gm)Figure 6. Variation in KI and KII with cylinder location after decreasing crack-face friction coefficient(pc = 0). The cylinder/surface friction coefficient is pl.
J Dent Res 77(11) 1998 1869
by guest on October 13, 2011 For personal use only. No other uses without permission.jdr.sagepub.comDownloaded from

J Dent Res 77(11) 1998
0.200
0.150 H
0.100 e-
0.050
0.000
-0.050
-0.100
-0.150
-0.200-40 -30 -20 -10 0 10
Cylinder Position ( pm)
Figure 7. Variation in KI with cylinder location for three values of cfriction (I). The crack face friction coefficient is pc.
behind the sliding cylinder. Consulting Fig. 13 for thepreferred crack propagation angle, we find that K11(0) ismaximum at approximately 0 = 700 from the vertical, or at200 from the horizontal. To summarize, shallow surfacecracks in unfilled matrix resins studied here propagateorthogonal to the surface until some depth where themagnitude of KII exceeds that of KI, and then the crack ispredicted to propagate at an angle of 200 from the
0.300
0.200
0.100
0.000
-0.100
-0.200
A---- Pg0.2; gc=o
---A-- gr-0.3; glc=o
-0.300 Il I I II I
-40 -30 -20 -10 0 10
Cylinder Position ( um)
Figure 8. Variation in KII with cylinder location for three values of cfriction (p,). The crack face friction coefficient is pc
ylinc
friction in the case of slidingcontact, and the analysis
predicts that Hertzian cracks that propagate away from thedirection of sliding tend to be closer to the vertical with anincrease in contact friction.
It is important to highlight the differences betweenLawn's analysis and the present study. The modeldeveloped in the present study is realistic in that: (i) thehalf-space is elastoplastic; (ii) a rigid indenter is in contactwith the half-space, obviating the need to assume perfectly
elastic indenter-materialcontact; and (iii) crack facefriction is considered. Thepresent study also assumespre-existing vertical surfaceflaws and does not considerthe effects of contact frictionon crack initiation. Second,Lawn's analysis is for cracksthat propagate normal to themaximum tensile stress,while the analysis done hereindicates that cracks in thematerials under studypropagate along lines ofmaximum shear. Also, asseen in Figs. 4 to 12, thevertical surface crack underconsideration experiencesnon-proportional loading, i.e.,KI is present when KII is
20 30 40 absent, and vice versa. Thus,although material-indentercontact friction introduces
:ylinder-surface coefficient of tensile fields at the crack tip,maximizing K,1(0) (Eq. 2b)
- , ---~c.:Ix*.
@ P4I=O.0; gc=0
- -+ jLFi0.2; jC=O
--A--- pi=0.3; pC=0
,II I I
horizontal. This prediction isverified by experiment.
In prior studies by otherinvestigators, they describedthe formation of cone cracksby considering a linear elastichalf-space subject to a normalpoint load. Since cracks inbrittle materials propagate onpaths normal to the greatesttensile stresses, such conecracks tend to initiate on theU22- 33 principal stresstrajectory, where oril . O22 2(r33 (Lawn and Wilshaw,1975). In the case of conecrack formation in soda-limeglass from normal loading of
l a cylindrical punch (Roesler,20 30 40 1956), the u22-033 surface
forms an angle of 220 to thefree surface (Lawn, 1993).
ler-surface coefficient of Lawn et al. (1984) have alsoconsidered the effect of
1870 Baran et al.
42. - .Lr-o.0; gc=o
by guest on October 13, 2011 For personal use only. No other uses without permission.jdr.sagepub.comDownloaded from

Crack Directions in Resins
will not yield 0 values that aredependent on contact friction.
In this study, we haveshown how a predictive finiteelement model of vertical-surface-breaking cracks inunfilled dental resins explainsunexpected experimentalobservations by finding thatcracks propagate in thedirection of maximum shearwhen subjected to slidingloads. The maximum shearcondition explains the presenceof cracks at the trailing edge ofindenter propagating in thedirection of sliding. Theexperimental findings of twocrack populations withdifferent propagation direc-tions provide a scenario forwear: The intersection of suchcracks leads to freeing ofvolumes of material which arethen lost. The influences ofcrack density, the presence offillers, and the matrix-filler
0.015
0.010
/--l
ECd
9)-.
.4C18.4
0.005
0.000
-0.005
-0.010
-0.015-4*0 -30 -20 -10 0 10 20 30 40
Cylinder Position (pm)
Figure 9. Variation in KI and KII with cylinder location for a crack depth of 2.5 pm and a reducedmaterial elastic modulus of 3.8 GPa. The cylinder/surface friction coefficient is 1I; crack face frictionisPC.
interphase on crack propagation directions are presumed tobe significant and are the subjects of ongoing research.
From a materials design point of view, it is interesting tonote that the finite element model predicts that the pre-ferred crack propagation angle does not vary significantlywith changes in material modulus, yield strength, orplastic/elastic modulus ratio.These findings are in closeagreement with experiments 0.150where crack propagation anglesdo not vary significantly with - Crack depchanges in composition, degree Frictionalof cure, or after soaking. Elastic mcChanging indenter/material ccoefficient of friction and crack g 0face friction likewise did not -affect crack propagation angle. > 0.000Strategies for materials designto reduce wear in unfilled -resins might include reducing 0.050-the magnitudes of K1 and KII toreduce the driving force forsubsurface crack propagation. -0.100The analytical data predict thatlowering of KII will occur withan increase in crack face -0.150friction, so that increases in -40 -30crack path tortuosity thathinder sliding of the crack facesurfaces should reduce themode II stress intensity. Theseeffects may be achieved Figure 10. Variation in KI1through m icrostructural modulus of 38 GPa. The cylithrough microstructural
control, as has been done with ceramic materials (Padtureand Lawn, 1994). The data also show that reducing materialmodulus will lower stress intensity factors, but thatchanging the yield behavior and elastic/plastic modulusratio does not significantly influence stress intensity factorsat the crack lengths studied here.
-20 -10 0 10 20 30 40
Cylinder Position (,m)
and KII with cylinder location for a crack depth of 2.5 pm and elasticinder/surface friction coefficient is pl; crack face friction is Pc.
-A KI ---KIICrack depth D = 2.5 WmFrictional coefficients kI = pc = 0.3Elastic modulus E= 0. I E0
KI O KII)thD=2.5 [icoefficients AI = gc = 0.3Ddulus = Eo
I
1871J Dent Res 77(11) 1998
by guest on October 13, 2011 For personal use only. No other uses without permission.jdr.sagepub.comDownloaded from

J Dent Res 77(11) 19981872 Baran et al.
0.200
0.150 k-
- - -*- -
t i4;
I/
I ;II
a .I,
K-- --. K
---- K---4-K
I-40 -30 -20 -10 0 10
Cylinder Position ( pium)
Figure 11. Variation in KI and KII with location of sliding cyli-nder for two va
modulus ratio (M/E).
0.200
-0.150 -
-0.200 --40
.I
-30 -20 -10 0 10
Cylinder Position ( gm)Figure 12. Variation in KI and KII with location of sliding cylinder for two va]
LaNAcknowledgmentsThis investigation was supported in part by USPHS LaNResearch Grant DE-09530 from the National Institute ofDental Research, National Institutes of Health, Bethesda, MD20892. Lu
The dental resin was kindly supplied by GeorgeCowperthwaite of ESSTECH Corporation, in Essington, PA.
0.100
wn BR, Wilshaw TR (1975). Indentation fracture: principlesand applications. J Mater Sci 10:1049-1081.
wn BR, Wiederhorn SM, Roberts DE (1984). Effect of slidingfriction forces on the strength of brittle materials. J Mater Sci19:2561-2569.
.tz F, Phillips RW, Roulet JF, Setcos JC (1984). In vivo and invitro wear of potential posterior composites. J Dent Res63:914-920.
0.050
0.000
-0.050
-0.100
-0.150
-0.200
0.150 -
0.100 -
0.050
0.000
-0.050
-0.100 1 / {K11 ,1
/ -----K].; - O K
I-. -l I
,,-IN"I
ECd0.4
"P
..-I
.41Q.d.4
- 1- 1- 1-
-- --Pt
ReferencesAnderson TL (1995). Fracture
mechanics. 2nd ed. BocaRaton, FL: CRC Press Inc.
Barsoum RS (1976). On the useof isoparametric finiteelements in linear fracturemechanics. Int J NumerMeth Eng 10:25-37.
Drucker DC, Prager W (1952).Soil mechanics and plastic
/E = 0.95 analysis or limit design. Q64;ME 09 Appi Math 10:157-165.
Lil; M/E = 0.95 Dubourg MC, Villechaise B
;I M/E = 0.85 (1992). Analysis of mul-
M;/E = 0.85 tiple fatigue cracks-Part6.11NUE .85I: Theory. I Tribology114:455-461.
l lDubourg MC, Godet M,20 30 40 Villechaise B (1992). Ana-
lysis of multiple fatiguecracks-Part II: Results. J
ilues of the plastic/elastic Tribology 114:462-468.Eberhardt AW, Peri S (1995). A
vertical surface breakingcrack in normal andsliding joint contact. JBiomech Eng 117:153-155.
Ghosn LJ (1988). Analysis ofcrack propagation in rollerbearings using theboundary integral equation-A mixed mode loadingproblem. Trans AIME JTribology 110:408-413.
Hibbitt, Karlsson, Sorensen,Inc. (1994). ABAQUS v.5.4. Providence, Rhode
;a0 =10GaIsland.[I; ao 1.0 GPa Johnson KL (1995). Contact
mechanics and the wear of[ao 10.0 GPa metals. Wear 190:162-170.
II ; = 10.0 GPa Keer LM, Bryant MD, Haritoso *GK (1982). Subsurface and
-,surface cracking due to
20 30 40 Hertzian contact. ASME JLubrication Tech 104:347-351.
Lawn BR (1993). Fracture oflues of yield strength (ar). brittle solids. 2nd ed.
Cambridge, England:Cambridge UniversityPress.
I
by guest on October 13, 2011 For personal use only. No other uses without permission.jdr.sagepub.comDownloaded from

J Dent Res 77(11) 1998
McKinney JE, Wu W (1982).Relationship betweensubsurface damage andwear of dental restorativecomposites. J Dent Res61:1083-1088.
Minitab, Inc. (1994). MinitabRelease 10. State College,PA: Minitab, Inc.
Mouginot R (1987). Crackformation beneath slidingspherical punches. J MaterSci 22:989-1000.
Padture NP, Lawn BR (1994).Toughness properties of asilicon carbide with an insitu induced hetero-geneous grain structure. JAm Ceram Soc 77:2518-2522.
Roesler FC (1956). Brittlefractures near equilibrium.Proc Phys Soc Lond69(B):981-992.
Roulet JF (1987). Mechanismsof degradation. In:Degradation of dentalpolymers. Basel: Karger,pp. 60-90.
1873Crack Directions in Resins
1.00
0.80 KI
.,0.60
0.40
: 0.20 K1'
_ 0.00
Trailing edge crack-0.20 (KI(9) > 0; KII(O) 0)-0.40
-200 -150 -100 -50 0 50 100 150 200
0 (Deg.)
Figure 13. Graphical representation solving Eqs. 2a and 2b for the situation when the cylinder has
traversed beyond the crack and KI(0) > 0. The plot shows a maximum for KII at 0 = 700 from the
vertical, equivalent to 200 from the horizontal, and a maximum for KI at 0 = 0° from the vertical, or
down and orthogonal to the surface.
Sadeghipour K, Baran GR, Fu Z, Jayaraman 5 (1996). Finite
element modeling of crack propagation in elastic-plasticmedia. Part I: Vertical surface breaking cracks. l Mater Sci
31:3167-3172.Salehizadeh H, Saka N (1992). Crack propagation in rolling line
contacts. Trans AIME J Tribology 114:690-697.Shin WS, Li XF, Schwartz B, Wunder SL, Baran GR (1993).
Determination of the degree of cure of dental resins usingRaman and FT-Raman spectroscopy. J Dent Res 9:317-324.
Taylor DF, Bayne SC, Leinfelder KF, Davis S, Koch GG (1994).Pooling of long-term clinical wear data for posteriorcomposites. Am I Dent 7:167-174.
Truong VT, Tyas MJ (1988). Prediction of in vivo wear in
posterior composite resins: a fracture mechanics approach.Dent Mater 4:318-327.
Truong VT, Cock DJ, Padmanathan M (1990). Fatigue crack
propagation in posterior dental composites and predictionof clinical wear. J Appl Biomater 1:21-30.
van der Varst PGT, Lemmens PLM, Peters MC, Plasschaert AJ(1991). Estimation of the mechanical lifetime of dental
restorations: method and preliminary results. I Biomechan24:341-347.
van der Varst PGT, Brekelmans WA, de Vree JH, de Groot R
(1993). Mechanical performance of a dental composite:probabilistic failure prediction. J Dent Res 72:1249-1256.
Willems G, Lambrechts P, Braem M, Vanherle G (1993). Three-
year follow-up of five posterior composites: in vivo wear. JDent 21:74-78.
Zienkiewicz OC, Emsom C, Bettess P (1983). A novel boundaryinfinite element. Int J Numer Meth Eng 19:393-404.
by guest on October 13, 2011 For personal use only. No other uses without permission.jdr.sagepub.comDownloaded from