Controls on the composition and lability of dissolved organic matter in Siberia's Kolyma River basin
15
Controls on the composition and lability of dissolved organic matter in Siberia’s Kolyma River basin P. J. Mann, 1 A. Davydova, 2 N. Zimov, 2 R. G. M. Spencer, 1 S. Davydov, 2 E. Bulygina, 1 S. Zimov, 2 and R. M. Holmes 1 Received 30 June 2011; revised 18 November 2011; accepted 22 December 2011; published 3 March 2012. [1] High-latitude northern rivers export globally significant quantities of dissolved organic carbon (DOC) to the Arctic Ocean. Climate change, and its associated impacts on hydrology and potential mobilization of ancient organic matter from permafrost, is likely to modify the flux, composition, and thus biogeochemical cycling and fate of exported DOC in the Arctic. This study examined DOC concentration and the composition of dissolved organic matter (DOM) across the hydrograph in Siberia’s Kolyma River, with a particular focus on the spring freshet period when the majority of the annual DOC load is exported. The composition of DOM within the Kolyma basin was characterized using absorbance-derived measurements (absorbance coefficient a 330 , specific UV absorbance (SUVA 254 ), and spectral slope ratio S R ) and fluorescence spectroscopy (fluorescence index and excitation-emission matrices (EEMs)), including parallel factor analyses of EEMs. Increased surface runoff during the spring freshet led to DOM optical properties indicative of terrestrial soil inputs with high humic-like fluorescence, SUVA 254, and low S R and fluorescence index (FI). Under-ice waters, in contrast, displayed opposing trends in optical properties representing less aromatic, lower molecular weight DOM. We demonstrate that substantial losses of DOC can occur via biological (30% over 28 days) and photochemical pathways (>29% over 14 days), particularly in samples collected during the spring freshet. The emerging view is therefore that of a more dynamic and labile carbon pool than previously thought, where DOM composition plays a fundamental role in controlling the fate and removal of DOC at a pan-Arctic scale. Citation: Mann, P. J., A. Davydova, N. Zimov, R. G. M. Spencer, S. Davydov, E. Bulygina, S. Zimov, and R. M. Holmes (2012), Controls on the composition and lability of dissolved organic matter in Siberia’s Kolyma River basin, J. Geophys. Res., 117, G01028, doi:10.1029/2011JG001798. 1. Introduction [2] Arctic biomes contain up to an estimated 50% of the organic carbon stored in soils globally, which is predomi- nantly held within permafrost soils [Dittmar and Kattner, 2003; Tarnocai et al., 2009]. Hydrologic changes attrib- uted to climate change are already underway in the Arctic and include permafrost thaw, shorter snow cover duration and increasing freshwater discharge [Brown, 2000; Guo et al., 2007; McGuire et al., 2009; Peterson et al., 2002; Stone et al., 2002; Striegl et al., 2005; Wu et al., 2005]. The response of Arctic ecosystems to these changes has the potential to mobilize large terrestrial carbon pools and the ability to influence carbon fluxes both to the atmosphere and ocean. [3] Large quantities of dissolved organic carbon (DOC) are exported from land to the Arctic Ocean, via Arctic rivers, which deliver approximately 10% of the global river dis- charge [Dittmar and Kattner, 2003; Opsahl et al., 1999]. Arctic rivers exhibit a strong seasonality in discharge with maximum fluxes occurring during the spring thaw and flood event (or “freshet”), generally in the months of May and June. Increased DOC concentrations, associated with ele- vated discharge during this time, can lead to over 60% of the annual DOC flux occurring over this short period [Holmes et al., 2011; Raymond et al., 2007; Spencer et al., 2009a]. Historically, Arctic riverine DOC was thought refractory in nature owing largely to the apparent conservative mixing behavior observed across the Eurasian continental shelf [Amon and Meon, 2004; Cauwet and Sidorov, 1996; Gordeev et al., 1996] and from studies of its biochemical characteristics [Lobbes et al., 2000]. However, these studies were constrained to late summer after the retreat of sea ice in the coastal zone. More recently, a growing body of evi- dence suggests a large seasonal variability in the composi- tion of exported dissolved organic matter (DOM) [Spencer et al., 2009a, 2008] coincident with changes in biolability [Holmes et al., 2008], photolability [Osburn et al., 2009], 1 Woods Hole Research Center, Falmouth, Massachusetts, USA. 2 Northeast Science Station, Pacific Institute for Geography, Far East Branch, Russian Academy of Sciences, Cherskiy, Republic of Sakha, Yakutia, Russia. Copyright 2012 by the American Geophysical Union. 0148-0227/12/2011JG001798 JOURNAL OF GEOPHYSICAL RESEARCH, VOL. 117, G01028, doi:10.1029/2011JG001798, 2012 G01028 1 of 15
-
Upload
northumbria -
Category
Documents
-
view
3 -
download
0
Transcript of Controls on the composition and lability of dissolved organic matter in Siberia's Kolyma River basin

Controls on the composition and lability of dissolvedorganic matter in Siberia’s Kolyma River basin
P. J. Mann,1 A. Davydova,2 N. Zimov,2 R. G. M. Spencer,1 S. Davydov,2 E. Bulygina,1
S. Zimov,2 and R. M. Holmes1
Received 30 June 2011; revised 18 November 2011; accepted 22 December 2011; published 3 March 2012.
[1] High-latitude northern rivers export globally significant quantities of dissolved organiccarbon (DOC) to the Arctic Ocean. Climate change, and its associated impacts onhydrology and potential mobilization of ancient organic matter from permafrost, is likely tomodify the flux, composition, and thus biogeochemical cycling and fate of exportedDOC in the Arctic. This study examined DOC concentration and the composition ofdissolved organic matter (DOM) across the hydrograph in Siberia’s Kolyma River, with aparticular focus on the spring freshet period when the majority of the annual DOC load isexported. The composition of DOM within the Kolyma basin was characterized usingabsorbance-derived measurements (absorbance coefficient a330, specific UV absorbance(SUVA254), and spectral slope ratio SR) and fluorescence spectroscopy (fluorescence indexand excitation-emission matrices (EEMs)), including parallel factor analyses of EEMs.Increased surface runoff during the spring freshet led to DOM optical properties indicativeof terrestrial soil inputs with high humic-like fluorescence, SUVA254, and low SR andfluorescence index (FI). Under-ice waters, in contrast, displayed opposing trends in opticalproperties representing less aromatic, lower molecular weight DOM. We demonstratethat substantial losses of DOC can occur via biological (�30% over 28 days) andphotochemical pathways (>29% over 14 days), particularly in samples collected during thespring freshet. The emerging view is therefore that of a more dynamic and labile carbonpool than previously thought, where DOM composition plays a fundamental role incontrolling the fate and removal of DOC at a pan-Arctic scale.
Citation: Mann, P. J., A. Davydova, N. Zimov, R. G. M. Spencer, S. Davydov, E. Bulygina, S. Zimov, and R. M. Holmes(2012), Controls on the composition and lability of dissolved organic matter in Siberia’s Kolyma River basin, J. Geophys. Res.,117, G01028, doi:10.1029/2011JG001798.
1. Introduction
[2] Arctic biomes contain up to an estimated 50% of theorganic carbon stored in soils globally, which is predomi-nantly held within permafrost soils [Dittmar and Kattner,2003; Tarnocai et al., 2009]. Hydrologic changes attrib-uted to climate change are already underway in the Arcticand include permafrost thaw, shorter snow cover durationand increasing freshwater discharge [Brown, 2000; Guoet al., 2007; McGuire et al., 2009; Peterson et al., 2002;Stone et al., 2002; Striegl et al., 2005; Wu et al., 2005].The response of Arctic ecosystems to these changes has thepotential to mobilize large terrestrial carbon pools and theability to influence carbon fluxes both to the atmosphereand ocean.
[3] Large quantities of dissolved organic carbon (DOC)are exported from land to the Arctic Ocean, via Arctic rivers,which deliver approximately 10% of the global river dis-charge [Dittmar and Kattner, 2003; Opsahl et al., 1999].Arctic rivers exhibit a strong seasonality in discharge withmaximum fluxes occurring during the spring thaw and floodevent (or “freshet”), generally in the months of May andJune. Increased DOC concentrations, associated with ele-vated discharge during this time, can lead to over 60% of theannual DOC flux occurring over this short period [Holmeset al., 2011; Raymond et al., 2007; Spencer et al., 2009a].Historically, Arctic riverine DOC was thought refractory innature owing largely to the apparent conservative mixingbehavior observed across the Eurasian continental shelf[Amon and Meon, 2004; Cauwet and Sidorov, 1996;Gordeev et al., 1996] and from studies of its biochemicalcharacteristics [Lobbes et al., 2000]. However, these studieswere constrained to late summer after the retreat of sea icein the coastal zone. More recently, a growing body of evi-dence suggests a large seasonal variability in the composi-tion of exported dissolved organic matter (DOM) [Spenceret al., 2009a, 2008] coincident with changes in biolability[Holmes et al., 2008], photolability [Osburn et al., 2009],
1Woods Hole Research Center, Falmouth, Massachusetts, USA.2Northeast Science Station, Pacific Institute for Geography, Far East
Branch, Russian Academy of Sciences, Cherskiy, Republic of Sakha,Yakutia, Russia.
Copyright 2012 by the American Geophysical Union.0148-0227/12/2011JG001798
JOURNAL OF GEOPHYSICAL RESEARCH, VOL. 117, G01028, doi:10.1029/2011JG001798, 2012
G01028 1 of 15

and age [Neff et al., 2006; Raymond et al., 2007]. Otherstudies have also highlighted that the apparent degradedbiochemical signature of riverine DOM could be caused byleaching and sorption, as these processes have been shownto shift biochemical signatures toward what have histori-cally been interpreted as degraded [Aufdenkampe et al.,2001; Hernes et al., 2007]. Finally, a number of studies inthe Arctic Ocean have reported extensive removal of DOCin the Arctic shelf seas [Alling et al., 2010; Hansell et al.,2004; Letscher et al., 2011]. Therefore, it is now apparentthat examining seasonality is of crucial importance tounderstanding the fate of Arctic river DOC as this deter-mines its composition, and thus underlies its susceptibilityto bacterial and photochemical degradation processes.[4] During the freshet, a large proportion of the DOC pool
has been reported to be biologically labile (20%–40%) overtimescales of 30 days or less within a range of NorthAmerican Arctic rivers [Holmes et al., 2008]. By contrast,the DOC exported by these rivers during late summerappears to be largely biologically recalcitrant in nature[Holmes et al., 2008]. The role of photochemical degrada-tion in Arctic DOM has only recently been addressed [Amonand Meon, 2004; Bélanger et al., 2006; Osburn et al., 2009]but its potential role in modifying DOM composition viaphotobleaching and remineralization of organic C in otheraquatic ecosystems is well documented [Miller and Zepp,1995; Mopper and Kieber, 2002]. Photodegradation canmodify DOM function by selectively degrading aromaticand phenolic groups [Hernes and Benner, 2003; Opsahl andBenner, 1998; Spencer et al., 2009b] and can produce, orrelease, photoproducts that influence DOM bioavailability[Benner and Biddanda, 1998; Bertilsson and Tranvik, 1998;Kieber et al., 1990; Tranvik and Bertilsson, 2001]. Theincreased aromaticity of allochthonous DOM delivered tocoastal regions will lead to intense photobleaching withinnearshore environments as light penetration increases,resulting in increased carbon losses and DOM compositionchanges [Osburn et al., 2009]. Future losses of sea ice, orreductions in ozone levels may contribute to an increasingrole for photochemistry in carbon biogeochemistry withinArctic regions [Gibson et al., 2000; Lindsay and Zhang,2005].[5] The aim of this study was to investigate variability in
DOM quality over the hydrograph on the Kolyma River, andto examine how these changes influenced the fate ofexported DOC. Several small tributaries within the Kolymabasin were additionally studied to facilitate discrimination ofDOM origin and source. Sample optical properties (absor-bance and fluorescence spectroscopy) were used to investi-gate DOM quality and variability alongside measurementsof bulk DOM concentration (DOC and dissolved organicnitrogen, DON). Incubation experiments were conducted toquantify biological and photochemical DOC losses, andrelationships between DOC loss and DOM compositionwere investigated in order to identify the importance ofDOM composition on its fate.
2. Methods
2.1. Site Description and Field Sampling
[6] The Kolyma River is the fifth largest river discharginginto the Arctic Ocean, draining a watershed area of
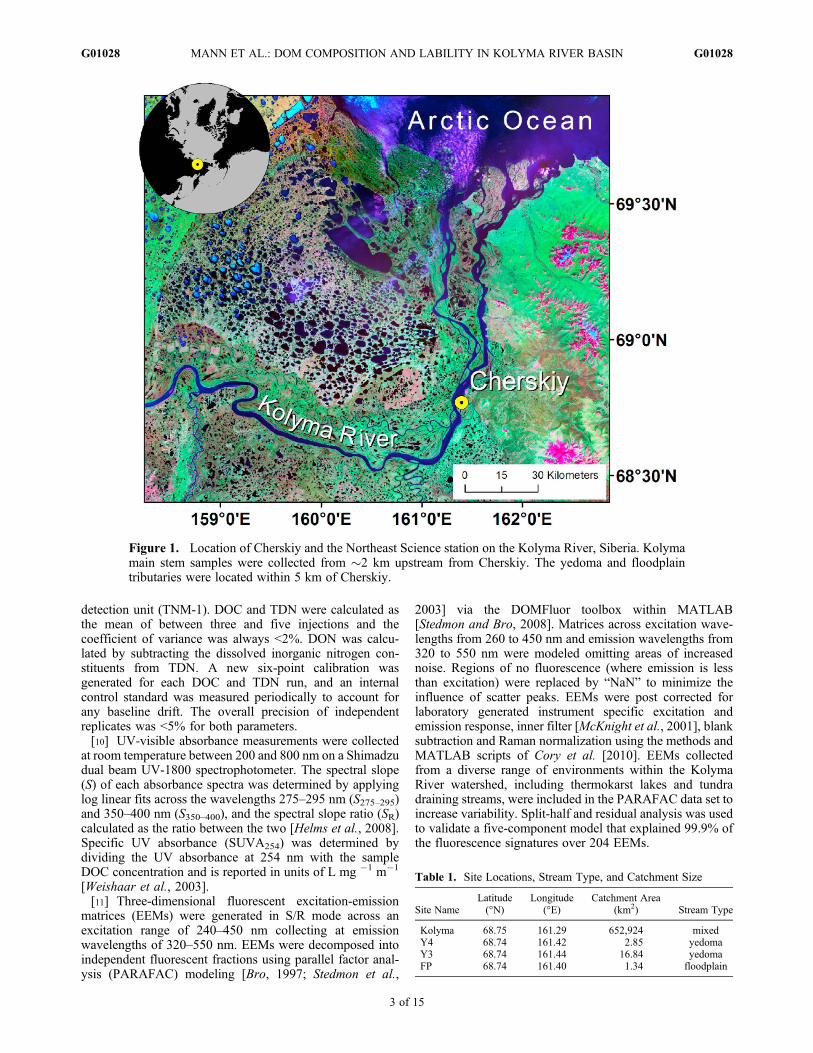
650,000 km2 [Holmes et al., 2011]. The Kolyma basinrepresents the Earth’s largest river system that is completelyunderlain by continuous permafrost. These permafrost layerscontain vast quantities of ancient organic matter stored incarbon rich Pleistocene age loess, locally known as yedoma[Zimov et al., 2006].[7] Study sites were located in the vicinity of the North-
east Science Station near Cherskiy, Russia (Figure 1), wheremean monthly temperatures range from �33.4 °C duringboreal winter conditions in January, to 13.4 °C in July (meanannual �9.9 °C; 1999–2010). Seasonal sampling on theKolyma River was conducted �2 km upstream from thetown of Cherskiy (Table 1). Water sampling was conductedover a 3 month period and focused on three distinct phasesof the hydrologic regime and onset of the Kolyma Riverfreshet: (1) the preflush period between 30 April and 20 May(under-ice sampling), (2) the freshet and ice-out between21 May and 30 June, and (3) the summer low-flow periodfrom 1 July until the end of the study. Discharge of theKolyma River was very low during the long winter monthsbut spiked rapidly during the spring freshet causing icebreakup at Cherskiy to start around 25–26 May 2010(Figure 2). Samples were additionally collected at themouths of three lowland tributaries to the Kolyma River.Two of these streams (designated Y3 and Y4) drainedyedoma rich soils (Table 1) and could be characterized as“blackwater” streams. A single lowland stream that draineda grass and woodland dominated floodplain (designated FP)of the Kolyma River was also studied (Table 1). During thewinter months these shallow streams froze completely andas such displayed no winter base flow. Snowmelt caused theopening of the smaller streams around 7–9 May 2010,approximately 2 weeks prior to the Kolyma ice-out event.Sampling was conducted immediately at the onset of flowwithin these streams, and periodically throughout spring.[8] Ancillary measurements of water temperature, dis-
solved oxygen, specific conductivity and pH were collectedusing a YSI Pro-Plus multiparameter instrument. Allsamples for DOC and total dissolved nitrogen (TDN) nutri-ent and optical analyses were filtered on collection throughprecombusted (550 °C for 8 h) GF/F filters (�0.7 mm,Whatman). DOC/TDN samples were filtered directly intoprecombusted (550 °C for 8 h) glass vials and stored acidi-fied at pH 2 refrigerated (4 °C) in the dark. Samples foroptical analyses were transferred to aged HDPE plasticbottles and stored refrigerated (4 °C) and in the dark untilanalysis. Most DOC and optical samples were measuredwithin 48 h of collection, but because of logistical con-straints some were stored for up to 2 weeks before analysis.Samples for inorganic nutrient analyses (nitrate, ammonium,phosphate and silicate) were acidified and stored refrigerated(4 °C) before being measured on an Astoria Analyzer usingestablish methods [U.S. Environmental Protection Agency,1984]. Nutrients were stored for up to 3 months and mea-sured after returning to the United States.
2.2. DOC and DOM Analyses
[9] All of the organic and optical measurements wereconducted at the Northeast Science station in Cherskiy.DOC and TDN were determined via high-temperaturecombustion using a Shimadzu TOC-V organic carbonanalyzer combined with a nitrogen chemiluminescence
MANN ET AL.: DOM COMPOSITION AND LABILITY IN KOLYMA RIVER BASIN G01028G01028
2 of 15
detection unit (TNM-1). DOC and TDN were calculated asthe mean of between three and five injections and thecoefficient of variance was always <2%. DON was calcu-lated by subtracting the dissolved inorganic nitrogen con-stituents from TDN. A new six-point calibration wasgenerated for each DOC and TDN run, and an internalcontrol standard was measured periodically to account forany baseline drift. The overall precision of independentreplicates was <5% for both parameters.[10] UV-visible absorbance measurements were collected
at room temperature between 200 and 800 nm on a Shimadzudual beam UV-1800 spectrophotometer. The spectral slope(S) of each absorbance spectra was determined by applyinglog linear fits across the wavelengths 275–295 nm (S275–295)and 350–400 nm (S350–400), and the spectral slope ratio (SR)calculated as the ratio between the two [Helms et al., 2008].Specific UV absorbance (SUVA254) was determined bydividing the UV absorbance at 254 nm with the sampleDOC concentration and is reported in units of L mg �1 m�1
[Weishaar et al., 2003].[11] Three-dimensional fluorescent excitation-emission
matrices (EEMs) were generated in S/R mode across anexcitation range of 240–450 nm collecting at emissionwavelengths of 320–550 nm. EEMs were decomposed intoindependent fluorescent fractions using parallel factor anal-ysis (PARAFAC) modeling [Bro, 1997; Stedmon et al.,
2003] via the DOMFluor toolbox within MATLAB[Stedmon and Bro, 2008]. Matrices across excitation wave-lengths from 260 to 450 nm and emission wavelengths from320 to 550 nm were modeled omitting areas of increasednoise. Regions of no fluorescence (where emission is lessthan excitation) were replaced by “NaN” to minimize theinfluence of scatter peaks. EEMs were post corrected forlaboratory generated instrument specific excitation andemission response, inner filter [McKnight et al., 2001], blanksubtraction and Raman normalization using the methods andMATLAB scripts of Cory et al. [2010]. EEMs collectedfrom a diverse range of environments within the KolymaRiver watershed, including thermokarst lakes and tundradraining streams, were included in the PARAFAC data set toincrease variability. Split-half and residual analysis was usedto validate a five-component model that explained 99.9% ofthe fluorescence signatures over 204 EEMs.
Figure 1. Location of Cherskiy and the Northeast Science station on the Kolyma River, Siberia. Kolymamain stem samples were collected from �2 km upstream from Cherskiy. The yedoma and floodplaintributaries were located within 5 km of Cherskiy.
Table 1. Site Locations, Stream Type, and Catchment Size
Site NameLatitude(°N)
Longitude(°E)
Catchment Area(km2) Stream Type
Kolyma 68.75 161.29 652,924 mixedY4 68.74 161.42 2.85 yedomaY3 68.74 161.44 16.84 yedomaFP 68.74 161.40 1.34 floodplain
MANN ET AL.: DOM COMPOSITION AND LABILITY IN KOLYMA RIVER BASIN G01028G01028
3 of 15

[12] Each of the five components identified were related topreviously identified DOM fractions (Table 2). Many dis-played multiple peaks in the excitation spectra similar tothose previously reported for Arctic surface water DOM[Cory and McKnight, 2005; Cory et al., 2007; Walker et al.,2009] (Table 2). Component C1 displayed excitation max-ima at <250 nm with another additional pronounced broadmaxima at 310 nm (Table 2). C1 emission occurred at shortwavelengths (�422 nm) indicating the presence of a rela-tively low molecular weight, lower aromatic DOM pool[Coble et al., 1990; Coble et al., 1998]. This fluorophoregroup has previously been described as fulvic-like or lowmolecular weight humic-like in nature [Fellman et al., 2010a;Sierra et al., 2005]. Similarly, component C3 exhibitedemission at shorter wavelengths suggesting it represents aless aromatic DOM pool, although its excitation peakoccurred at longer wavelengths (Table 2). An identicalcomponent has not been previously reported, although itappears to be related to an unknown humic-like group pre-viously identified in a diverse data set including Arctic EEMs[Cory and McKnight, 2005]. C2 exhibits broader emissionspectra at longer wavelengths (redshifted), indicating thesefluorophores are more likely to contain conjugated moleculesthat are more aromatic in nature with higher molecularweight compounds [Coble, 1996; Sierra et al., 2005]. C2
also displays spectra more closely related to the classic peaksdefined as “A” and “C” [Coble, 1996] suggesting it may bederived from fresher vascular plant or soil sources [Cobleet al., 1998; Fellman et al., 2010a]. These components arecommonly referred to as the humic-like fluorophores[Fellman et al., 2010a; Stedmon et al., 2003; Stedmon andMarkager, 2005a, 2005b]. Components C4 and C5 dis-played excitation and emission spectra closely relating toprotein-like DOM fractions. Specifically, C4 and C5exhibited maxima closely resembling tryptophan-like andtyrosine-like fluorescence, respectively [Fellman et al.,2010a, and references therein]. Replicate EEMs processedand modeled produced fluorescent component loadingestimates within 2% for humic and fulvic-like fractions and5% for protein-like components. The FI, an indicator ofDOM aromaticity [McKnight et al., 2001], was also calcu-lated from the corrected EEMs as the ratio of emissionintensities at 470/520 nm after excitation at 370 nm [Coryand McKnight, 2005; Cory et al., 2010].
2.3. Biodegradable DOC and Photochemical DOC Loss
[13] Biodegradable DOC (BDOC) was calculated as thedifference in DOC before and after 28 days incubation fol-lowing the procedures of Holmes et al. [2008]. Briefly,sample water was filtered through precombusted GF/F filters
Figure 2. Kolyma River 2010 discharge measured at the Kolymskoye monitoring station.
Table 2. Spectral Characteristics of the Five Components Identified Using PARAFACa
ComponentExcitationlmax (nm)
Emissionlmax (nm) Description and Likely Structure Comparable Previous Studies
C1 <250 (310) 422 low molecular weight, fulvic-like or UV-C humic DOM Stedmon and Markager [2005a, 2005b] (C3)Walker et al. [2009] (BERC1)
C2 <250 (285) 492 higher aromatic, conjugated, observed from fresh plant sources;humic-like
Stedmon and Markager [2005a, 2005b]
C3 270 448 excitation maxima at longer wavelengths; humic/fulvic-like Cory and McKnight [2005] (6,7)C4 280 (<250) 342 amino acids, soluble bound microbial DOM,
tryptophan-like aromatic proteinStedmon and Markager [2005a, 2005b] (C7)
Murphy et al. [2008]C5 265 <320 amino acid; tyrosine-like; aromatic protein Stedmon and Markager [2005a, 2005b] (C8)
Murphy et al. [2008]
aSecondary excitation maxima are in parentheses. PARAFAC, parallel factor analysis; DOM, dissolved organic material.
MANN ET AL.: DOM COMPOSITION AND LABILITY IN KOLYMA RIVER BASIN G01028G01028
4 of 15

into 60 mL HDPE bottles and incubated in the dark at roomtemperature (�20 °C) for 28 days. Samples were incubatedwith lids loosely fitted and agitated regularly to maintainoxic conditions. Initial samples were immediately acidified(pH � 2, HCl Sigma), stored refrigerated in the dark andanalyzed alongside incubated samples acidified after28 days. All BDOC incubations were run in triplicate andthe mean DOC loss was used to derive the percent loss fromthe initial DOC concentration, defined as BDOC (%). Nocorrections were made to account for initial sample tem-perature, and as such these results represent potential labilityat summer river water temperatures (Figure 3a). Photo-chemical DOC degradation was determined as the differencein DOC between dark and light exposed treatments. Oneliter samples were filtered sequentially through precleaned0.45 and 0.22 mm filter cartridges into triple sample rinsed,completely filled Tedlar bags (1 L; SKC Inc. 250–01). Bagswere secured horizontally across the surface of a lake sub-merged to a depth of �2 cm for 14 days. The environmentalconditions of the lake closely matched those within the river(�2°C) during the incubation period. Dark controls weretreated identically except for being covered prior to exposurewith a dark bag blocking all light exposure. In order to aidcomparison, all samples were irradiated under natural sun-light conditions simultaneously ensuring identical lightexposure. Samples collected earlier were filtered and storedin cool and dark conditions until the beginning of theexperiment with no discernable DOC loss observed in storedsamples (<2%). DOC losses were measured after 3 and14 days of exposure and the % DOC loss (DOCphoto) cal-culated. Experiments were started on the 10 June during the
summer solstice period providing 24 h of sunlight for the full14 day incubation period.
3. Results
3.1. Hydrology and Biogeochemical Setting
[14] The Kolyma River displayed rapid changes in itsbiogeochemical characteristics over the spring freshetperiod. Preflush, under-ice Kolyma waters were cold (0 °C–1 °C) and exhibited low dissolved oxygen saturation (<40%;Figures 3a and 3b). Preflush waters also had high specificconductivity indicating the presence of increased con-centrations of soluble salts, indicative of elevated ground-water supply (Figure 3c). With the onset of the freshet,Kolyma water temperature and oxygen saturation increasedrapidly with accompanying decreases in specific conduc-tivity and pH (Figures 3a–3d). Nitrate concentrations rapidlydeclined during the study period, with high concentrationsmeasured under-ice declining to very low concentrations byearly summer (Figure 4a). Silicate concentrations were highunder ice, dropped dramatically with the onset of the freshet,and then steadily increased over the remainder of spring andinto summer (Figure 4b). No discernable patterns in phos-phate or ammonium concentrations were apparent during thefreshet period (Figures 4c and 4d).[15] Stream runoff from tributaries in the 2 weeks prior to
the ice-out on the Kolyma led to large accumulations ofDOC rich water pooling onto the surface of the KolymaRiver ice, exposing it to intense photochemical irradiation.Extensive runoff and melt from tributary streams also aidedmechanical fracturing and break up of the ice on the KolymaRiver main stem.
Figure 3. Kolyma River main stem (a) temperature, (b) dissolved oxygen, (c) specific conductivity, and(d) pH measurements over the study period. Kolyma discharge from Figure 2 (gray line) is also shown.
MANN ET AL.: DOM COMPOSITION AND LABILITY IN KOLYMA RIVER BASIN G01028G01028
5 of 15

3.2. DOC Concentration and BDOC
[16] Preflush DOC concentrations in waters collectedunder the ice from the Kolyma main stem were low, rangingfrom 2.0–2.7 mg L�1 (mean = 2.4 mg L�1, n = 3; Figure 5a).DOC concentrations peaked during the spring freshet andreached a maximum of 14.2 mg L�1 coincident with icebreakup on the 25–26 May 2010 (Figure 5a). Kolyma DOCconcentrations quickly declined over the preceding daysafter ice-out and continued to steadily decrease over themonths afterward, reaching 4.0 mg L�1 by the end of July2010. DOC concentration during the freshet period rangedfrom 5.8 – 14.2 mg L�1 (mean = 10.2 mg L�1, n = 15) withmaximum DOC concentrations observed up to 4–5 daysprior to peak discharge (Figure 5a). DOC concentrationswere intermediate during summer conditions (mean =4.4 mg L�1, n = 2; Figure 5a). DON concentrations werehighly correlated to DOC and thus followed the same trendduring the study period (r = 0.92; p < 0.001; n = 18). DONranged from �0.1 mg L�1 under the ice (mean =0.09 mg L�1, n = 3) during preflush conditions to0.6 mg L�1 (mean = 0.37 mg L�1, n = 14) during the freshet(Figure 5b).[17] DOC concentrations within the yedoma streams
ranged from 13.1 to 63.5 mg L�1 (mean = 25.9 mg L�1, n =19) over the study period. The highest concentrations in bothstreams were measured 1 week after ice breakup (Figure 5c).DOC concentrations varied less in the stream draining thefloodplain catchment ranging from only 9.1 to 17.1 mg L�1
(mean = 11.8 mg L�1, n = 6) over the study duration. Bothyedoma streams displayed consistently higher DOC con-centrations than the floodplain stream throughout thesampling period (Figure 5c).
[18] Kolyma BDOC rates mirrored DOC concentrationwith lowest or negligible losses (0.1%) observed in earlyseason under-ice samples, and highest losses (20.4%) asso-ciated directly with the ice-out period (Table 3). HighestBDOC losses of �20% were observed in the first two daysof the spring freshet. BDOC losses then declined for theremainder of the freshet period ranging between 1–11%(mean = 7.4%; n = 10; Table 3). BDOC losses in under-iceKolyma samples ranged from 0.1–9.5% increasing imme-diately prior to the Kolyma ice breakup.
3.3. CDOM Optical Properties
[19] SUVA254 can act as a proxy for DOM aromaticitywith higher SUVA254 values representing a more aromaticorganic matter pool [Weishaar et al., 2003]. SUVA254 in theKolyma main stem ranged between 2.1 and 4.2 L mg�1 m�1
over the study period, reaching highest values during thespring flush (mean = 3.9 L mg�1 m�1; n = 15; Figure 6a).Summer conditions were characterized by intermediateSUVA254 values (mean = 2.9 L mg�1 m�1; n = 2) whereaslowest SUVA254 values were observed in preflush, under-icesamples (mean = 2.1 L mg�1 m�1; n = 3; Figure 6a).[20] The spectral slope ratio (SR) has been shown to be
correlated to DOM molecular weight and source withincreases in the ratio characterizing decreasing molecularweight and a shift from DOC rich black waters to opticallyclearer waters [Helms et al., 2008; O’Donnell et al., 2010;Spencer et al., 2009b]. Kolyma main stem SR ranged from0.78 to 1.13 during the study period, the highest valuesobserved in preflush samples (mean = 0.99; n = 3) indicatingthe presence of primarily low molecular weight material andlower amounts of aromatic functional groups (moieties)(Figure 6b). The SR peaked immediately before ice-out
Figure 4. Nutrient concentrations of (a) nitrate, (b) ammonium, (c) phosphate, and (d) silicate in theKolyma main stem over the study period. Kolyma discharge from Figure 2 (gray line) is also shown.
MANN ET AL.: DOM COMPOSITION AND LABILITY IN KOLYMA RIVER BASIN G01028G01028
6 of 15

(1.13; Figure 6b) potentially representing inputs of lowmolecular weight DOM from increasing ice melt. Lowest SRvalues were observed at the peak of the freshet, indicatingthe rapid input of higher molecular weight, aromatic terres-trial material (Figure 6b). The SR values then increasedthroughout the remainder of the study period demonstratinga gradual shift toward lower molecular weight and lessaromatic DOM throughout the open water season.[21] Fluorescence index (FI) values ranged from 1.38 to
1.51, with the highest values observed in under-ice samples(mean = 1.50; n = 3; Figure 6c). These results indicate thatpreflush Kolyma waters have lower aromaticity and aremore microbial in source, or represent more heavilydegraded material [Cory et al., 2007;McKnight et al., 2001].The lowest FIs were measured during the freshet period onthe Kolyma main stem (mean = 1.41, n = 14) demonstratingthat DOM composition during this period is more aromaticin nature and primarily derived from terrestrial soils andvascular plant sources [McKnight et al., 2001; Spencer et al.,2010].
3.4. Fluorescence and PARAFAC Modeling
[22] The onset of the spring freshet resulted in anincreased contribution, and relative intensity of the humic-like fluorophore (C2) in the Kolyma. This increase led to ashift in the overall DOM fluorescence signal to higheremissions indicating the presence of a more conjugated,aromatic DOM (Figures 7a and 7b). Following the springfreshet, C2 fluorescence intensity and contribution, slowlydeclined resulting in a blueshift (lowering of emission) in thefluorescence signature. C2 and C3 fluorescence intensitiesalso generally increased with increasing discharge suggest-ing an allochthonous source linked to extensive surfacerunoff. Thus, it appears that component C2 acts as an indi-cator of allochthonous inputs from surface soil and litterlayer derived materials. Conversely, C1 (fulvic-like) fluo-rescence intensities displayed the opposite trend to those ofC2 and C3, generally decreasing with increasing dischargeand DOC concentration suggesting this fraction was lessassociated with surface runoff and terrestrial supply. Anincreased intensity and relative contribution (≥20%) of theprotein-like fractions (C4 and C5) was observed in theunder-ice samples, peaking immediately prior to ice breakupupon the Kolyma River (Figure 7b). With peak freshwaterdischarge, protein-like fraction contributions to the totalfluorescence pool declined to low levels (�10%). Protein-like DOM intensity (C4) also increased throughout thesummer possibly indicating increasing relative autochtho-nous DOM contributions [Stedmon et al., 2003; Stedmonand Markager, 2005b].
3.5. DOC Photomineralization
[23] Natural sunlight exposure resulted in DOC concen-tration losses of between 0.5 �1.8 and 1.0–3.4 mg L�1 overthe 3 and 14 day incubation periods, respectively. DOClosses calculated as a percentage of initial DOC concentra-tion (DOCphoto) were highest in Kolyma main stem samplescollected during the first stages of the spring flush with over13% of the DOC pool proving susceptible to photo-mineralization over just three days (Table 3). DOCphoto
losses increased up to a maximum of �30% after 14 days ofnatural irradiation (Table 3). These losses represent maximal
Figure 5. Concentrations of (a) dissolved organic carbon(DOC) and (b) dissolved organic nitrogen (DON) over the2010 spring freshet in the Kolyma River. (c) DOC concen-trations of three tributaries of the Kolyma. Y3 and Y4 bothrepresent streams draining organic-rich yedoma catchments.The FP site drains a floodplain catchment of the Kolymamain stem. Kolyma discharge from Figure 2 (gray line) isalso shown.
MANN ET AL.: DOM COMPOSITION AND LABILITY IN KOLYMA RIVER BASIN G01028G01028
7 of 15

surface removal rates and as such, are unlikely to accuratelyportrait natural degradation. DOCphoto losses from thisstudy, although not directly comparable with, are within therange of those reported previously on Mackenzie Riverestuarine samples, collected during the summer months andexposed to up to 12 days natural irradiation (1%–6%) [Amonand Meon, 2004]. They also compare well with the 10–30%losses observed in samples collected from over the hydro-graph in the Mackenzie River and Beaufort Sea after threedays under natural light [Osburn et al., 2009].[24] Photochemical degradation of DOM led to changes in
DOM composition through photobleaching and productionprocesses. Photobleaching of DOM led to losses in theabsorbance coefficient (a330) and FI, and overall decreases inSUVA254 across the freshet (Table 4). The slope of theabsorbance spectra over short wavelengths 275–295 nm(S275–295) became steeper with light exposure, whereasS350–400 consistently became shallower (Table 4). Thisresulted in overall increases in the slope ratio (SR) betweenS275–295 and S350–400, as has been previously reportedresulting with photobleaching [Helms et al., 2008; Spenceret al., 2009b]. These results are therefore indicative of aDOM pool becoming less aromatic in nature with decreasingaverage molecular weight upon irradiation. Additionally,photodegradation led to losses in humic and fulvic-likefluorescence (C2 and C3), and increased protein-like fluo-rescence (C4 and C5) suggesting higher molecular weightcompounds were broken down and smaller, lower molecularweight fractions were photochemically produced (Table 4).
4. Discussion
4.1. Temporal Trends in DOM Concentrationand Composition
[25] DOM concentration and composition varied signifi-cantly throughout the study period. Increasing snowmelt andsurface runoff at the onset of the spring thaw lead to rapidinputs of allochthonous organic matter with high DOC andDON concentrations (Figure 5). Maximum DOC and DONconcentrations were measured a few days prior to peakfreshwater discharge, suggesting either a large pool of DOMwas readily mobilized with the onset of the freshet, or that adilution effect occurred with increased discharge. Kolyma
main stem DOM during the freshet exhibited signaturesassociated with increased DOM molecular weight and aro-maticity as indicated by high SUVA254, and low SR and FIratios (Figure 6). These findings are consistent withincreasing snowmelt runoff leaching organic carbon withinthe upper shallow organic-rich surface layer because of theimpermeability of frozen ground [Balcarczyk et al., 2009;Holmes et al., 2008; O’Donnell et al., 2010]. Positive rela-tionships between C2 fluorescence and SUVA254 (r = 0.86,p < 0.001), as well as inverse linear relationships with SR andFI (r = �0.93 and �0.78, p < 0.001, respectively), demon-strate that the C2 (humic-like) DOM fraction may reflect thecompositional shift in Kolyma DOM caused by terrestrialinputs of higher molecular weight aromatic compounds (C2;Figure 7). Increasing terrestrial DOM inputs, as indicated byC2 fluorescence, also correlated strongly with DOC con-centration (r = 0.93, p < 0.001) reinforcing the organic richnature of this material. The initial change in DOM compo-sition occurred prior to maximum discharge rates, indicatingthat the rapid input of a large terrestrial DOM pool is likelyto have led to the early spike in DOC concentration(Figure 6). DOC concentrations within snowmelt-dominatedcatchments have previously been reported to be productionlimited during high flow, leading to a peak on the rising limbof the hydrograph and tapering off despite little change inthe hydrological routing over this time [Boyer et al., 1997;Hornberger et al., 1994]. Similar seasonal trends in DOCconcentration and DOM composition were observed in eachof the smaller streams studied. Consistently higher DOCconcentrations within waters draining the yedoma catch-ments, to those from the floodplain draining stream, mayindicate floodplain regions have limited soil DOC avail-ability, a difference in hydrologic flow path or limited wet-land area [Finlay et al., 2006; Laudon et al., 2004].[26] Post freshet conditions were characterized by a steady
decline in DOM molecular weight and aromaticity(decreasing SUVA254, and increasing FI, SR; Figure 6)indicating reductions in terrestrial runoff and the depletion insurface horizon DOC stored from the antecedent winter [Neffet al., 2006; Spencer et al., 2009a; Striegl et al., 2005]. Anincrease in the fluorescence signature C1 (fulvic-like), withconcomitant decrease of C2 (humic-like) over the nextweeks also suggested a shift in DOM source possibly
Table 3. Initial Sample Characteristics of Waters Used in Biolability and Photolability Experimentsa
DateInitial DOC(mg L�1)
SUVA254
(L mg�1 m�1) SR FIC1
(R.U.)C2
(R.U.)C3
(R.U.)C4
(R.U.)C5
(R.U.)BDOC
(% C Loss)DOCphoto
(% C Loss)
30 Apr 2010 2.7 2.15 0.91 1.51 8.03 7.01 4.53 1.84 0.29 0.1 –19 May 2010 2.0 2.15 1.13 – – – – – – 9.5 –24 May 2010 12 4.04 0.78 1.39 7.07 8.34 4.61 1.51 0.45 18.5 24.8 (13.1)25 May 2010 13.2 3.94 0.78 1.40 7.07 8.41 4.65 1.38 0.35 20.4 –27 May 2010 13.9 4.00 0.78 1.38 7.11 8.46 4.69 1.20 0.25 8.3 25.0 (13.2)28 May 2010 12.3 3.91 0.79 1.40 7.88 7.25 4.57 1.75 0.33 9.8 –29 May 2010 11.9 4.07 0.79 1.40 7.43 7.91 4.61 1.55 0.31 8.3 29.9 (9.1)30 May 2010 12.9 3.98 0.80 1.40 7.52 7.77 4.60 1.61 0.31 7.2 20.5 (7.6)31 May 2010 10.5 4.16 0.80 1.40 7.42 7.94 4.61 1.50 0.36 7.4 –1 Jun 2010 10.2 4.06 0.82 1.40 7.47 7.89 4.63 1.50 0.30 7.0 –3 Jun 2010 8.9 3.99 0.82 1.42 7.58 7.7 4.63 1.55 0.34 8.7 19.3 (10.0)4 Jun 2010 8.2 4.02 0.83 1.41 7.61 7.67 4.62 1.57 0.34 11.4 –6 Jun 2010 7.6 3.86 0.82 – – – – – – 5.1 –7 Jun 2010 8.6 3.91 0.83 1.43 7.88 7.25 4.57 1.75 0.33 1.2 12.2 (5.4)
aBiodegradable dissolved organic carbon (BDOC) loss is the percent loss of carbon after 28 days incubation in the dark. DOCphoto is the percent loss ofcarbon after 14 days of irradiation (3 day results are in parentheses). R.U., Raman units.
MANN ET AL.: DOM COMPOSITION AND LABILITY IN KOLYMA RIVER BASIN G01028G01028
8 of 15

through increased contributions from deeper soil horizonsvia deepening of the active layer (Figure 7). Additionalwaters, collected during this study from a tundra ground-water seep, displayed increased C1 and depleted C2
contributions providing evidence that deeper hydrologicalflow paths may have contributed to the observed patterns.Cryosol soils within Siberian permafrost have also beenshown to contain higher proportions of fulvic to humicacids, and consequently are likely composed of low molec-ular weight, less aromatic DOM in comparison to organicrich surface horizons [Kimble, 2004]. The presence of ele-vated contributions of C1 fluorescence in the Kolyma earlyin the season, before ice melt occurred, also provides evi-dence that ground waters contribute increased fulvic-likeDOM relative to humic-like fractions. These waters werealso characterized by low SUVA254, and high FI and SRvalues indicative of the presence of low molecular weightmaterial of lower aromaticity (Figure 6). A period ofincreased protein-like, and very low humic and fulvic-likefractions, was observed prior to the peak in discharge. Wepropose this was caused by an increased supply of DOMfrom ice melt as previous studies have shown that DOMfluorescence derived from ice is dominated by protein-likefluorescence [Fellman et al., 2010b; Hood et al., 2009;Lafrenière and Sharp, 2004].[27] Longer hydrologic residence times and increased
microbial processing of the DOM pool could also havecontributed to the observed shift [McKnight and Aiken,1998; Striegl et al., 2005]. These findings agree well withprevious studies that suggest winter base flow DOM is lessaromatic and composed of fewer hydrophobic compounds infavor of hydrophilic compounds [O’Donnell et al., 2010;Striegl et al., 2005, 2007].[28] Results from this study therefore suggest that optical
proxies may prove useful in tracing changes in the hydro-logical flow paths and DOM compositional changes, withinArctic carbon cycles. The seasonal trends in SR observedhere for example, are highly comparable to those reportedfor the Yukon River [Spencer et al., 2009a, 2008] furtherhighlighting the potential to derive information about DOMcomposition via these techniques across the Arctic.
4.2. Linking DOM Composition to Biolabilityand Photoreactivity
[29] DOC transported during the spring flush in theKolyma River displayed different composition and labilitycompared to the rest of the open water season and preflush,as has been previously reported in the North AmericanArctic [Holmes et al., 2008; Osburn et al., 2009; Spenceret al., 2008]. The contribution of C2 (humic-like) fluo-rescence was positively correlated with BDOC within theKolyma River over the study period (Table 5 and Figure 8a;r2 = 0.53, p < 0.01). DOC derived from surface biomass,litters and the organic rich surface horizon is therefore likelyresponsible for driving the increased DOC biomineraliza-tion observed over the freshet period. These findings com-pare well with recent studies that show DOC exportedduring the freshet from Arctic rivers is younger and has anelevated lignin carbon-normalized yield in comparison tothe rest of the year [Raymond et al., 2007; Spencer et al.,2008], underpinning that “fresh” terrestrially derived DOCis exceptionally biolabile at this time of maximum export.Highly aromatic humic-like DOM has often previously beenconsidered recalcitrant and unavailable for biodegradation[Geller, 1986; Fellman et al., 2008]. Our results, however,suggest that surface soils mobilized during the freshet,
Figure 6. Optical indices: (a) SUVA254, (b) SR, and(c) fluorescence index (FI) calculated over the 2010 Kolymafreshet. Kolyma discharge from Figure 2 (gray line) is alsoshown.
MANN ET AL.: DOM COMPOSITION AND LABILITY IN KOLYMA RIVER BASIN G01028G01028
9 of 15

although highly aromatic and displaying high averagemolecular weight, are readily biodegradable over shorttimes scales, probably because of their exceptional fresh-ness and limited degradation history. During the remainderof the freshet period, BDOC losses remained relativelyconstant indicating a supply of moderately biolabileallochthonous organic material. This pattern suggests ahighly biolabile surface pool, likely derived from the
previous fall’s vegetation input to the litter layer which hasbeen frozen in place, is quickly depleted and washed outleading to an increasingly refractory pool for export[Inamdar et al., 2006; McGlynn and McDonnell, 2003;Spencer et al., 2010].[30] In contrast, the fulvic-like component C1 negatively
correlated with BDOC in the Kolyma River main stem(Table 5 and Figure 8b, r2 = 0.58, p < 0.01), indicating
Figure 7. Dissolved organic matter (DOM) compositional change within the Kolyma River over thefreshet. (a) Representative EEMs collected under preflush (under-ice), freshet and summer conditions.Changes in the overall intensity and emission maxima within the EEMs demonstrate shifts in the concen-tration and composition of the DOM pool. (b) Stacked percent contribution of each parallel factor analysiscomponent (see Table 2) to the overall fluorescence signal.
Table 4. Changes in the Optical Properties of Kolyma Freshet Samples (K1–K6) After 14 Days of Natural Irradiationa
DateDa330(m�1)
S275–295(� 10�3 nm�1)
S350–400(� 10�3 nm�1) DSR
DSUVA254
(L mg�1 m�1) DFIDC1(%)
DC2(%)
DC3(%)
DC4(%)
DC5(%)
24 May 2010 �12.1 �3.23 +1.75 +0.30 �0.33 �0.08 +0.6 �4.3 �4.7 +30.0 +55.427 May 2010 �11.9 �3.05 +1.41 +0.26 �1.32 �0.15 +12.3 �16.6 �11.7 +26.0 +114.329 May 2010 �9.1 �3.02 +1.18 +0.24 �1.70 �0.11 +2.7 �6.9 �5.0 +35.0 +75.930 May 2010 �9.4 �3.12 +0.61 +0.22 �0.99 �0.11 �1.9 �3.8 �4.2 +44.5 +107.43 Jun 2010 �8.1 �3.62 +1.24 +0.28 +0.04 �0.10 �0.5 �3.9 �4.5 +37.1 +72.17 Jun 2010 �5.3 �2.92 +0.64 +0.20 �0.06 �0.08 �1.2 �3.2 �2.6 +32.2 +50.7
aPositive changes in S represent a steepening of the spectral slope. Fluorescence component losses are calculated as a percent change from initial values.FI, fluorescence index.
MANN ET AL.: DOM COMPOSITION AND LABILITY IN KOLYMA RIVER BASIN G01028G01028
10 of 15

heterotrophic bacteria were less able to utilize this fraction ofthe DOC. This may suggest DOC inputs from deeper flowpaths that are inherently a more degraded fraction and lessbiolabile, or that longer hydraulic residence times have led tothe remineralization of labile C compounds before catch-ment export. Furthermore, stream water chemistry particu-larly during the early phases of snowmelt could be affectedby differential rates of melting throughout the catchmentregion, resulting in different proportions of organic mattercontributions from varying regions. The bioavailability of
Figure 8. Relationships between percent biodegradableDOC (BDOC) loss over 28 days and initial sample (a) C2fluorescence and (b) C1 fluorescence.T
able
5.Pearson
’sCorrelatio
nCoefficientsrBetweenBacterial
andPho
tochem
ical
DOCLossesandInitial
Optical
Propertiesa
DOCTyp
eDOC
(mgL�1)
DON
(mgL�1)
NH4-N
(mgL�1)
NO3/NO2
(mgL�1)
PO4–P
(mgL�1)
SiO
2
(mgL�1)
FI
S 275–295
(nm
�1)
S 350–400
(nm
�1)
S RSUVA254
(Lmg�
1m
�1)
C1
(R.U.)
C2
(R.U.)
C3
(R.U.)
C4
(R.U.)
C5
(R.U.)
Bacterial
DOC(%
)0.47
0.64
*0.61
*�0
.34
0.37
�0.58*
�0.59
�0.25
0.11
�0.21
0.32
�0.76*
*0.73
**0.52
�0.54
0.60
*Pho
tochem
ical
DOCphoto(%
)0.69
0.60
0.57
0.59
�0.46
�0.83*
�0.77
�0.89*
0.38
�0.85*
0.96
**�0
.75
0.75
0.49
�0.58
�0.03
a Incub
ationperiod
sare28
and14
days
forbacterialandph
otochemical
DOClosses,respectiv
ely.
Asing
leasterisk
(*)indicatescorrelations
sign
ificantat
p<0.05
;ado
uble
asterisk
(**)
indicatescorrelations
sign
ificantat
p<0.01
.R.U.,Ram
anun
its.
MANN ET AL.: DOM COMPOSITION AND LABILITY IN KOLYMA RIVER BASIN G01028G01028
11 of 15

inorganic and organic nitrogen sources may also influencethe biodegradation of carbon as demonstrated by positivecorrelations between DON, NH4-N and BDOC (%)(Table 5). Nitrogen additions have previously been shown tostimulate DOM bioreminerlization in North American Arcticrivers during the freshet period [Holmes et al., 2008]. Lownutrient levels within the river (Figures 4a, 4c, and 4d) maytherefore limit the maximum biolability observed during thefreshet within the Kolyma.[31] The photochemical removal of DOC we measured
likely represents the maximum remineralization rate possibleover such short times exposure times, as we measured
surface irradiated samples under 24 h sunlight conditions.Despite this, losses of up to 30% of the DOC pool undernatural light conditions (e.g., low Sun angles, cloud) stilldemonstrate a significant removal mechanism for terrestrialDOC in the Arctic. Photochemical DOC removal may belimited by self-shading in highly colored waters and bywater column light attenuation with depth, making estimatesof total natural removal rates challenging. Maximum pho-tochemical DOC losses, however, probably occur withincoastal and open ocean regions where dilution of terrestrialinputs leads to maximum light penetration.[32] The photo reactivity of freshet DOM (DOCphoto)
exposed to identical light treatments differed in response tovarying DOM composition. Significant correlations betweenindices relating to DOM aromaticity and molecular weight(SUVA254 and SR) with DOCphoto demonstrated thatincreasing molecular weight and aromaticity led to higherphotochemically mediated DOC loss (Table 5 andFigures 9a and 9b). Aromatic compounds have previouslybeen shown to be preferentially lost via photodegradationprocesses with major losses in aromatic moieties andenrichment in the 13C-DOC signature upon irradiation[Opsahl and Zepp, 2001; Spencer et al., 2009b; Stubbinset al., 2010]. Decreases in SUVA254 and a steepening inthe SR were observed during irradiations consistent with theloss of aromatic compounds (Table 5). Photodegradation ofspring flush derived DOM also led to an absolute and rel-ative loss in C2 and C3 fluorescence consistent with thenotion that these fractions represent more conjugated,complex DOM associated with surface soils and vegetationsources. Photochemical exposure led to an absolute (andrelative) increase in protein-like fluorescent fractions (C4and C5; Table 4), providing evidence for the production oflow molecular weight compounds (Table 4). The photo-production and photochemically recalcitrant nature of thesemoieties has previously been suggested as a mechanismexplaining a positive correlation between fulvic acid nitro-gen content and residence time across a diverse range ofArctic surface waters [Cory et al., 2007].[33] The effect of climate change on future fluxes of DOC
from Arctic rivers is not entirely clear, with conflicting evi-dence for both increases and decreases in flux [Striegl et al.,2007; Guo et al., 2007]. Warmer air temperatures, however,will likely lead to increased permafrost thaw and active layerdeepening, driving the freshwater system to transitionfrom a surface water–dominated system to a groundwater-dominated system [Frey and McClelland, 2009]. If ourunder-ice and late summer conditions were indicative ofthese deeper, older DOM sources, our results would indi-cate that an increase in sub-surface flow will result in theexport of relatively lower amounts of DOC that is morebiologically and photochemically recalcitrant.
5. Conclusions
[34] The composition and lability of DOM within theKolyma River varied dramatically over the hydrograph, withmaximum biological and photochemical lability observedduring the spring freshet period. These results from theRussian Arctic followed similar trends in biolability tothose previously reported within rivers draining the North
Figure 9. Relationships over the course of 14 daysbetween percent photochemical DOC loss and (a) SUVA254
and (b) SR.
MANN ET AL.: DOM COMPOSITION AND LABILITY IN KOLYMA RIVER BASIN G01028G01028
12 of 15

American Arctic [Holmes et al., 2008], implying that largeproportions of the annual DOC flux mobilized across theentire Arctic are readily available for biological reminer-alization and removal. Changes in the composition of theexported organic matter appear to be able to explain much ofvariability in the biological and photochemical susceptibilityof terrestrial DOM. The emerging view is therefore that of afar more dynamic and labile carbon pool over a pan-Arcticscale, particularly during the historically under sampledfreshet period. Understanding the fate of terrestrial carbonwithin the Arctic is crucial not only for our understanding ofcoastal and oceanic biogeochemical processes, but also indetermining the effects of future perturbations brought aboutby climatic change. Future studies will need to identify themechanisms controlling degradation rates of Arctic DOCparticularly in ancient carbon pools.
[35] Acknowledgments. This work was supported by grants from theNational Science Foundation for the Global Rivers Project (0851101), thePolaris Project (0732944 and 1044610), and the Arctic Great Rivers Obser-vatory (0732522 and 1107774) and by an NSF equipment grant to upgradethe analytical facilities at the Northeast Science Station (0938254). Wethank Rose Cory, George Dang, and Katie Harold for assistance withEEM corrections and MATLAB scripts. We thank Blaize Denfield forcatchment area estimates. Greg Fiske assisted with the production ofFigure 1, and Alexander Shiklomanov provided additional discharge data.We give special thanks to all of our colleagues at the Northeast Science Sta-tion for their help with Siberian fieldwork.
ReferencesAlling, V., et al. (2010), Nonconservative behavior of dissolved organiccarbon across the Laptev and East Siberian seas, Global Biogeochem.Cycles, 24, GB4033, doi:10.1029/2010GB003834.
Amon, R. M. W., and B. Meon (2004), The biogeochemistry of dissolvedorganic matter and nutrients in two large Arctic estuaries and potentialimplications for our understanding of the Arctic Ocean system, Mar.Chem., 92(1–4), 311–330, doi:10.1016/j.marchem.2004.06.034.
Aufdenkampe, A. K., J. I. Hedges, J. E. Richey, A. V. Krusche, andC. A. Llerena (2001), Sorptive fractionation of dissolved organic nitrogenand amino acids onto fine sediments within the Amazon Basin, Limnol.Oceanogr., 46(8), 1921–1935, doi:10.4319/lo.2001.46.8.1921.
Balcarczyk, K. L., J. B. Jones, R. Jaffé, and N. Maie (2009), Stream dis-solved organic matter bioavailability and composition in watershedsunderlain with discontinuous permafrost, Biogeochemistry, 94(3),255–270, doi:10.1007/s10533-009-9324-x.
Bélanger, S., H. Xie, N. Krotkov, P. Larouche, W. F. Vincent, andM. Babin (2006), Photomineralization of terrigenous dissolved organicmatter in Arctic coastal waters from 1979 to 2003: Interannual variabilityand implications of climate change, Global Biogeochem. Cycles, 20,GB4005, doi:10.1029/2006GB002708.
Benner, R., and B. Biddanda (1998), Photochemical transformations ofsurface and deep marine dissolved organic matter: Effects on bacterialgrowth, Limnol. Oceanogr., 43(6), 1373–1378, doi:10.4319/lo.1998.43.6.1373.
Bertilsson, S., and L. J. Tranvik (1998), Photochemically produced car-boxylic acids as substrates for freshwater bacterioplankton, Limnol.Oceanogr., 43(5), 885–895, doi:10.4319/lo.1998.43.5.0885.
Boyer, E. W., G. M. Hornberger, K. E. Bencala, and D. M. McKnight (1997),Response characteristics of DOC flushing in an alpine catchment, Hydrol.Processes, 11, 1635–1647, doi:10.1002/(SICI)1099-1085(19971015)11:12<1635::AID-HYP494>3.0.CO;2-H.
Bro, R. (1997), PARAFAC: Tutorial and applications, Chemom. Intell. Lab.Syst., 38(2), 149–171, doi:10.1016/S0169-7439(97)00032-4.
Brown, R. D. (2000), Northern Hemisphere snow cover variability andchange, 1915–97, J. Clim., 13(13), 2339–2355, doi:10.1175/1520-0442(2000)013<2339:NHSCVA>2.0.CO;2.
Cauwet, G., and I. Sidorov (1996), The biogeochemistry of Lena River:Organic carbon and nutrients distribution, Mar. Chem., 53(3–4), 211–227,doi:10.1016/0304-4203(95)00090-9.
Coble, P. (1996), Characterization of marine and terrestrial DOM in sea-water using excitation-emission matrix spectroscopy, Mar. Chem., 51(4),325–346, doi:10.1016/0304-4203(95)00062-3.
Coble, P. G., S. A. Green, N. V. Blough, and R. B. Gagosian (1990),Characterization of dissolved organic matter in the Black Sea by fluores-cence spectroscopy, Nature, 348, 432–435, doi:10.1038/348432a0.
Coble, P. G., C. E. Del Castillo, and B. Avril (1998), Distribution and opti-cal properties of CDOM in the Arabian Sea during the 1995 southwestmonsoon, Deep Sea Res., Part II, 45(10–11), 2195–2223, doi:10.1016/S0967-0645(98)00068-X.
Cory, R. M., and D. M. McKnight (2005), Fluorescence spectroscopyreveals ubiquitous presence of oxidized and reduced quinones in dis-solved organic matter, Environ. Sci. Technol., 39(21), 8142–8149,doi:10.1021/es0506962.
Cory, R. M., D. M. McKnight, Y.-P. Chin, P. Miller, and C. L. Jaros (2007),Chemical characteristics of fulvic acids from Arctic surface waters:Microbial contributions and photochemical transformations, J. Geophys.Res., 112, G04S51, doi:10.1029/2006JG000343.
Cory, R. M., M. P. Miller, D. M. McKnight, J. J. Guerard, and P. L. Miller(2010), Effect of instrument-specific response on the analysis of fulvicacid fluorescence spectra, Limnol. Oceanogr. Methods, 8, 67–78,doi:10.4319/lom.2010.8.0067.
Dittmar, T., and G. Kattner (2003), The biogeochemistry of the river andshelf ecosystem of the Arctic Ocean: A review, Mar. Chem., 83(3–4),103–120, doi:10.1016/S0304-4203(03)00105-1.
Fellman, J. B., D. V. D’Amore, E. Hood, and R. D. Boone (2008), Fluores-cence characteristics and biodegradability of dissolved organic matter inforest and wetland soils from coastal temperate watersheds in southeastAlaska, Biogeochemistry, 88, 169–184, doi:10.1007/s10533-008-9203-x.
Fellman, J. B., E. Hood, and R. G. M. Spencer (2010a), Fluorescence spec-troscopy opens new windows into dissolved organic matter dynamics infreshwater ecosystems: A review, Ecol. Res., 55(6), 1–12, doi:10.4319/lo.2010.55.6.0000.
Fellman, J. B., R. G. M. Spencer, P. J. Hernes, R. T. Edwards,D. V. D’Amore, and E. Hood (2010b), The impact of glacier runoff onthe biodegradability and biochemical composition of terrigenous dis-solved organic matter in near-shore marine ecosystems, Mar. Chem.,121(1–4), 112–122, doi:10.1016/j.marchem.2010.03.009.
Finlay, J., J. Neff, S. Zimov, A. Davydova, and S. Davydov (2006), Snow-melt dominance of dissolved organic carbon in high-latitude watersheds:Implications for characterization and flux of river DOC, Geophys. Res.Lett., 33, L10401, doi:10.1029/2006GL025754.
Frey, K. E., and J.W. McClelland (2009), Impacts of permafrost degradationon arctic river biogeochemistry, Hydrol. Processes, 23(1), 169–182,doi:10.1002/hyp.7196.
Geller, A. (1986), Comparison of mechanisms enhancing biodegradabilityof refractory lake water constituents, Limnol. Oceanogr., 31, 755–764,doi:10.4319/lo.1986.31.4.0755.
Gibson, J. A. E., W. F. Vincent, B. Nieke, and R. Pienitz (2000), Control ofbiological exposure to UV radiation in the Arctic Ocean: Comparison ofthe roles of ozone and riverine dissolved organic matter, Arctic, 53(4),372–382.
Gordeev, V. V., J. M. Martin, I. S. Sidorov, and M. V. Sidorova (1996), Areassessment of the Eurasian river input of water, sediment, major ele-ments, and nutrients to the Arctic Ocean, Am. J. Sci., 296, 664–691,doi:10.2475/ajs.296.6.664.
Guo, L., C.-L. Ping, and R. W. Macdonald (2007), Mobilization pathwaysof organic carbon from permafrost to Arctic rivers in a changing climate,Geophys. Res. Lett., 34, L13603, doi:10.1029/2007GL030689.
Hansell, D. A., D. Kadko, and N. R. Bates (2004), Degradation of terrige-nous dissolved organic carbon in the western Arctic Ocean, Science,304(5672), 858–861, doi:10.1126/science.1096175.
Helms, J. R., A. Stubbins, J. D. Ritchie, E. C. Minor, D. J. Kieber, andK. Mopper (2008), Absorption spectral slopes and slope ratios as indi-cators of molecular weight, source, and photobleaching of chromo-phoric dissolved organic matter, Limnol. Oceanogr., 53(3), 955–969,doi:10.4319/lo.2008.53.3.0955.
Hernes, P. J., and R. Benner (2003), Photochemical and microbial degrada-tion of dissolved lignin phenols: Implications for the fate of terrigenousdissolved organic matter in marine environments, J. Geophys. Res.,108(C9), 3291, doi:10.1029/2002JC001421.
Hernes, P. J., A. C. Robinson, and A. K. Aufdenkampe (2007), Fraction-ation of lignin during leaching and sorption and implications for organicmatter “freshness,” Geophys. Res. Lett., 34, L17401, doi:10.1029/2007GL031017.
Holmes, R. M., J. W. McClelland, P. A. Raymond, B. B. Frazer,B. J. Peterson, and M. Stieglitz (2008), Lability of DOC transported byAlaskan rivers to the Arctic Ocean, Geophys. Res. Lett., 35, L03402,doi:10.1029/2007GL032837.
Holmes, R. M., et al. (2011), Seasonal and annual fluxes of nutrients andorganic matter from large rivers to the Arctic Ocean and surroundingseas, Estuaries Coasts, 34, 1–14, doi:10.1007/s12237-011-9386-6.
MANN ET AL.: DOM COMPOSITION AND LABILITY IN KOLYMA RIVER BASIN G01028G01028
13 of 15

Hood, E., J. B. Fellman, R. G. M. Spencer, P. J. Hernes, R. Edwards,D. D’Amore, and D. Scott (2009), Glaciers as a source of ancient andlabile organic matter to the marine environment, Nature, 462(7276),1044–1047, doi:10.1038/nature08580.
Hornberger, G. M., K. E. Bencala, and D. M. McKnight (1994), Hydrolog-ical controls on dissolved organic carbon during snowmelt in the SnakeRiver near Montezuma, Colorado, Biogeochemistry, 25, 147–165,doi:10.1007/BF00024390.
Inamdar, S. P., N. O’Leary, M. J. Mitchell, and J. T. Riley (2006), Theimpact of storm events on solute exports from a glaciated forested water-shed in western New York, USA, Hydrol. Processes, 20(16), 3423–3439,doi:10.1002/hyp.6141.
Kieber, R. J., X. Zhou, and K. Mopper (1990), Formation of carbonyl com-pounds from photodegradation of humic substances in natural waters:Fate of riverine carbon in the sea, Limnology, 35(7), 1503–1515.
Kimble, J. M. (2004), Cryosols: Permafrost-Affected Soils, edited byJ. M. Kimble, Springer, New York.
Lafrenière, M. J., and M. J. Sharp (2004), The concentration and fluores-cence of dissolved organic carbon (DOC) in glacial and nonglacialcatchments: Interpreting hydrological flow routing and doc sources,Arct. Antarct. Alp. Res., 36(2), 156–165, doi:10.1657/1523-0430(2004)036[0156:TCAFOD]2.0.CO;2.
Laudon, H., S. Köhler, and I. Buffam (2004), Seasonal TOC exportfrom seven boreal catchments in northern Sweden, Aquat. Sci., 66(2),223–230, doi:10.1007/s00027-004-0700-2.
Letscher, R. T., D. A. Hansell, and D. Kadko (2011), Rapid removal ofterrigenous dissolved organic carbon over the Eurasian shelves of theArctic Ocean, Mar. Chem., 123(1–4), 78–87, doi:10.1016/j.marchem.2010.10.002.
Lindsay, R. W., and J. Zhang (2005), The thinning of Arctic sea ice,1988–2003: Have we passed a tipping point?, J. Clim., 18(22),4879–4894, doi:10.1175/JCLI3587.1.
Lobbes, J. M., H. P. Fitznar, and G. Kattner (2000), Biogeochemicalcharacteristics of dissolved and particulate organic matter in Russianrivers entering the Arctic Ocean, Geochim. Cosmochim. Acta, 64(17),2973–2983, doi:10.1016/S0016-7037(00)00409-9.
McGlynn, B. L., and J. J. McDonnell (2003), Role of discrete landscapeunits in controlling catchment dissolved organic carbon dynamics, WaterResour. Res., 39(4), 1090, doi:10.1029/2002WR001525.
McGuire, A. D., L. G. Anderson, T. R. Christensen, S. Dallimore, L. Guo,D. J. Hayes, M. Heimann, T. D. Lorenson, R. W. Macdonald, andN. Roulet (2009), Sensitivity of the carbon cycle in the Arctic to climatechange, Ecol. Monogr., 79(4), 523–555, doi:10.1890/08-2025.1.
McKnight, D. M., and G. R. Aiken (1998), Sources and age of aquatichumus, in Aquatic Humic Substances: Ecology and Biogeochemistry,edited by D. Hessen and L. Tranvik, pp. 9–39, Springer, Berlin.
McKnight, D. M., E. W. Boyer, P. K. Westerhoff, P. T. Doran, T. Kulbe,and D. T. Andersen (2001), Spectrofluorometric characterization of dis-solved organic matter for indication of precursor organic material andaromaticity, Limnol. Oceanogr., 46(1), 38–48, doi:10.4319/lo.2001.46.1.0038.
Miller, W. L., and R. G. Zepp (1995), Photochemical production of dis-solved inorganic carbon from terrestrial organic matter: Significance tothe oceanic organic carbon cycle, Geophys. Res. Lett., 22(4), 417–420,doi:10.1029/94GL03344.
Mopper, K., and D. J. Kieber (2002), Photochemistry and the cycling of car-bon, sulfur, nitrogen and phosphorus, in Biogeochemistry of MarineOrganic Matter, edited by D. A. Hansell and C. A. Carlson, pp. 455–507,Academic, San Diego, Calif., doi:10.1016/B978-012323841-2/50011-7.
Murphy, K. R., C. A. Stedmon, T. D. Waite, and G. M. Ruiz (2008), Dis-tinguishing between terrestrial and autochthonous organic matter sourcesin marine environments using fluorescence spectroscopy, Mar. Chem.,108, 40–58, doi:10.1016/j.marchem.2007.10.003.
Neff, J. C., J. C. Finlay, S. A. Zimov, S. P. Davydov, J. J. Carrasco, E. A. G.Schuur, and A. I. Davydova (2006), Seasonal changes in the age andstructure of dissolved organic carbon in Siberian rivers and streams,Geophys. Res. Lett., 33, L23401, doi:10.1029/2006GL028222.
O’Donnell, J. A., G. R. Aiken, E. S. Kane, and J. B. Jones (2010), Sourcewater controls on the character and origin of dissolved organic matter instreams of the Yukon River basin, Alaska, J. Geophys. Res., 115,G03025, doi:10.1029/2009JG001153.
Opsahl, S., and R. Benner (1998), Photochemical reactivity of dissolvedlignin in river and ocean waters, Limnol. Oceanogr., 43(6), 1297–1304,doi:10.4319/lo.1998.43.6.1297.
Opsahl, S. P., and R. G. Zepp (2001), Photochemically-induced alterationof stable carbon isotope ratios (d13C) in terrigenous dissolved organiccarbon,Geophys. Res. Lett., 28(12), 2417–2420, doi:10.1029/2000GL012686.
Opsahl, S. P., R. Benner, and R. M. W. Amon (1999), Major flux ofterrigenous dissolved organic matter through the Arctic Ocean, Limnol.Oceanogr., 44(8), 2017–2023, doi:10.4319/lo.1999.44.8.2017.
Osburn, C. L., L. Retamal, and W. F. Vincent (2009), Photoreactivity ofchromophoric dissolved organic matter transported by the MackenzieRiver to the Beaufort Sea, Mar. Chem., 115(1-2), 10–20, doi:10.1016/j.marchem.2009.05.003.
Peterson, B. J., R. M. Holmes, J. W. McClelland, C. J. Vörösmarty,R. B. Lammers, A. I. Shiklomanov, I. A. Shiklomanov, and S. Rahmstorf(2002), Increasing river discharge to the Arctic Ocean, Science,298(5601), 2171–2173, doi:10.1126/science.1077445.
Raymond, P. A., J. W. McClelland, R. M. Holmes, A. V. Zhulidov,K. Mull, B. J. Peterson, R. G. Striegl, G. R. Aiken, and T. Y. Gurtovaya(2007), Flux and age of dissolved organic carbon exported to the ArcticOcean: A carbon isotopic study of the five largest arctic rivers, GlobalBiogeochem. Cycles, 21, GB4011, doi:10.1029/2007GB002934.
Sierra, M. M. D., M. Giovanela, E. Parlanti, and E. J. Soriano-Sierra (2005),Fluorescence fingerprint of fulvic and humic acids from varied origins asviewed by single-scan and excitation/emission matrix techniques,Chemosphere, 58(6), 715–733, doi:10.1016/j.chemosphere.2004.09.038.
Spencer, R. G. M., G. R. Aiken, K. P. Wickland, R. G. Striegl, andP. J. Hernes (2008), Seasonal and spatial variability in dissolved organicmatter quantity and composition from the Yukon River basin, Alaska,Global Biogeochem. Cycles, 22, GB4002, doi:10.1029/2008GB003231.
Spencer, R. G. M., G. R. Aiken, K. D. Butler, M. M. Dornblaser,R. G. Striegl, and P. J. Hernes (2009a), Utilizing chromophoric dissolvedorganic matter measurements to derive export and reactivity of dissolvedorganic carbon exported to the Arctic Ocean: A case study of the YukonRiver, Alaska, Geophys. Res. Lett., 36, L06401, doi:10.1029/2008GL036831.
Spencer, R. G. M., et al. (2009b), Photochemical degradation of dissolvedorganic matter and dissolved lignin phenols from the Congo River,J. Geophys. Res., 114, G03010, doi:10.1029/2009JG000968.
Spencer, R. G. M., P. J. Hernes, R. Ruf, A. Baker, R. Y. Dyda, A. Stubbins,and J. Six (2010), Temporal controls on dissolved organic matter andlignin biogeochemistry in a pristine tropical river, Democratic Republicof Congo, J. Geophys. Res., 115, G03013, doi:10.1029/2009JG001180.
Stedmon, C. A., and R. Bro (2008), Characterizing dissolved organic matterfluorescence with parallel factor analysis: A tutorial, Limnol. Oceanogr.Methods, 6, 572–579, doi:10.4319/lom.2008.6.572.
Stedmon, C. A., and S. Markager (2005a), Resolving the variability of dis-solved organic matter fluorescence in a temperate estuary and its catch-ment using PARAFAC analysis, Limnol. Oceanogr., 50(2), 686–697,doi:10.4319/lo.2005.50.2.0686.
Stedmon, C. A., and S. Markager (2005b), Tracing the production anddegradation of autochthonous fractions of dissolved organic matterusing fluorescence analysis, Limnol. Oceanogr., 50(5), 1415–1426,doi:10.4319/lo.2005.50.5.1415.
Stedmon, C. A., C. Markager, and R. Bro (2003), Tracing dissolved organicmatter in aquatic environments using a new approach to fluorescencespectroscopy, Mar. Chem., 82(3–4), 239–254, doi:10.1016/S0304-4203(03)00072-0.
Stone, R. S., E. G. Dutton, J. M. Harris, and D. Longenecker (2002), Earlierspring snowmelt in northern Alaska as an indicator of climate change,J. Geophys. Res., 107(D10), 4089, doi:10.1029/2000JD000286.
Striegl, R. G., G. R. Aiken, M. M. Dornblaser, P. A. Raymond, andK. P. Wickland (2005), A decrease in discharge-normalized DOC exportby the Yukon River during summer through autumn, Geophys. Res.Lett., 32, L21413, doi:10.1029/2005GL024413.
Striegl, R. G., M. M. Dornblaser, G. R. Aiken, K. P. Wickland, andP. A. Raymond (2007), Carbon export and cycling by the Yukon,Tanana, and Porcupine rivers, Alaska, 2001–2005, Water Resour. Res.,43, W02411, doi:10.1029/2006WR005201.
Stubbins, A., R. G. M. Spencer, H. Chen, P. G. Hatcher, K. Mopper,P. J. Hernes, V. L. Mwamba, A. M. Mangangu, J. N. Wabakanghanzi,and J. Six (2010), Illuminated darkness: Molecular signatures of CongoRiver dissolved organic matter and its photochemical alteration asrevealed by ultrahigh precision mass spectrometry, Limnol. Oceanogr.,55(4), 1467–1477, doi:10.4319/lo.2010.55.4.1467.
Tarnocai, C., J. G. Canadell, E. A. G. Schuur, P. Kuhry, G. Mazhitova,and S. Zimov (2009), Soil organic carbon pools in the northern circum-polar permafrost region, Global Biogeochem. Cycles, 23, GB2023,doi:10.1029/2008GB003327.
Tranvik, L. J., and S. Bertilsson (2001), Contrasting effects of solar UVradiation on dissolved organic sources for bacterial growth, Ecol. Lett.,4(5), 458–463, doi:10.1046/j.1461-0248.2001.00245.x.
U.S. Environmental Protection Agency (1984), Methods for chemicalanalysis of water and wastes, Rep. EPA-600/4-79-020, Washington, D. C.
MANN ET AL.: DOM COMPOSITION AND LABILITY IN KOLYMA RIVER BASIN G01028G01028
14 of 15

Walker, S. A., R. M. W. Amon, C. A. Stedmon, S. Duan, and P. Louchouarn(2009), The use of PARAFAC modeling to trace terrestrial dissolvedorganic matter and fingerprint water masses in coastal Canadian Arcticsurface waters, J. Geophys. Res., 114, G00F06, doi:10.1029/2009JG000990.
Weishaar, J. L., G. R. Aiken, B. A. Bergamaschi, M. S. Fram, R. Fujii, andK. Mopper (2003), Evaluation of specific ultraviolet absorbance as anindicator of the chemical composition and reactivity of dissolved organiccarbon, Environ. Sci. Technol., 37(20), 4702–4708, doi:10.1021/es030360x.
Wu, P., R. Wood, and P. Stott (2005), Human influence on increasingArctic river discharges, Geophys. Res. Lett., 32, L02703, doi:10.1029/2004GL021570.
Zimov, S. A., E. A. G. Schuur, and F. S. Chapin (2006), Permafrost and theglobal carbon budget, Science, 312(5780), 1612–1613, doi:10.1126/science.1128908.
E. Bulygina, R. M. Holmes, P. J. Mann, and R. G. M. Spencer, WoodsHole Research Center, 149 Woods Hole Rd., Falmouth, MA 02540,USA. ([email protected])S. Davydov, A. Davydova, N. Zimov, and S. Zimov, Northeast Science
Station, Pacific Institute for Geography, Far East Branch, RussianAcademy of Sciences, PO Box 18, Cherskiy, Republic of Sakha, Yakutia678830, Russia.
MANN ET AL.: DOM COMPOSITION AND LABILITY IN KOLYMA RIVER BASIN G01028G01028
15 of 15