Effects of charging on the chromophores of dissolved organic matter from the Rio Negro basin
62
Accepted Manuscript Effects of Charging on the Chromophores of Dissolved Organic Matter from the Rio Negro Basin Mingquan Yan, Gregory V. Korshin, Francis Claret, Jean-Philippe Croué, Massimiliano Fabbricino, Hervé Gallard, Thorsten Schäfer, Marc F. Benedetti PII: S0043-1354(14)00234-6 DOI: 10.1016/j.watres.2014.03.044 Reference: WR 10569 To appear in: Water Research Received Date: 14 December 2013 Revised Date: 17 February 2014 Accepted Date: 17 March 2014 Please cite this article as: Yan, M., Korshin, G.V., Claret, F., Croué, J.-P., Fabbricino, M., Gallard, H., Schäfer, T., Benedetti, M.F., Effects of Charging on the Chromophores of Dissolved Organic Matter from the Rio Negro Basin, Water Research (2014), doi: 10.1016/j.watres.2014.03.044. This is a PDF file of an unedited manuscript that has been accepted for publication. As a service to our customers we are providing this early version of the manuscript. The manuscript will undergo copyediting, typesetting, and review of the resulting proof before it is published in its final form. Please note that during the production process errors may be discovered which could affect the content, and all legal disclaimers that apply to the journal pertain.
-
Upload
independent -
Category
Documents
-
view
4 -
download
0
Transcript of Effects of charging on the chromophores of dissolved organic matter from the Rio Negro basin
Accepted Manuscript
Effects of Charging on the Chromophores of Dissolved Organic Matter from the RioNegro Basin
Mingquan Yan, Gregory V. Korshin, Francis Claret, Jean-Philippe Croué,Massimiliano Fabbricino, Hervé Gallard, Thorsten Schäfer, Marc F. Benedetti
PII: S0043-1354(14)00234-6
DOI: 10.1016/j.watres.2014.03.044
Reference: WR 10569
To appear in: Water Research
Received Date: 14 December 2013
Revised Date: 17 February 2014
Accepted Date: 17 March 2014
Please cite this article as: Yan, M., Korshin, G.V., Claret, F., Croué, J.-P., Fabbricino, M., Gallard, H.,Schäfer, T., Benedetti, M.F., Effects of Charging on the Chromophores of Dissolved Organic Matter fromthe Rio Negro Basin, Water Research (2014), doi: 10.1016/j.watres.2014.03.044.
This is a PDF file of an unedited manuscript that has been accepted for publication. As a service toour customers we are providing this early version of the manuscript. The manuscript will undergocopyediting, typesetting, and review of the resulting proof before it is published in its final form. Pleasenote that during the production process errors may be discovered which could affect the content, and alllegal disclaimers that apply to the journal pertain.
MANUSCRIP
T
ACCEPTED
ACCEPTED MANUSCRIPT
Graphical AbstractGraphical AbstractGraphical AbstractGraphical Abstract
0.000
0.001
0.002
0.003
0.004
0.005
0.006
3 4 5 6 7 8 9 10 11
Spec
tral p
aram
eter
DSl
ope
Spec
tral p
aram
eter
DSl
ope
Spec
tral p
aram
eter
DSl
ope
Spec
tral p
aram
eter
DSl
ope 3
25325
325
325 -- --
375
375
375
375
pHpHpHpH
experiment experiment
model model
Carboxylic groups Carboxylic groups
Phenolic groups Phenolic groups
colloidal fraction hydrophobic fraction
DOM from Rio Negro basin
MANUSCRIP
T
ACCEPTED
ACCEPTED MANUSCRIPT
1
Effects Effects Effects Effects of of of of Charging Charging Charging Charging on on on on the the the the Chromophores Chromophores Chromophores Chromophores of of of of Dissolved Dissolved Dissolved Dissolved Organic Organic Organic Organic 1
Matter from the Rio Negro BasinMatter from the Rio Negro BasinMatter from the Rio Negro BasinMatter from the Rio Negro Basin 2
Mingquan Yan&, Gregory V. Korshin*, Francis Claret§, Jean-Philippe Croué##, 3
Massimiliano Fabbricino**, Hervé Gallard##, Thorsten Schäfer§§ and Marc F. 4
Benedetti# 5
&Department of Environmental Engineering, Peking University, Key 6
Laboratory of Water and Sediment Sciences, Ministry of Education, Beijing 7
100871, China 8
* Department of Civil and Environmental Engineering, University of 9
Washington, Seattle, WA 98195-2700 United States 10
**Dipartimento di Ingegneria Idraulica ed Ambientale "Girolamo Ippolito", 11
Universitá degli Studi di Napoli Federico II Via Claudio 21, 80125 Naples Italy 12
# Institut de Physique du Globe de Paris – Sorbonne Paris Cité - Université 13
Paris-Diderot , UMR CNRS 7154, Paris, France 14
## Equipe Chimie de l'Eau et Traitement des Eaux 15
Institut de Chimie des Milieux et Matériaux de Poitiers UMR 7285 CNRS 16
Ecole Nationale Supérieure d'Ingénieurs de Poitiers – Université de Poitiers 17
86022 Poitiers Cedex France 18

MANUSCRIP
T
ACCEPTED
ACCEPTED MANUSCRIPT
2
§ Bureau des Recherches Géologiques et Minières, Environment and 19
Process Division 3, avenue Claude Guillemin F-45060 Orleans Cedex 2 20
France 21
§§ Forschungszentrum Karlsruhe, Institut für Nukleare Entsorgung (INE) P.O. 22
Box 3640 76021 Karlsruhe, Germany 23
24
& Corresponding author. Address: Department of Environmental Engineering, 25
College of Environmental Sciences and Engineering, Peking University, 26
Beijing 100871, China; Tel: +86 10 62755914-81, Fax: +86 10 62756526. E-27
mail: [email protected] 28
29
30
MANUSCRIP
T
ACCEPTED
ACCEPTED MANUSCRIPT
3
AbstractAbstractAbstractAbstract 31
This study demonstrates that the deprotonation of dissolved organic matter 32
(DOM) originating from a small creek characteristic for DOM-rich waters 33
located in the Rio Negro basin can be quantified based on measurements of 34
pH effects on its absorbance spectra. The method was ascertained by the 35
data of Near-Edge X-Ray Absorbance Spectroscopy (NEXAFS), 36
potentiometric titration to quantify the structural and compositional differences 37
between the colloidal and hydrophobic fractions that contribute 91% of black-38
water creek DOM. Changes in the absorbance spectra of the DOM fractions 39
caused by deprotonation quantified via numeric deconvolution which indicated 40
the presence of six well-resolved Gaussian bands in the differential spectra. 41
The emergence of these bands was determined to be associated with the 42
engagement of carboxylic and phenolic functionalities and changes of inter-43
chromophore interactions in DOM molecules. Interpretation of the data based 44
on the NICA-Donnan approach showed that behavior of DOM chromophores 45
was consistent with results of potentiometric titrations. Similar trends were 46
observed for changes of the spectral slope of the DOM absorbance spectra in 47
the range of wavelengths 325 to 375 nm (DSlope325-375). The behavior of 48
DSlope325-375 values was modeled based on the NICA-Donnan approach and 49
correlated with potentiometrically-estimated charges attributed to the 50
carboxylic and phenolic groups. The correlations between DSlope325-375 and 51
MANUSCRIP
T
ACCEPTED
ACCEPTED MANUSCRIPT
4
charges of low- and high-affinity protonation-active groups in DOM were 52
monotonic but not linear and had important differences between the colloidal 53
and hydrophobic fractions. 54
55
KeywordsKeywordsKeywordsKeywords: : : : Amazon River, absorbance, deprotonation, dissolved organic 56
matter, NEXAFS, NICA-Donnan model 57
58
MANUSCRIP
T
ACCEPTED
ACCEPTED MANUSCRIPT
5
1. Introduction 59
Soil organic matter and water-borne dissolved organic matter (DOM) are 60
fundamentally important components of all environmental systems. Because 61
the generation of aquatic DOM is affected by local biogeochemical conditions, 62
many of its properties, e.g. its affinity to the proton and metal ions, sizes and 63
charges of DOM molecules, their surface activity, the presence of redox active 64
functionalities all of which frequently play a crucial role in environmental 65
processes, are site-specific (Milne et al., 2001; Lenoir et al., 2010; 66
Aeschbacher et al., 2012) and affected by seasonal cycles (Milne et al., 2001; 67
Leenheer and Croué, 2003; Ellis et al., 2012). Remarkable progress has been 68
made in the exploration of DOM site-specificity but effects of local 69
environmental conditions and processes on its structure and reactivity remain 70
to be understood on more detail. 71
In this context, the understanding of properties of DOM from the Amazon 72
River basin is especially important because this area contributes ca. 7% of the 73
global flux of DOM to the oceans while transformations of this DOM have 74
been shown to generate a considerable fraction of the regional flux of CO2 75
(Richey et al., 2002; Mayorga et al., 2005). Due these factors, elucidation of 76
the intrinsic properties of Amazonian DOM as well as DOM from other fluvial 77
systems is essential for understanding global and local carbon cycles 78

MANUSCRIP
T
ACCEPTED
ACCEPTED MANUSCRIPT
6
(Hedges et al., 1997; Ellis et al., 2012; Ward et al., 2013). Extensive prior 79
research has addressed many important details the genesis and fate of 80
Amazonian DOM (Hedges et al., 1994; Patel et al., 1999; Krusche et al., 2002; 81
Moreira-Turcq et al., 2003; Amaral et al., 2013; Ward et al., 2013), its role in 82
the speciation of major and trace constituents (Maurice-Bourgoin et al., 2003; 83
Rocha et al., 2003; Allard et al., 2004; de Oliveira et al., 2007; Fritsch et al., 84
2009; Perez et al., 2011; Kim et al., 2012), its photochemical transformations 85
(Patel-Sorrentino et al., 2004; Rodriguez-Zuniga et al., 2008; Remington et al., 86
2011; Amaral et al., 2013) and longitudinal, seasonal or anthropogenically-87
induced changes of its properties (McClain et al., 1997; Aufdenkampe et al., 88
2001; Bernardes et al., 2004; de Oliveira et al., 2007; Salisbury et al., 2011; 89
Amaral et al., 2013). For instance, (Hedges et al., 2000) and ensuing studies 90
(Aufdenkampe et al., 2007) presented a regional “chromatographic” model to 91
account for the evolution of DOM from alluvial soils to the Amazon’s main 92
stem and concluded that selective sorption of DOM onto minerals was the key 93
process that affects the properties of different fractions of organic carbon of 94
the rivers. Prior studies concerned with the evolution of DOM also concluded 95
that further exploration of its composition and reactivity, especially its 96
deprotonation-protonation and charging processes is necessary to understand 97
the partitioning processes in soils and riparian zones (Amon and Benner, 98
1996; Hedges et al., 2000; Alasonati et al., 2010). 99
MANUSCRIP
T
ACCEPTED
ACCEPTED MANUSCRIPT
7
While many advanced structure- and compound-specific ex situ methods, e.g. 100
potentiometric titrations have been used to examine the composition, genesis 101
and reactivity of DOM from the Amazon basin and other environmental 102
systems (Hedges et al., 1994; Benner et al., 1995; Hedges et al., 2000; 103
Aufdenkampe et al., 2001; Bernardes et al., 2004; Aufdenkampe et al., 2007; 104
Mopper et al., 2007; Kujawinski et al., 2009; Ellis et al., 2012; Ward et al., 105
2013), results of these studies can be augmented by data of techniques that 106
allow quantification of DOM properties in situ. Examination of absorbance and 107
fluorescence of DOM can play this role since these methods use unaltered 108
waters to produce optical spectra that are sensitive to DOM molecular weight, 109
aromaticity and fluorophore and chromophore speciation (Hoge et al., 1993; 110
Green and Blough, 1994; Peuravuori and Pihlaja, 1997; McKnight et al., 2001; 111
Chen et al., 2003; Del Vecchio and Blough, 2004; Helms et al., 2008; Boyle et 112
al., 2009). Studies that employed these techniques to examine Amazonian 113
DOM have demonstrated the presence of fluorophore and chromophore 114
groups associated with DOM molecules of varying sizes and chemical natures 115
(Mounier et al., 1999; Patel-Sorrentino et al., 2002; Patel-Sorrentino et al., 116
2004; Rodriguez-Zuniga et al., 2008). Variations of pH prominent in the 117
Amazon basin (Do Nascimento et al., 2008) affect the fluorescence of 118
Amazonian DOM (Mounier et al., 1999; Patel-Sorrentino et al., 2002) but the 119
nature of such changes that are common to fresh-water DOM (Tam and 120
MANUSCRIP
T
ACCEPTED
ACCEPTED MANUSCRIPT
8
Sposito, 1993; Patel-Sorrentino et al., 2002; Spencer et al., 2007; Do 121
Nascimento et al., 2008) has not been unambiguously determined. 122
Effects of pH variations on the absorbance of DOM (Tam and Sposito, 1993; 123
Andersen et al., 2000; Andersen and Gjessing, 2002; Spencer et al., 2007) 124
have been addressed but because the absorbance spectra of DOM are 125
featureless, these studies has been limited. DOM absorbance spectra can be 126
made more feature-rich via the use of a differential approach that quantifies 127
the evolution of the spectra as a function of any desired reaction parameter, 128
for instance metal complexation, oxidant dose or pH (Korshin et al., 1999; 129
Dryer et al., 2008; Janot et al., 2010; Yan et al., 2013b). 130
In this paper, we present results of the examination of DOM from the basin of 131
the Rio Negro River, one of the most important tributaries of the Amazon, 132
using the method of differential absorbance (DA) and compare its data with 133
those generated using potentiometric titrations and structure-sensitive 134
methods. This study’s objective is to establish in situ measurable 135
spectroscopic markers of the important intrinsic properties of molecules 136
Amazonian DOM without preconcertration and altering DOM properties, 137
notably relationships between pH, charge and, on the other hand, absorbance 138
of these molecules and, ultimately, their reactivity in more complex systems, 139
MANUSCRIP
T
ACCEPTED
ACCEPTED MANUSCRIPT
9
for instance in their interactions with mineral phases (Perez et al., 2011; Janot 140
et al., 2012) that define the evolution of DOM in the soil-river continua. 141
2.2.2.2. Materials and Materials and Materials and Materials and MMMMethodsethodsethodsethods 142
2.1.2.1.2.1.2.1. Isolation and fractionation of samples.Isolation and fractionation of samples.Isolation and fractionation of samples.Isolation and fractionation of samples. 143
DOM samples were collected from the Igarapé Bonito, a small creek that 144
flows into the Jau River. The GPS coordinates of the Jau station were S 145
01°52.325', W 61°35.027'. The Jau River, a tributary of the Rio Negro, is fed 146
by groundwater seepages and creeks similar to the Igarapé Bonito (Alasonati 147
et al., 2010). The dissolved organic carbon (DOC) concentration, pH and 148
conductivity in the Igarapé Bonito at the time of sampling were 56.6 mg L-1, 149
3.6 and 65 µS cm-1, respectively. Preparation of the samples included filtration 150
through 1 µm GF/C filters followed by reverse osmosis (RO). RO concentrates 151
were dialyzed against 0.1 M HCl and 0.2 M HF to isolate a colloidal (COLL) 152
fraction with a 3,500 D nominal cutoff from the other DOM fractions. The 153
fraction passing through the dialysis membrane was fractionated using XAD-8 154
and XAD-4 resin columns to obtain the fractions of hydrophobic (HPO) and 155
transphilic (TPH) DOM, respectively (Croue et al., 2000). Prior to this 156
separation, DOM solutions were acidified to pH 2. After pumping each sample 157
through the columns, they were rinsed with a formic acid solution at pH 2. 158
DOM retained on them was eluted using an acetonitrile/water (75%/25% v/v) 159
MANUSCRIP
T
ACCEPTED
ACCEPTED MANUSCRIPT
10
mixture. The eluent was evaporated under vacuum at 35-45 °C. 200 mL of 160
acetonitrile were added two or three times during the evaporation to eliminate 161
traces of formic acid. The dialysis/XAD resins procedure isolated over 90% of 162
the DOM in the RO concentrate. The COLL, HPO and TPH fractions 163
constituted 51%, 40% and 9%, respectively, of the total weight of DOM 164
extracted from the sample. DOC concentrations were determined with a 165
Shimadzu TOC-Vcsh carbon analyzer. Effects of acidic agents, e.g. HCl and 166
HF used in DOM isolation on intrinsic properties of the DOM were assumed to 167
be negligible for the purposes in this study (Hamilton-Taylor et al., 2011; 168
Ahmed et al., 2013) . 169
2.2. 2.2. 2.2. 2.2. Potentiometric titrationsPotentiometric titrationsPotentiometric titrationsPotentiometric titrations 170
Proton titrations were performed using a computer-controlled system in a 171
thermostated vessel (25°C) under 99.99% nitrogen (Janot et al., 2010; Janot 172
et al., 2012). DOM solutions were prepared at a 1 g L-1 DOC concentration in 173
the presence of a 0.04 M ionic strength. The pH was read using two pH 174
Metrohm electrodes (6.0133.100) and a Ag/AgCl glass reference Metrohm 175
electrode (6.0733.100) with a salt bridge (same as the solution). The 176
electrodes were calibrated with CO2-free KOH base (0.099 M) and HNO3 177
(0.100 M) at a 0.1 M ionic strength. The pH values read by the duplicate 178
electrodes were averaged. After addition of acid or base, the rate of drift for 179
both electrodes was measured over 1 minute and readings were accepted 180
MANUSCRIP
T
ACCEPTED
ACCEPTED MANUSCRIPT
11
when the drift was less than 0.1 mV min-1. For each data point the maximum 181
time for monitoring pH drift was equal to 20 minutes. 182
2.3. 2.3. 2.3. 2.3. Carbon NEXAFS analysis Carbon NEXAFS analysis Carbon NEXAFS analysis Carbon NEXAFS analysis 183
Carbon K-edge Near Edge X-Ray Absorption Fine Structure (NEXAFS) 184
spectra (Jacobsen et al., 1991) were measured at the Scanning Transmission 185
X-ray Microscopy (STXM) beamline X1A1 (NSLS) operated by the State 186
University of New York at Stony Brook. STXM sample preparation was 187
performed by drying 1 µL solution of resuspended freeze-dried DOM on a 100 188
nm thick Si3N4 window. The spectra were measured using the “point spectra” 189
procedure consisting of measurement between 280 to 310 eV in 0.1 eV steps 190
using 120 ms dwell time (Christl and Kretzschmar, 2007). Five consecutive 191
point spectra of a region on the Si3N4 window without sample were averaged 192
to obtain the I0(E) information. I(E) is the average of 15 spectra taken on three 193
different sample locations. Energy calibration of the spherical grating 194
monochromator was achieved by using the photon energy of the CO2 gas 195
adsorption band at 290.74 eV. To compare NEXAFS spectra, they were 196
baseline corrected and normalized to 1 at 295 eV prior to peak fitting. The 197
spectra were then deconvoluted as described in (Schafer et al., 2005). 198
Precision of determinations of carbon functionalities’ contributions based on 199
carbon NEXAFS data is estimated at ±2%. 200
2.4. 2.4. 2.4. 2.4. Spectrophotometric titrationsSpectrophotometric titrationsSpectrophotometric titrationsSpectrophotometric titrations 201
MANUSCRIP
T
ACCEPTED
ACCEPTED MANUSCRIPT
12
The method of differential spectrophotometric titration of DOM and 202
interpretation of its data have been described in sufficient detail in preceding 203
relevant publications (Dryer et al., 2008; Janot et al., 2010; Yan et al., 2013b). 204
DOM solutions were prepared at 2 or 5 mg L-1 DOC concentrations in the 205
presence of NaClO4 with ionic strength 0.04 M. Absorbance spectra were 206
recorded with Perkin-Elmer Lambda 18 UV/Vis spectrometer. Dilution effects 207
due to addition of acid and base were corrected for in the final data. Fitting of 208
model calculations was performed using Matlab 2010a. 209
3. Results and Discussion 210
3.1. 3.1. 3.1. 3.1. NEXAFS dataNEXAFS dataNEXAFS dataNEXAFS data 211
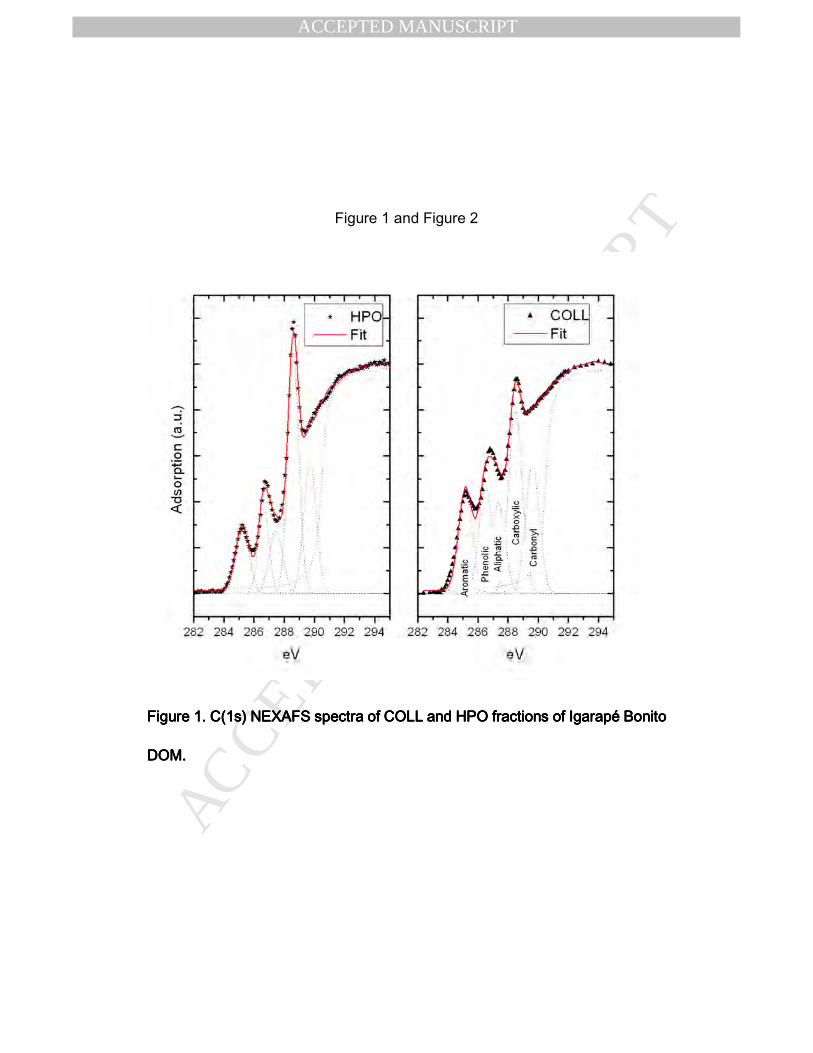
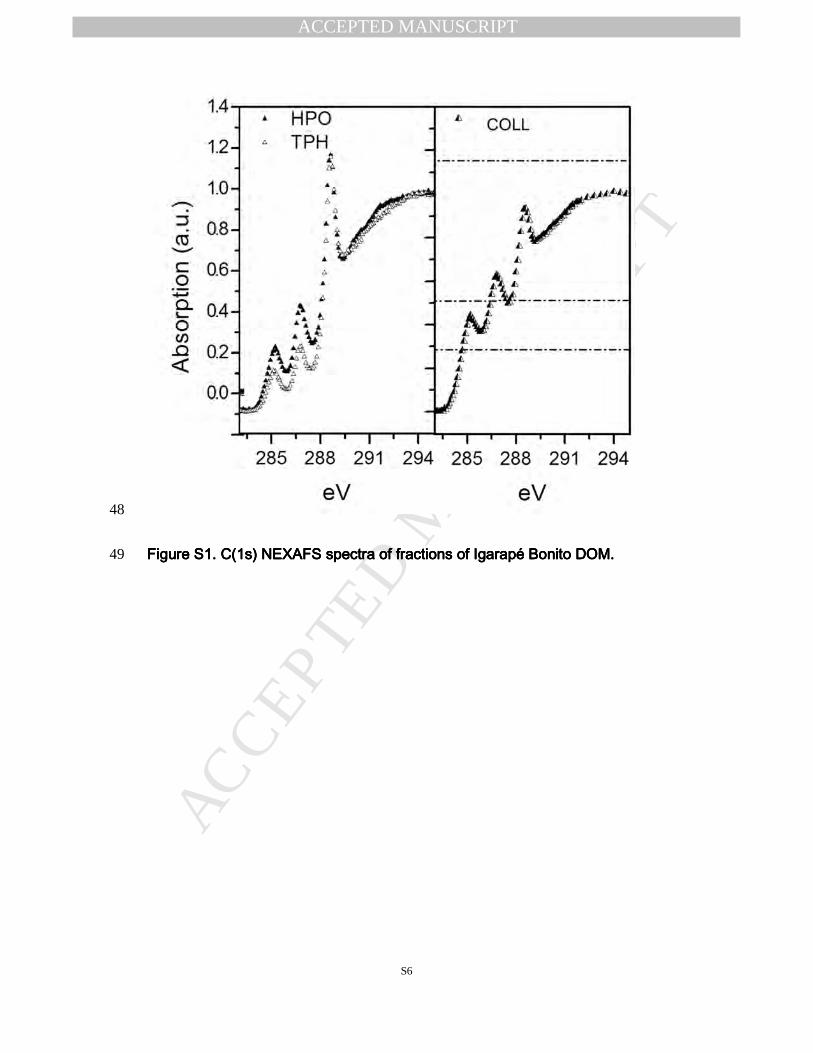
The NEXAFS spectra for the COLL, HPO and TPH fractions of Igarapé Bonito 212
DOM are shown in Figure S1 in the Supporting Information (SI) section.... 213
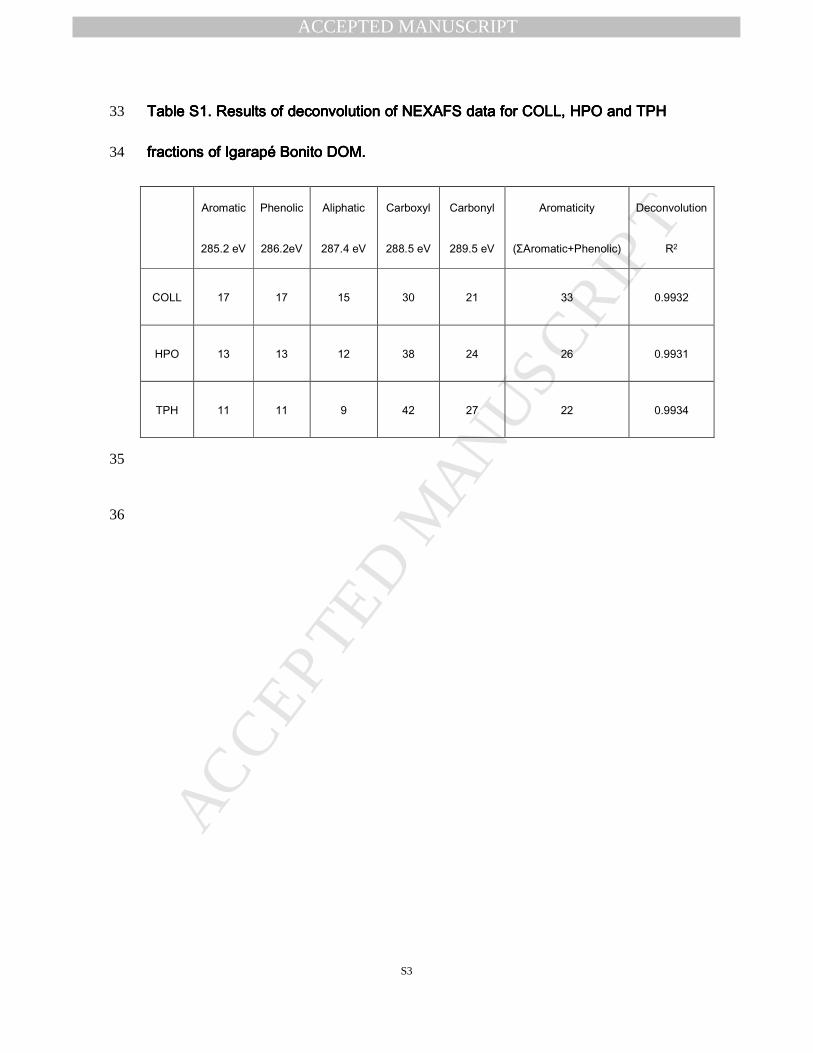
Results of their deconvolution that allowed determining contributions of 214
different functionalities are compiled in Table S1 in the SI section. In view the 215
NEXAFS spectra for HPO and TPH being similar, only the deconvoluted 216
NEXAFS spectra for the two major fractions, COLL and HPO are shown in 217
Figure 1. These data indicate that the COLL fraction is richer in aromatic 218
groups than HPO and TPH (34, 26 and 22%, respectively), while the 219
contributions of carboxylic groups exhibit an opposite trend (30, 38 and 42%, 220
MANUSCRIP
T
ACCEPTED
ACCEPTED MANUSCRIPT
13
respectively). Contributions of other functionalities (Figure 1) do not exhibit 221
prominent changes. 222
Figure 1Figure 1Figure 1Figure 1 223
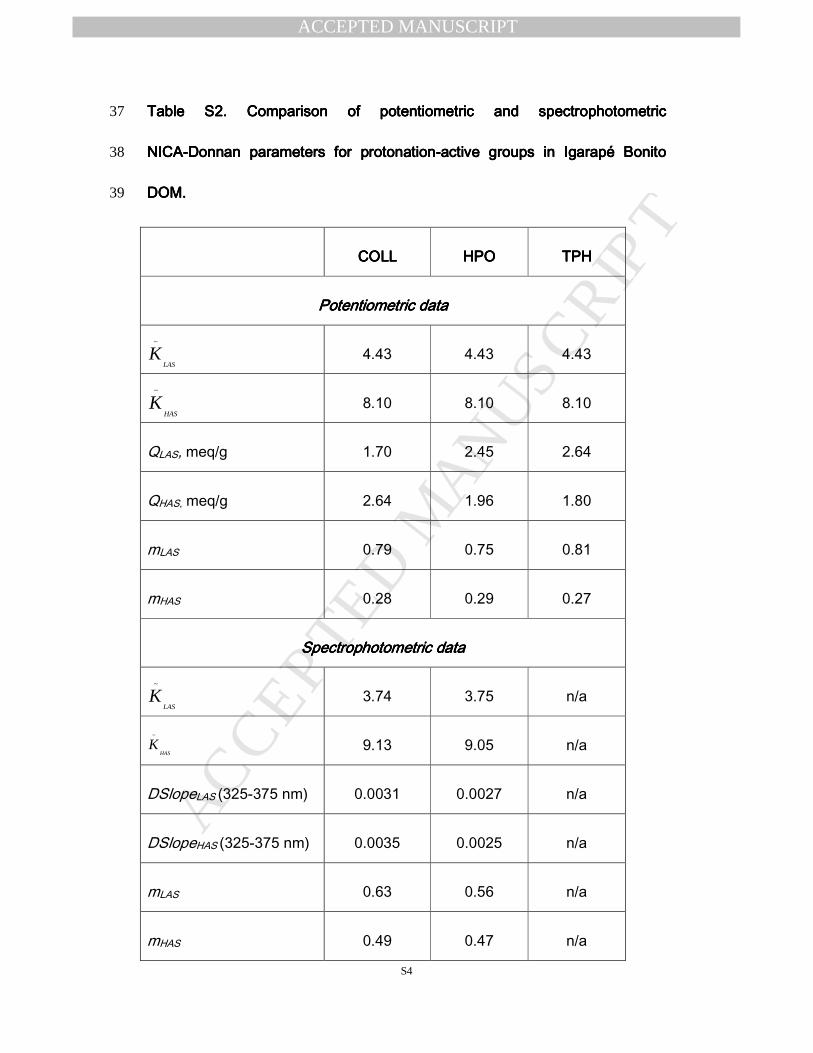
3.2. 3.2. 3.2. 3.2. PPPPotentiometric otentiometric otentiometric otentiometric datadatadatadata 224
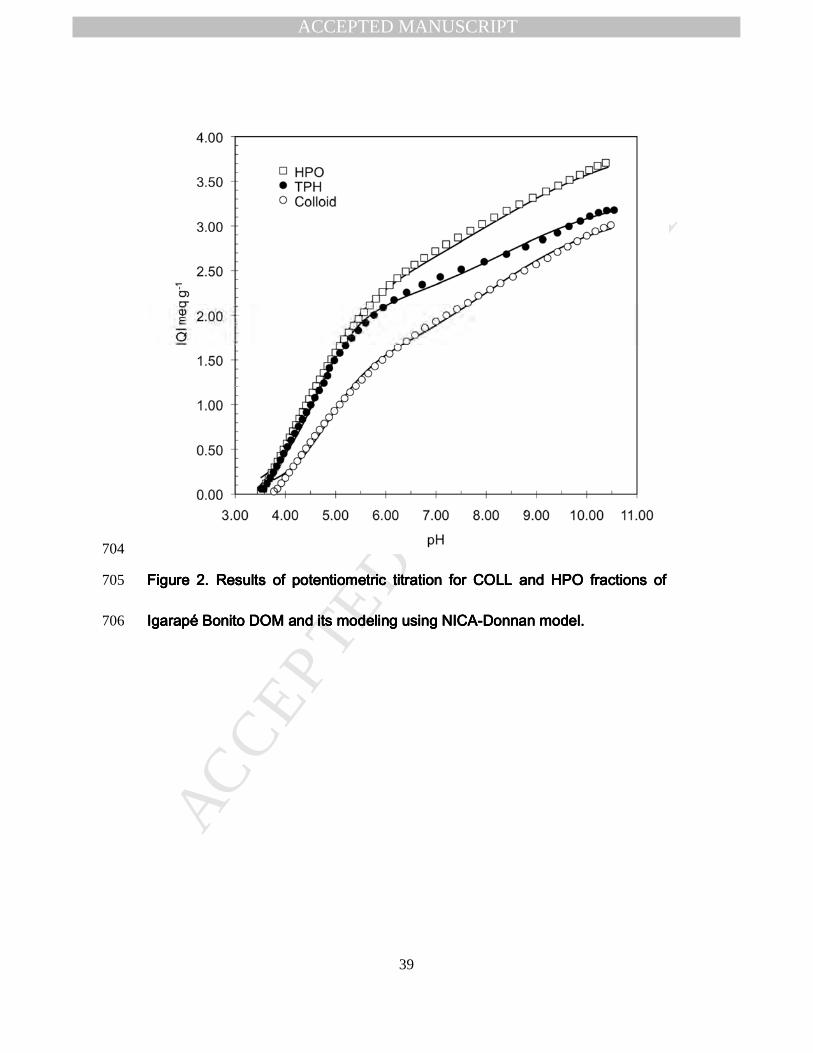
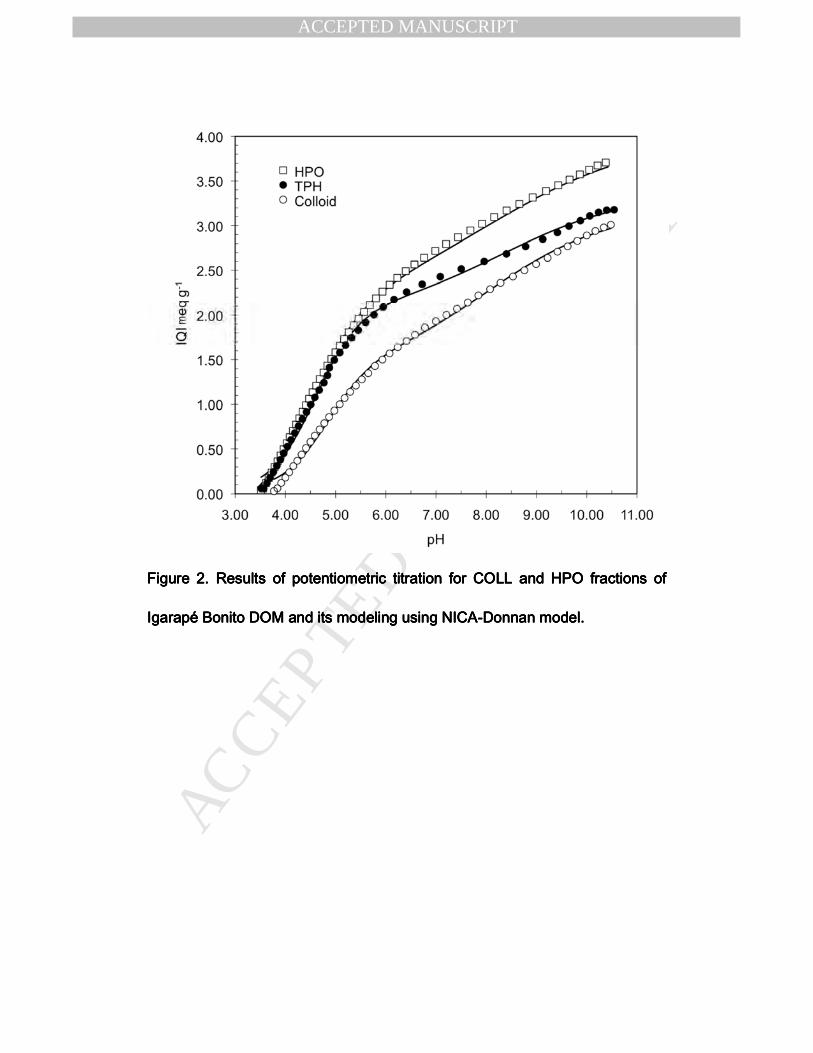
Results of potentiometric titration for the COLL, HPO and TPH fractions of 225
Igarapé Bonito DOM are shown in Figure 2. Modeling of the data shown in 226
Figure 2 based on the NICA-Donnan theory (Milne et al., 2001) to determine 227
concentrations of the low and high affinity proton binding sites (denoted 228
henceforth as LAS and HAS, respectively) and other parameters of DOM 229
protonation are compiled in Table S2. They show that in the COLL fraction the 230
HAS (largely associated with phenolic-type groups) are more abundant. The 231
average values of the LAS and HAS protonation constants of the examined 232
fractions of Igarapé Bonito DOM were determined to have identical average 233
pK values (specifically, the pK values were fixed at average 4.43 and 8.10 234
respectively while the other 4 parameters were optimized). The heterogeneity 235
parameters for the examined fractions were also close, having average values 236
of 0.78 and 0.28 for the LAS (mostly carboxylic type groups) and HAS, 237
respectively. The 0.28 value of the heterogeneity parameter for the HAS 238
indicates a larger chemical heterogeneity. This will be explored in more detail 239
based on the spectroscopic data. 240
MANUSCRIP
T
ACCEPTED
ACCEPTED MANUSCRIPT
14
Figure Figure Figure Figure 2222 241
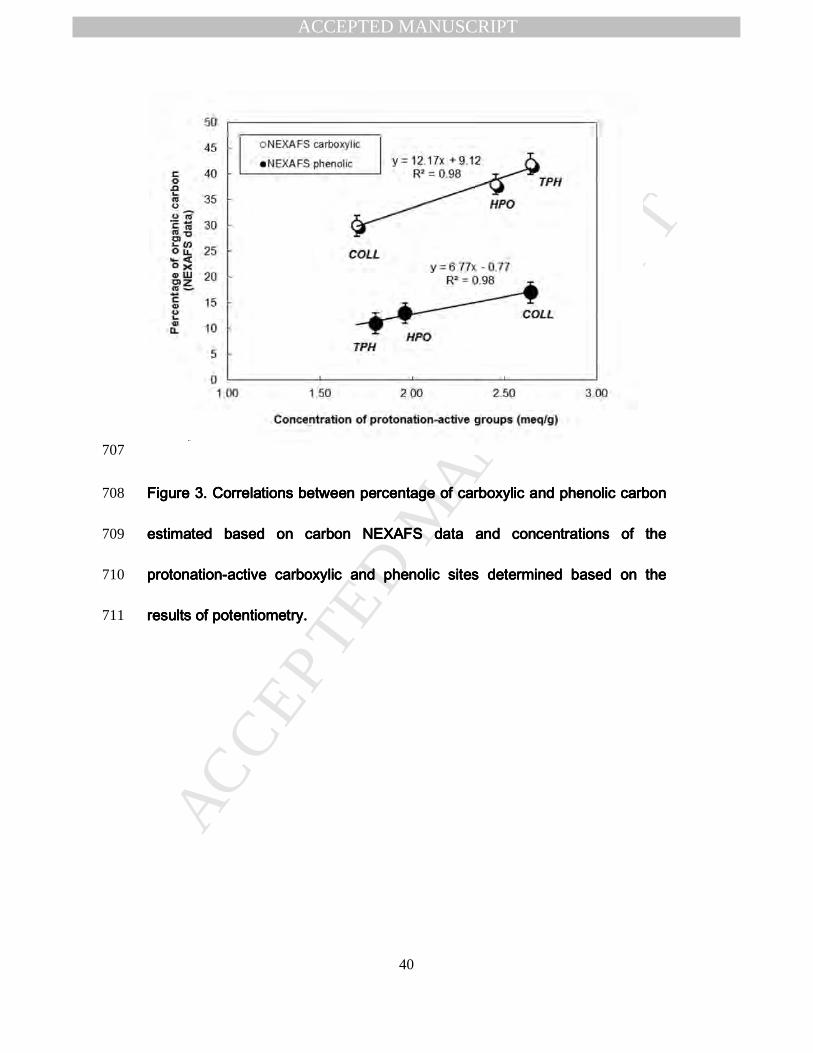
Trends in the concentrations of the HAS and LAS discerned based on the 242
potentiometric data agreed with those indicated by the carbon NEXAFS data 243
(Figure 3). This observation reinforces the notion that while the protonation 244
properties of the HPO and TPH fractions were very close, the colloidal fraction 245
was quite distinct. 246
Figure Figure Figure Figure 3333 247
3.3. 3.3. 3.3. 3.3. Differential absorbance resultsDifferential absorbance resultsDifferential absorbance resultsDifferential absorbance results 248
Absorbance experiments were carried out for the COLL and HPO fractions. 249
The TPH fraction was not studied by optical spectroscopy because it was 250
unavailable for the differential absorbance experiments. In addition, its 251
properties determined by NEXAFS and potentiometric titrations were very 252
close to those of the HPO fraction and it had a small contribution (i.e. 9%) to 253
the total concentration of organic carbon in Igarapé Bonito DOM. 254
The absorbance of both COLL and HPO fractions changed in response to pH 255
variations. As the pH increased, the absorbance increased at all wavelengths, 256
but the spectra remained featureless, as demonstrated in Figure S2 in the SI 257
section. To obtain more information on how pH variations affected the 258
MANUSCRIP
T
ACCEPTED
ACCEPTED MANUSCRIPT
15
behavior of chromophore groups of the DOM, DA spectra were calculated 259
using the equation below: 260
( ) ( ) ( )[ ]refpHApHAlDOC
pHA λλλ −⋅
=∆ 1 (1) 261
In this equation, ( )pHAλ∆ is the differential absorbance at any specified 262
wavelength, l is the optical cell’s length, ( )pHAλ and ( )refpHAλ are 263
absorbances at any desired pH value and a reference pH, respectively. The 264
spectrum recorded at pH 3.1 was used as the reference, respectively. 265
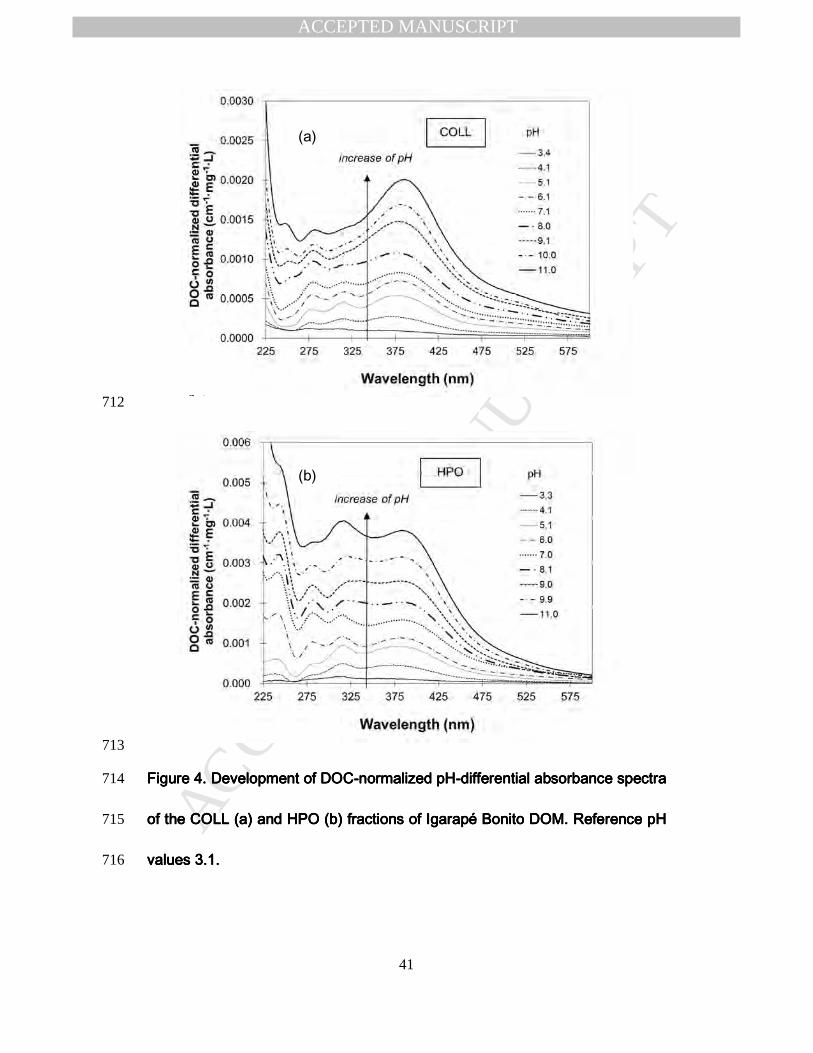
The intensity of the DA spectra increased monotonically with the pH, and 266
discernible features that had different prominence for the COLL and HPO 267
fractions were present in them (Figure 4). Specifically, peaks with maxima 268
located approximately at 240, 280 and 315 nm, as well a broad structure 269
located at >350 nm were prominent. 270
Figure 4Figure 4Figure 4Figure 4 271
Normalized (by the maximum of their intensity at λ>350 nm) DA spectra 272
(Figure S3) were calculated using the reference spectra recorded at pH 3.3 273
and 8.3 corresponding to the deprotonation of LAS and HAS chromophores, 274
respectively (Dryer et al., 2008). The data show that the deprotonation of LAS 275
chromophores of Igarapé Bonito DOM is associated with the emergence of 276
bands with maxima located at 240, 278, 315 and 375 nm (Figure S3a). These 277
MANUSCRIP
T
ACCEPTED
ACCEPTED MANUSCRIPT
16
features are similar for the HPO and COLL fractions, except that located for 278
HPO at 240 nm. The most intense feature in the normalized DA spectra of the 279
LAS chromophores is located at λ>350 nm, that is in the range where 280
manifestations of inter-chromophore interactions are located (Del Vecchio and 281
Blough, 2004; Dryer et al., 2008). The engagement of the HAS chromophores 282
is accompanied by the development of two bands with maxima close 247 nm 283
and 315 nm, and a much stronger feature with a maximum located at 385 to 284
390 nm; that feature was especially prominent for the COLL fraction (Figure 285
S3b). This is likely to indicate higher importance of inter-chromophore 286
interactions in the molecules of the COLL fractions of Igarapé Bonito DOM 287
due to their larger molecular weights (Green and Blough, 1994; Del Vecchio 288
and Blough, 2004). 289
To examine the structure of the pH-differential spectra of both COLL and HPO 290
fractions in more detail, they were deconvoluted to determine contributions of 291
discrete bands constituting them. In agreement with the approach presented 292
in prior research (Korshin et al., 1997; Gege, 2000; Yan et al., 2013b), such 293
bands were assumed to have a Gaussian shape when represented against 294
photon energy (measured in eV), calculated as 295
( ) ( )nmeVE
λ1240= (2) 296
MANUSCRIP
T
ACCEPTED
ACCEPTED MANUSCRIPT
17
The fitting procedure allowed determining such characteristics of each 297
Gaussian bands as the location of its maximum (E0i), width (Wi) and intensity 298
at E=E0i (A0i). The overall differential spectra (∆A(E)) were modeled as 299
( ) ∑
−−∆=∆i i
ii
W
EEAEA
2
00
2exp (3) 300
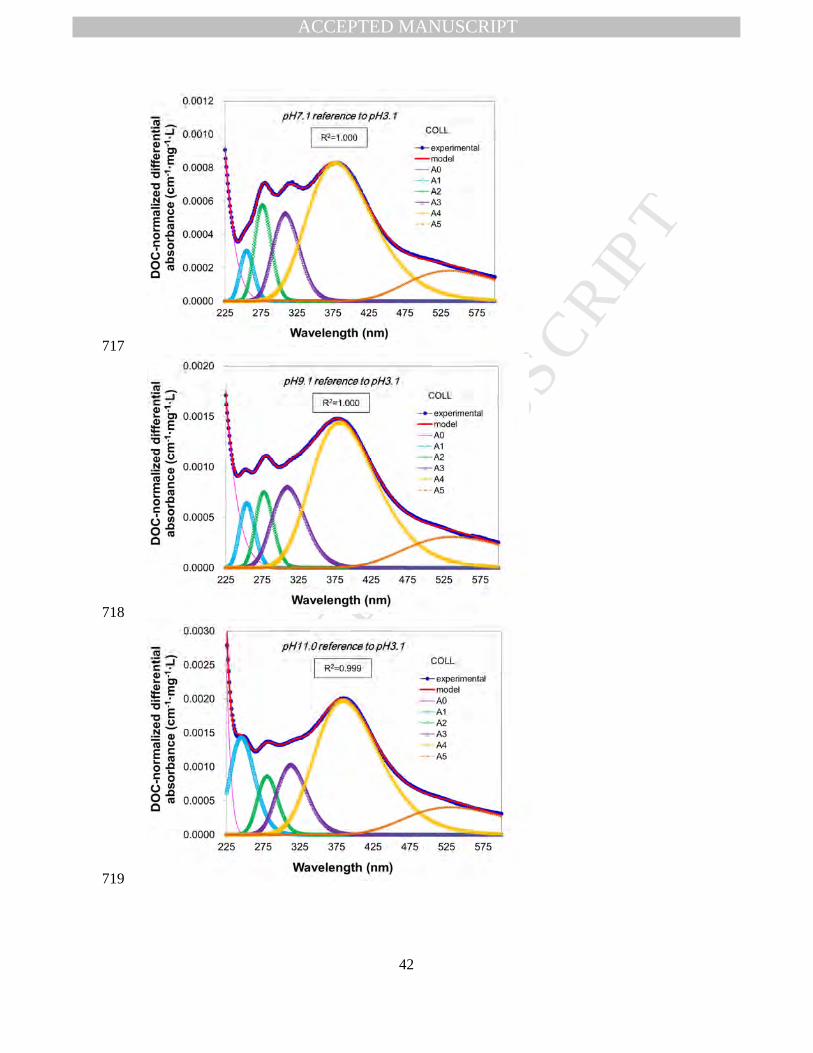
Selected results of the application of this concept to the modeling of pH-301
differential spectra of the COLL and HPO fractions of Igarapé Bonito DOM are 302
shown in Figure 5. They demonstrate a very close fit between the observed 303
and modeled spectra (R2>0.995). The pH-differential spectra of Igarapé 304
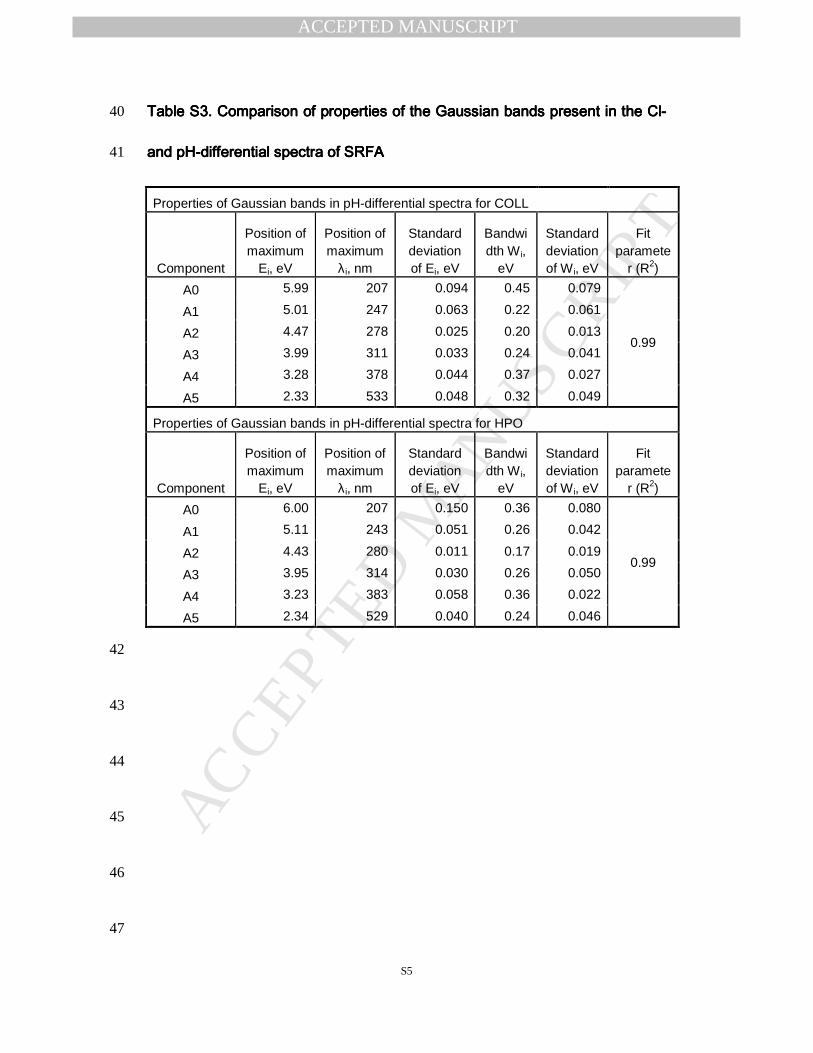
Bonito DOM were determined to comprise six Gaussian components whose 305
intensities changed with pH while positions of their maxima were practically 306
constant (Table S3). The maxima of the bands referred to, as in prior relevant 307
publications (Yan et al., 2013b) as A0, A1, A2, A3, A4 and A5, were located 308
at ca. 6.00 eV (207 nm), 5.07 eV (245 nm) 4.45 eV (280 nm), 3.97 eV (313 309
nm), 3.25 eV (380 nm) and 2.33 eV (530 nm). The locations of the maxima of 310
these Gaussian bands A1, A2, A3 and A4 were close to those of the bands 311
observed previously for SRFA (Yan et al., 2013b) while slight differences were 312
observed for bands A0 and A5. Because the properties of band A0 were 313
difficult to estimate due to the presence of spectroscopic interferences from 314
hydroxyl ions and the intensity of band A5 was lower than that of all other 315
bands, only the data for A1, A2, A3 and A4 will be discussed henceforth. 316
MANUSCRIP
T
ACCEPTED
ACCEPTED MANUSCRIPT
18
Figure Figure Figure Figure 5555 317
Changes of the intensity of band A1, A2, A3 and A4 with pH for COLL and 318
HPO are presented in Figure S4. Although the relative contributions of each 319
Gaussian band that comprise the pH-differential spectra of Igarapé Bonito 320
DOM were different (Figure 5 and Figure S4), trends in the evolution of the 321
intensity of each band caused variations of pH were similar to those typically 322
seen in potentiometric titrations. This was interpreted to indicate that these 323
bands comprise contributions of chromophores associated with both LAS and 324
HAS groups. 325
Prior research has demonstrated that bands A4 especially sensitive to the 326
changes of the intrinsic chemistry DOM molecules caused by their 327
deprotonation or complexation with metal cations (Yan et al., 2013b). 328
However, the relatively low intensity of these bands, especially that of band 329
A5 necessitate that the absorbance spectra of DOM be log-transformed and 330
differential spectra be calculated using the log-transformed data using the 331
expression below: 332
(4) 333
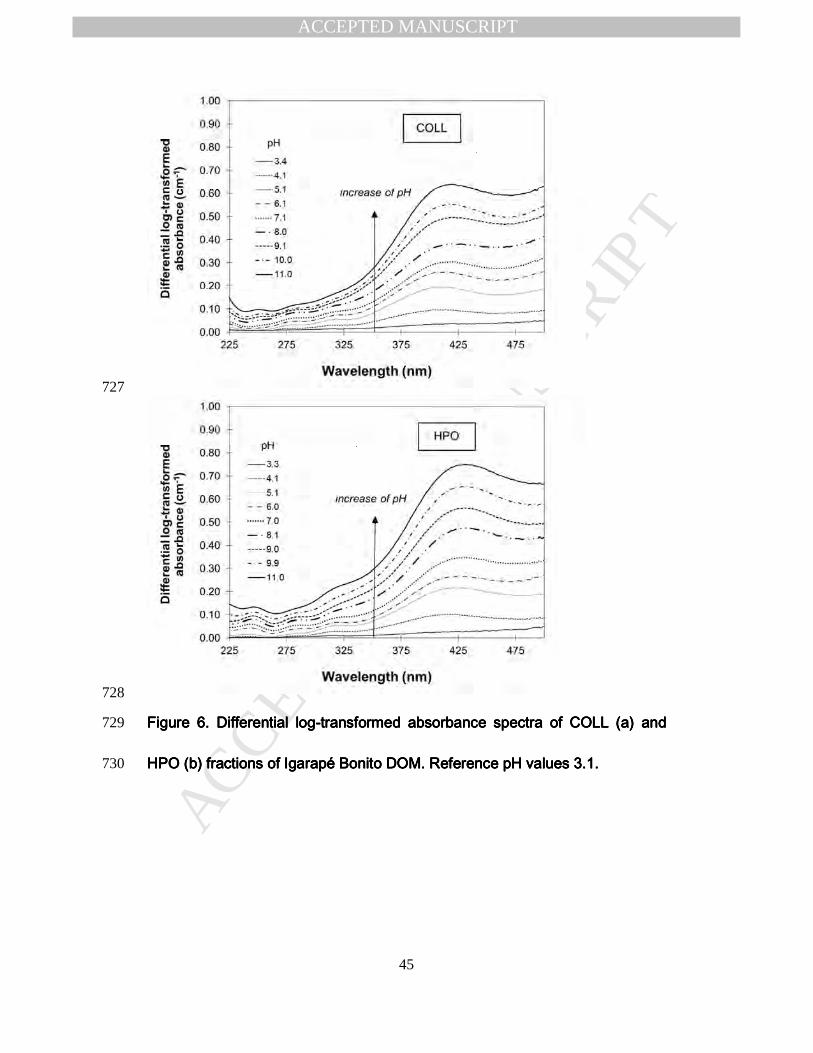
The differential log-transformed absorbance spectra of the COLL and HPO 334
fractions at selected pH values are presented in Figure 6. Similarly to the 335
linear differential spectra show in Figure 4, the intensity of the log-transformed 336
spectra increases with pH. This increase is especially prominent for 337
MANUSCRIP
T
ACCEPTED
ACCEPTED MANUSCRIPT
19
wavelengths > 320 nm. The prominence of the features observed in the log-338
transformed differential spectra and located at wavelengths > 320 nm is 339
associated with the development of Gaussian bands A4 that are relatively 340
inconspicuous in terms of their absolute intensities, compared with the 341
intensities of bands A1, A2 and A3. 342
In accord with the approach presented in prior research (Yan et al., 2013a), 343
we used the differential spectral slope in the range of wavelengths 325 to 375 344
nm (DSlope325-375) measured at varying pHs examine effects of pH on the 345
protonation of Igarapé Bonito DOM. DSlope325-375were calculated using the 346
formula given below: 347
325 375 325 375, 325 375,refiDSlope Slope Slope− − −= − (5) 348
In this expression, 325 375,iSlope − and 325 375,refSlope − are the slopes of the linear fit 349
of the log-transformed DOM absorbance in the wavelengths region 325 to 375 350
nm for any selected solution conditions and reference, respectively. The 351
choice of DSlope325-375 parameter reflects the observation that the intensity of 352
the log-transformed spectra undergoes rapid changes in the 325 to 375 nm 353
region corresponding to the location of Gaussian band A4 and these changes 354
are nearly linear vs. the observation wavelength. 355
To determine whether the evolution of the DA spectra of Igarapé Bonito DOM 356
could be described by the NICA-Donnan theory developed to model the 357
potentiometric behavior of DOM, we applied the equation developed in 358
MANUSCRIP
T
ACCEPTED
ACCEPTED MANUSCRIPT
20
literatures (Kinniburgh et al., 1999; Ritchie and Perdue, 2003; Dryer et al., 359
2008; Janot et al., 2010) to model the evolution of differential slopes of the 360
absorbance of Igarapé Bonito samples: 361
362
(6) 363
364
where ( )λLASDSlope and ( )λHASDSlope correspond to the maximum change of 365
absorbance associated with the deprotonation of the LAS (mostly carboxylic) 366
and HAS (mostly phenolic) groups, respectively, ( )λLASDSlope and ( )λHASDSlope 367
referred to DSlope value in the range of wavelengths 325 to 375 nm in this 368
study. ~
KLAS
and ~
KHAS
are the median values of the protons affinity distributions 369
for these groups, mLAS and mHAS define the width of these distributions and 370
are measures of the heterogeneity of DOM (Milne et al., 2001; Dryer et al., 371
2008). 372
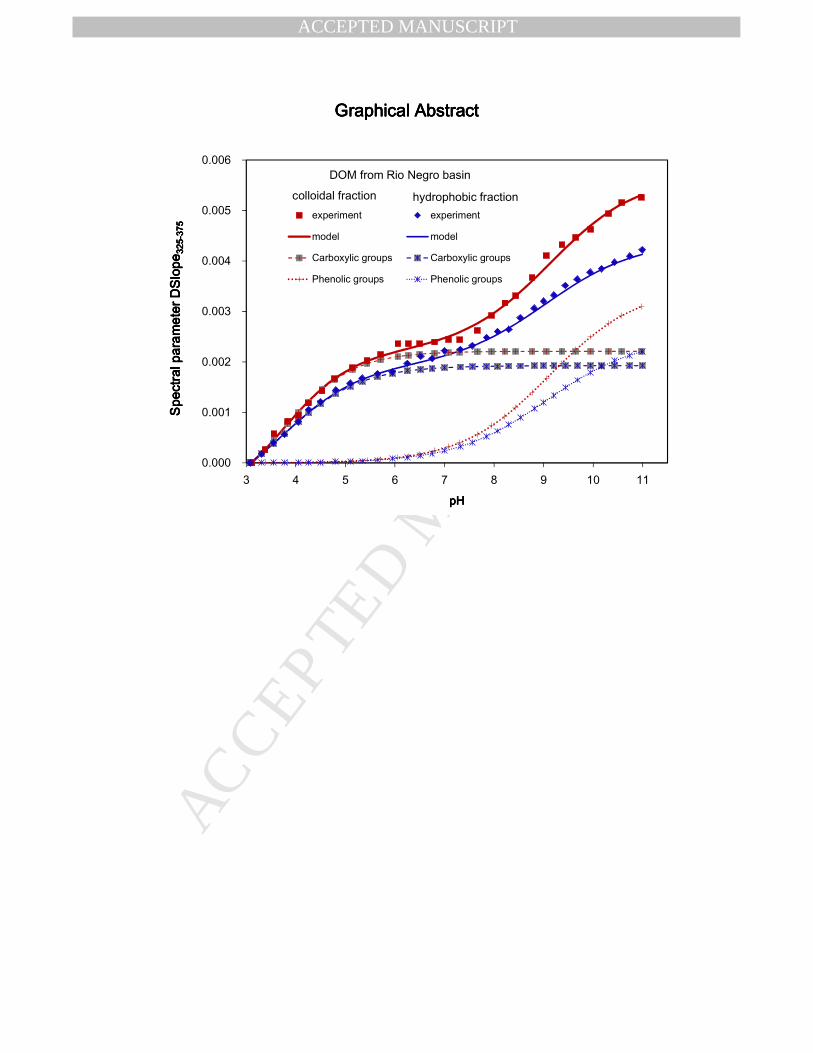
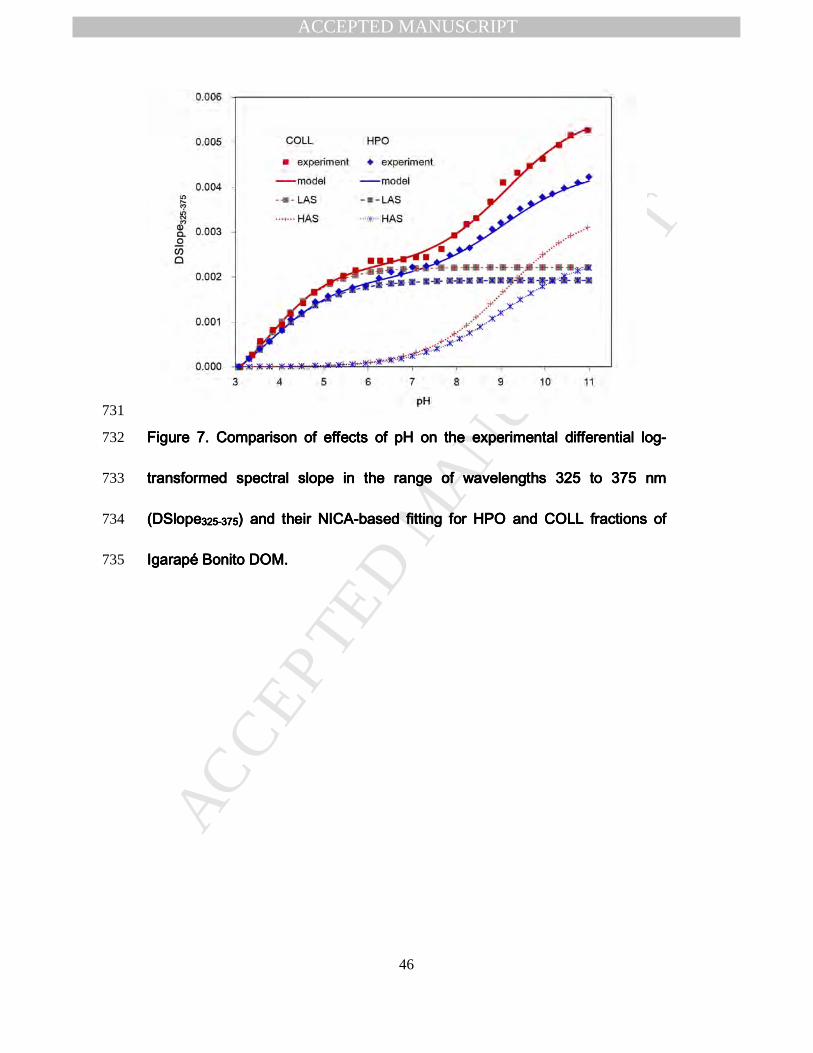
The behavior of DSlope325-375 values for COLL and HPO vs. pH and their 373
fitting is shown in Figure 7 and Table S2. The data show that excellent 374
agreement could be reached between the DSlope325-375 data for both COLL 375
and HPO samples and the predictions made based on the revised NICA-376
Donnan model (R2>0.99). 377
MANUSCRIP
T
ACCEPTED
ACCEPTED MANUSCRIPT
21
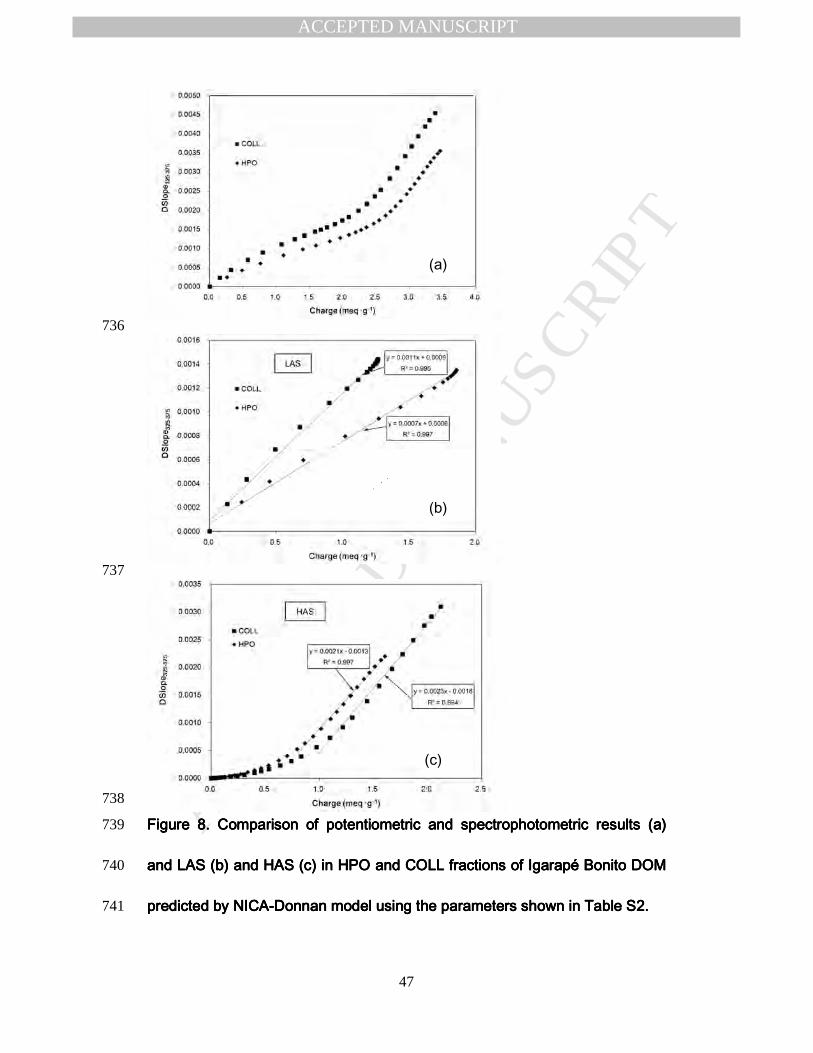
The above observations of the highly interpretable response of the 378
chromophores of Igarapé Bonito DOM to their deprotonation are enhanced by 379
the observation that changes of the spectral slope of the examined DOM 380
fractions are correlated with the charges of HAS and LAS groups in DOM 381
molecules calculated using the NICA-Donnan parameters obtained using 382
conventional potentiometric titration in Table 2. The correlations between LAS 383
and HAS charges and changes of the spectral slope are compared in Figure 384
8b and 8c, respectively. It demonstrates that while both QLAS and QHAS are 385
correlated with DSlope values, these correlations have distinct differences for 386
the LAS and HAS groups. In the former case, the correlations between QLAS 387
and DSlope values are nearly linear but the slope of the correlations are 388
different for the HPO and COLL fractions reflecting the difference in the 389
responses of carboxylic-type chromophores in these fractions to the 390
accumulation of charge. On the other hand, correlations between QHAS and 391
changes of the DSlope for COLL and HPO fractions are similar but the 392
response of the HAS phenolic-type chromophores is characterized by two 393
distinct ranges. In the range of QHAS charges from 0 to ca. 0.7 meq g-1, 394
changes of the slope are relatively small while for QHAS values above ca. 0.7 395
meq g-1, spectral slopes of DOM changes prominently but the accumulation of 396
charge is less rapid. This is likely to be indicative of the engagement of 397
MANUSCRIP
T
ACCEPTED
ACCEPTED MANUSCRIPT
22
distinct sub-groups of the HAS chromophores. Their properties need to be 398
examined in more detail in future studies. 399
Given the complexity of the linear or log-transformed DA spectra, the NICA-400
Donnan approach to interpret them appears to be an excellent approximation 401
although it does not address the nature of the distinct spectroscopic features, 402
for instance Gaussian bands A1 to A5. The presence of these bands, their 403
association with the charging of DOM molecules in the HPO and COLL 404
fractions highlights the need to expand the examination of responses of 405
chromophores and fluorophores of a wider range of DOM. On the other hand, 406
this can indicate that mechanisms other the deprotonation of the discrete 407
operationally defined LAS and HAS chromophores may define the evolution of 408
the pH-differential spectra. As mentioned above, these alternative 409
mechanisms are likely to reflect changes of inter-chromophore interactions 410
(Hoge et al., 1993; Green and Blough, 1994; Korshin et al., 1999; Del Vecchio 411
and Blough, 2004) that depend on the molecular weight and conformational 412
status of DOM molecules. pH-differential spectra can also reflect responses of 413
specific functionalities, for instance lignins, terpenoids, bound proteins and 414
others whose deprotonation may yield a distinct signal in the differential 415
spectroscopy. More work is needed to explore this issue further as well as to 416
quantify effects of other system parameters (e.g., those of ionic strength) on 417
chromophores in DOM of varying provenance. 418

MANUSCRIP
T
ACCEPTED
ACCEPTED MANUSCRIPT
23
4. Conclusions 419
The data presented above and their interpretation support the following 420
conclusions: 421
(1) The deprotonation of DOM originating from the Rio Negro basin can be 422
quantified based on measurements of pH effects on its absorbance 423
spectra. 424
(2) Changes in the absorbance spectra of the DOM fractions caused by 425
deprotonation quantified via numeric deconvolution which indicated the 426
presence of six well-resolved Gaussian bands in the differential spectra. 427
The emergence of these bands was determined to be associated with the 428
engagement of carboxylic and phenolic functionalities and changes of 429
inter-chromophore interactions in DOM molecules. 430
(3) Interpretation of the data of spectrophotometric titrations based on the 431
NICA-Donnan approach showed that behavior of DOM chromophores was 432
consistent with results of conventional potentiometric titrations. 433
(4) The behavior of DSlope325-375 values was correlated with charges 434
attributed to the carboxylic and phenolic groups. The correlations between 435
DSlope325-375 and charges of low- and high-affinity protonation-active 436
MANUSCRIP
T
ACCEPTED
ACCEPTED MANUSCRIPT
24
groups in DOM were monotonic but not linear and had important 437
differences between the HPO and COLL fractions. 438
439
AcknowledgementsAcknowledgementsAcknowledgementsAcknowledgements 440
This study has been partially supported by National Science Foundation 441
(grants 0504447 and 0931676). G. Korshin expresses gratitude to l’Institut de 442
Physique du Globe de Paris/Université de Paris VII and French INSU-CNRS 443
program ECCO for support of his work in Paris, and to the Foreign Experts 444
Program of China (GDW20131100008) for support of his work at Peking 445
University. Use of the National Synchrotron Light Source, Brookhaven 446
National Laboratory, was supported by the U.S. Department of Energy, Office 447
of Science, Office of Basic Energy Sciences, under Contract No. DE-AC02-448
98CH10886. Data were collected using the X1A STXM developed by the 449
group of Janoz Kirz and Chris Jacobsen at SUNY Stony Brook, with support 450
from the office of Biological and Environmental Research, US. DoE under 451
contract DE-FG02-89ER60858, and from the NSF under grant DBI-9605045. 452
Supporting InformationSupporting InformationSupporting InformationSupporting Information 453
This information is available free of charge on the Internet. 454
MANUSCRIP
T
ACCEPTED
ACCEPTED MANUSCRIPT
25
ReferencesReferencesReferencesReferences 455
Aeschbacher, M., Brunner, S.H., Schwarzenbach, R.P., Sander, M., 2012. 456
Assessing the effect of humic acid redox state on organic pollutant sorption by 457
combined electrochemical reduction and sorption experiments. Environ. Sci. 458
Technol. 46, 3882-3890. 459
Ahmed, I.A.M., Hamilton-Taylor, J., Lofts, S., Meeussen, J.C.L., Lin, C., 460
Zhang, H., Davison, W., 2013. Testing copper-speciation predictions in 461
freshwaters over a wide range of metal-organic matter ratios. Environ. Sci. 462
Technol. 47, 1487-1495. 463
Alasonati, E., Slaveykova, V.I., Gallard, H., Croue, J.P., Benedetti, M.F., 2010. 464
Characterization of the colloidal organic matter from the Amazonian basin by 465
asymmetrical flow field-flow fractionation and size exclusion chromatography. 466
Water Res. 44, 223-231. 467
Allard, T., Menguy, N., Salomon, J., Calligaro, T., Weber, T., Calas, G., 468
Benedetti, M.F., 2004. Revealing forms of iron in river-borne material from 469
major tropical rivers of the Amazon Basin (Brazil). Geochim. Cosmochim. Ac. 470
68, 3079-3094. 471
Amaral, J.H.F., Suhett, A.L., Melo, S., Farjalla, V.F., 2013. Seasonal variation 472
and interaction of photodegradation and microbial metabolism of DOC in 473
black water Amazonian ecosystems. Aquat. Microb. Ecol. 70, 157-168. 474
MANUSCRIP
T
ACCEPTED
ACCEPTED MANUSCRIPT
26
Amon, R.M.W., Benner, R., 1996. Bacterial utilization of different size classes 475
of dissolved organic matter. Limnol. Oceanogr. 41, 41-51. 476
Andersen, D.O., Alberts, J.J., Takacs, M., 2000. Nature of natural organic 477
matter (NOM) in acidified and limed surface waters. Water Res. 34, 266-278. 478
Andersen, D.O., Gjessing, E.T., 2002. Natural organic matter (NOM) in a 479
limed lake and its tributaries. Water Res. 36, 2372-2382. 480
Aufdenkampe, A.K., Hedges, J.I., Richey, J.E., Krusche, A.V., Llerena, C.A., 481
2001. Sorptive fractionation of dissolved organic nitrogen and amino acids 482
onto fine sediments within the Amazon Basin. Limnol. Oceanogr. 46, 1921-483
1935. 484
Aufdenkampe, A.K., Mayorga, E., Hedges, J.I., Llerena, C., Quay, P.D., 485
Gudeman, J., Krusche, A.V., Richey, J.E., 2007. Organic matter in the 486
Peruvian headwaters of the Amazon: Compositional evolution from the Andes 487
to the lowland Amazon mainstem. Org. Geochem. 38, 337-364. 488
Benner, R., Opsahl, S., ChinLeo, G., Richey, J.E., Forsberg, B.R., 1995. 489
Bacterial carbon metabolism in the Amazon River system. Limnol. Oceanogr. 490
40, 1262-1270. 491
Bernardes, M.C., Martinelli, L.A., Krusche, A.V., Gudeman, J., Moreira, M., 492
Victoria, R.L., Ometto, J., Ballester, M.V.R., Aufdenkampe, A.K., Richey, J.E., 493
Hedges, J.I., 2004. Riverine organic matter composition as a function of land 494
use changes, Southwest Amazon. Ecol. Appl. 14, S263-S279. 495
MANUSCRIP
T
ACCEPTED
ACCEPTED MANUSCRIPT
27
Boyle, E.S., Guerriero, N., Thiallet, A., Del Vecchio, R., Blough, N.V., 2009. 496
Optical properties of humic substances and CDOM: Relation to structure. 497
Environ. Sci. Technol. 43, 2262-2268. 498
Chen, J., LeBoef, E.J., Dai, S., Gu, B.H., 2003. Fluorescence spectroscopic 499
studies of natural organic matter fractions. Chemosphere 50, 639-647. 500
Christl, I., Kretzschmar, R., 2007. C-1s NEXAFS spectroscopy reveals 501
chemical fractionation of humic acid by cation-induced coagulation. Environ. 502
Sci. Technol. 41, 1915-1920. 503
Croue, J.P., Korshin, G.V., Benjamin, M.M., Foundation, A.R., 2000. 504
Characterization of Natural Organic Matter in Drinking Water. AWWA 505
Research Foundation and American Water Works Association. 506
de Oliveira, L.C., Sargentini, T., Rosa, A.H., Rocha, J.C., Simoes, M.L., 507
Martin-Neto, L., da Silva, W.T.L., Serudo, R.L., 2007. The influence of 508
seasonalness on the structural characteristics of aquatic humic substances 509
extracted from Negro river (Amazon state) waters: Interactions with Hg(II). J. 510
Brazil Chem. Soc. 18, 860-868. 511
Del Vecchio, R., Blough, N.V., 2004. On the origin of the optical properties of 512
humic substances. Environ. Sci. Technol. 38, 3885-3891. 513
Do Nascimento, N.R., Fritsch, E., Bueno, G.T., Bardy, M., Grimaldi, C., Melfi, 514
A.J., 2008. Podzolization as a deferralitization process: dynamics and 515
MANUSCRIP
T
ACCEPTED
ACCEPTED MANUSCRIPT
28
chemistry of ground and surface waters in an Acrisol-Podzol sequence of the 516
upper Amazon Basin. Eur. J. Soil Sci. 59, 911-924. 517
Dryer, D.J., Korshin, G.V., Fabbricino, M., 2008. In situ examination of the 518
protonation behavior of fulvic acids using differential absorbance 519
spectroscopy. Environ. Sci. Technol. 42, 6644-6649. 520
Ellis, E.E., Keil, R.G., Ingalls, A.E., Richey, J.E., Alin, S.R., 2012. Seasonal 521
variability in the sources of particulate organic matter of the Mekong River as 522
discerned by elemental and lignin analyses. J. Geophys. Res-Biogeo. 117. 523
Fritsch, E., Allard, T., Benedetti, M.F., Bardy, M., do Nascimento, N.R., Li, Y., 524
Calas, G., 2009. Organic complexation and translocation of ferric iron in 525
podzols of the Negro River watershed. Separation of secondary Fe species 526
from Al species. Geochim. Cosmochim. Ac. 73, 1813-1825. 527
Gege, P., 2000. Gaussian model for yellow substance absorption spectra, 528
Proc. Ocean Optics XV, Monaco 16 - 20 October 2000. 529
Green, S.A., Blough, N.V., 1994. Optical-absorption and fluorescence 530
properties of chromophoric dissolved organic-matter in matural-waters. Limnol. 531
Oceanogr. 39, 1903-1916. 532
Hamilton-Taylor, J., Ahmed, I.A.M., Davison, W., Zhang, H., 2011. How well 533
can we predict and measure metal speciation in freshwaters? Environ. Chem. 534
8, 461-465. 535
MANUSCRIP
T
ACCEPTED
ACCEPTED MANUSCRIPT
29
Hedges, J.I., Cowie, G.L., Richey, J.E., Quay, P.D., Benner, R., Strom, M., 536
Forsberg, B.R., 1994. Origins and processing of organic-matter in the Amazon 537
River as indicated by carbohydrates and amino-acids. Limnol. Oceanogr. 39, 538
743-761. 539
Hedges, J.I., Keil, R.G., Benner, R., 1997. What happens to terrestrial organic 540
matter in the ocean? Org. Geochem. 27, 195-212. 541
Hedges, J.I., Mayorga, E., Tsamakis, E., McClain, M.E., Aufdenkampe, A., 542
Quay, P., Richey, J.E., Benner, R., Opsahl, S., Black, B., Pimentel, T., 543
Quintanilla, J., Maurice, L., 2000. Organic matter in Bolivian tributaries of the 544
Amazon River: A comparison to the lower mainstream. Limnol. Oceanogr. 45, 545
1449-1466. 546
Helms, J.R., Stubbins, A., Ritchie, J.D., Minor, E.C., Kieber, D.J., Mopper, K., 547
2008. Absorption spectral slopes and slope ratios as indicators of molecular 548
weight, source, and photobleaching of chromophoric dissolved organic matter. 549
Limnol. Oceanogr. 53, 955-969. 550
Hoge, F.E., Vodacek, A., Blough, N.V., 1993. Inherent optical properties of the 551
ocean: Retrieval of the absorption coefficient of chromophoric dissolved 552
organic matter from airborne laser spectral fluorescence measurements. 553
Limnol. Oceanogr. 38, 1394-1402. 554
MANUSCRIP
T
ACCEPTED
ACCEPTED MANUSCRIPT
30
Jacobsen, C., Williams, S., Anderson, E., Browne, M.T., Buckley, C.J., Kern, 555
D., Kirz, J., Rivers, M., Zhang, X., 1991. Diffraction- limited imaging in a 556
scanning- transmission X-ray microscope. Opt. Commun. 86, 351-364. 557
Janot, N., Reiller, P.E., Korshin, G.V., Benedetti, M.F., 2010. Using 558
spectrophotometric titrations to characterize humic acid reactivity at 559
environmental concentrations. Environ. Sci. Technol. 44, 6782-6788. 560
Janot, N., Reiller, P.E., Zheng, X., Croue, J.P., Benedetti, M.F., 2012. 561
Characterization of humic acid reactivity modifications due to adsorption onto 562
alpha-Al2O3. Water Res. 46, 731-740. 563
Kim, J.H., Zell, C., Moreira-Turcq, P., Perez, M.A.P., Abril, G., Mortillaro, J.M., 564
Weijers, J.W.H., Meziane, T., Damste, J.S.S., 2012. Tracing soil organic 565
carbon in the lower Amazon River and its tributaries using GDGT distributions 566
and bulk organic matter properties. Geochim. Cosmochim. Ac. 90, 163-180. 567
Kinniburgh, D.G., van Riemsdijk, W.H., Koopal, L.K., Borkovec, M., Benedetti, 568
M.F., Avena, M.J., 1999. Ion binding to natural organic matter: competition, 569
heterogeneity, stoichiometry and thermodynamic consistency. Colloid and 570
Surface A 151, 147-166. 571
Korshin, G.V., Benjamin, M.M., Li, C.W., 1999. Use of differential 572
spectroscopy to evaluate the structure and reactivity of humics. Water Sci. 573
Technol. 40, 9-16. 574
MANUSCRIP
T
ACCEPTED
ACCEPTED MANUSCRIPT
31
Korshin, G.V., Li, C.W., Benjamin, M.M., 1997. Monitoring the properties of 575
natural organic matter through UV spectroscopy: A consistent theory. Water 576
Res. 31, 1787-1795. 577
Krusche, A.V., Martinelli, L.A., Victoria, R.L., Bernardes, M., de Camargo, 578
P.B., Ballester, M.V., Trumbore, S.E., 2002. Composition of particulate and 579
dissolved organic matter in a disturbed watershed of southeast Brazil 580
(Piracicaba River basin). Water Res. 36, 2743-2752. 581
Kujawinski, E.B., Longnecker, K., Blough, N.V., Del Vecchio, R., Finlay, L., 582
Kitner, J.B., Giovannoni, S.J., 2009. Identification of possible source markers 583
in marine dissolved organic matter using ultrahigh resolution mass 584
spectrometry. Geochim. Cosmochim. Ac. 73, 4384-4399. 585
Leenheer, J.A., Croué, J.-P., 2003. Peer Reviewed: Characterizing Aquatic 586
Dissolved Organic Matter. Environ. Sci. Technol. 37, 18A-26A. 587
Lenoir, T., Matynia, A., Manceau, A., 2010. Convergence-optimized 588
procedure for applying the NICA-Donnan model to potentiometric titrations of 589
humic substances. Environ. Sci. Technol. 44, 6221-6227. 590
Maurice-Bourgoin, L., Quemerais, B., Moreira-Turcq, P., Seyler, P., 2003. 591
Transport, distribution and speciation of mercury in the Amazon River at the 592
confluence of black and white waters of the Negro and Solimoes Rivers. 593
Hydrol. Process 17, 1405-1417. 594

MANUSCRIP
T
ACCEPTED
ACCEPTED MANUSCRIPT
32
Mayorga, E., Aufdenkampe, A.K., Masiello, C.A., Krusche, A.V., Hedges, J.I., 595
Quay, P.D., Richey, J.E., Brown, T.A., 2005. Young organic matter as a 596
source of carbon dioxide outgassing from Amazonian rivers. Nature 436, 538-597
541. 598
McClain, M.E., Richey, J.E., Brandes, J.A., Pimentel, T.P., 1997. Dissolved 599
organic matter and terrestrial-lotic linkages in the central Amazon basin of 600
Brazil. Global Biogeochem. Cy. 11, 295-311. 601
McKnight, D.M., Boyer, E.W., Westerhoff, P.K., Doran, P.T., Kulbe, T., 602
Andersen, D.T., 2001. Spectrofluorometric characterization of dissolved 603
organic matter for indication of precursor organic material and aromaticity. 604
Limnol. Oceanogr. 46, 38-48. 605
Milne, C.J., Kinniburgh, D.G., Tipping, E., 2001. Generic NICA-Donnan model 606
parameters for proton binding by humic substances. Environ. Sci. Technol. 35, 607
2049-2059. 608
Mopper, K., Stubbins, A., Ritchie, J.D., Bialk, H.M., Hatcher, P.G., 2007. 609
Advanced instrumental approaches for characterization of marine dissolved 610
organic matter: Extraction techniques, mass spectrometry, and nuclear 611
magnetic resonance spectroscopy. Chem. Rev. 107, 419-442. 612
Moreira-Turcq, P.F., Seyler, P., Guyot, J.L., Etcheber, H., 2003. 613
Characteristics of organic matter in the mixing zone of the Rio Negro and Rio 614
Solimoes of the Amazon River. Hydrol. Process. 17, 1393-1404. 615
MANUSCRIP
T
ACCEPTED
ACCEPTED MANUSCRIPT
33
Mounier, S., Patel, N., Quilici, L., Benaim, J.Y., Benamou, C., 1999. Three-616
dimensional fluorescence of the dissolved organ carbon in the Amazon River. 617
Water Res. 33, 1523-1533. 618
Patel-Sorrentino, N., Mounier, S., Benaim, J.Y., 2002. Excitation-emission 619
fluorescence matrix to study pH influence on organic matter fluorescence in 620
the Amazon basin rivers. Water Res. 36, 2571-2581. 621
Patel-Sorrentino, N., Mounier, S., Lucas, Y., Benaim, J.Y., 2004. Effects of 622
UV-visible irradiation on natural organic matter from the Amazon basin. Sci. 623
Total Environ. 321, 231-239. 624
Patel, N., Mounier, S., Guyot, J.L., Benamou, C., Benaim, J.Y., 1999. Fluxes 625
of dissolved and colloidal organic carbon, along the Purus and Amazonas 626
rivers ( Brazil). Sci. Total Environ. 229, 53-64. 627
Perez, M.A.P., Moreira-Turcq, P., Gallard, H., Allard, T., Benedetti, M.F., 2011. 628
Dissolved organic matter dynamic in the Amazon basin: Sorption by mineral 629
surfaces. Chem. Geol. 286, 158-168. 630
Peuravuori, J., Pihlaja, K., 1997. Molecular size distribution and spectroscopic 631
properties of aquatic humic substances. Anal. Chim. Acta 337, 133-149. 632
Remington, S., Krusche, A., Richey, J., 2011. Effects of DOM photochemistry 633
on bacterial metabolism and CO2 evasion during falling water in a humic and 634
a whitewater river in the Brazilian Amazon. Biogeochemistry 105, 185-200. 635
MANUSCRIP
T
ACCEPTED
ACCEPTED MANUSCRIPT
34
Richey, J.E., Melack, J.M., Aufdenkampe, A.K., Ballester, V.M., Hess, L.L., 636
2002. Outgassing from Amazonian rivers and wetlands as a large tropical 637
source of atmospheric CO2. Nature 416, 617-620. 638
Ritchie, J.D., Perdue, E.M., 2003. Proton-binding study of standard and 639
reference fulvic acids, humic acids, and natural organic matter. Geochim. 640
Cosmochim. Ac. 67, 85-96. 641
Rocha, J.C., Sargentini, E., Zara, L.F., Rosa, A.H., dos Santos, A., Burba, P., 642
2003. Reduction of mercury(II) by tropical river humic substances (Rio Negro) 643
- Part II. Influence of structural features (molecular size, aromaticity, phenolic 644
groups, organically bound sulfur). Talanta 61, 699-707. 645
Rodriguez-Zuniga, U.F., Milori, D., Da Silva, W.T.L., Martin-Neto, L., Oliveira, 646
L.C., Rocha, J.C., 2008. Changes in optical properties caused by UV-647
irradiation of aquatic humic substances from the amazon river basin: 648
Seasonal variability evaluation. Environ. Sci. Technol. 42, 1948-1953. 649
Salisbury, J., Vandemark, D., Campbell, J., Hunt, C., Wisser, D., Reul, N., 650
Chapron, B., 2011. Spatial and temporal coherence between Amazon River 651
discharge, salinity, and light absorption by colored organic carbon in western 652
tropical Atlantic surface waters. J. Geophys Res-Oceans 116. 653
Schafer, T., Buckau, G., Artinger, R., Kim, J.I., Geyer, S., Wolf, M., Bleam, 654
W.F., Wirick, S., Jacobsen, C., 2005. Origin and mobility of fulvic acids in the 655

MANUSCRIP
T
ACCEPTED
ACCEPTED MANUSCRIPT
35
Gorleben aquifer system: implications from isotopic data and carbon/sulfur 656
XANES. Org. Geochem. 36, 567-582. 657
Spencer, R.G., Bolton, L., Baker, A., 2007. Freeze/thaw and pH effects on 658
freshwater dissolved organic matter fluorescence and absorbance properties 659
from a number of UK locations. Water Res. 41, 2941-2950. 660
Tam, S.C., Sposito, G., 1993. Fluorescence spectroscopy of aqueous pine 661
litter extracts: effects of humification and aluminum complexation. J. Soil Sci. 662
44, 513-524. 663
Ward, N.D., Keil, R.G., Medeiros, P.M., Brito, D.C., Cunha, A.C., Dittmar, T., 664
Yager, P.L., Krusche, A.V., Richey, J.E., 2013. Degradation of terrestrially 665
derived macromolecules in the Amazon River. Nat. Geosci. 6, 530-533. 666
Yan, M., Benedetti, M.F., Korshin, G.V., 2013a. Study of iron and aluminum 667
binding to Suwannee River fulvic acid using absorbance and fluorescence 668
spectroscopy: Comparison of data interpretation based on NICA-Donnan and 669
Stockholm humic models. Water Res. 47, 5439-5446. 670
Yan, M., Dryer, D., Korshin, G.V., Benedetti, M.F., 2013b. In situ study of 671
binding of copper by fulvic acid: Comparison of differential absorbance data 672
and model predictions. Water Res. 47, 588-596. 673
674
675
MANUSCRIP
T
ACCEPTED
ACCEPTED MANUSCRIPT
36
Table and Table and Table and Table and Figure CaptionsFigure CaptionsFigure CaptionsFigure Captions 676
Figure Figure Figure Figure 1111.... C(1s) NEXAFS spectra of C(1s) NEXAFS spectra of C(1s) NEXAFS spectra of C(1s) NEXAFS spectra of COLLCOLLCOLLCOLL andandandand HPOHPOHPOHPO fractions fractions fractions fractions of Igarapé of Igarapé of Igarapé of Igarapé 677
Bonito Bonito Bonito Bonito DOMDOMDOMDOM. . . . 678
Figure Figure Figure Figure 2222.... Results of potentiometric titration for Results of potentiometric titration for Results of potentiometric titration for Results of potentiometric titration for COLLCOLLCOLLCOLL andandandand HPO fractions of HPO fractions of HPO fractions of HPO fractions of 679
Igarapé Bonito DOMIgarapé Bonito DOMIgarapé Bonito DOMIgarapé Bonito DOM and its modeling using NICAand its modeling using NICAand its modeling using NICAand its modeling using NICA----Donnan modelDonnan modelDonnan modelDonnan model. . . . 680
Figure Figure Figure Figure 3333.... Correlations between percentage of carboxylic and phenolic carbon Correlations between percentage of carboxylic and phenolic carbon Correlations between percentage of carboxylic and phenolic carbon Correlations between percentage of carboxylic and phenolic carbon 681
estimated based on carbon NEXAFS data and concentrations of the estimated based on carbon NEXAFS data and concentrations of the estimated based on carbon NEXAFS data and concentrations of the estimated based on carbon NEXAFS data and concentrations of the 682
protonationprotonationprotonationprotonation----active carboxylic and phenolic sites determined based on theactive carboxylic and phenolic sites determined based on theactive carboxylic and phenolic sites determined based on theactive carboxylic and phenolic sites determined based on the 683
results of potentiometry. results of potentiometry. results of potentiometry. results of potentiometry. 684
Figure Figure Figure Figure 4444.... Development of DOCDevelopment of DOCDevelopment of DOCDevelopment of DOC----normalized pHnormalized pHnormalized pHnormalized pH----differential absorbance spectra differential absorbance spectra differential absorbance spectra differential absorbance spectra 685
of the of the of the of the COLLCOLLCOLLCOLL ((((aaaa) and ) and ) and ) and HPOHPOHPOHPO ((((bbbb) fractions of Igarapé Bonito ) fractions of Igarapé Bonito ) fractions of Igarapé Bonito ) fractions of Igarapé Bonito DOMDOMDOMDOM. Reference pH . Reference pH . Reference pH . Reference pH 686
values values values values 3333.1..1..1..1. 687
FIGURE FIGURE FIGURE FIGURE 5555. Gaussian band fitting of the . Gaussian band fitting of the . Gaussian band fitting of the . Gaussian band fitting of the DOCDOCDOCDOC----normalized normalized normalized normalized differential spectra differential spectra differential spectra differential spectra 688
of COLL and HPO fractions of Igarapé Bonito of COLL and HPO fractions of Igarapé Bonito of COLL and HPO fractions of Igarapé Bonito of COLL and HPO fractions of Igarapé Bonito DOMDOMDOMDOM at selected pH. (a), (b) at selected pH. (a), (b) at selected pH. (a), (b) at selected pH. (a), (b) 689
and (c) for and (c) for and (c) for and (c) for COLL at COLL at COLL at COLL at pH7.pH7.pH7.pH7.1111, pH9., pH9., pH9., pH9.1111 and pH11.0and pH11.0and pH11.0and pH11.0;;;; (d), (e) and (f) for (d), (e) and (f) for (d), (e) and (f) for (d), (e) and (f) for HPOHPOHPOHPO at at at at 690
pH7.0, pH9.0 and pH11.0.pH7.0, pH9.0 and pH11.0.pH7.0, pH9.0 and pH11.0.pH7.0, pH9.0 and pH11.0. 691
Figure Figure Figure Figure 6666. Differential log. Differential log. Differential log. Differential log----transformed absorbance spectra of transformed absorbance spectra of transformed absorbance spectra of transformed absorbance spectra of COLCOLCOLCOLLLLL ((((aaaa) and ) and ) and ) and 692
HPOHPOHPOHPO ((((bbbb) fractions of Igarapé Bonito ) fractions of Igarapé Bonito ) fractions of Igarapé Bonito ) fractions of Igarapé Bonito DOMDOMDOMDOM. Reference pH values . Reference pH values . Reference pH values . Reference pH values 3333.1..1..1..1. 693
Figure Figure Figure Figure 7777. Comparison of effects of pH on the experimental . Comparison of effects of pH on the experimental . Comparison of effects of pH on the experimental . Comparison of effects of pH on the experimental differential differential differential differential loglogloglog----694
transformedtransformedtransformedtransformed spectral slope in the range of wavelengths 325 to 375 nm spectral slope in the range of wavelengths 325 to 375 nm spectral slope in the range of wavelengths 325 to 375 nm spectral slope in the range of wavelengths 325 to 375 nm 695
MANUSCRIP
T
ACCEPTED
ACCEPTED MANUSCRIPT
37
(DSlope(DSlope(DSlope(DSlope325325325325----375375375375) ) ) ) and theand theand theand their NICAir NICAir NICAir NICA----based fitting for HPO and COLL fractions of based fitting for HPO and COLL fractions of based fitting for HPO and COLL fractions of based fitting for HPO and COLL fractions of 696
Igarapé Bonito Igarapé Bonito Igarapé Bonito Igarapé Bonito DOMDOMDOMDOM.... 697
Figure Figure Figure Figure 8888. Comparison of p. Comparison of p. Comparison of p. Comparison of potentiometric otentiometric otentiometric otentiometric and sand sand sand spectrophotometric resultspectrophotometric resultspectrophotometric resultspectrophotometric results (a) (a) (a) (a) 698
andandandand LAS LAS LAS LAS (b) (b) (b) (b) and HASand HASand HASand HAS (c)(c)(c)(c) inininin HPO and COLL fractions of Igarapé Bonito DOMHPO and COLL fractions of Igarapé Bonito DOMHPO and COLL fractions of Igarapé Bonito DOMHPO and COLL fractions of Igarapé Bonito DOM 699
predicted by NICApredicted by NICApredicted by NICApredicted by NICA----DonnanDonnanDonnanDonnan model model model model using the parameters shown in Table S2.using the parameters shown in Table S2.using the parameters shown in Table S2.using the parameters shown in Table S2.700

MANUSCRIP
T
ACCEPTED
ACCEPTED MANUSCRIPT
38
701
Figure Figure Figure Figure 2222.... C(1s) NEXAFS spectra of COLLC(1s) NEXAFS spectra of COLLC(1s) NEXAFS spectra of COLLC(1s) NEXAFS spectra of COLL andandandand HPOHPOHPOHPO fractions of Igarapé fractions of Igarapé fractions of Igarapé fractions of Igarapé 702
Bonito DOM. Bonito DOM. Bonito DOM. Bonito DOM. 703
MANUSCRIP
T
ACCEPTED
ACCEPTED MANUSCRIPT
39
704
Figure Figure Figure Figure 2222.... Results of potentiometric titration for COLLResults of potentiometric titration for COLLResults of potentiometric titration for COLLResults of potentiometric titration for COLL andandandand HPO fractions HPO fractions HPO fractions HPO fractions of of of of 705
Igarapé Bonito DOMIgarapé Bonito DOMIgarapé Bonito DOMIgarapé Bonito DOM and its modeling using NICAand its modeling using NICAand its modeling using NICAand its modeling using NICA----Donnan modelDonnan modelDonnan modelDonnan model. . . . 706
MANUSCRIP
T
ACCEPTED
ACCEPTED MANUSCRIPT
40
707
Figure Figure Figure Figure 3333.... Correlations between percentage of carboxylic and phenolic carbon Correlations between percentage of carboxylic and phenolic carbon Correlations between percentage of carboxylic and phenolic carbon Correlations between percentage of carboxylic and phenolic carbon 708
estimated based on carbon NEXAFS data and concentrations of the estimated based on carbon NEXAFS data and concentrations of the estimated based on carbon NEXAFS data and concentrations of the estimated based on carbon NEXAFS data and concentrations of the 709
protonationprotonationprotonationprotonation----active cactive cactive cactive carboxylic and phenolic sites determined based on the arboxylic and phenolic sites determined based on the arboxylic and phenolic sites determined based on the arboxylic and phenolic sites determined based on the 710
results of potentiometry. results of potentiometry. results of potentiometry. results of potentiometry. 711
MANUSCRIP
T
ACCEPTED
ACCEPTED MANUSCRIPT
41
712
713
Figure Figure Figure Figure 4444.... Development of DOCDevelopment of DOCDevelopment of DOCDevelopment of DOC----normalized pHnormalized pHnormalized pHnormalized pH----differential absorbance spectra differential absorbance spectra differential absorbance spectra differential absorbance spectra 714
of the of the of the of the COLLCOLLCOLLCOLL ((((aaaa) and ) and ) and ) and HPOHPOHPOHPO ((((bbbb) fractions of Igarapé Bonito ) fractions of Igarapé Bonito ) fractions of Igarapé Bonito ) fractions of Igarapé Bonito DOMDOMDOMDOM. Reference pH . Reference pH . Reference pH . Reference pH 715
values values values values 3333.1..1..1..1. 716
(a)
(b)
MANUSCRIP
T
ACCEPTED
ACCEPTED MANUSCRIPT
42
717
718
719
(a)
(b)
(c)
MANUSCRIP
T
ACCEPTED
ACCEPTED MANUSCRIPT
43
720
721
722
(d)
(e)
(f)
MANUSCRIP
T
ACCEPTED
ACCEPTED MANUSCRIPT
44
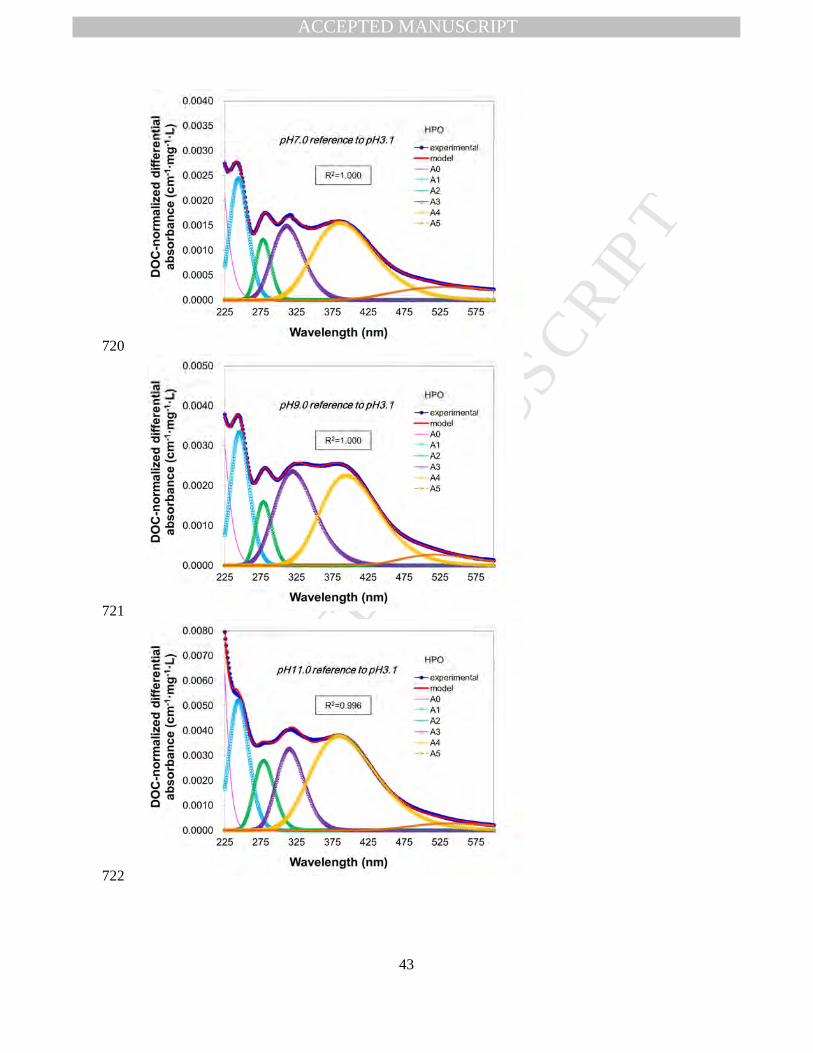
FIGURE FIGURE FIGURE FIGURE 5555. Gaussian band fitting of the . Gaussian band fitting of the . Gaussian band fitting of the . Gaussian band fitting of the DOCDOCDOCDOC----normalized normalized normalized normalized differential spectra differential spectra differential spectra differential spectra 723
of of of of COLL and HPO fractions of Igarapé Bonito COLL and HPO fractions of Igarapé Bonito COLL and HPO fractions of Igarapé Bonito COLL and HPO fractions of Igarapé Bonito DOMDOMDOMDOM at selected pH. (a), (b) at selected pH. (a), (b) at selected pH. (a), (b) at selected pH. (a), (b) 724
and (c) for and (c) for and (c) for and (c) for COLL at COLL at COLL at COLL at pH7.pH7.pH7.pH7.1111, pH9., pH9., pH9., pH9.1111 and pH11.0and pH11.0and pH11.0and pH11.0;;;; (d), (e) and (f) for (d), (e) and (f) for (d), (e) and (f) for (d), (e) and (f) for HPOHPOHPOHPO at at at at 725
pH7.0, pH9.0 and pH11.0.pH7.0, pH9.0 and pH11.0.pH7.0, pH9.0 and pH11.0.pH7.0, pH9.0 and pH11.0. 726
MANUSCRIP
T
ACCEPTED
ACCEPTED MANUSCRIPT
45
727
728
Figure Figure Figure Figure 6666. Differential log. Differential log. Differential log. Differential log----transformed absorbance spectra of transformed absorbance spectra of transformed absorbance spectra of transformed absorbance spectra of COLLCOLLCOLLCOLL ((((aaaa) and ) and ) and ) and 729
HPOHPOHPOHPO ((((bbbb) fractions of Igarapé Bonito ) fractions of Igarapé Bonito ) fractions of Igarapé Bonito ) fractions of Igarapé Bonito DOMDOMDOMDOM. Reference pH values . Reference pH values . Reference pH values . Reference pH values 3333.1..1..1..1. 730
(a)
(b)
MANUSCRIP
T
ACCEPTED
ACCEPTED MANUSCRIPT
46
731
Figure Figure Figure Figure 7777. Comparison of effects of pH on the experimental . Comparison of effects of pH on the experimental . Comparison of effects of pH on the experimental . Comparison of effects of pH on the experimental differential differential differential differential loglogloglog----732
transformedtransformedtransformedtransformed spectral slope in the range of wavelengths 325 to 375 nm spectral slope in the range of wavelengths 325 to 375 nm spectral slope in the range of wavelengths 325 to 375 nm spectral slope in the range of wavelengths 325 to 375 nm 733
(DSlope(DSlope(DSlope(DSlope325325325325----375375375375) ) ) ) and theand theand theand their NICAir NICAir NICAir NICA----based fitting for HPO and COLL fractions of based fitting for HPO and COLL fractions of based fitting for HPO and COLL fractions of based fitting for HPO and COLL fractions of 734
Igarapé Bonito Igarapé Bonito Igarapé Bonito Igarapé Bonito DOMDOMDOMDOM.... 735
MANUSCRIP
T
ACCEPTED
ACCEPTED MANUSCRIPT
47
736
737
738
Figure Figure Figure Figure 8888. Comparison of p. Comparison of p. Comparison of p. Comparison of potentiometric otentiometric otentiometric otentiometric and sand sand sand spectrophotometric resultspectrophotometric resultspectrophotometric resultspectrophotometric results (a) (a) (a) (a) 739
andandandand LAS LAS LAS LAS ((((bbbb) ) ) ) and HASand HASand HASand HAS ((((cccc)))) inininin HPO and COLL fractions of Igarapé Bonito HPO and COLL fractions of Igarapé Bonito HPO and COLL fractions of Igarapé Bonito HPO and COLL fractions of Igarapé Bonito DOMDOMDOMDOM 740
predicted by NICApredicted by NICApredicted by NICApredicted by NICA----DonnanDonnanDonnanDonnan model model model model using the parameters shown in Table Susing the parameters shown in Table Susing the parameters shown in Table Susing the parameters shown in Table S2.2.2.2. 741
(b)
(a)
(c)
MANUSCRIP
T
ACCEPTED
ACCEPTED MANUSCRIPT
Figure 1 and Figure 2
Figure Figure Figure Figure 1111.... C(1s) NEXAFS spectra of COLLC(1s) NEXAFS spectra of COLLC(1s) NEXAFS spectra of COLLC(1s) NEXAFS spectra of COLL andandandand HPOHPOHPOHPO fractions of Igarapé Bonito fractions of Igarapé Bonito fractions of Igarapé Bonito fractions of Igarapé Bonito
DOM. DOM. DOM. DOM.
MANUSCRIP
T
ACCEPTED
ACCEPTED MANUSCRIPT
Figure Figure Figure Figure 2222.... Results of potentiometric titration for COLLResults of potentiometric titration for COLLResults of potentiometric titration for COLLResults of potentiometric titration for COLL andandandand HPO fractions of HPO fractions of HPO fractions of HPO fractions of
Igarapé Bonito DOMIgarapé Bonito DOMIgarapé Bonito DOMIgarapé Bonito DOM and its modeling using NICAand its modeling using NICAand its modeling using NICAand its modeling using NICA----Donnan modelDonnan modelDonnan modelDonnan model. . . .
MANUSCRIP
T
ACCEPTED
ACCEPTED MANUSCRIPT
HighlightHighlightHighlightHighlightssss
Dissolved organic matter (DOM) from the Rio Negro area was isolated and
characterized
Colloidal and hydrophobic fractions were major DOM constituents.
Deprotonation of these fractions was tracked using differential spectroscopic
methods
Result of this approach is consistent with those of NEXAFS and potentiometric
methods
Changes of spectra were correlated with the charges of phenolic and
carboxylic groups
MANUSCRIP
T
ACCEPTED
ACCEPTED MANUSCRIPT
S1
Supporting Information Section 1
Effects of Charging on the Chromophores of Dissolved Organic Effects of Charging on the Chromophores of Dissolved Organic Effects of Charging on the Chromophores of Dissolved Organic Effects of Charging on the Chromophores of Dissolved Organic 2
Matter from the Rio Negro BasinMatter from the Rio Negro BasinMatter from the Rio Negro BasinMatter from the Rio Negro Basin 3
Mingquan Yan&, Gregory V. Korshin*, Francis Claret§, Jean-Philippe Croué##, 4
Massimiliano Fabbricino**, Hervé Gallard##, Thorsten Schäfer§§ and Marc F. 5
Benedetti# 6
&Department of Environmental Engineering, Peking University, Key Laboratory 7
of Water and Sediment Sciences, Ministry of Education, Beijing 100871, China 8
* Department of Civil and Environmental Engineering, University of 9
Washington, Seattle, WA 98195-2700 United States 10
**Dipartimento di Ingegneria Idraulica ed Ambientale "Girolamo Ippolito", 11
Universitá degli Studi di Napoli Federico II Via Claudio 21, 80125 Naples Italy 12
# Institut de Physique du Globe de Paris – Sorbonne Paris Cité - Université 13
Paris-Diderot , UMR CNRS 7154, Paris, France 14
## Equipe Chimie de l'Eau et Traitement des Eaux 15
Institut de Chimie des Milieux et Matériaux de Poitiers UMR 7285 CNRS 16
Ecole Nationale Supérieure d'Ingénieurs de Poitiers – Université de Poitiers 17
86022 Poitiers Cedex France 18
MANUSCRIP
T
ACCEPTED
ACCEPTED MANUSCRIPT
S2
§ Bureau des Recherches Géologiques et Minières, Environment and Process 19
Division 3, avenue Claude Guillemin F-45060 Orleans Cedex 2 France 20
§§ Forschungszentrum Karlsruhe, Institut für Nukleare Entsorgung (INE) P.O. 21
Box 3640 76021 Karlsruhe, Germany 22
23
& Corresponding author. Address: Department of Environmental Engineering, 24
College of Environmental Sciences and Engineering, Peking University, 25
Beijing 100871, China; Tel: +86 10 62755914-81, Fax: +86 10 62756526. 26
E-mail: [email protected] 27
Number of Pages (including this cover sheet): 10 28
Number of Tables 3 29
Number of Figures 4 30
31
32
MANUSCRIP
T
ACCEPTED
ACCEPTED MANUSCRIPT
S3
Table STable STable STable S1111.... Results of deconvolution of NEXAFS data for COLL, HPO and TPH Results of deconvolution of NEXAFS data for COLL, HPO and TPH Results of deconvolution of NEXAFS data for COLL, HPO and TPH Results of deconvolution of NEXAFS data for COLL, HPO and TPH 33
fractions of fractions of fractions of fractions of Igarapé BonitoIgarapé BonitoIgarapé BonitoIgarapé Bonito DOM. DOM. DOM. DOM. 34
Aromatic
285.2 eV
Phenolic
286.2eV
Aliphatic
287.4 eV
Carboxyl
288.5 eV
Carbonyl
289.5 eV
Aromaticity
(ΣAromatic+Phenolic)
Deconvolution
R2
COLL 17 17 15 30 21 33 0.9932
HPO 13 13 12 38 24 26 0.9931
TPH 11 11 9 42 27 22 0.9934
35
36
MANUSCRIP
T
ACCEPTED
ACCEPTED MANUSCRIPT
S4
Table STable STable STable S2222.... Comparison of potentiometric and Comparison of potentiometric and Comparison of potentiometric and Comparison of potentiometric and sssspectrophotometric pectrophotometric pectrophotometric pectrophotometric 37
NICANICANICANICA----Donnan parameters for protonationDonnan parameters for protonationDonnan parameters for protonationDonnan parameters for protonation----active groups in Igarapé Bonito active groups in Igarapé Bonito active groups in Igarapé Bonito active groups in Igarapé Bonito 38
DOM.DOM.DOM.DOM. 39
COLLCOLLCOLLCOLL HPOHPOHPOHPO TPHTPHTPHTPH
Potentiometric dataPotentiometric dataPotentiometric dataPotentiometric data
~
KLAS
4.43 4.43 4.43
~
KHAS
8.10 8.10 8.10
QLAS, meq/g 1.70 2.45 2.64
QHAS, meq/g 2.64 1.96 1.80
mLAS 0.79 0.75 0.81
mHAS 0.28 0.29 0.27
SSSSpectrophotometric datapectrophotometric datapectrophotometric datapectrophotometric data
~
KLAS
3.74 3.75 n/a
~
KHAS
9.13 9.05 n/a
DSlopeLAS (325-375 nm) 0.0031 0.0027 n/a
DSlopeHAS (325-375 nm) 0.0035 0.0025 n/a
mLAS 0.63 0.56 n/a
mHAS 0.49 0.47 n/a
MANUSCRIP
T
ACCEPTED
ACCEPTED MANUSCRIPT
S5
Table STable STable STable S3333.... Comparison of properties of the Gaussian bands present in the ClComparison of properties of the Gaussian bands present in the ClComparison of properties of the Gaussian bands present in the ClComparison of properties of the Gaussian bands present in the Cl---- 40
and pHand pHand pHand pH----differential spectra of SRFAdifferential spectra of SRFAdifferential spectra of SRFAdifferential spectra of SRFA 41
Properties of Gaussian bands in pH-differential spectra for COLL
Component
Position of maximum
Ei, eV
Position of maximum
λi, nm
Standard deviation of Ei, eV
Bandwidth W i,
eV
Standard deviation of W i, eV
Fit paramete
r (R2)
A0 5.99 207 0.094 0.45 0.079
0.99
A1 5.01 247 0.063 0.22 0.061
A2 4.47 278 0.025 0.20 0.013
A3 3.99 311 0.033 0.24 0.041
A4 3.28 378 0.044 0.37 0.027
A5 2.33 533 0.048 0.32 0.049
Properties of Gaussian bands in pH-differential spectra for HPO
Component
Position of maximum
Ei, eV
Position of maximum
λi, nm
Standard deviation of Ei, eV
Bandwidth W i,
eV
Standard deviation of W i, eV
Fit paramete
r (R2)
A0 6.00 207 0.150 0.36 0.080
0.99
A1 5.11 243 0.051 0.26 0.042
A2 4.43 280 0.011 0.17 0.019
A3 3.95 314 0.030 0.26 0.050
A4 3.23 383 0.058 0.36 0.022
A5 2.34 529 0.040 0.24 0.046
42
43
44
45
46
47
MANUSCRIP
T
ACCEPTED
ACCEPTED MANUSCRIPT
S6
48
Figure Figure Figure Figure S1.S1.S1.S1. C(1s) NEXAFS spectra of fractions of Igarapé Bonito DOM. C(1s) NEXAFS spectra of fractions of Igarapé Bonito DOM. C(1s) NEXAFS spectra of fractions of Igarapé Bonito DOM. C(1s) NEXAFS spectra of fractions of Igarapé Bonito DOM. 49
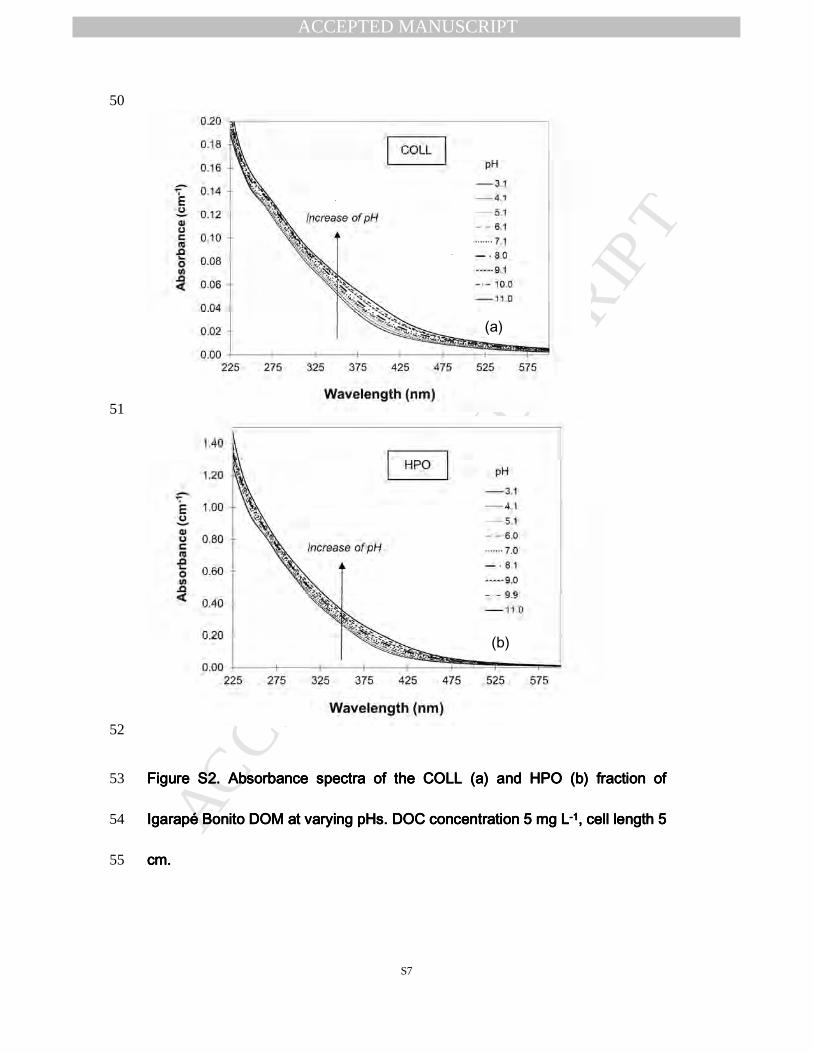
MANUSCRIP
T
ACCEPTED
ACCEPTED MANUSCRIPT
S7
50
51
52
Figure SFigure SFigure SFigure S2222.... Absorbance spectra of theAbsorbance spectra of theAbsorbance spectra of theAbsorbance spectra of the COLL (a) andCOLL (a) andCOLL (a) andCOLL (a) and HPOHPOHPOHPO (b)(b)(b)(b) fraction of fraction of fraction of fraction of 53
Igarapé BonitoIgarapé BonitoIgarapé BonitoIgarapé Bonito DOM at varying pHs. DOC concentration 5 mgDOM at varying pHs. DOC concentration 5 mgDOM at varying pHs. DOC concentration 5 mgDOM at varying pHs. DOC concentration 5 mg LLLL----1111, cell length 5 , cell length 5 , cell length 5 , cell length 5 54
cm.cm.cm.cm. 55
(b)
(a)
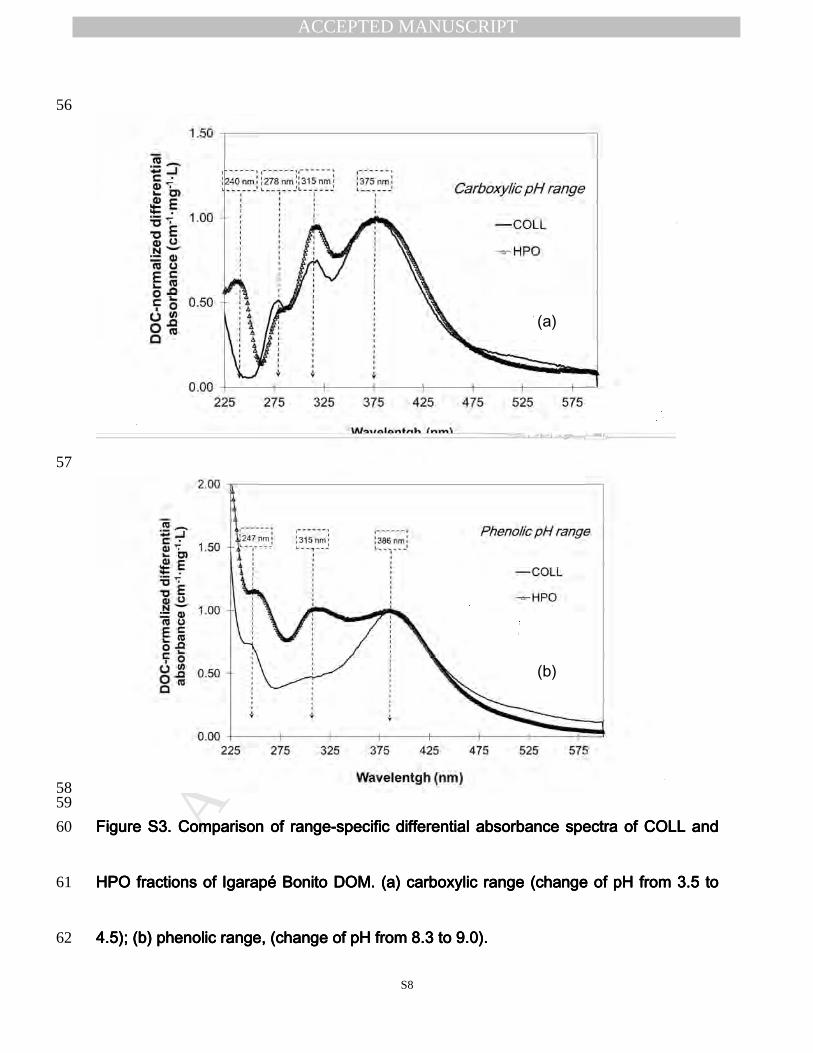
MANUSCRIP
T
ACCEPTED
ACCEPTED MANUSCRIPT
S8
56
57
58 59
Figure Figure Figure Figure SSSS3333.... Comparison of rangeComparison of rangeComparison of rangeComparison of range----specific differential absorbance spectra of specific differential absorbance spectra of specific differential absorbance spectra of specific differential absorbance spectra of COLL and COLL and COLL and COLL and 60
HPOHPOHPOHPO fractions of Igarapé Bonito DOM. (fractions of Igarapé Bonito DOM. (fractions of Igarapé Bonito DOM. (fractions of Igarapé Bonito DOM. (aaaa) carboxylic range (change of pH from 3.5 to ) carboxylic range (change of pH from 3.5 to ) carboxylic range (change of pH from 3.5 to ) carboxylic range (change of pH from 3.5 to 61
4.5); (4.5); (4.5); (4.5); (bbbb) phenolic range, (change of pH from 8.3 to 9.0).) phenolic range, (change of pH from 8.3 to 9.0).) phenolic range, (change of pH from 8.3 to 9.0).) phenolic range, (change of pH from 8.3 to 9.0). 62
(a)
(b)
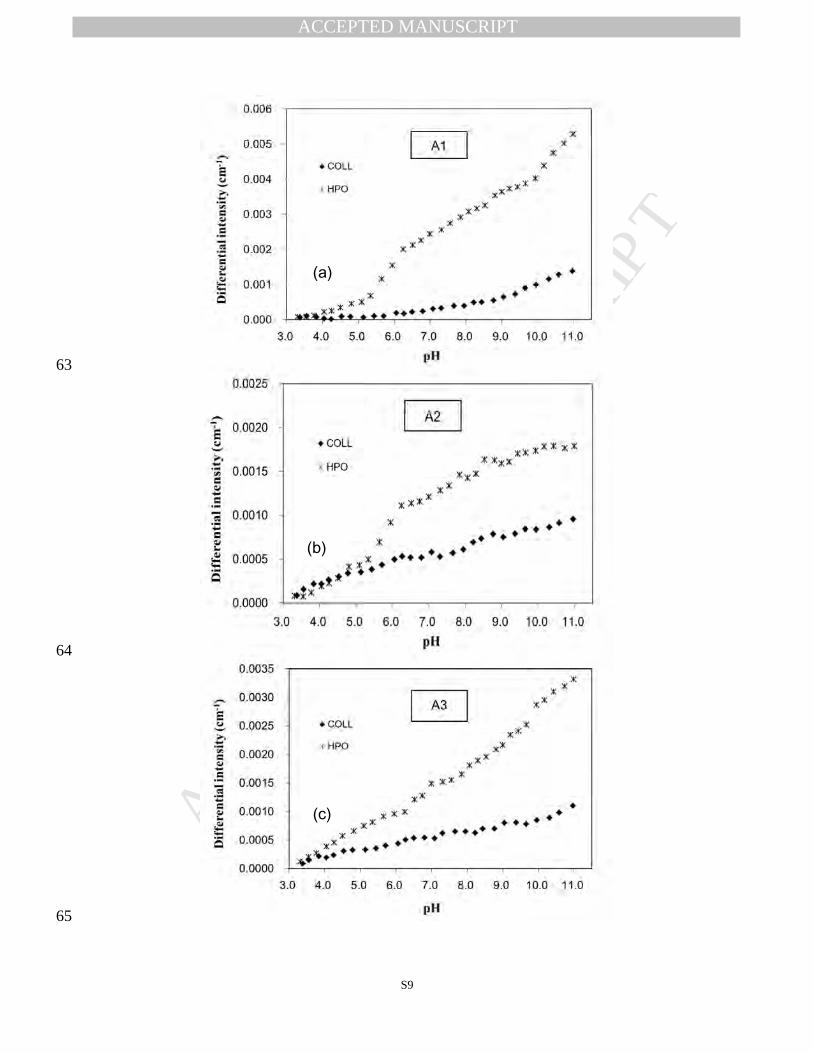
MANUSCRIP
T
ACCEPTED
ACCEPTED MANUSCRIPT
S9
63
64
65
(a)
(b)
(c)
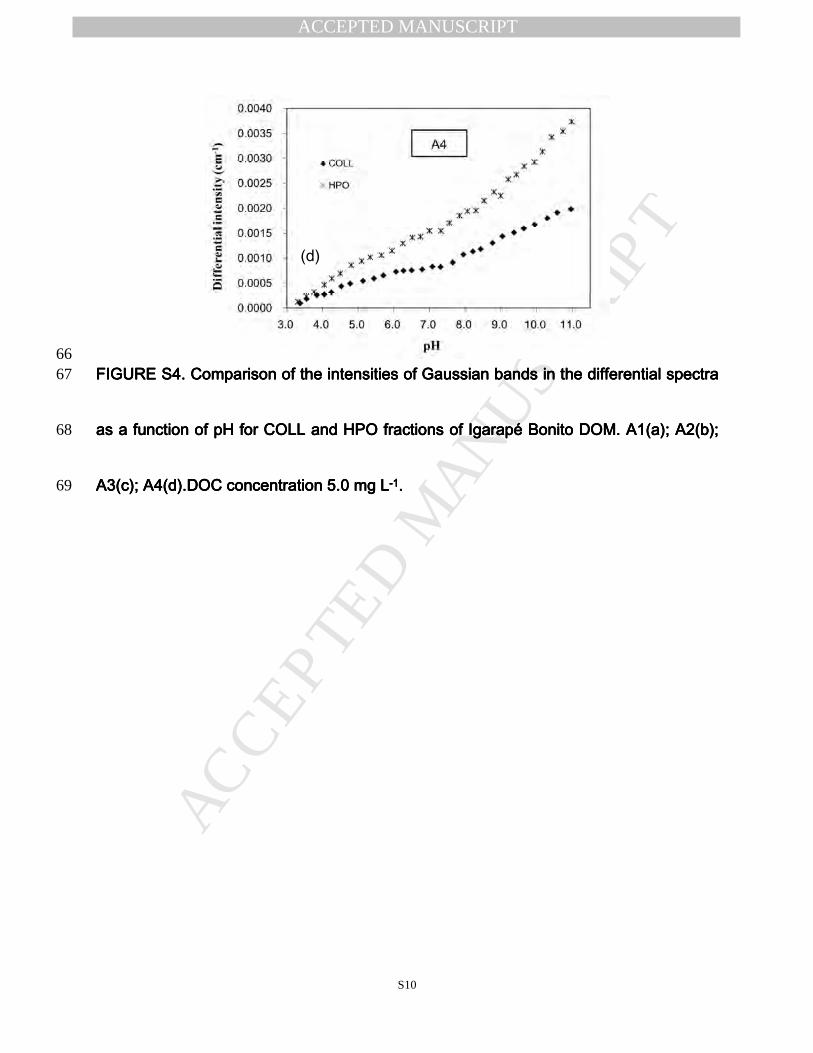
MANUSCRIP
T
ACCEPTED
ACCEPTED MANUSCRIPT
S10
66 FFFFIGUREIGUREIGUREIGURE SSSS4444. . . . Comparison of Comparison of Comparison of Comparison of the the the the intensities of intensities of intensities of intensities of Gaussian bandGaussian bandGaussian bandGaussian bands s s s in the differential spectra in the differential spectra in the differential spectra in the differential spectra 67
as as as as a a a a function of pH function of pH function of pH function of pH for for for for COLL and HPOCOLL and HPOCOLL and HPOCOLL and HPO fractions of Igarapé Bonito DOMfractions of Igarapé Bonito DOMfractions of Igarapé Bonito DOMfractions of Igarapé Bonito DOM.... A1(a);A1(a);A1(a);A1(a); A2(b); A2(b); A2(b); A2(b); 68
A3(c); A4(d).A3(c); A4(d).A3(c); A4(d).A3(c); A4(d).DOC DOC DOC DOC concentration 5.0 mg Lconcentration 5.0 mg Lconcentration 5.0 mg Lconcentration 5.0 mg L----1111.... 69
(d)