Comparison of Static and Microfluidic Protease Assays Using Modified Bioluminescence Resonance...
8
Comparison of Static and Microfluidic Protease Assays Using Modified Bioluminescence Resonance Energy Transfer Chemistry Nan Wu 1¤ , Helen Dacres 2 , Alisha Anderson 2 , Stephen C. Trowell 2 , Yonggang Zhu 2 * 1 CSIRO Materials Science and Engineering and Food Futures Flagship, Clayton South, Australia, 2 CSIRO Ecosystem Sciences and Food Futures Flagship, Canberra, Australia Abstract Background: Fluorescence and bioluminescence resonance energy transfer (F/BRET) are two forms of Fo ¨ rster resonance energy transfer, which can be used for optical transduction of biosensors. BRET has several advantages over fluorescence- based technologies because it does not require an external light source. There would be benefits in combining BRET transduction with microfluidics but the low luminance of BRET has made this challenging until now. Methodology: We used a thrombin bioprobe based on a form of BRET (BRET H ), which uses the BRET 1 substrate, native coelenterazine, with the typical BRET 2 donor and acceptor proteins linked by a thrombin target peptide. The microfluidic assay was carried out in a Y-shaped microfluidic network. The dependence of the BRET H ratio on the measurement location, flow rate and bioprobe concentration was quantified. Results were compared with the same bioprobe in a static microwell plate assay. Principal Findings: The BRET H thrombin bioprobe has a lower limit of detection (LOD) than previously reported for the equivalent BRET 1 –based version but it is substantially brighter than the BRET 2 version. The normalised BRET H ratio of the bioprobe changed 32% following complete cleavage by thrombin and 31% in the microfluidic format. The LOD for thrombin in the microfluidic format was 27 pM, compared with an LOD of 310 pM, using the same bioprobe in a static microwell assay, and two orders of magnitude lower than reported for other microfluidic chip-based protease assays. Conclusions: These data demonstrate that BRET based microfluidic assays are feasible and that BRET H provides a useful test bed for optimising BRET-based microfluidics. This approach may be convenient for a wide range of applications requiring sensitive detection and/or quantification of chemical or biological analytes. Citation: Wu N, Dacres H, Anderson A, Trowell SC, Zhu Y (2014) Comparison of Static and Microfluidic Protease Assays Using Modified Bioluminescence Resonance Energy Transfer Chemistry. PLoS ONE 9(2): e88399. doi:10.1371/journal.pone.0088399 Editor: Sabato D’Auria, CNR, Italy Received November 25, 2013; Accepted January 6, 2014; Published February 14, 2014 Copyright: ß 2014 Wu et al. This is an open-access article distributed under the terms of the Creative Commons Attribution License, which permits unrestricted use, distribution, and reproduction in any medium, provided the original author and source are credited. Funding: The CSIRO Food Futures Flagship provided internal funding for the research. The funders had no role in study design, data collection and analysis, decision to publish, or preparation of the manuscript. Competing Interests: The authors have declared that no competing interests exist. * E-mail: [email protected] ¤ Current address: Northeastern Electric Science and Research Institute, Shenyang, Liaoning, P.R. China Introduction Biosensors promise rapid, sensitive and selective estimation of a wide range of analytes [1–3]. Bioluminescence resonance energy transfer (BRET) is a form of Fo ¨rster resonance energy transfer, the non-radiative transfer of energy from an excited state donor to a ground state acceptor, which can be used to transduce biosensor activation into a machine-readable format. Compared to ampli- tude-based measurements, the ratiometric nature of Fo ¨rster resonance energy transfer reduces signal variability from a variety of sources including variations in assay volume, minor temperature variations and time dependent signal decay. RET-based reactions are homogeneous and can be performed in the fluid phase without solid-phase attachment. This allows for detection of analytes in the fluid phase or particulate suspensions in fluids, without the need for separation. This has many advantages, including the ability to make continuous measurements in a flow format, without having to regenerate a sensing surface, as required, for example by surface plasmon resonance based biosensors [4]. BRET occurs naturally in marine organisms such as Aequorea victoria and Renilla reniformis. Unlike fluorescence resonance energy transfer (FRET), BRET does not involve an external light source, and is therefore largely free from autofluorescence, light scattering, photobleaching and/or photoisomerization of the donor moiety [5], all of which can limit the sensitivity of FRET. Absence of these effects results in a low background and very low limits of detection for BRET assays [6]. Due to these characteristics, BRET has been used for a variety of applications including RNA detection [7], investigating protein-protein interactions [8–10], drug screening [5,9,11], imaging [8,12,13], and general biosensing [14,15]. So far, however, uses of BRET have largely been restricted to fundamental research, often using sophisticated imaging equip- ment. PLOS ONE | www.plosone.org 1 February 2014 | Volume 9 | Issue 2 | e88399
Transcript of Comparison of Static and Microfluidic Protease Assays Using Modified Bioluminescence Resonance...

Comparison of Static and Microfluidic Protease AssaysUsing Modified Bioluminescence Resonance EnergyTransfer ChemistryNan Wu1¤, Helen Dacres2, Alisha Anderson2, Stephen C. Trowell2, Yonggang Zhu2*
1CSIRO Materials Science and Engineering and Food Futures Flagship, Clayton South, Australia, 2CSIRO Ecosystem Sciences and Food Futures Flagship, Canberra,
Australia
Abstract
Background: Fluorescence and bioluminescence resonance energy transfer (F/BRET) are two forms of Forster resonanceenergy transfer, which can be used for optical transduction of biosensors. BRET has several advantages over fluorescence-based technologies because it does not require an external light source. There would be benefits in combining BRETtransduction with microfluidics but the low luminance of BRET has made this challenging until now.
Methodology: We used a thrombin bioprobe based on a form of BRET (BRETH), which uses the BRET1 substrate, nativecoelenterazine, with the typical BRET2 donor and acceptor proteins linked by a thrombin target peptide. The microfluidicassay was carried out in a Y-shaped microfluidic network. The dependence of the BRETH ratio on the measurement location,flow rate and bioprobe concentration was quantified. Results were compared with the same bioprobe in a static microwellplate assay.
Principal Findings: The BRETH thrombin bioprobe has a lower limit of detection (LOD) than previously reported for theequivalent BRET1–based version but it is substantially brighter than the BRET2 version. The normalised BRETH ratio of thebioprobe changed 32% following complete cleavage by thrombin and 31% in the microfluidic format. The LOD forthrombin in the microfluidic format was 27 pM, compared with an LOD of 310 pM, using the same bioprobe in a staticmicrowell assay, and two orders of magnitude lower than reported for other microfluidic chip-based protease assays.
Conclusions: These data demonstrate that BRET based microfluidic assays are feasible and that BRETH provides a useful testbed for optimising BRET-based microfluidics. This approach may be convenient for a wide range of applications requiringsensitive detection and/or quantification of chemical or biological analytes.
Citation: Wu N, Dacres H, Anderson A, Trowell SC, Zhu Y (2014) Comparison of Static and Microfluidic Protease Assays Using Modified BioluminescenceResonance Energy Transfer Chemistry. PLoS ONE 9(2): e88399. doi:10.1371/journal.pone.0088399
Editor: Sabato D’Auria, CNR, Italy
Received November 25, 2013; Accepted January 6, 2014; Published February 14, 2014
Copyright: � 2014 Wu et al. This is an open-access article distributed under the terms of the Creative Commons Attribution License, which permits unrestricteduse, distribution, and reproduction in any medium, provided the original author and source are credited.
Funding: The CSIRO Food Futures Flagship provided internal funding for the research. The funders had no role in study design, data collection and analysis,decision to publish, or preparation of the manuscript.
Competing Interests: The authors have declared that no competing interests exist.
* E-mail: [email protected]
¤ Current address: Northeastern Electric Science and Research Institute, Shenyang, Liaoning, P.R. China
Introduction
Biosensors promise rapid, sensitive and selective estimation of a
wide range of analytes [1–3]. Bioluminescence resonance energy
transfer (BRET) is a form of Forster resonance energy transfer, the
non-radiative transfer of energy from an excited state donor to a
ground state acceptor, which can be used to transduce biosensor
activation into a machine-readable format. Compared to ampli-
tude-based measurements, the ratiometric nature of Forster
resonance energy transfer reduces signal variability from a variety
of sources including variations in assay volume, minor temperature
variations and time dependent signal decay. RET-based reactions
are homogeneous and can be performed in the fluid phase without
solid-phase attachment. This allows for detection of analytes in the
fluid phase or particulate suspensions in fluids, without the need
for separation. This has many advantages, including the ability to
make continuous measurements in a flow format, without having
to regenerate a sensing surface, as required, for example by surface
plasmon resonance based biosensors [4].
BRET occurs naturally in marine organisms such as Aequorea
victoria and Renilla reniformis. Unlike fluorescence resonance energy
transfer (FRET), BRET does not involve an external light source,
and is therefore largely free from autofluorescence, light scattering,
photobleaching and/or photoisomerization of the donor moiety
[5], all of which can limit the sensitivity of FRET. Absence of these
effects results in a low background and very low limits of detection
for BRET assays [6]. Due to these characteristics, BRET has been
used for a variety of applications including RNA detection [7],
investigating protein-protein interactions [8–10], drug screening
[5,9,11], imaging [8,12,13], and general biosensing [14,15]. So
far, however, uses of BRET have largely been restricted to
fundamental research, often using sophisticated imaging equip-
ment.
PLOS ONE | www.plosone.org 1 February 2014 | Volume 9 | Issue 2 | e88399
Despite its lower sensitivity, FRET has been used more broadly
than BRET for screening and biosensing applications. Recently,
however, we demonstrated that a form of BRET is 50 times more
sensitive than FRET for measuring thrombin-catalysed proteolytic
cleavage of a target peptide sequence in a microplate assay [16]. A
microfluidic format offer several advantages over static microplate
assays but the generally low luminance of some BRET systems
makes it quite challenging to detect a signal in the small volumes
typical of a microfluidic device. Therefore, although substantial
effort has been invested in developing FRET detection systems
and bioluminescence detection for microfluidic systems [17–22],
there have been very few studies combining BRET-based sensors
with microfluidics.
The aim of this study was therefore to test the feasibility,
sensitivity and limits of detection of a homogenous BRET-based
biosensor in a microfluidic format, compared with the same
biosensor in a conventional assay. We selected a thrombin
bioprobe [6,23] for this work because it is well characterised,
highly specific and clinically relevant.
In earlier work we used the BRET2 system because of its long
Forster distance [24], sensitivity and its potential application to
measuring intramolecular rearrangements [6,25] as well as
dissociations. Unfortunately, however, the BRET2 system was
not bright enough to be detected in the microfluidic system used
here, due to its well-documented low quantum yield (e.g., Pfleger
et al. [9,26]) and the small volume (2.6 nL) sampled optically. For
comparison, the standard volume optically sampled in the 96 well
microplate format is 100 mL. We therefore adopted a novel BRET
variant, which we named BRETH, combining the donor and
acceptor domains of BRET2: i.e. GFP2 and RLuc, with the
original BRET1 substrate, native coelenterazine. This provides
much greater luminosity with limits of detection intermediate
between BRET1 and BRET2, at the expense of an undefined,
presumably shorter, Forster distance. For an assay involving
complete molecular dissociation, such as the one here, a short
Forster distance is of lesser concern. This compromise allowed us
to compare the static and microfluidic versions fo the assay
without the inconvenience of having to substitute the BRET2
donor and acceptor proteins. To the best of our knowledge, this is
the first realisation of a BRET based biosensor in the fluid phase of
any microfluidic system. The work lays the foundation for a new
class of BRET based sensing devices for a wide range of analytes.
The limit of detection for thrombin in the microfluidic format
was 27 pM, which was more than tenfold lower than when
measured using the same sensor in a microwell plate and two log
units lower than comparable FRET-based microfluidic assays.
The sensitivity of our microfluidic method was approximately five
times greater than when using a microwell plate. This result
demonstrates the feasibility of developing ultra-sensitive, contin-
uous flow miniature BRET-based biosensing devices and provides
a convenient testbed for optimising overall system design.
Methodology and Experimental Details
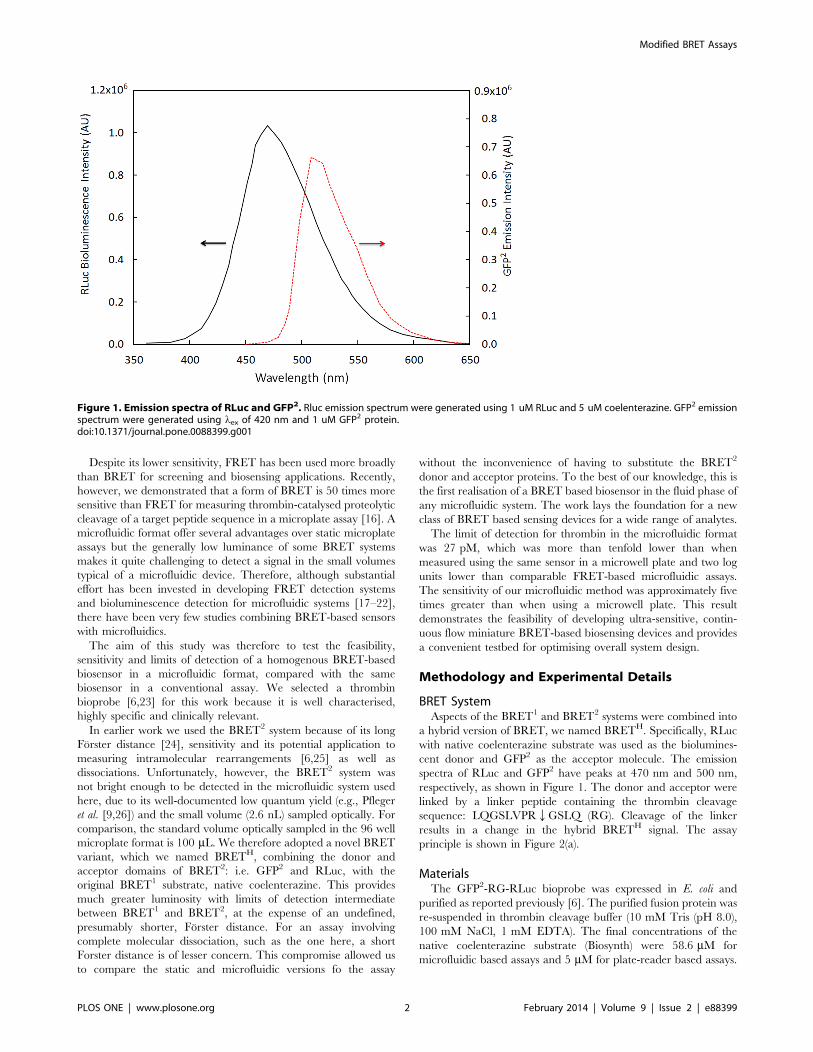
BRET SystemAspects of the BRET1 and BRET2 systems were combined into
a hybrid version of BRET, we named BRETH. Specifically, RLuc
with native coelenterazine substrate was used as the biolumines-
cent donor and GFP2 as the acceptor molecule. The emission
spectra of RLuc and GFP2 have peaks at 470 nm and 500 nm,
respectively, as shown in Figure 1. The donor and acceptor were
linked by a linker peptide containing the thrombin cleavage
sequence: LQGSLVPRQGSLQ (RG). Cleavage of the linker
results in a change in the hybrid BRETH signal. The assay
principle is shown in Figure 2(a).
MaterialsThe GFP2-RG-RLuc bioprobe was expressed in E. coli and
purified as reported previously [6]. The purified fusion protein was
re-suspended in thrombin cleavage buffer (10 mM Tris (pH 8.0),
100 mM NaCl, 1 mM EDTA). The final concentrations of the
native coelenterazine substrate (Biosynth) were 58.6 mM for
microfluidic based assays and 5 mM for plate-reader based assays.
Figure 1. Emission spectra of RLuc and GFP2. Rluc emission spectrum were generated using 1 uM RLuc and 5 uM coelenterazine. GFP2 emissionspectrum were generated using lex of 420 nm and 1 uM GFP2 protein.doi:10.1371/journal.pone.0088399.g001
Modified BRET Assays
PLOS ONE | www.plosone.org 2 February 2014 | Volume 9 | Issue 2 | e88399

1 unit (U)/ml thrombin protease (Amersham Biosciences) solution
was prepared in phosphate buffered saline (PBS).
Experimental Set-upSimultaneous dual emission hybrid BRET measurements were
carried out in a microplate using a SpectraMax M2 spectroflu-
orometer (Molecular Devices) in luminescence scan mode between
wavelengths of 400 to 650 nm and in the microfluidics apparatus
described below.
For the microchip experiment, a simple Y-shape microchannel
(Figure 2(b)), 70 mm wide and 50 mm high was used which was
fabricated in polydimethylsiloxane (PDMS) using standard photo-
lithography. The chip design was completed in a commercial
drawing package (Adobe Illustrator CS4) and the design pattern
was printed on a transparency mask (5,080 dpi, Allardice). Master
patterns of the microfluidic devices were fabricated using a
laminar dry film resist (Shipley 5038). Multiple layers of resist were
laminated at 113uC onto a substrate of polished stainless steel. The
channels were lithographically patterned using a collimated UV
source (l=350–450 nm) operated at 20 mJ/cm2 and a transpar-
ency film mask. After exposure, the test pattern was developed in a
20% Na2CO3 solution. The pattern in resist was subsequently
replicated as a Nickel shim using an initial sputter deposition of
100 nm Ni followed by electroplating to a thickness of 150 mm. A
10/1 (w/w) ratio of PDMS and curing agent was poured over the
shim, degassed and baked overnight at 75uC. The device was cut
and peeled off the shim and exposed to air plasma for 10 minutes.
The PDMS was immediately sealed with a glass slide. After baking
for three hours at 75uC, the PDMS adhered strongly to the surface
of the glass and the PDMS glass microchip was ready to use.
A schematic of the set-up for microfluidic measurement is
shown in Figure 2(c). A neMESYS high pressure pump system
(Cetoni, Germany) was used to pump the two fluids from two
50 mL SGE syringes (Supelco) onto the microchip, respectively.
One fluid is the substrate solution while the other is a mixture of
thrombin and bioprobe solutions. The flow rates of both streams
were 20 ml/h. The microchip was placed on a microscope (Nikon
Eclipse TE2000-U) stage for visualization and measurement. A
sapphire laser (488 nm, Coherent) was used to locate the detection
spot for each experiment. The bioluminescence emissions from the
detection spot of the microchannel were collected with a 206objective lens (Plan Fluor, Nikon). A dichroic mirror was used to
split the light into two separate channels with a splitting
wavelength of 505 nm. Bandpass filters (Nikon) of 515–555 nm
for GFP2 and 430–455 nm for RLuc were used for the two
channels. De-magnification lenses (Nikon C-0.456) were used to
focus light emitted from each channel onto separate photomulti-
plier tubes (Hamamatsu H7421). Integration time for data
acquisition was 200 ms for both photomultipliers. The measure-
ment position was varied along the main channel starting at the
confluence of the input channels (x = 0) to the end of the common
channel (x<6.9 mm).
Thrombin AssayVarious concentrations of thrombin were added to the purified
GFP2 -RG-RLuc bioprobe and incubated at 30uC for 90 minutes.
To measure the extent of thrombin cleavage following incubation,
the reaction mixture and the native CLZ solution were pumped
from separate syringes through the two inlet channels and into the
common channel. Diffusion of the substrate and the bioprobe
energised a BRET reaction that started at the interface and spread
into the two streams. As a negative control, recombinant hirudin
(Sigma), which is known to stably inhibit thrombin by binding to
its catalytic and other sites [27], was incubated with thrombin at
room temperature for ten minutes prior to the protease assay.
Figure 2. Experimental set-up. (a) The arrangement of the microchannel network with the origin for distance measurements and a schematicdrawing of the BRETH reaction. (b) A picture of the microfluidic device. (c) Schematic of the optoelectronic detection apparatus. (Clz =Nativecoelenterazine, DM=dichroic mirror, BP= band pass, PMT=photomultiplier tube).doi:10.1371/journal.pone.0088399.g002
Modified BRET Assays
PLOS ONE | www.plosone.org 3 February 2014 | Volume 9 | Issue 2 | e88399

Sodium Dodecyl Sulfate Polyacrylamide GelElectrophoresis (SDS-PAGE)Proteins (2.5 mg) were diluted in 16 sample-loading buffer for
SDS-polyacrylamide gel electrophoresis on a 12% Bis-Tris gel
with MOPS running buffer (NuPAGE Invitrogen, Australia). After
electrophoresis, the gels were washed, three times ten minutes, in
60 ml of 45% (v/v) methanol, 10% (v/v) acetic acid at room
temperature with gentle agitation. The gel was submerged
overnight in 16% (v/v) Fast StainTM (Fisher Scientific, Australia)
with gentle shaking. Gels were de-stained by washing three times
for ten minutes in 10% (v/v) acetic acid with gentle shaking. Gels
were photographed with transmitted fluorescent illumination using
an AlphaImagerTM 2200 video capture system (Alpha Innotech
Corporation).
Data AnalysisUsing the microplate spectrophotometer, BRETH ratios were
calculated as the ratio of the luminance intensity at l=500 nm
and l=470 nm. For the microfluidic chip, the hybrid BRETH
ratio was calculated as the ratio of the luminances in the longer
wavelength band (l=515–555 nm) and the shorter wavelength
band (l=430–455 nm) [26]. To allow comparison between the
two different detection systems, BRETH ratios were normalized by
expressing them as a multiple of the BRET ratio without added
thrombin, measured in the same system. Limits of detection
(LOD) were formally calculated as the concentration of analyte
required to give a signal equal to the background (blank) plus three
times the standard deviation of the blank. All data are reported as
means 6 standard deviation (SD). Two-tailed unpaired t-tests
were performed using Graphpad prism (version 5.00 for Windows,
Graphpad Software, San Diego, California, USA). Statistical
significance is defined as p,0.05.
Results and Discussion
Microplate Measurements of BRET Spectra and RatiosThe bioluminescence spectrum of the bioprobe in the absence
of thrombin was bimodal (Figure 3a), with a peak at 470 nm
representing RLuc emission and a second peak at 500 nm
representing GFP2 emission, indicating efficient energy transfer
from the excited state of native coelenterazine to GFP2. Following
incubation with 2 units of thrombin for 90 minutes, the 500 nm
peak was abolished, indicating reduced efficiency of energy
transfer from donor to acceptor due to complete cleavage of the
thrombin bioprobe. It should be noted that the temperature
optimum for Rluc/coelenterazine (e.g. BRETH donor) is 32uCand the pH optimum is pH 7.4. The enzyme will withstand
incubation at temperature up to 45uC for 1 h without loss of
activity and it is stable within a pH range of 6 to 10 [28].
SDS-PAGE (Figure 3b) showed that, following thrombin
treatment, the fusion protein was cleaved into two components
with molecular weights of 32.4 KDa and 36.4 KDa (Lane 5,
Figure 3b) corresponding to His-tagged GFP2 and untagged RLuc.
Pre-incubation of the BRET bioprobe with hirudin, a potent
thrombin inhibitor, inhibited the cleavage confirming the throm-
bin dependency of the reaction (Lane 6, Figure 3b).
The change in BRETH ratio due to bioprobe cleavage by
thrombin (Figure 4) was approximately 32%, from 1.160.06 to
0.7560.04 (P= 0.001). The BRETH ratio following thrombin
cleavage was not significantly different (P = 0.33) from the BRETH
ratio (0.7960.05) of a mixture of 1 mM each of RLuc and GFP2.
Pre-addition of hirudin stabilised the BRETH ratio at 1.160.14,
not significantly different (P = 0.77) from the BRETH ratio of the
untreated bioprobe. These results show that bioprobe cleavage
depends absolutely on and can be used to detect thrombin activity.
We have previously shown that the thrombin site in this bioprobe
is resistant to caspase, an unrelated protease [16].
Measurement of BRETH on ChipThrombin activity was measured in a microfluidic device
(Figure 1). To optimize flow conditions, experiments were carried
out to image and quantify the BRETH luminance at different
positions, flow rates and bioprobe concentrations (Figure 5). In the
initial stage of contact between the two fluid streams, cross
diffusion of bioprobe and substrate molecules into opposite
streams is just beginning. Therefore only a small region of the
fluids near the centreline emits light (data not shown). As x
increases along the channel, the lateral cross-diffusion of the
bioprobe and substrate increases as does the width of the
bioluminescent band. However, due to the large difference in
molecular weights of the substrate (423.4 Da) and bioprobe
(,67 kDa), the diffusion rates of the two molecules are very
different, resulting in an asymmetric bioluminescent band along
the centreline. Assuming the diffusivity coefficients are ,10210
m2/s and ,10211 m2/s for the substrate and bioprobe,
respectively, the width of the substrate diffusional band is
Figure 3. Thrombin cleavage of the bioprobe. (a) Normalisedluminescence spectra of GFP2-RG-RLuc +5 mM native coelenterazinewith or without prior incubation with 2 units of thrombin. Spectra werenormalised by dividing by the Rluc peak intensity at 470 nm. (b) SDS-PAGE analysis of cleaved and intact bioprobe and purified His-taggedBRET proteins. 2.5 mg protein loaded per lane. Lane 1: Molecularmarkers (KDa), Lane 2: RLuc, Lane 3: GFP2, Lane 4: intact GFP2-RG-RLuc,Lane 5: GFP2-RG-RLuc following incubation with 54 nM thrombin for 90minutes at 30uC, Lane 6: GFP2-RG-RLuc, pre-incubated with 2 units ofhirudin for 10 minutes at room temperature prior to thrombintreatment as for Lane 5.doi:10.1371/journal.pone.0088399.g003
Modified BRET Assays
PLOS ONE | www.plosone.org 4 February 2014 | Volume 9 | Issue 2 | e88399

calculated to be 3–4 times that of the bioprobe diffusional band
(see Figure S1 in the electronic supplementary information). Dark
field photography (not shown) of the junctional region of the
microchannel confirmed this estimation. Because concentrations
of the substrate and bioprobe are highest along the centreline all
subsequent measurements were carried out along the midline of
the main channel. We found that mM concentrations of
coelenterazine, i.e <1,000 fold higher than optimal in the
multiwell plate, gave the best luminance in the microfluidic
format, presumably because of enhanced substrate diffusion into
the bioprobe stream. Because of the low volumes used, this was
cost effective. The initial intensity of the bioluminescence was low,
albeit significantly higher than the background, with approxi-
mately 460 arbitrary light units (AU) in the RLuc channel and
2,100 in the GFP2 channel, compared with a background <2 AU.
For locations from x= 1 to 5 mm, the bioluminescence intensities
Figure 4. Dependence of bioprobe BRETH ratio (500 nm/470 nm) on thrombin pre-treatment (mean 6 S.D., n =3). All treatmentsincluded 1 mM GFP2-RG-RLuc. The control was 1 mM RLuc, 1 mM GFP2 and 5 mM native coelenterazine. Thrombin pre-treatment was 54 nM thrombinfor 90 minutes at 30uC. The thrombin+Hirudin condition involved addition of 2 units of hirudin at room temperature 10 minutes before addition of54 nM thrombin. All data were measured in a 96 well microplate using a SpectraMax M2 spectrofluorometer.doi:10.1371/journal.pone.0088399.g004
Figure 5. Variation in luminescence with distance along the common microfluidic channel. GFP2-RG-RLuc luminescence intensities (AU)for RLuc (+) and GFP2 (,) channels in the absence of and for RLuc (#) and GFP2 (6) channels in the presence of coelenterazine substrate. (¤) BRETH
ratio as a function of distance x from the Y-junction as labelled in Figure 6(b). The concentration of GFP2-RG-RLuc was 3.0 mM and the concentrationof coelenterazine was 58.6 mM. [The higher substrate concentrations used in microchip is to increase the light output from the much smaller volume.]Flow rate in the common channel was 40 ml/h. Other conditions as described in ‘‘Experimental’’ and Figure 6.doi:10.1371/journal.pone.0088399.g005
Modified BRET Assays
PLOS ONE | www.plosone.org 5 February 2014 | Volume 9 | Issue 2 | e88399

were higher (<800 and 4,000 AU) and virtually constant but there
was a significant increase at x = 6.9 mm, which may reflect more
complete mixing in this region. Regardless of the intensity of the
bioluminescence, the BRETH ratio remained almost constant
(<5.2) throughout the entire measurement region. The large
numerical difference between the BRETH ratios measured in the
multiwell plate and the microfluidic chip are attributed to the
necessarily different detection equipment used. To benchmark on-
chip measurements, those BRET ratios were compared with
measurements made using a SpectraMax M2 spectrofluorometer
(Molecular Devices). The relative changes in BRETH ratio,
measured with and without thrombin, were the same within
64% for both microchip and microplate systems.
The flow rate dependency of the BRETH ratio was measured at
two locations, x=0 and 4.9 mm (Figure 6a). At x=0, the BRETH
ratio was constant (61.1%) over the full range of flow rates
studied, i.e. 20–60 ml/h. At x=4.9 mm, there was also very little
variation (62%) in the BRET ratio with changing flow rate. The
overall uncertainty in BRETH ratios between the two measure-
ment locations was within 65%. The mean BRETH ratio did not
vary systematically with bioprobe concentration over the range
tested of 1.5–14.5 mM (SD=2.7%; Figure 6b) although variation
in BRETH was high (SD=7.7%) at the lowest bioprobe
concentration tested, namely 1.5 mM. The stability of the BRETH
ratio across a wide range of measurement conditions is important
practically as it indicates the assay can potentially tolerate non-
ideal conditions such as variations in flow rate, or reagent
concentration or incomplete mixing as long as there is sufficient
light for spectrally resolved detection. Although more complete
mixing would be predicted to increase the luminosity of the system
our data indicate that this would have little effect on the measured
BRETH ratio. This potentially simplifies the design requirements
for microfluidic devices using BRETH -based detection.
Comparison of Thrombin Sensitivities betweenMicrofluidic and Static Assay FormatsWe compared bioprobe BRETH responses to thrombin on the
microfluidic chip and in a standard 96 well microtitre plate format
(Figure 7). On the microfluidic chip, the BRETH ratio increased
linearly with thrombin concentrations up to 0.24 nM. In the
multiwell plate assay, the limit of linearity was 2.7 nM. At
thrombin concentrations higher than these, the change in BRETH
ratio flattens rapidly, presumably due to digestion of most of the
bioprobe before the end of the incubation period. At lower
thrombin concentrations, the relationships between BRETH ratio
and thrombin concentration were linear, with R2 values exceeding
0.995. Comparison of the gradients revealed that the microfluidic
method is 4.7 times more sensitive to changing thrombin
concentrations than the multiwell plate method. The limit of
detection (LOD, see Experimental) for thrombin is 27 pM for the
microfluidic chip-based technique compared to 310 pM using the
multiwall plate-based technique. The LOD measured in the
microfluidic format is intermediate between the values of 15 pM
and 53 pM, previously determined for BRET2 and BRET1,
respectively [6], in multiwell plate-based assays. The higher
sensitivity observed in the microfluidic system may be due to the
smaller detection volume and consequent lack of self-absorption
effects as well as the constant refreshing of bioprobe and substrate
and removal of potentially inhibitory reaction products. In
contrast, in the static multiwell plate assay, unreacted substrate
is depleted and potentially inhibitory reaction products accumu-
late over time. The LOD of 27 pM for the current microchip-
based system is much lower than those reported for comparable
microfluidic based protease assays. For example, a concentration
of 0.001 Unit/mL for proteinase K (i.e. ,1.2 nM with a specific
activity of 30 Units mg21) was used in a microfluidic protease
activity assay that used fluorescence polarisation [29]. An LOD of
6.2 nM for trypsin [19] was achieved in an electroluminescence-
CCD microchip platform with quantum dot based sensors. The
relatively low LOD and high sensitivity of the current technique
are extremely attractive and demonstrate the potential usefulness
of highly sensitive BRET-based microfluidic sensors for a range of
analytes. For example, thrombin concentrations associated with
plasma clots have been measured as 0.46 nM using both
chromogenic and clotting methods [30]. This is within the range
detectable on chip using the Hybrid BRET assay, demonstrating
the latter’s potential for directly measuring physiologically relevant
concentrations of thrombin.
Figure 6. BRETH ratios as a function of total flow rate of theaqueous streams (a) and the bioprobe concentration (b) (mean6SD, n=5). (a) Fusion protein concentration was 3.0 mM and nativecoelenterazine concentration was 58.6 mM; (b) Native coelenterazineconcentration was 58.6 mM; each aqueous flow rate was 20 ml/h; a 206objective was used; filter band pass for GFP2 and RLuc channel are 515–555 nm and 430–455 nm respectively; an internal gate time of 200 mswas used for data acquisition.doi:10.1371/journal.pone.0088399.g006
Modified BRET Assays
PLOS ONE | www.plosone.org 6 February 2014 | Volume 9 | Issue 2 | e88399

Conclusions
Bioluminescence resonance energy transfer has been demon-
strated for the first time in a flow format using a fluid phase
thrombin-sensitive bioprobe. The BRETH technique used was a
hybrid between BRET1 and BRET2, which allowed testing of the
BRET2 donor/acceptor components with measurable luminosity.
The BRET reaction and detection were carried out in a Y-shape
microchannel network in a microfluidic chip. Experiments
quantified the effects of measurement location, flow rate and
bioprobe concentration. These factors affected the biolumines-
cence intensities in both optical channels but not the BRETH ratio.
The microfluidic technique showed higher sensitivity and lower
limits of detection (27 pM) for thrombin compared to the same
bioprobe deployed in a multiwell plate-based format and
measured with a commercial spectrofluorometer
(LOD=310 pM). The microfluidic biosensor described exempli-
fies a potentially new class of microfluidics-based BRET sensor
devices for chemical and biological sensing and detection.
Supporting Information
Figure S1.
(TIFF)
Acknowledgments
The authors thank Brett A. Sexton and Fiona Glenn from CSIRO
Materials Science and Engineering, Clayton, Australia for their help in the
fabrication of the microchip mould and Dr Nam Le from CSIRO
Materials Science and Engineering for preparing the figures.
Author Contributions
Conceived and designed the experiments: HD AA SCT YZ. Performed the
experiments: NW YZ HD. Analyzed the data: NW YZ HD. Contributed
reagents/materials/analysis tools: HD AA SCT. Wrote the paper: NWHD
AA SCT YZ.
References
1. Turner APF (2013) Biosensors: sense and sensibility. Chemical Society Reviews
42: 3184–3196.
2. Rea I, Orabona E, Lamberti A, Rendina I, De Stefano L (2011) A microfluidics
assisted porous silicon array for optical label-free biochemical sensing.
Biomicrofluidics 5: 034120.
3. De Stefano L, Orabona E, Lamberti A, Rea I, Rendina I (2013) Microfluidics
assisted biosensors for label-free optical monitoring of molecular interactions.
Sensors and Actuators B: Chemical 179: 157–162.
4. Fang S, Lee HJ, Wark AW, Kim HM, Corn RM (2005) Determination of
Ribonuclease H Surface Enzyme Kinetics by Surface Plasmon Resonance
Imaging and Surface Plasmon Fluorescence Spectroscopy. Anal Chem 77:
6528–6534.
5. Boute N, Jockers R, Issad T (2002) The use of resonance energy transfer in high-
throughput screening: BRET versus FRET. Trends Pharm Sci 23: 351–354.
6. Dacres H, Dumancic MM, Horne I, Trowell SC (2009) Direct comparison of
bioluminescence-based resonance energy transfer methods for monitoring of
proteolytic cleavage. Anal Biochem 385: 194–202.
7. Andou T, Endoh T, Mie M, Kobatake E (2011) Development of an RNA
detection system using bioluminescence resonance energy transfer. Sens Actu B
152: 277–284.
8. Dragulescu-Andrasi A, Chan CT, De A, Massoud TF, Gambhir SS (2011)
Bioluminescence resonance energy transfer (BRET) imaging of protein–protein
interactions within deep tissues of living subjects. PNAS 108: 12060–12065.
9. Pfleger KDG, Seeber RM, Eidne KA (2006) Bioluminescence resonance energy
transfer (BRET) for the real-time detection of protein-protein interactions. Nat
Protocols 1: 337–345.
10. Xu Y, Piston DW, Johnson CH (1999) A bioluminescence resonance energy
transfer (BRET) system: application to interacting circadian clock proteins.
PNAS 96: 151–156.
11. Milligan G (2004) Applications of bioluminescence- and fluorescence resonance
energy transfer to drug discovery at G protein-coupled receptors. Euro J Pharm
Sci 21: 397–405.
12. Xu X, Soutto M, Xie Q, Servick S, Subramanian C, et al. (2007) Imaging
protein interactions with bioluminescence resonance energy transfer (BRET) in
plant and mammalian cells and tissues. PNAS 104: 10264–10269.
Figure 7. Thrombin sensitivity of the GFP2-RG-RLuc bioprobe in microfluidic and multiwall plate formats (mean6SD, n=5). For bothstatic and microfluidic assays, BRETH ratios were normalised independently against the ratio measured in the absence of thrombin. All microfluidicmeasurements were obtained at x = 2.1 mm. (#) microfluidic and (%) multiwell plate measurements. The large graph shows the BRETH responses atlow thrombin concentrations. Insets show the corresponding full-range measurements. Data are fitted to linear regressions: y = 0.835x +1.019(R2 = 0.996) for the microfluidic and y = 0.1797x +1.001 (R2 = 0.995) for the multiwall.doi:10.1371/journal.pone.0088399.g007
Modified BRET Assays
PLOS ONE | www.plosone.org 7 February 2014 | Volume 9 | Issue 2 | e88399

13. Roda A, Guardigli M, Michelini E, Mirasoli M (2009) Bioluminescence in
analytical chemistry and in vivo imaging. Trends Anal Chem 28: 307–322.14. Haruyama T (2006) Cellular biosensing: Chemical and genetic approaches. Anal
Chim Acta 568: 211–216.
15. Xia Z, Rao J (2009) Biosensing and imaging based on bioluminescenceresonance energy transfer. Curr Opin Biotech 20: 37–44.
16. Dacres H, Dumancic MM, Horne I, Trowell SC (2009) Direct comparison offluorescence- and bioluminescence-based resonance energy transfer methods for
real-time monitoring of thrombin-catalysed proteolytic cleavage. Biosen Bioelec
24: 1164–1170.17. Filanoski B, Rastogi SK, Cameron E, Mishra NN, Maki W, et al. (2008) A novel
homogeneous bioluminescence resonance energy transfer element for biomo-lecular detection with CCD camera or CMOS device. Luminescence 23: 22–27.
18. Maehana K, Tani H, Kamidate T (2006) On-chip genotoxic bioassay based onbioluminescence reporter system using three-dimensional microfluidic network.
Analytica Chimica Acta 560: 24–29.
19. Sapsford KE, Farrell D, Sun S, Rasooly A, Mattoussi H, et al. (2009) Monitoringof enzymatic proteolysis on a electroluminescent-CCD microchip platform using
quantum dot-peptide substrates. Sens Actu B 139: 13–21.20. Liu Y, Gerber R, Wu J, Tsuruda T, McCarter JD (2008) High-throughput
assays for sirtuin enzymes: A microfluidic mobility shift assay and a
bioluminescence assay. Anal Biochem 378: 53–59.21. Varghese SS, Zhu Y, Davis TJ, Trowell SC (2010) FRET for lab-on-a-chip
devices – current trends and future prospects. Lab Chip 10: 1355–1364.22. Eltoukhy H, Salama K, El Gamal A (2006) A 0.18-mm CMOS Bioluminescence
Detection Lab-on-Chip. IEEE J Solid-state Circuits 41: 651–661.
23. Molinari P, Casella I, Costa T (2008) Functional complementation of high-
efficiency resonance energy transfer: a new tool for the study of protein binding
interactions in living cells. Biochem J 409: 251–261.
24. Dacres H, Wang J, Dumancic MM, Trowell SC (2010) Experimental
Determination of the Forster Distance for Two Commonly Used Bioluminescent
Resonance Energy Transfer Pairs. Analytical Chemistry 82: 432–435.
25. Dacres H, Wang J, Leitch V, Horne I, Anderson AR, et al. (2011) Greatly
enhanced detection of a volatile ligand at femtomolar levels using biolumines-
cence resonance energy transfer (BRET). Biosensors and Bioelectronics 29: 119–
124.
26. Pfleger KDG, Eidne KA (2006) Illuminating insights into protein-protein
interactions using bioluminescence resonance energy transfer (BRET). Nat
Methods 3: 165–174.
27. Rydel T, Ravichandran K., Tulinsky A., Bode W., Huber R., Roitsch C.,
Fenton J. (1990) The structure of a complex of recombinant hirudin and human
alpha-thrombin. Science 249: 277–280.
28. Mattews J, Hori K, Cormier MJ (1977) Purification and properties of Renilla
reniformis Luciferase. Biochemistry 16: 85–91.
29. Kim JH, Shin HJ, Cho H, Kwak SM, Kim TS, et al. (2006) A microfluidic
protease activity assay based on the detection of fluorescence polarization.
Analytica Chimica Acta 577: 171–177.
30. Meddahia S, Baraa L, Fessib H, Samama MM (2004) Standard measurement of
clot-bound thrombin by using a chromogenic substrate for thrombin.
Thrombosis Research 114: 51–56.
Modified BRET Assays
PLOS ONE | www.plosone.org 8 February 2014 | Volume 9 | Issue 2 | e88399