Comparison of Secretory Responses as Measured by Membrane Capacitance and by Amperometry
14
Comparison of Secretory Responses as Measured by Membrane Capacitance and by Amperometry Mirjam Haller, Christian Heinemann, Robert H. Chow, Ruth Heidelberger, and Erwin Neher Department of Membrane Biophysics, Max Planck Institute for Biophysical Chemistry, 37077 Go ¨ ttingen, Germany ABSTRACT We have compared capacitance and amperometric measurements in bovine chromaffin cells when secretion was elicited by flash photolysis of caged-calcium or step depolarizations. Total amperometric charge depended linearly on the amount of capacitance increase in both types of experiments. Furthermore, the properties of resolvable amperometric spikes after flashes were comparable to those observed after depolarizations, and their timing was compatible with the rate of capacitance increase. For a more detailed comparison, we used Monte Carlo simulations of multiple amperometric events occurring randomly over the surface of a sphere and summing together, to generate a reference amperometric signal for a given measured capacitance increase. Even after correction for endocytotic processes, the time courses of the integrated experimental records lagged behind the integrated Monte Carlo records by ;50 ms in flash and depolarization experiments. This delay was larger by ;40 ms than what can be expected from the “pre-foot delay” or the foot duration. Possible sources for the remaining delay could be diffusional barriers like the patch-pipette and the chamber bottom, which are not taken into account in the model. We also applied a novel type of fluctuation analysis to estimate the relative quantum size of an amperometric event. On average the estimates from experimental amperometric traces, in both flash and depolarization experiments, were 3–5 times smaller than estimates from simulated ones. This discrepancy can be due to contributions to the amperometric current from small vesicles, preferred release from cellular regions orientated toward the chamber bottom, or abundance of “foot-only” events. In conclusion, amperometric signals in flash and depolarization experiments displayed similar delayed average time courses and a lower estimate for the relative quantum size compared to the modeled amperometric signals. However, individual amperometric spikes were in agreement with expectations derived from capac- itance signals. INTRODUCTION The process of exocytosis from neurosecretory cells has been studied at the single-cell level mainly by two tech- niques: measurement of the electrical capacitance of the membrane (Neher and Marty, 1982; Henkel and Almers, 1996; Gillis, 1995) and amperometric detection with carbon fibers (Leszczyszyn et al., 1991; Chow et al., 1992). Whereas membrane capacitance reports changes in surface area upon fusion of secretory granules with the plasma membrane, amperometry detects oxidizable material re- leased from fused granules. These methods offer unprece- dented sensitivity and time resolution in studies of secre- tion. However, each technique has disadvantages with regard to quantification of the kinetics of secretion. Capac- itance measurement lacks specificity because it reflects the sum of all possible changes in surface area. These include endocytosis, which very often is tightly coupled to exocy- tosis. Amperometry detects with high temporal resolution and accuracy only those secretory events that occur close to the sensitive surface of the electrochemical detector. Events occurring further away from the tip of the carbon fiber are reported with diffusional delays, and are attenuated to a variable degree, because most released molecules will dif- fuse away and never hit the detector. As a result, only ;10% of the release events are expected to be detectable, when a typical carbon fiber (of ;10 mm diameter) is used on a typical neurosecretory cell (such as an adrenal chro- maffin cell of ;15 mm diameter). Agreement between amperometry and capacitance changes at this level of accu- racy was reported (Chow et al., 1992), although systematic differences between the two types of signals due to endo- cytosis were observed (von Ru ¨den and Neher, 1993). A recent study, however, raised questions about the correspon- dence between the two signals, and suggested that there is a rapid capacitance increase after flash-induced photolysis of the caged-Ca 21 compound DM-nitrophen that is not asso- ciated at all with secretion of oxidizable material (Ober- hauser et al., 1996). In addition, two recent studies have demonstrated that rapid increases in [Ca 21 ] i can induce increases in membrane capacitance in cell types that are not specialized to secrete hormone-like substances, such as fi- broblasts or Chinese hamster ovary cells (Henkel and Alm- ers, 1996; Ninomiya et al., 1996; Coorssen et al., 1996). We therefore performed a detailed comparison of amperometric and capacitance signals induced by both depolarizing pulses Received for publication 18 August 1997 and in final form 14 December 1997. Address reprint requests to Prof. Erwin Neher, Max Planck Institute for Biophysical Chemistry, Department of Membrane Biophysics, Am Fass- berg, 37077 Go ¨ttingen, Germany. Tel.: 49-551-2011630; Fax: 149-551- 2011688; E-mail: [email protected]. M. Haller’s present address is II. Institute of Physiology, University of Go ¨ttingen, Humboldtallee 23, 37073 Go ¨ttingen, Germany. Dr. Chow’s present address is Department of Physiology, University of Edinburgh Medical School, Edinburgh EH8 9AG, Scotland. Dr. Heidelberger’s present address is Department of Neurobiology and Anatomy, University of Texas Medical School, Houston, TX 77030. © 1998 by the Biophysical Society 0006-3495/98/04/2100/14 $2.00 2100 Biophysical Journal Volume 74 April 1998 2100 –2113
-
Upload
independent -
Category
Documents
-
view
4 -
download
0
Transcript of Comparison of Secretory Responses as Measured by Membrane Capacitance and by Amperometry

Comparison of Secretory Responses as Measured by MembraneCapacitance and by Amperometry
Mirjam Haller, Christian Heinemann, Robert H. Chow, Ruth Heidelberger, and Erwin NeherDepartment of Membrane Biophysics, Max Planck Institute for Biophysical Chemistry, 37077 Gottingen, Germany
ABSTRACT We have compared capacitance and amperometric measurements in bovine chromaffin cells when secretionwas elicited by flash photolysis of caged-calcium or step depolarizations. Total amperometric charge depended linearly onthe amount of capacitance increase in both types of experiments. Furthermore, the properties of resolvable amperometricspikes after flashes were comparable to those observed after depolarizations, and their timing was compatible with the rateof capacitance increase. For a more detailed comparison, we used Monte Carlo simulations of multiple amperometric eventsoccurring randomly over the surface of a sphere and summing together, to generate a reference amperometric signal for agiven measured capacitance increase. Even after correction for endocytotic processes, the time courses of the integratedexperimental records lagged behind the integrated Monte Carlo records by ;50 ms in flash and depolarization experiments.This delay was larger by ;40 ms than what can be expected from the “pre-foot delay” or the foot duration. Possible sourcesfor the remaining delay could be diffusional barriers like the patch-pipette and the chamber bottom, which are not taken intoaccount in the model. We also applied a novel type of fluctuation analysis to estimate the relative quantum size of anamperometric event. On average the estimates from experimental amperometric traces, in both flash and depolarizationexperiments, were 3–5 times smaller than estimates from simulated ones. This discrepancy can be due to contributions to theamperometric current from small vesicles, preferred release from cellular regions orientated toward the chamber bottom, orabundance of “foot-only” events. In conclusion, amperometric signals in flash and depolarization experiments displayedsimilar delayed average time courses and a lower estimate for the relative quantum size compared to the modeledamperometric signals. However, individual amperometric spikes were in agreement with expectations derived from capac-itance signals.
INTRODUCTION
The process of exocytosis from neurosecretory cells hasbeen studied at the single-cell level mainly by two tech-niques: measurement of the electrical capacitance of themembrane (Neher and Marty, 1982; Henkel and Almers,1996; Gillis, 1995) and amperometric detection with carbonfibers (Leszczyszyn et al., 1991; Chow et al., 1992).Whereas membrane capacitance reports changes in surfacearea upon fusion of secretory granules with the plasmamembrane, amperometry detects oxidizable material re-leased from fused granules. These methods offer unprece-dented sensitivity and time resolution in studies of secre-tion. However, each technique has disadvantages withregard to quantification of the kinetics of secretion. Capac-itance measurement lacks specificity because it reflects thesum of all possible changes in surface area. These include
endocytosis, which very often is tightly coupled to exocy-tosis. Amperometry detects with high temporal resolutionand accuracy only those secretory events that occur close tothe sensitive surface of the electrochemical detector. Eventsoccurring further away from the tip of the carbon fiber arereported with diffusional delays, and are attenuated to avariable degree, because most released molecules will dif-fuse away and never hit the detector. As a result, only;10% of the release events are expected to be detectable,when a typical carbon fiber (of;10 mm diameter) is usedon a typical neurosecretory cell (such as an adrenal chro-maffin cell of ;15 mm diameter). Agreement betweenamperometry and capacitance changes at this level of accu-racy was reported (Chow et al., 1992), although systematicdifferences between the two types of signals due to endo-cytosis were observed (von Ru¨den and Neher, 1993). Arecent study, however, raised questions about the correspon-dence between the two signals, and suggested that there is arapid capacitance increase after flash-induced photolysis ofthe caged-Ca21 compound DM-nitrophen that is not asso-ciated at all with secretion of oxidizable material (Ober-hauser et al., 1996). In addition, two recent studies havedemonstrated that rapid increases in [Ca21]i can induceincreases in membrane capacitance in cell types that are notspecialized to secrete hormone-like substances, such as fi-broblasts or Chinese hamster ovary cells (Henkel and Alm-ers, 1996; Ninomiya et al., 1996; Coorssen et al., 1996). Wetherefore performed a detailed comparison of amperometricand capacitance signals induced by both depolarizing pulses
Received for publication 18 August 1997 and in final form 14 December1997.
Address reprint requests to Prof. Erwin Neher, Max Planck Institute forBiophysical Chemistry, Department of Membrane Biophysics, Am Fass-berg, 37077 Go¨ttingen, Germany. Tel.: 49-551-2011630; Fax:149-551-2011688; E-mail: [email protected].
M. Haller’s present address is II. Institute of Physiology, University ofGottingen, Humboldtallee 23, 37073 Go¨ttingen, Germany.
Dr. Chow’s present address is Department of Physiology, University ofEdinburgh Medical School, Edinburgh EH8 9AG, Scotland.
Dr. Heidelberger’s present address is Department of Neurobiology andAnatomy, University of Texas Medical School, Houston, TX 77030.
© 1998 by the Biophysical Society
0006-3495/98/04/2100/14 $2.00
2100 Biophysical Journal Volume 74 April 1998 2100–2113
and flash photolysis of caged calcium in bovine adrenalchromaffin cells. We combined these measurements withMonte Carlo simulations to test whether amperometric sig-nals (after allowing for diffusional spread and attenuation ofthe release process) are compatible with the simultaneouslymeasured capacitance increases. With regard to flash pho-tolysis, we show that the time courses of those amperomet-ric spikes that can be classified as single release events arecompatible with predictions from the capacitance timecourse. We also observe, however, that the average ampero-metric time course after flashes and depolarizations is some-what delayed with respect to simulations, even if knownsources of possible discrepancies were taken into account.
As possible explanations for the discrepancies, we dis-cuss contributions to secretion of oxidizable material fromsmall granules or a sizable contribution of amperometricevents with time courses different from those of typicalspikes, such as “foot-only” events (Zhou et al., 1996) orinhomogeneous distribution of release sites. In our experi-mental conditions we do not observe latencies as long as0.5 s to the first amperometric spike after a first flash, suchas were reported by Oberhauser et al. (1996).
METHODS
Cell preparation and solutions
Bovine adrenal chromaffin cells were prepared as previously described(Zhou and Neher, 1993) and were used 1–3 days after plating. Our normalbath solution for experiments with depolarizing voltage pulses contained140 mM NaCl, 2.8 mM KCl, 10 mM CaCl2, 1 mM MgCl2, and 10 mMNaOH-HEPES (pH 7.2). In flash experiments, we used a Mg21-free bathsolution containing 140 mM NaCl, 2.8 mM KCl, 2 mM CaCl2, and 10 mMNaOH-HEPES (pH 7.2). In addition, 2–4 mg/ml glucose was added to bothsolutions to match the osmolarity of the pipette filling solutions. For flashexperiments the pipette was filled with 5 mM Na4-DM-nitrophen (Calbio-chem, La Jolla, CA), 96 mM Cs-glutamate, 40 mM Cs-HEPES, 0.3 mMGTP, #4.5 mM CaCl2, 1 mM Mg-ATP, 4 mM Na-ATP, 0.3 mM fura-2,or 10 mM Na4-DM-nitrophen, 77 mM Cs-glutamate, 32 mM Cs-HEPES,0.3 mM GTP,#10 mM CaCl2, 3 mM K3-DPTA (DPTA: 1,3-diaminopro-pane-2-ol-N,N9-tetraacetic acid), and 1 mM furaptra. The free Ca21 con-centration of the pipette filling solutions was carefully adjusted to#500nM by adding small volumes of DM-nitrophen or CaCl2. The internalsolution for pulse experiments contained 145 mM Cs-glutamate, 8 mMNaCl, 1 mM MgCl2, 10 mM KOH-HEPES, 2 mM Mg-ATP, 0.3 mM GTP,and 0.1 mM fura-2. Ca21 indicator dyes were purchased from MolecularProbes (Eugene, OR); other chemicals were obtained from Sigma (Deisen-hofen, Germany) unless specified otherwise.
Electrical measurements
Amperometry and capacitance measurements were performed as explainedin detail by Chow and von Ru¨den (1995) and Gillis (1995). Briefly,polyethylene-insulated carbon fibers of 10-mm diameter were used, the cutend face of which were placed within 1mm of the surface of a bovineadrenal chromaffin cell. Amperometric current was measured with a cus-tom-built patch-clamp amplifier with 800 mV applied to the fiber. Capac-itance was measured in the whole-cell configuration, using an EPC-9amplifier (Heka Elektronik, Lambrecht, Germany) and its software(Sine1dc mode using 800 Hz, 20 mV sinusoidal).
Flash photolysis of caged Ca21 and[Ca21]i measurements
For measurement of [Ca21]i we used a monochromator-based system(TILL Photonics, Gra¨feling, Germany) as described by Messler et al.(1996). The Ca21 indicators fura-2 and furaptra were excited at 0.5 Hz with20-ms light pulses at 350/385 nm and 345/380 nm, respectively. Theexcitation intensity was reduced far below the level leading to evidentphotolysis of DM-nitrophen. The fluorescence light collected from a 25-mm-diameter spot in the object plane passed through a 470-nm long-passand a 540-nm short-pass filter and was detected by a photomultiplier tube(Hamamatsu, R928). The fluorescence signal was sampled by the EPC-9and acquired with the fura extension of the Pulse software (Heka Elek-tronik, Lambrecht, Germany). UV light from a xenon arc flash lamp (GertRapp Optoelektronik, Hamburg, Germany) was combined with the exci-tation light for Ca21 indicators and coupled into the epifluorescence port ofan IM-35 microscope (Zeiss, Oberkochen, Germany), as described byHeinemann et al. (1994). By means of a field stop, the illuminated area wasreduced to a spot of;80 mm diameter. The recording pipettes came in atan angle and were positioned such that only the tip lay within this regionof intense illumination. The final 30mm of the pipette solution may bepartially photolysed. However, these intermix diffusionally with unphoto-lysed solution on a time scale of 1–5 s. For all experiments we used a ZeissNeofluar 1003, 1.3 NA oil immersion objective. Calibration methods usedfor caged Ca21 experiments were as described in Heinemann et al. (1994).
The first photolysing flash in a given experiment was triggered;2–3min after the whole-cell configuration was established, to allow for recov-ery of [Ca21]i to 300–500 nM after the loading transient. Repetitive flasheswere given at a rate of;1 min21 to ensure that time intervals betweenflashes were long enough for postflash [Ca21]i to recover to the basal[Ca21]i.
Simulations
Whole-cell capacitance increases include contributions from exocytoticevents over the entire cell surface. Amperometric responses, on the otherhand, are recorded from a fraction of the cell surface and are attenuated anddiffusionally delayed to varying degrees, depending on the location ofexocytotic events relative to the carbon fiber electrode. Capacitance andamperometry signals thus cannot be compared directly. We thereforecalculated the amperometric response expected from a measured capaci-tance trace by using Monte Carlo methods.
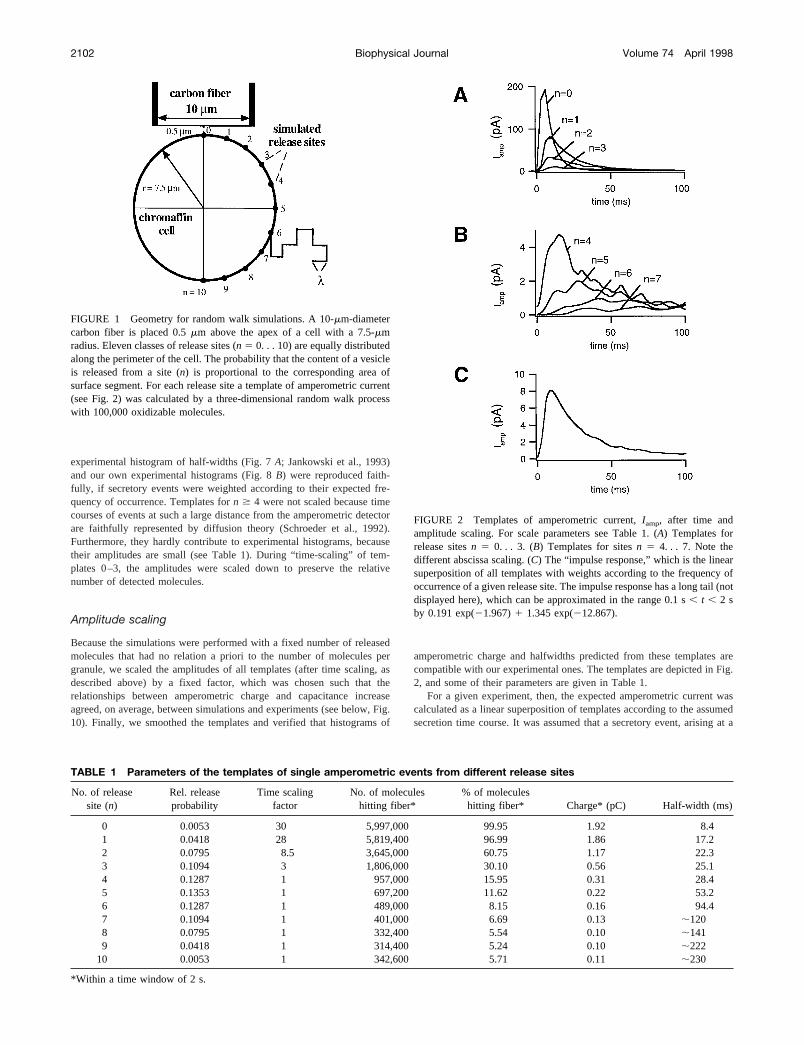
We assumed that exocytotic events occurred in a random and uniformdistribution over the cell surface. The geometry of the assumed arrange-ment is displayed in Fig. 1: a carbon fiber of 10mm diameter is placed 0.5mm from the apex of a cell with a 7.5-mm radius. Templates for secretoryevents at 11 locations around the perimeter were calculated by a three-dimensional random walk, in analogy to Schroeder et al., 1992. In eachcase 100,000 oxidizable particles were assumed to be released instanta-neously at time 0, to diffuse in the surrounding medium with a diffusioncoefficient of 5.5 3 1026 cm2/s (Gerhardt and Adams, 1982), to bereflected, when hitting the cell surface or the cylindrical face of the carbonfiber, or to be absorbed, when hitting the disc-like tip of the carbon fiber.Absorbed particles were assumed to contribute equally to amperometriccurrent. Simulations were terminated after 2 s.
Two types of scaling were performed to bring these templates intoagreement with amperometric recordings: time scaling and amplitudescaling.
Time scaling
The above calculations assume instantaneous release of transmitter; how-ever, experiments show that amperometric spikes are broader than wouldbe expected for instantaneous release (Schroeder et al., 1992; Wightman etal., 1995). Therefore, we scaled the time axes of templates correspondingto points n 5 0 to n 5 3 of Fig. 1 by empirical factors, such that the
Haller et al. Amperometry versus Capacitance Measurement 2101
experimental histogram of half-widths (Fig. 7A; Jankowski et al., 1993)and our own experimental histograms (Fig. 8B) were reproduced faith-fully, if secretory events were weighted according to their expected fre-quency of occurrence. Templates forn $ 4 were not scaled because timecourses of events at such a large distance from the amperometric detectorare faithfully represented by diffusion theory (Schroeder et al., 1992).Furthermore, they hardly contribute to experimental histograms, becausetheir amplitudes are small (see Table 1). During “time-scaling” of tem-plates 0–3, the amplitudes were scaled down to preserve the relativenumber of detected molecules.
Amplitude scaling
Because the simulations were performed with a fixed number of releasedmolecules that had no relation a priori to the number of molecules pergranule, we scaled the amplitudes of all templates (after time scaling, asdescribed above) by a fixed factor, which was chosen such that therelationships between amperometric charge and capacitance increaseagreed, on average, between simulations and experiments (see below, Fig.10). Finally, we smoothed the templates and verified that histograms of
amperometric charge and halfwidths predicted from these templates arecompatible with our experimental ones. The templates are depicted in Fig.2, and some of their parameters are given in Table 1.
For a given experiment, then, the expected amperometric current wascalculated as a linear superposition of templates according to the assumedsecretion time course. It was assumed that a secretory event, arising at a
FIGURE 2 Templates of amperometric current,Iamp, after time andamplitude scaling. For scale parameters see Table 1. (A) Templates forrelease sitesn 5 0. . . 3. (B) Templates for sitesn 5 4. . . 7. Note thedifferent abscissa scaling. (C) The “impulse response,” which is the linearsuperposition of all templates with weights according to the frequency ofoccurrence of a given release site. The impulse response has a long tail (notdisplayed here), which can be approximated in the range 0.1 s, t , 2 sby 0.191 exp(21.967)1 1.345 exp(212.867).
FIGURE 1 Geometry for random walk simulations. A 10-mm-diametercarbon fiber is placed 0.5mm above the apex of a cell with a 7.5-mmradius. Eleven classes of release sites (n 5 0. . . 10) are equally distributedalong the perimeter of the cell. The probability that the content of a vesicleis released from a site (n) is proportional to the corresponding area ofsurface segment. For each release site a template of amperometric current(see Fig. 2) was calculated by a three-dimensional random walk processwith 100,000 oxidizable molecules.
TABLE 1 Parameters of the templates of single amperometric events from different release sites
No. of releasesite (n)
Rel. releaseprobability
Time scalingfactor
No. of moleculeshitting fiber*
% of moleculeshitting fiber* Charge* (pC) Half-width (ms)
0 0.0053 30 5,997,000 99.95 1.92 8.41 0.0418 28 5,819,400 96.99 1.86 17.22 0.0795 8.5 3,645,000 60.75 1.17 22.33 0.1094 3 1,806,000 30.10 0.56 25.14 0.1287 1 957,000 15.95 0.31 28.45 0.1353 1 697,200 11.62 0.22 53.26 0.1287 1 489,000 8.15 0.16 94.47 0.1094 1 401,000 6.69 0.13 ;1208 0.0795 1 332,400 5.54 0.10 ;1419 0.0418 1 314,400 5.24 0.10 ;222
10 0.0053 1 342,600 5.71 0.11 ;230
*Within a time window of 2 s.
2102 Biophysical Journal Volume 74 April 1998

random location on the cell surface, occurred whenever capacitance in-creased by another 2.5 fF (Neher and Marty, 1982; Chow et al., 1996). Forthat purpose a random integer betweenn 5 0 andn 5 10 was generatedwith a relative frequency of occurrence proportional to the areas of thesurface segments belonging to the designated points in Fig. 1, and atemplate of classn was added to the model amperometric record. Thisprocedure and a resulting model trace are depicted in Fig. 3. It is seen thatthe model curve is dominated by one (sometimes two or three) largeevent(s) of class 0 to class 2. Repeated simulations gave highly variableresults because of the stochastics of the assignment of templates. The mostfrequently occurring events were those of classes 4–6, which tend to forma smooth background, on top of which individual spikes occur.
We also calculated the “impulse response,” which is expected to bemeasured by an amperometric electrode, when many vesicles exocytosesimultaneously and uniformly over the cell surface. For this purpose wesuperimposed templates with weights according to their respective site ofrelease. The waveform, depicted in Fig. 2C, has a half-width of 21.8 ms,and its area represents 18.7% of all the released catecholamines. Note, thatit has a long tail, not displayed in Fig. 2C (see legend).
The impulse response can be considered as the statistical distribution ofdelays between release and detection of a given catecholamine molecule.Correspondingly, a mean detection delay of;175 ms is calculated fromthis curve.
Capacitance cannot be measured during and shortly after depolarizingpulses. The model calculations described below, however, require that thesecretion time course is known. We therefore assumed that the rate of
secretion rises during depolarizing pulses to a constant value with a timeconstant of 18 ms and decays after pulses with the same time constant,reflecting the latency histograms as measured by Chow et al. (1996). Weset the asymptotic secretion rate in the latency histogram, such that thereconstructed capacitance increment (corresponding to the integrated la-tency histogram) matched the measured capacitance record at 80 ms afterthe end of the pulse. At this “normalization point” contributions to thecapacitance traces by endocytosis and the Na channel gating artefact(Horrigan and Bookman, 1994) were assumed to be lowest. For the timeafter the normalization point, the measured capacitance trace was taken asa template for simulations.
Measured capacitance represents the summed effect of exocytosis andendocytosis, whereas in amperometry only exocytosis is measured. For thisreason we performed a second set of simulations, using as new templatescapacitance traces that were adjusted for endocytosis. This was achieved byassuming an endocytotic process, which retrieved all of the membraneadded during the stimulus with a time constant oftendo. If most of theexocytosis happens in a time interval short compared totendo, the equation
DCm,corr~t! 5 DCm~t!/exp~2t/tendo!
represents a practical approximation for this correction.DCm(t) was re-placed byDCm, corr(t) in the simulation, which otherwise was performed asdescribed above. For depolarization experiments the secretion time courseup to the normalization point was calculated as above, except that adouble-exponential decay of the rate of secretion was assumed (85% of theamplitude at the 18-ms time constant and 15% at the 1.25-s time constant).The time course was normalized with respect to the value ofDCm, corr(t) atthe normalization point. The secretion time course after the normalizationpoint was taken as that ofDCm, corr(t).
The overall features of the simulated curves resemble those of measuredamperometric traces. However, inspection of many traces gives the im-pression that there is a lower number of large spikes relative to smoothbackground in experiments, as compared to simulations. Unfortunately, aone-to-one quantitative comparison between experiments and modelcurves is not very meaningful, because of the random nature of the fewlarge spikes. We therefore applied two types of statistical analysis to boththe model and the experimental curves: class averages and variance versusmean analysis.
Class averages
We subdivided all flash experiments of a given kind into three classesaccording to the rate constant (r) of the rise of the capacitance signal: class1, r , 50 s21; class 2, 50 s21 # r , 100 s21; class 3,r $ 100 s21. Wenormalized the averaged capacitance time courses and the averaged timeintegrals of the amperometric records of each class to their respective valueat 600 ms after the flash. In depolarization experiments we normalized thecapacitance time course, and the measured and simulated time integrals ofthe amperometric records to their respective values 600 ms after the startof the depolarization (see below, Fig. 7).
Variance versus mean analysis
The ratio of variance to mean of a fluctuating record has proved to be veryvaluable for estimation of the amplitude of the underlying elementarysignals (such as in analyzing membrane currents). Two properties ofamperometric records prevent straightforward application of this approach:1) The amperometric record is a superposition of many different classes(near and far) of elementary events. 2) The occurrence of the elementaryevents is not stationary, but rather phasic, with a distinct peak afterstimulation. Nevertheless, we show below that the ratio of a suitablycalculated variance over the mean can yield an estimate subsequentlycalled the “secretory quantum,” which is proportional to the vesicle con-tents. The comparison of that estimate with the estimate derived from asimulated trace of the same experiment then allows one to test whether the
FIGURE 3 Generation of simulated amperometric traces. To generatesimulated amperometric traces that can be directly compared to experi-mental amperometric traces after flashes, release rates and the number ofvesicles released were estimated from the corresponding capacitancetraces. This was achieved by first either fitting the capacitance trace witha single or double exponential fit or smoothing it with a box smoothingprocedure. (A) For each incrementDC (DC corresponding to the capaci-tance of a single vesicle) the release of one vesicle was assumed. Thesesingle release events were assigned to locations along the perimeter of thecell by a random number generator with the appropriate probability distri-bution. The respective model curves were added with the appropriate timedelay to create a simulated trace. (B) One possible example of a simulatedsweep of amperometric current,Iamp, that was generated from the increasein membrane capacitance,Cm, displayed inA.
Haller et al. Amperometry versus Capacitance Measurement 2103

fluctuations in that record are compatible with the assumption regardingthe secretory quantum.
Let us assume for the moment that our amperometric signalG(t) is theresult of a stationary random process, which generates linearly superim-posed uniform elementary signalsg(t) at mean raten. Then Campbell’stheorem (Rice, 1954) states that the variances2
G is
sG2 5 n E
0
T
g2~t!dt
and the meanG# is
G# 5 n E0
T
g~t!dt
if the duration of the elementary signalg(t) is short relative to the obser-vation intervalT. If Q(t) is the linear superposition ofk classes of suchsignals gi(t), each occurring with frequencyni 5 nni, where ni is therelative frequency of occurrence of an event of classi, and if the differentclasses are statistically independent, we have
sQ2 5 O
i51
k
sGi
2 5 n Oi51
k
ni E0
T
gi2~t!dt
and
Q# 5 Oi51
k
G# i 5 n Oi51
k
ni E0
T
gi~t!dt
Thus the ratio
sQ2
Q#5
(i51k ni *0
T gi2~t!dt
(i51k ni *0
T gi~t!dt
is independent of the overall frequencyn of events. In the case consideredhere, the different classes of elementary eventsgi(t) represent secretoryevents from different locations along the perimeter. Thus the functionsgi(t)scale with the secretory quantum, and because the square of this scalarenters all terms insQ
2 , whereas it enters linearly in all terms ofQ# , the ratios2
Q/Q# is also proportional to the vesicle contents.We extend this result qualitatively to the nonstationary case by consid-
ering the expectation value of the power spectral densityS#( f ) of anensemble of signals, as given by Rice (1954):
S#~ f ! 5 2N#
Tu g~ f !u2~1 1 N# u p~ f !u2!.
Hereg( f ) is the Fourier transform of the elementary signal (assumed to beuniform for simplicity), andp( f ) is the Fourier transform of a probabilityfunction p(t), which, together withN# , is defined such thatN# p(t)dt is themean number of occurrences of an elementary signal in the time intervaltto t 1 dt. It is seen thatS#( f ) is the sum of two terms, one proportional toN# ug( f )u2, and a second one that depends in a complicated manner on theproduct of two power spectra. It is also seen thatS( f ) is likely to bedominated at high frequencies by the first term, becauseup( f )u2 will besmall at large frequencies, whenever secretion extends over a sizablefraction of the analysis time window. The ratio ofS#( f ) and the meanamperometric signalQ# is then expected to be independent of the number ofelementary signals and to scale with the size of the elementary events. Weverified this expectation by performing simulations for a wide variety ofsecretion time courses and calculating spectral densitiesS#( f ). It turned outthat for an appropriately selected spectral windowDf (80–300 Hz for flash
photolysis experiments, 50–300 Hz for depolarization experiments), theratio S#(Df)/Q# was, indeed, independent of the exact form of the secretorytime course. As expected, it changed linearly with the number of moleculesreleased per event. We then used this quantity to test whether, for a givencapacitance time course, model time courses and amperometric recordsresulted in similar estimates ofS#(Df)/Q# . For better accuracy, we usuallymade four simulations for each experiment and calculated the mean valueof S#(Df )/Q.
FIGURE 4 Example of a secretory response to a first flash. At time 0[Ca21]i was elevated to;15 mM by flash-induced Ca21 liberation fromDM-nitrophen. (A) Membrane capacitance increased with a double expo-nential time course. The amplitude of the fast component was;100 fF, andthe total capacitance increase in the first 400 ms after the flash was 390 fF.(B) The simultaneously recorded amperometric current shows only a fewspikes on top of a wave-like current. (C–E) Three simulations of ampero-metric currents from the same capacitance record shown inA. Because ofthe random nature of release, the time courses of the simulated ampero-metric currents differ from simulation to simulation.
2104 Biophysical Journal Volume 74 April 1998
RESULTS
We elicited secretory responses in bovine adrenal chromaf-fin cells, both by photolysis of caged Ca21 and by depolar-izing pulses. In the former case we aimed at [Ca21]i levelsafter flashes in the range 10–50mM. In the latter case wedepolarized to110 mV for 50 ms and 100 ms to inducemaximum Ca21 influx. The flash experiments were per-formed in the absence and in the presence of ATP in theintracellular (pipette filling) solution. However, as none ofour results were significantly influenced by the absence ofATP, we combine both sets of data for some of our analysis.Fig. 4 shows an example of a flash experiment in thepresence of internal ATP. The flash, which was the first onein this experiment, elicited a step-like increase in [Ca21]i toa level of;15 mM. Capacitance (Fig. 4A) increased froma pre-flash value of 6.16 pF to 6.55 pF with a half-time of50 ms. The amperometric recording (Fig. 4B) shows a fewspikes of variable amplitude on top of a smooth wave-likecurrent trace. Fig. 4,C–E, shows three simulations for oneand the same capacitance trace (from Fig. 4A). As detailedabove, the simulations assume that each 2.5-fF increase incapacitance elicits a secretory event somewhere on theperiphery of the cell, that secreted molecules diffuse ran-domly and, with some time delay (depending on the dis-tance to the amperometric electrode), may hit the electrodeto contribute to the amperometric current. Molecules orig-
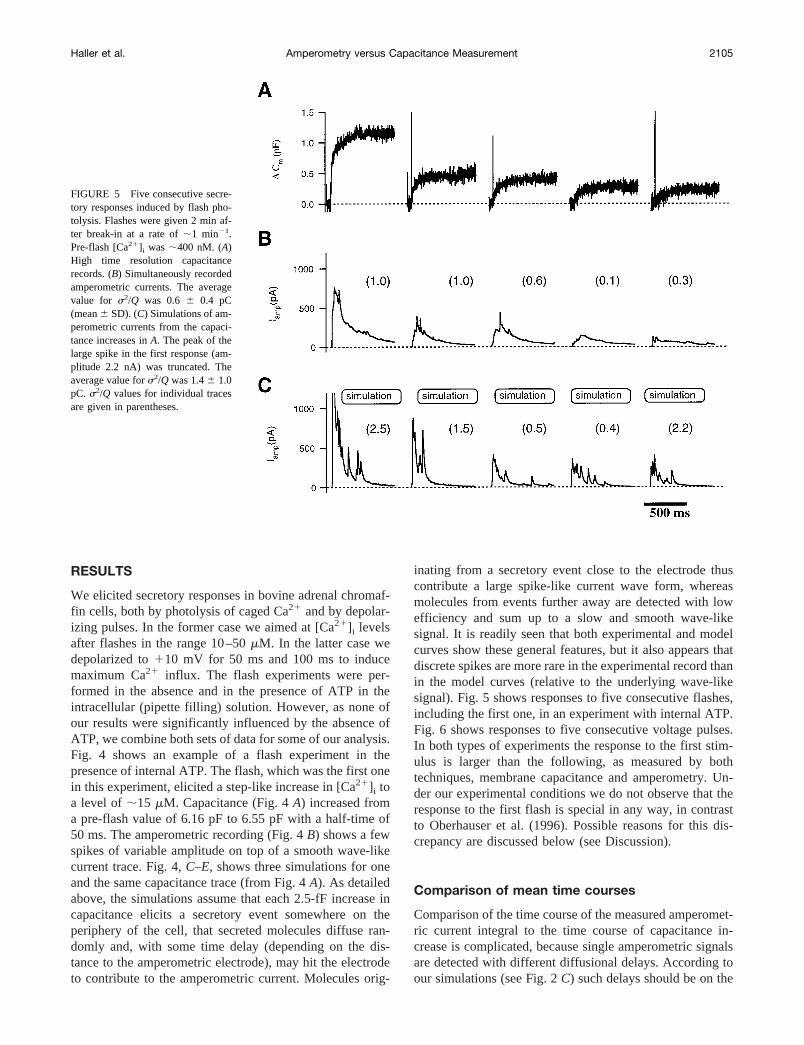
inating from a secretory event close to the electrode thuscontribute a large spike-like current wave form, whereasmolecules from events further away are detected with lowefficiency and sum up to a slow and smooth wave-likesignal. It is readily seen that both experimental and modelcurves show these general features, but it also appears thatdiscrete spikes are more rare in the experimental record thanin the model curves (relative to the underlying wave-likesignal). Fig. 5 shows responses to five consecutive flashes,including the first one, in an experiment with internal ATP.Fig. 6 shows responses to five consecutive voltage pulses.In both types of experiments the response to the first stim-ulus is larger than the following, as measured by bothtechniques, membrane capacitance and amperometry. Un-der our experimental conditions we do not observe that theresponse to the first flash is special in any way, in contrastto Oberhauser et al. (1996). Possible reasons for this dis-crepancy are discussed below (see Discussion).
Comparison of mean time courses
Comparison of the time course of the measured amperomet-ric current integral to the time course of capacitance in-crease is complicated, because single amperometric signalsare detected with different diffusional delays. According toour simulations (see Fig. 2C) such delays should be on the
FIGURE 5 Five consecutive secre-tory responses induced by flash pho-tolysis. Flashes were given 2 min af-ter break-in at a rate of;1 min21.Pre-flash [Ca21]i was;400 nM. (A)High time resolution capacitancerecords. (B) Simultaneously recordedamperometric currents. The averagevalue for s2/Q was 0.6 6 0.4 pC(mean6 SD). (C) Simulations of am-perometric currents from the capaci-tance increases inA. The peak of thelarge spike in the first response (am-plitude 2.2 nA) was truncated. Theaverage value fors2/Q was 1.46 1.0pC. s2/Q values for individual tracesare given in parentheses.
Haller et al. Amperometry versus Capacitance Measurement 2105

order of 175 ms. To account for the diffusional delays, wegenerated for each capacitance record a model amperomet-ric signal and compared the integral of the predicted am-perometric current with the integral of the measured am-perometric current. To reduce the random fluctuations weformed averages after subdividing the data into threeclasses, according to the rise time of the capacitance re-sponse (see Methods section for detail). The three classesrepresent flash experiments with postflash [Ca21]i levels of;10 mM, 25 mM, and 50 mM, according to the data ofHeinemann et al. (1994).
Fig. 7, A–C, shows the comparison of capacitance timecourses, model amperometric integrals, and measured am-perometric integrals after the first flash in experiments ofclasses 1, 2, and 3, respectively. Responses in each classwere averaged and then normalized to the respective value600 ms after the flash. The mean delay between the simu-lated and the measured amperometric integrals at the 50%level was 132.7 ms, 116.0 ms, and 71.5 ms for the flash dataat low, medium, and high [Ca21]i, respectively. It was 105.8ms for the depolarization experiments. However, interpre-tation of these delays is difficult because the capacitancetime course is confounded by endocytosis (Smith and Ne-her, 1997). An indication for overlapping endocytosis is thedifference in the slope of the late part of the modeled andmeasured amperometric integral. This is particularly con-
spicuous in the case of the depolarization experiment (Fig.7 D), where both the capacitance and the model curve reacha plateau after;200 ms. In contrast, the amperometricintegral continues to rise, revealing ongoing exocytosis,which is probably obscured in the capacitance measurementby simultaneously occurring endocytosis.
To correct the capacitance trace for endocytosis, we as-sumed that endocytosis developed after a stimulus with atime constant in the range of seconds: (DCm, corr(t) 5DCm(t)/exp(2t/tendo)). In depolarization experiments, pro-longed exocytosis was allowed by assuming a double-ex-ponential decay of the secretion rate after the pulse (seeMethods). The time constants were adjusted so that theslopes of measured and simulated amperometric integralsmatched in the late part of the records (Fig. 7,E–H). Aftercorrection, the delays between the simulated and the mea-sured amperometric integrals were reduced to 59.1 ms, 53.2ms, and 33.0 ms for flash experiments and to 62.2 ms fordepolarization experiments. Approximately 10 ms of thedelays in both types of experiments can be explained, be-cause the simulation does not take into account the latencybetween early fusion pore formation (the time whenCm
increase can be detected) and the detection of the oxidizablematerial (onset of the “foot”). This delay is called the“pre-foot” latency and was estimated for chromaffin cells to
FIGURE 6 Five consecutive secre-tory responses induced by step depo-larizations. Every 30 s the cell mem-brane was depolarized for 100 msfrom a holding potential of270 mVto 110 mV. (A) High time resolutioncapacitance records. The gaps in therecords indicate the 100-ms depolar-izations at which the capacitancemeasurement is not valid. The re-sponse to the first depolarization islarger than the following ones. (B)Simultaneously recorded amperomet-ric currents. The average value fors2/Q was 3.96 3.3 pC (mean6 SD).(C) Simulations of amperometric cur-rents from the capacitance records inA. For the method of reconstructionof the capacitance trace during thedepolarization, see Simulations. Theaverage value fors2/Q was 1.26 0.9pC. s2/Q values for individual traceare given in parantheses.
2106 Biophysical Journal Volume 74 April 1998

be, on average, 2.3 ms (Chow et al., 1996). In addition, themodel does not account for the “foot,” which has an averageduration of 8.3 ms (Chow et al., 1992). Yet the measureddelay is significantly larger than the sum of the two delaysmentioned above.
Similar differences between simulated and experimentaltime courses are observed in experiments without Mg-ATPin the pipette filling.
An alternative method of analyzing mean time courseswould be to convolve the derivative of the capacitancecurve with the “impulse function” of the amperometricelectrode (Fig. 2C) to obtain an estimate for the expectedmean amperometric signal. It is expected that the convolu-tion is shifted by;175 ms (the mean delay; see Methods)with respect to the capacitance derivative. Shifts of the sameorder of magnitude can be observed in Fig. 7, where theintegrals of the respective curves are displayed.
Properties of amperometric spikes
Discrete amperometric spikes with amplitudes higher than 3pA were analyzed for both flash and depolarization exper-iments. Because of the large number of vesicles released,amperometric spikes are quite often superseded by otherspikes before or after a given one. In these cases the am-perometric spikes were “artificially” completed by fittingthe last third of the trailing edge with a linear fit. For eachspike the width at half-height, peak amplitude, and chargereleased were determined. A comparison of histograms ofthese parameters (Fig. 8, rows 1 and 2) indicates a similarityin the shapes of spikes in flash and pulse experiments. Thusthere is no indication of the existence of different sizedvesicles or different time courses of vesicular release be-tween flash and pulse experiments. Wightman et al. (1995),using transient applications of 60 mM KCl as a secretion
FIGURE 7 Comparison of class averages.Shown are the time courses of membrane capac-itance (noisy trace), the integral of the simulatedamperometric currents (broken lines), and the in-tegral of the measured amperometric currents(lines). All curves in a given panel are scaled tocoincide at 600 ms for ease of comparison. Theaverage rate constants (r) of the capacitance sig-nals, the number (n) of averaged traces, and thedelay between the simulated and measured inte-grals of the amperometric current at the 50% level(Dt50) are given in the figures. Left column (A–D):Comparison of time courses without correction forendocytosis. Right column (E–H): Comparison oftime courses after correction for endocytotic pro-cesses. The capacitance trace was corrected ac-cording to the equationDCm,corr(t) 5 DCm(t)/exp(2t/tendo), wheretendo5 1.5 s for class 1 and2.0 s for classes 2 and 3. The depolarization ex-periments (H) were corrected for endocytosis, us-ing tendo5 1.5 s and assuming a double-exponen-tially decaying latency histogram (t1 5 18 ms,85% amplitude andt2 5 1.5 s, 15% amplitude) forreconstruction of the capacitance time course.
Haller et al. Amperometry versus Capacitance Measurement 2107

stimulus, observed at a distance of 1mm from the cellvalues very similar to those found in this study. Theircharge, half-width, and peak amplitude distributionsshowed the following medians: 0.47 pC, 7.4 ms, and 27 pA.Similarly generated histograms for simulated amperometrictraces (Fig. 8, row 3) provide a double check for the correctscaling of the templates (see Simulations). We conclude thatthose amperometric events, which can be recognized assuch, have normal properties. It should be noted that theamplitude criterion used as the detection threshold for thisanalysis, includes quite a number of events at some distancefrom the electrode, such that the mean charge (0.51 pC) isonly 26.6% of that contributed by a nearby vesicle, asjudged from the simulations.
Timing of amperometric spikes following flashes
We asked whether the timing of discernible amperometricspikes is compatible with capacitance records and the as-sumption of an exponentially decaying release rate. For thisanalysis we selected capacitance increases with rate con-stants faster than 30 s21 following flash-induced elevationof [Ca21]i. For each of these experiments, the point in time(t2/3) was determined to be where the capacitance crosses67% of its value at 100 ms after the flash (see Fig. 9). In thisset of experimentst2/3 was, on average, 31.06 13.9 ms(mean6 SD, n 5 24). If the timing of the amperometricspikes following the flash is compatible with the capaci-tance increase, 67% of the spikes should begin beforet2/3.Because of overlap of many amperometric events, it isdifficult to determine the onset of the “foot signal” of the
first amperometric event. We therefore measured the begin-ning of an amperometric event at the onset of the fast risingphase of the spike (ton). In 24 experiments we identified atotal of 94 single amperometric events in the first 100 msafter the flash. The onset of only 39% of the events wasbefore t2/3. This seems to be incompatible with the timecourse of capacitance rise. However, the onset of the fastrise of the amperometric spike is delayed with respect to thecapacitance increase by the foot duration (Chow et al.,
FIGURE 8 Comparison of histo-grams for the charge, half-width, andpeak amplitude (columns A–C) fromdepolarizations, flash experiments, andsimulations (rows 1–3). A total numberof 311, 204, and 284 spikes were ana-lyzed from 120 depolarizations (fivecells), 43 flashes (eight cells), and 20simulations (six cells), respectively.The binwidths of the histograms were0.1 pC, 1 ms, and 3 pA for charge,half-width, and peak amplitude, respec-tively. The median values are given inthe histograms.
FIGURE 9 Timing of amperometric spikes after flash-induced [Ca21]i
elevation. Shown are a capacitance trace with a double-exponential fit(t1 5 16 ms,t2 5 102 ms) superimposed and a simultaneously recordedamperometric current after a first flash that elevated [Ca21]i to ;30 mM.The first 100 ms after the flash were divided into two time windows (tw_1and tw_2). The end of the first time window is att2/3 (24 ms), the time atwhich Cm reaches its 66.7% level with respect to its value at 100 ms.Arrows indicate the onset of individual amperometric spikes.
2108 Biophysical Journal Volume 74 April 1998

1992; Zhou et al., 1996) and a “pre-foot” delay (Chow et al.,1996). To account for the known delays, we substracted10.6 ms (8.3 ms for the mean foot duration, 2.3 ms for themean pre-foot delay) fromton of all events occurring in thefirst 110.6 ms after the flash. After this correction, 59% ofthe spikes begin beforet2/3. This is quite close to theexpected value from the capacitance increase. The alterna-tive assumption of a constant release rate during the first100 ms would predict only 31% of the events occurringbefore t2/3. Our data, therefore, are compatible with theassumption that the early fast rising phase of the capacitance
increase after flash photolysis of DM-nitrophen in bovinechromaffin cells reflects the fusion of large granules con-taining oxidizable substances.
Charge versus capacitance
Fig. 10 provides a summary of the magnitude of ampero-metric responses as a function of the magnitude of thecapacitance response. Only experiments with an increase incapacitance larger than 30 fF within 800 ms after flashes ordepolarizations were included. Fig. 10A plots the ampero-metric current integral evaluated over 800 ms after flashesagainst the rise in capacitance over the same period. Exper-iments with and without ATP are represented by differentsymbols. As no significant differences between both sets ofexperiments are observed, the combined set of data points isfitted with a linear regression, with the restriction of passingthrough the origin. The fit shown in Fig. 10A has a slope of0.141 pC/fF. We want to emphasize that this value dependsstrongly on the fraction of secreted molecules that aredetected and does not reflect a scale factor for the chargepackage of a single vesicle. As detailed in the section onsimulation, the templates for the simulation were scaled inamplitude, such that this slope was well reproduced in thesimulations. This is shown in Fig. 10B, where the trianglesrepresent the mean of four simulations of some of theexperiments. The linear fit of the simulations (dashed line)exhibits a slope of 0.152 pC/fF, which is in good agreementwith the slope of the linear regression of Fig. 10A (line).The scale factor required for this agreement results in acharge contribution of 1.92 pC for vesicles located at posi-tion n 5 0 of Fig. 1. In Fig. 10C depolarization experimentsare plotted together with a linear fit of slope 0.125 pC/fF(dashed line). It is seen that these values follow the sametrend as the flash experiments (the linear regression of Fig.10 A is repeated in Fig. 10C for comparison). The data,therefore, do not support the proposal that flash and depo-larizations elicit different secretory processes. Close inspec-tion of Fig. 10 shows that the experiments scatter apprecia-bly more than simulations. This can be explained in part bythe fact that the simulated values are given by the average offour measurements, whereas experimental values are basedon one sweep each. However, it may also indicate aninhomogeneous distribution of release sites (Robinson et al.,1995).
Variance versus mean analysis ofamperometric records
In the section on simulation, a method was introduced thatprovides information about the size of the quantum ofrelease. This method, in which the ratio of variance to meanis formed, is quite similar to that of estimating single-channel currents from fluctuating current records (Neherand Stevens, 1977). It must be considered approximatebecause of a large number of assumptions. However, if both
FIGURE 10 Amperometric current integral versus capacitance increase.The amperometric current integral of the first 800 ms after a flash is plottedversus the total increase in capacitance during the same period on alogarithmic scale. (A) Experiments with Mg-ATP (E) and without Mg-ATP (F) are in good agreement. A linear fit to both sets of data (——)exhibited a slope of 0.141 pC/fF. (B) The linear fit from above (——) wasreproduced by the values for simulated amperometric sweeps after flashes(‚). The linear fit of the simulated values (– – –) had a slope of 0.152. (C)The linear fit from A (——) is also closely followed by depolarizationexperiments (M) with the linear regression (– – –), yielding a slope of0.125 pC/fF. All fits are made by linear regression with the restriction ofpassing through the origin.
Haller et al. Amperometry versus Capacitance Measurement 2109

data and simulations of a given experiment are subjected tothe same analysis, comparison of the two results provides anindication of whether the amperometric record is composedof elementary events of the same size as that assumed forthe simulations. The validity of this method was tested bysubjecting two sets of simulated traces to the analysis—onebased on the release of large dense core vesicles with acapacitance of 2.5 fF, the other one assuming vesicles thatwere a 100 times smaller, with respect to both surface areaand charge released. As detailed in the section on simula-tion, the estimate ofs2/Q would be predicted to be propor-tional to vesicular contents and, indeed, the value ofs2/Qfor large dense core vesicles was found to be;100 timeslarger than in the case of the assumption of smaller vesicles.
Results fors2/Q estimates for flash and depolarizationexperiments as well as for simulations (assuming largedense core vesicles) based on raw data and based on datathat were corrected for endocytotic processes are shown inTable 2. Both median values and mean values6 standarddeviation are listed. Individual experimental estimates fors2/Q differ widely. Therefore, mean values show very largestandard deviations, because of a few traces in which onlya very few large events were detected. These led to meanestimates that were up to two orders of magnitude largerthan the estimates from the predominant records. Thus acomparison of the median values is more appropriate.
Median values were found to be 0.31 and 0.18 for depo-larization and flash experiments, respectively. For simulatedtraces median values were all in the range of 0.85–0.92 andwere very similar when raw capacitance data or endocyto-sis-corrected capacitance data were compared. Thus themedian values ofs2/Q for experimental data are, on aver-age, a factor of 3–5 smaller than the simulation estimates ofs2/Q for both types of experimental records. The differencesbetween experiments and simulations corroborate the overallimpression that amperometric spikes are too sparse relative tothe smooth wave-like signal. The result is not specific forflash experiments, but also holds for depolarizations.
DISCUSSION
When a secretory cell is triggered to release a large numberof granules in a short time interval, such as by flash pho-tolysis of caged Ca21 or by voltage clamp depolarizations,a rapid increase in membrane capacitance can be observeddue to the incorporation of vesicular membrane into theplasma membrane. At the same time a carbon fiber elec-trode typically records a relatively small number of ampero-
metric spikes (reflecting single-vesicle transmitter release ata close distance) on top of a slower wave-like signal (re-flecting the diffusionally delayed events from remote cel-lular regions). Whether both methods detect exactly thesame cellular processes has been questioned (Chow et al.,1992; von Ru¨den und Neher, 1993; Oberhauser et al., 1995,1996). Unfortunately, a quantitative answer is not readilyobtainable, because of the complicated relationship betweensecretion and amperometric detection, which dependsstrongly on the exact spatial arrangement and relative loca-tion of release sites and detecting surface.
We tested the hypothesis that each vesicle increments themembrane capacitance by a fixed amount and, at the sametime, contributes to the amperometric current. In modelcalculations the latter contribution was assumed to originatefrom randomly located secretory sites. We applied twotypes of tests.
First, we analyzed the timing and properties of thoseamperometric spikes following flash photolysis, whichcould readily be resolved on top of the wave-like signal inexperimental records. We found that the time of occurrenceof these signals was compatible with the time course ofcapacitance change. We also found that the amplitude andhalf-time distributions of these events are very similar forboth types of measurements and agree closely with datareported by Wightman et al. (1995). Thus we conclude thatthose contributions that can be recognized as spikes con-form with the hypothesis. However, it need to be taken intoconsideration that comparison to values given in the litera-ture is not very stringent, because the estimate will stronglydepend on the criteria for selecting the events to analyze andthe diameter of the carbon fiber used. For instance, accord-ing to our simulations, an amplitude threshold criterion of 3pA will include amperometric spikes originating from re-lease sitesn 5 0. . . 4 (see Fig. 1), for which, on average,only 14.76% of the released molecules will be detected.Correspondingly, there is a quite wide range of values forcharge contributions of a single vesicle reported in theliterature (all using an amplitude threshold criterion and afiber with 10-mm diameter): 1 pC, Wightman et al. (1991);1.3 pC, Jankowski et al. (1992); 1.2 pC, Jankowski et al.(1994); 0.5 pC, Wightman et al. (1995); 0.9 pC, Finnegan etal. (1996). Our estimate of the mean charge (range 0.5–1.3pC) should be considered an underestimate for the chargecontent of a single vesicle, because the charge contributionof events from distant release sites is smaller due to diffu-sional loss. Another criterion, selecting for fast rise times ofthe spikes (, 3 ms; Chow et al., 1992), will include mainly
TABLE 2 Estimates of the size of a unitary amperometric event (s2/Q values)
Depolarization experiments median/(mean6 SD) Flash experiments median/(mean6 SD)
Experiments 0.31/(3.426 11.96) 319 sweeps from 14 cells 0.18/(3.096 10.89) 230 sweeps from 27 cellsSimulations (raw data) 0.92/(2.126 3.90) 108 sweeps from 9 cells 0.90/(1.126 0.97) 86 sweeps from 23 cellsSimulations (corrected data*) 0.86/(2.046 3.38) 88 sweeps from 9 cells 0.85/(0.886 0.64) 84 sweeps from 21 cells
*Capacitance records were corrected for endocytosis as described in the Methods section and the legend to Fig. 7. Both median values and means6 SDare listed.
2110 Biophysical Journal Volume 74 April 1998

events originating from release sites close to the detectorand should therefore give a more accurate estimate of thecharge contribution of a single vesicle.
Second, we addressed the question of whether the rela-tionship between the number of such spikes and the slower,wave-like signal is in agreement with our hypothesis andwhether the time course of the latter signal is compatiblewith diffusion of released substance. To this end, we ana-lyzed average time courses of amperometric signals aftergrouping all available experiments with similar capacitancetime courses, and compared the averages to the predictionsof a secretion-diffusion model. In experiments in whichsecretion was induced by flash photolysis of caged calcium,the average time course of amperometric signals is delayedby ;107 ms with respect to the simulated amperometricsignals derived from the capacitance increase. This delay isbeyond the delays that have been observed so far in caseswhere both the amperometric and the capacitance elemen-tary signals could be resolved (Alvarez de Toledo et al.,1993; Chow et al., 1996). However, the secretion stimulusalso triggers endocytosis, which contaminates the capaci-tance record, which is then used for the simulations. Theonset of endocytosis, especially at late times in the risingcapacitance record, will contribute to the apparent discrep-ancy between the integrated experimental and integratedsimulated amperometric traces. The amount of endocytosisin the caged Ca21 experiments is difficult to estimate. Wecorrected for the contribution of endocytosis, and this re-duced the apparent delay between the measured and simu-lated amperometric time courses to;50 ms. Even in thecase of depolarization experiments, in which the secretionstimulus is considered as the more physiological one, thedelay was of similar magnitude. However, it is possible thatwe have underestimated the amount of endocytosis, and thatmost if not all of the unexplained delay is due to thecomplication of endocytosis.
We have also applied a novel type of fluctuation analysisfor estimating the quantum size of an amperometric event.We established the validity of this method by using thesecretion-diffusion model. We have shown that the ratio ofsignal variance (calculated within an appropriate spectralrange) and mean charge provides a quantity that is propor-tional to the amount of oxidizable material in a granule. Theabsolute number of this estimate is of little use, because itdepends on geometry and on the bandwidth used in theanalysis. However, comparison of values from experimentswith those from a simulation of the same experiment can betaken as a test for the validity of the model assumptions,particularly with respect to the secretory quantum. Wefound that on average, experimental estimates are a factor;3–5 smaller than those of model calculations for a cate-cholamine secretory quantum that we consider reasonablefor chromaffin granules. These findings are similar whetherflashes or depolarizing pulses are used to stimulate the cells.Furthermore, variations in the time course of the capaci-tance templates did not affect the estimates for the secretoryquantum. Values based on the extended model (including
corrections for endocytosis) were in good agreement withthose based on the simple model (no corrections forendocytosis).
To further discuss the discrepancies mentioned above, afew explanations regarding the model are necessary. Thesecretion-diffusion model assumes uniform distribution ofrelease sites on the cell surface and a geometry as indicatedin Fig. 1. It neglects diffusional restrictions due to chamberwalls, patch pipette, etc. This may explain part of the delayin mean time course, particularly if more secretion occurredon those parts of the cell surface oriented toward the cham-ber bottom. Similarly, the delay would be explained ifsecretory probabilities were reduced in the vicinity of theamperometric electrode. “Hot spots” of release were re-ported by Robinson et al. (1995). They would explain theobserved discrepancy only if they were preferentially lo-cated remote from the amperometric electrode. However,the very large standard deviation of estimates for the secre-tory quantum size may be an indication of “hot spots.” Anypreponderance of remote signals at the same time wouldexplain the low estimate for its mean. A lower diffusioncoefficient in the model would, of course, reduce the dis-crepancy in the time course. For example, the matrix ma-terial from granules fusing directly beneath the disk face ofthe carbon fiber electrode could be trapped between the cellmembrane and carbon surface, resulting in a retardeddiffusion.
Other explanations for the discrepancies may be sought inthe heterogeneity of the cellular processes involved. Capac-itance increases may contain a component that is not relatedto the release of oxidizable material (Henkel and Almers,1996; Ninomiya et al., 1996). If this component were fasterthan that due to catecholamine release, it would explain partof the time delay. Against this idea, however, is the findingthat those amperometric events that can be resolved have atime course that is compatible with the fast capacitancesignal. Alternatively, the amperometric signal may containcomponents not conforming to the model assumption of fastrelease of large-size packages of catecholamines, such asrelease from a population of smaller granules (Kasai et al.,1996; Ninomiya et al., 1997), or slow release from normalgranules. Examples of the latter have been shown in theform of “foot-only” events (Zhou et al., 1996). If a sizablefraction of all release events were of such a nature, both theslow mean time course and the small mean amperometricquantum size could be explained. Additional populations ofvesicles would explain the low release quantum only if theyactually contributed to the release of oxidizable material. Anargument against heterogeneity in granules is the findingthat the relationship between overall amperometric chargeand total capacitance change (Fig. 10) seems to be compat-ible with published histograms of amperometric charge oftypical spikes (compatible in the sense that the model re-produces the experimental relationship, assuming 2.5 fF pergranule, with a reasonable amperometric charge per vesi-cle). If amperometric signals have a large component orig-inating from small vesicles, the concentration of oxidizable
Haller et al. Amperometry versus Capacitance Measurement 2111

material in these small vesicles would have to be muchlarger than that in normal granules, such that the relation-ship between amperometry and capacitance (reflecting thesurface to volume ratio of granules) is maintained. Ourmodel assumes uniform granule size, although the actualrange of chromaffin granule sizes may be quite spread out(SD 5 39%; Coupland, 1968). This might also be a reasonfor the large standard deviation of estimates for the secre-tory quantum size. We assume a unit capacitance step of 2.5fF, which is representative for unit events that have previ-ously been resolved by various techniques (Neher undMarty, 1982; Chow et al., 1996). However, the mean ofsuch step events may be smaller. The discrepancy regardingthe release quantum would certainly be diminished if liter-ature values for either amperometric charge or unit capac-itance contribution (2.5 fF) were biased toward being largerthan average.
In general, a comparison between estimates obtainedfrom experiments and simulations has to be considered withcaution, because of the above-mentioned uncertainties inmany of the parameters involved.
Initially we sought an explanation for discrepancies be-tween flash data and expectations in altered response char-acteristics of carbon fiber electrodes after UV flashes. How-ever, we discarded this probability because 1) no otherevidence for such alteration could be found, 2) the samediscrepancies (between experiments and model predictions)showed up in pulse experiments, and 3) resolvable ampero-metric spikes had normal properties.
We conclude that more data on many aspects of therelease and detection process are necessary to fully under-stand the relationship between the amperometric and thecapacitance signals. On the other hand, we see no reasonwhy resolvable amperometric spikes should not be relatedto capacitance signals, because their timing (not their abun-dance) seemed to be compatible with the kinetics of thecapacitance signal. Still, the scatter in the data does notallow one to rule out the possibility that a small portion ofthe capacitance signal may be due to other processes. Wedid not find, as reported by Oberhauser et al. (1996), thatamperometric first latency after a Ca21-releasing first flashwas as long as 0.5 s. It should be pointed out, though, thatwe took care to restrict [Ca21]i values both before and afterflashes to ranges that we consider most relevant for theinvestigation of secretory responses. By adjusting the com-position of the pipette solution, we ensured that pre-flash[Ca21]i after the loading transient (Neher and Zucker, 1993)was in the range of 300–500 nM. This range is favorable fora sizable exocytotic burst, given the Ca21-dependent prim-ing of a pool of readily releasable granules (Bittner andHolz, 1992; Neher and Zucker, 1993; Heinemann et al.,1993; von Ru¨den and Neher, 1993). It also matches thesomewhat elevated Ca21 levels of our previous studiesemploying repetitive stimulation with depolarizing voltagepulses at;0.1 Hz. We tried to achieve postflash [Ca21]i
levels in the range of 10–50mM, to elicit capacitanceincreases with rates comparable to those during depolariza-
tions and to avoid problems due to rapid endocytosis (Hei-nemann et al., 1994; Artalejo et al., 1995, Smith and Neher,1997). Oberhauser et al. (1996), in contrast, used internalsolutions that probably forced [Ca21]i before the flash tovery low values. This may have resulted in a very small,readily releasable pool and consequently a hardly detectablesynchonized release. Under such conditions, particularly atvery high postflash [Ca21]i, contributions to capacitanceother than those from exocytosis of dense core granules(Henkel and Almers, 1996; Ninomiya et al., 1996) maybecome dominant and the correspondence between capaci-tance and amperometry may be lost.
It is concluded that experimental conditions for capaci-tance experiments have to be carefully selected to make surethat the major part of the capacitance signal represents theprocess under study. Criteria for this selection are 1) the sizeof the readily releasable pool, which should be enhanced byproper priming of the cell, such as through elevated pre-stimulus [Ca21]i; and 2) the contribution of endocytosis—rapid endocytosis should be avoided by restricting intracel-lular [Ca21]i during stimulation to values lower than 50mM, and slower forms of endocytosis are handled best byconcentrating the analysis on rapid phases of exocytosis.
Within the framework of these experimental conditionsthen, it seems reasonable to conclude that both the majorcomponent of the capacitance signal and the major compo-nent of the amperometric signal reflect catecholamine re-lease from large dense core granules. There are nonresolveddiscrepancies in the average time course of the wave-likeportion of the amperometric signal, as well as in the relativeabundance of well-resolved amperometric spikes, whichmost likely reflect either heterogeneous location of secre-tory sites, heterogeneous granule size distribution, or anabundance of slow secretory (“foot-only”) events. The lattercontribution may hitherto not have been appreciated suffi-ciently, because such events are hard to distinguish fromdiffusionally attenuated ones.
We thank Frauke Friedlein and Michael Pilot for careful preparation ofchromaffin cells, Uwe Engeland for his advice on questions regardingCampbell’s theorem, and Ju¨rgen Klingauf for fruitful discussions through-out this project.
This work was supported in part by an EC grant (no. ERB-CHRXCT940500).
REFERENCES
Alvarez de Toledo, G., R. Fernandez-Chacon, and J. M. Fernandez. 1993.Release of secretory products during transient vesicle fusion.Nature.363:554–558.
Artalejo, C. R., J. R. Henley, M. A. McNiven, and H. C. Palfrey. 1995.Rapid endocytosis coupled to exocytosis in adrenal chromaffin cellsinvolves Ca21, GTP, and dynamin but not clathrin.Proc. Natl. Acad.Sci. USA.92:8328–8332.
Bittner, M. A., and R. W. Holz. 1992. Kinetic analysis of secretion frompermeabilized adrenal chromaffin cells reveals distinct components.J. Biol. Chem.267:16219–16225.
2112 Biophysical Journal Volume 74 April 1998

Chow, R. H., J. Klingauf, C. Heinemann, R. S. Zucker, and E. Neher. 1996.Mechanisms determining the time course of secretion in neuroendocrinecells.Neuron.16:369–376.
Chow, R. H., and L. von Ru¨den. 1995. Electrochemical detection ofsecretion from single cells.In Single-Channel Recording, 2nd Ed. B.Sakmann and E. Neher, editors. Plenum Press, New York. 245–275.
Chow, R. H., L. von Ru¨den, and E. Neher. 1992. Delay in vesicle fusionrevealed by electrochemical monitoring of single secretory events inadrenal chromaffin cells.Nature.356:60–63.
Coorssen, J. R., H. Schmitt, and W. Almers. 1996. Ca21-triggers massiveexocytosis in Chinese hamster ovary cells.EMBO J.15:3787–3791.
Coupland, R. E. 1968. Determining sizes and distributions of sizes ofspherical bodies such as chromaffin granules in tissue sections.Nature.217:384–388.
Finnegan, J. M., K. Pihel, P. S. Cahill, L. Huang, S. E. Zerby, A. G. Ewing,R. T. Kennedy, and M. R. Wightman. 1996. Vesicular quantal sizemeasured by amperometry at chromaffin, mast, pheochromocytoma, andpancreaticb-cells.J. Neurochem.66:1914–1923.
Gerhardt, G. A., and R. N. Adams. 1982. Determination of diffusioncoefficients by flow injection analysis.Anal. Chem.54:2618–2620.
Gillis, K. D. 1995. Techniques for membrane capacitance measurements.In Single-Channel Recording, 2nd Ed. B. Sakmann and E. Neher,editors. Plenum Press, New York. 155–198.
Heinemann, C., R. H. Chow, E. Neher, and R. S. Zucker. 1994. Kinetics ofthe secretory response in bovine chromaffin cells following flash pho-tolysis of caged Ca21. Biophys. J.67:2546–2557.
Heinemann, C., L. von Ru¨den, R. H. Chow, and E. Neher. 1993. Atwo-step model of secretion control in neuroendocrine cells.PflugersArch. 424:105–112.
Henkel, A. W., and W. Almers. 1996. Fast steps in exocytosis and endo-cytosis studied by capacitance measurements in endocrine cells.Curr.Opin. Neurobiol.6:350–357.
Horrigan, F. T., and R. J. Bookman. 1994. Releasable pools and thekinetics of exocytosis in adrenal chromaffin cells.Neuron. 13:1119–1129.
Jankowski, J. A., J. M. Finnegan, and R. M. Wightman. 1994. Extracellularionic composition alters kinetics of vesicular release of catecholaminesand quantal size during exocytosis at adrenal medullary cells.J. Neuro-chem.63:1739–1747.
Jankowski, J. A., T. J. Schroeder, E. L. Ciolkowski, and R. M. Wightman.1993. Temporal characteristics of quantal secretion of catecholaminesfrom adrenal medullary cells.J. Biol. Chem.268:14694–14700.
Jankowski, J. A., T. J. Schroeder, R. W. Holz, and R. M. Wightman. 1992.Quantal secretion of catecholamines measured from individual bovineadrenal medullary cells permeabilized with digitonin.J. Biol. Chem.267:18329–18335.
Kasai, H., H. Takagi, Y. Ninomiya, T. Kishimoto, K. Ito, A. Yoshida, T.Yoshioka, and Y. Miyashita. 1996. Two components of exocytosis andendocytosis in phaeochromocytoma cells studied using caged Ca21
compounds.J. Physiol. (Lond.).494:53–65.Leszczyszyn, D. J., J. A. Jankowski, O. H. Viveros, E. J. Diliberto, Jr., J. A.
Near, and R. M. Wightman. 1991. Secretion of catecholamines fromindividual adrenal medullary chromaffin cells.J. Neurochem.56:1855–1863.
Messler, P., H. Harz, and R. Uhl. 1996. Instrumentation for multiwave-lengths excitation imaging.J. Neurosci. Methods.69:137–147.
Neher, E., and A. Marty. 1982. Discrete changes of cell membrane capac-itance observed under conditions of enhanced secretion in bovine adre-nal chromaffin cells.Proc. Natl. Acad. Sci. USA.79:6712–6716.
Neher, E., and C. F. Stevens. 1977. Conductance fluctuations and ionicpores in membranes.Annu. Rev. Biophys. Bioeng.6:345–381.
Neher, E., and R. S. Zucker. 1993. Multiple calcium-dependent processesrelated to secretion in bovine chromaffin cells.Neuron.10:21–30.
Ninomiya, Y., T. Kishimoto, Y. Miyashita, and H. Kasai. 1996. Ca21-dependent exocytotic pathways in Chinese hamster ovary fibroblastsrevealed by a caged-Ca21 compound.J. Biol. Chem.271:17751–17754.
Ninomiya, Y., T. Kishimoto, T. Yamazawa, H. Ikeda, Y. Miyashati, and H.Kasai. 1997. Kinetic diversity in the fusion of exocytotic vesicles.EMBO J.16:929–934.
Oberhauser, A. F., I. M. Robinson, and J. M. Fernandez. 1995. Docaged-Ca21 compounds mimic the physiological stimulus for secretion?J. Physiol. (Paris).89:71–75.
Oberhauser, A. F., I. M. Robinson, and J. M. Fernandez. 1996. Simulta-neous capacitance and amperometric measurements of exocytosis: acomparison.Biophys. J.71:1131–1139.
Rice, S. O. 1954. Mathematical analysis of random noise.In SelectedPapers on Noise and Stochastic Processes. N. Wax, editor. Dover, NewYork.
Robinson, I. M., J. M. Finnegan, J. R. Monck, R. M. Wightman, and J. M.Fernandez. 1995. Colocalization of calcium entry and exocytotic releasesites in adrenal chromaffin cells.Proc. Natl. Acad. Sci. USA.92:2474–2478.
Schroeder, T. J., J. A. Jankowski, K. T. Kawagoe, R. M. Wightman, C.Lefrou, and C. Amatore. 1992. Analysis of diffusional broadening ofvesicular packets of catecholamines released from biological cells dur-ing exocytosis.Anal. Chem.64:3077–3083.
Smith, C., and E. Neher. 1997. Multiple forms of endocytosis in bovineadrenal chromaffin cells.J. Cell Biol. 139:885–894.
von Ruden, L., and E. Neher. 1993. A Ca-dependent early step in therelease of catecholamines from adrenal chromaffin cells.Science.262:1061–1065.
Wightman, R. M., J. A. Jankowski, R. T. Kennedy, K. T. Kawagoe, T. J.Schroeder, D. J. Leszczyszyn, J. A. Near, E. J. Diliberto, and O. H.Viveros. 1991. Temporally resolved catecholamine spikes correspond tosingle vesicle release from individual chromaffine cells.Proc. Natl.Acad. Sci. USA.88:10754–10758.
Wightman, R. M., T. J. Schroeder, J. M. Finnegan, E. L. Ciolkowski, andK. Pihel. 1995. Time course of release of catecholamines from individ-ual vesicles during exocytosis at adrenal medullary cells.Biophys. J.68:383–390.
Zhou, Z., S. Misler, and R. H. Chow. 1996. Rapid fluctuations in trans-mitter release from single vesicles in bovine adrenal chromaffin cells.Biophys. J.70:1543–1552.
Zhou, Z., and E. Neher. 1993. Mobile and immobile calcium buffers inbovine adrenal chromaffin cells.J. Physiol. (Lond.).469:245–273.
Haller et al. Amperometry versus Capacitance Measurement 2113