Comparison of product failure rate to the component soft error rates in a multi-core digital signal...
6
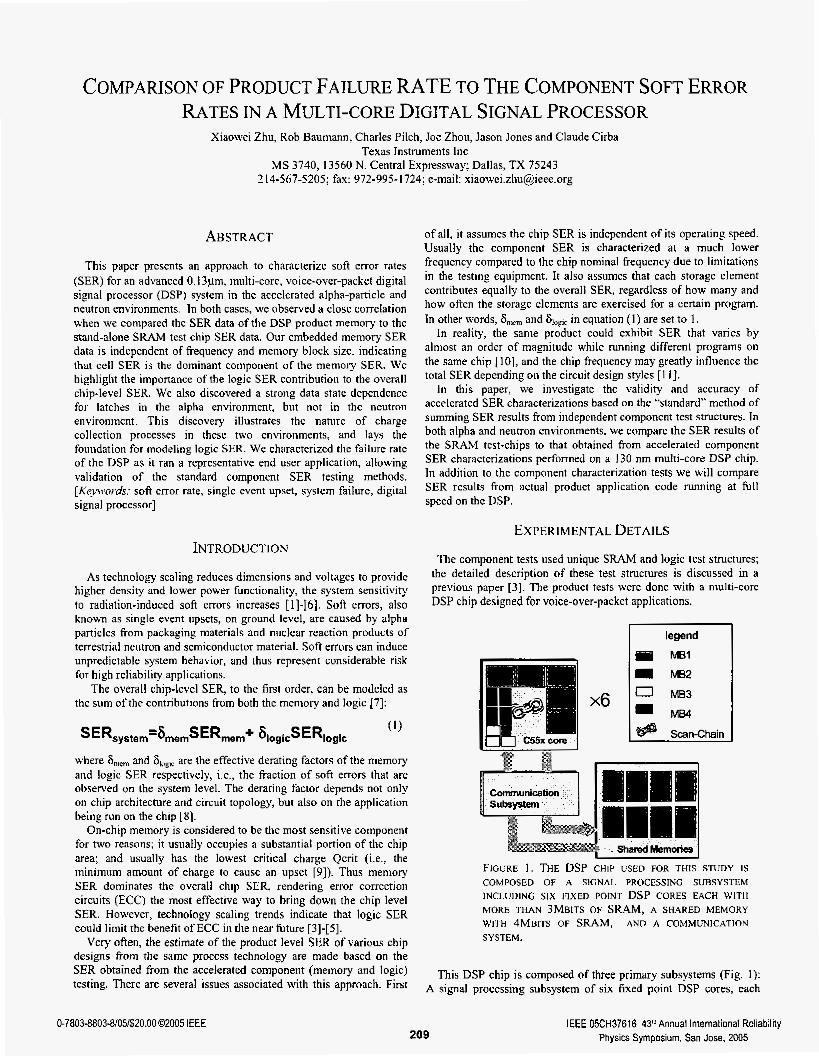
COMPARISON OF PRODUCT FAILURE RATE TO THE COMPONENT SOFT ERROR RATES IN A MULTI-CORE DIGITAL SIGNAL PROCESSOR Xiaowei Zhu, Rob Baumann, Charles Pilch, Joe Zhou, Jason Jones and Claude Cirba Texas Instruments Inc MS 3740, I3560 N. Central Expressway; Dallas, TX 75243 2 14-567-5205; fax: 972-995-1 724; e-mail: [email protected] A3STRACT This paper presents an approach to characterize soft error rates (SER) for an advanced 0. I3p, multi-core, voice-over-packet digital signal processor (DSP) system in the accelerated alpha-particle and neutron environments. In both cases, we observed a close correlation when we compared the SER data of the DSP product memory to the stand-alone SRAM test chip SER data. Our embedded memory SER data is independent of frequency and memory block size, indicating that cell SER is the dominant component of the memory SER. We highlight the importance of the logic SER contribution to the overall chip-level SER. We also discovered a strong data state dependence for latches in the alpha environment, but not in the neutron environment. This discovery illustntes the nature of charge collection processes in these two environments, and lays the foundation for modeling logic SER. We characterized the failure rate of the DSP as it ran a representative end user application, allowing validation of the standard component SER testing methods. [Key~~~rds; soft error rate, single event upset, system failure, digital signal processor] of all, it assumes the chip SER is independent of its operating speed. Usually the component SER is characterized at a much lower frequency compared to the chip nominal frequency due to limitations in the testing equipment. It also assumes that each storage element contributes equally to the overall SER, regardless of how many and how often the storage elements are exercised for a certain program. In other words, S,,,,., and ijIoeic in equation ( 1) are set to 1. In reality, the same product could exhibit SER that varies by almost an order of magnitude while running different programs on the same chip [lo], and the chip frequency may greatly influence the total SER depending on the circuit design styles [l I], In this paper, we investigate the validity and accuracy of accelerated SER characterizations based on the "standard" method of summing SER results from independent component test structures. In both alpha and neutron environments, we compare the SER results of the SRAM test-chips to that obtained from accelerated component SER characterizations performed on a 130 nm multi-core DSP chip. In addition to the component characterization tests we will compare SER results from actual product application code running at full speed on the DSP. EXPERIMENTAL DETA~LS INTRODUCTION As technology scaling reduces dimensions and voltages to provide higher density and lower power functionality, the system sensitivity to radiation-induced soft errors increases [ 1]-[6]. Soft errors, also known as single event upsets, on ground level, are caused by alpha particles from packaging materials and nuclear reaction products of terrestrial neutron and semiconductor material. Soft errors can induce unpredictable system behavior, and thus represent considerable risk for high reliability applications. The overall chip-level SER, to the first order, can be modeled as the sum of the contributions from both the memory and logic 171: where S, and 810g,c are the effective derating factors of the memory and logic SER respectively, i.e., the fraction of soft errors that are observed on the system level. The derating factor depends not only on chip architecture and circuit topology, but also on the application being run on the chip [SI. On-chip memory is considered to be the most sensitive component for two reasons; it usually occupies a substantial portion of the chip area; and usually has the lowest critical charge Qcrit (i.e., the minimum amount of charge to cause an upset [9]). Thus memory SER dominates the overall chip SER, rendering error correction circuits (ECC) the most effective way to bring down the chip level SER. However, technology scaling trends indicate that logic SER could limit the benefit of ECC in the near future [3]-[5]. Very often, the estimate of the product level SER of various chip designs from the same process technology are made based on the SER obtained from the accelerated component (memory and logic) testing. There are several issues associated with this approach. First The component tests used unique SRAM and logic test structures; the detailed description of these test stmcmres is discussed in a previous paper [3]. The product tests were done with a multi-core DSP chip designed for voice-over-packet applications. FIGURE 1. THE DsP CHIP USED FOR THIS STUDY IS COMPOSED OF A SIGNAL PROCESSING SUBSYSTEM INCLUDING SIX FIXED POINT DSP CORES EACH WITH MORE THAN 3MBITS OF S m , A SHARED MEMORY WITH 4MBlTS OF SUM, AND A COMMUNICATION SYSTEM. This DSP chip is composed of three primary subsystems (Fig. 1): A signal processing subsystem of six fixed point DSP cores, each 0-7803-8803-8/05/$20.00 @OD5 IEEE 209 IEEE 05CH37616 43d Annual Iniemational Reliability Physics Symposium, San Jose, 2005
-
Upload
independent -
Category
Documents
-
view
1 -
download
0
Transcript of Comparison of product failure rate to the component soft error rates in a multi-core digital signal...
COMPARISON OF PRODUCT FAILURE RATE TO THE COMPONENT SOFT ERROR RATES IN A MULTI-CORE DIGITAL SIGNAL PROCESSOR
Xiaowei Zhu, Rob Baumann, Charles Pilch, Joe Zhou, Jason Jones and Claude Cirba Texas Instruments Inc
MS 3740, I3560 N. Central Expressway; Dallas, TX 75243 2 14-567-5205; fax: 972-995-1 724; e-mail: [email protected]
A3STRACT
This paper presents an approach to characterize soft error rates (SER) for an advanced 0. I 3 p , multi-core, voice-over-packet digital signal processor (DSP) system in the accelerated alpha-particle and neutron environments. In both cases, we observed a close correlation when we compared the SER data of the DSP product memory to the stand-alone SRAM test chip SER data. Our embedded memory SER data is independent of frequency and memory block size, indicating that cell SER is the dominant component of the memory SER. We highlight the importance of the logic SER contribution to the overall chip-level SER. We also discovered a strong data state dependence for latches in the alpha environment, but not in the neutron environment. This discovery illustntes the nature of charge collection processes in these two environments, and lays the foundation for modeling logic SER. We characterized the failure rate of the DSP as it ran a representative end user application, allowing validation of the standard component SER testing methods. [ K e y ~ ~ ~ r d s ; soft error rate, single event upset, system failure, digital signal processor]
of all, it assumes the chip SER is independent of its operating speed. Usually the component SER is characterized at a much lower frequency compared to the chip nominal frequency due to limitations in the testing equipment. It also assumes that each storage element contributes equally to the overall SER, regardless of how many and how often the storage elements are exercised for a certain program. In other words, S,,,,., and ijIoeic in equation ( 1) are set to 1.
In reality, the same product could exhibit SER that varies by almost an order of magnitude while running different programs on the same chip [lo], and the chip frequency may greatly influence the total SER depending on the circuit design styles [l I],
In this paper, we investigate the validity and accuracy of accelerated SER characterizations based on the "standard" method of summing SER results from independent component test structures. In both alpha and neutron environments, we compare the SER results of the SRAM test-chips to that obtained from accelerated component SER characterizations performed on a 130 nm multi-core DSP chip. In addition to the component characterization tests we will compare SER results from actual product application code running at fu l l speed on the DSP.
EXPERIMENTAL DETA~LS INTRODUCTION
As technology scaling reduces dimensions and voltages to provide higher density and lower power functionality, the system sensitivity to radiation-induced soft errors increases [ 1]-[6]. Soft errors, also known as single event upsets, on ground level, are caused by alpha particles from packaging materials and nuclear reaction products of terrestrial neutron and semiconductor material. Soft errors can induce unpredictable system behavior, and thus represent considerable risk for high reliability applications.
The overall chip-level SER, to the first order, can be modeled as the sum of the contributions from both the memory and logic 171:
where S,,, and 810g,c are the effective derating factors of the memory and logic SER respectively, i.e., the fraction of soft errors that are observed on the system level. The derating factor depends not only on chip architecture and circuit topology, but also on the application being run on the chip [SI.
On-chip memory is considered to be the most sensitive component for two reasons; it usually occupies a substantial portion of the chip area; and usually has the lowest critical charge Qcrit (i.e., the minimum amount of charge to cause an upset [9]). Thus memory SER dominates the overall chip SER, rendering error correction circuits (ECC) the most effective way to bring down the chip level SER. However, technology scaling trends indicate that logic SER could limit the benefit of ECC in the near future [3]-[5].
Very often, the estimate of the product level SER o f various chip designs from the same process technology are made based on the SER obtained from the accelerated component (memory and logic) testing. There are several issues associated with this approach. First
The component tests used unique SRAM and logic test structures; the detailed description of these test stmcmres is discussed in a previous paper [3]. The product tests were done with a multi-core DSP chip designed for voice-over-packet applications.
FIGURE 1. THE DsP CHIP USED FOR THIS STUDY IS COMPOSED OF A SIGNAL PROCESSING SUBSYSTEM INCLUDING SIX FIXED POINT DSP CORES EACH WITH MORE THAN 3MBITS OF S m , A SHARED MEMORY WITH 4MBlTS OF S U M , AND A COMMUNICATION SYSTEM.
This DSP chip is composed of three primary subsystems (Fig. 1): A signal processing subsystem of six fixed point DSP cores, each
0-7803-8803-8/05/$20.00 @OD5 IEEE 209
IEEE 05CH37616 43d Annual Iniemational Reliability Physics Symposium, San Jose, 2005
Memory Type
(# of blocks)
Block Size Location
(Bits)
I M B I X 5 X 6 I 524288 I Core I I M B I X 8
MB2X4X6
MB3X3X6
MB4X2X6
t ~~~
524288 I Shared
Scan-chain latches 37 125 periphery I For the accelerated SER characterization of test chips and the
DSP device we used both alpha-particle sources (Am241 and Th232 foil) and a neutron facility, which provided a highly accelerated atmospheric neutron environment [ 121.
FIGURE 2. PHOTOGRAPH OF THE DSP EVALUATION BOARD AND MOTHERBOARD.
Both the SRAM test-chip and DSP device were fabricated with a CMOS 0.1 3 pm technolog. The SRAM test-chip was mounted on a probe card for a memory tester. The DSP chip was mounted on an evaluation board and controlled by a PC through a communication connector. A snapshot of the board is shown in Fig. 2. As with the stand-alone SRAM test chip, the SER of all major components in the DSP chip were tested individually with JESDX9 compliance [13]. Product application SER was only studied in the accelerated alpha- particle environment, as the code was not available when we were conducting the neutron characterization. The data was taken while the DSP chip ran application software at full speed that emulated communication between two modems.
RESULT AND DISCUSSION
A . Memovy Trend
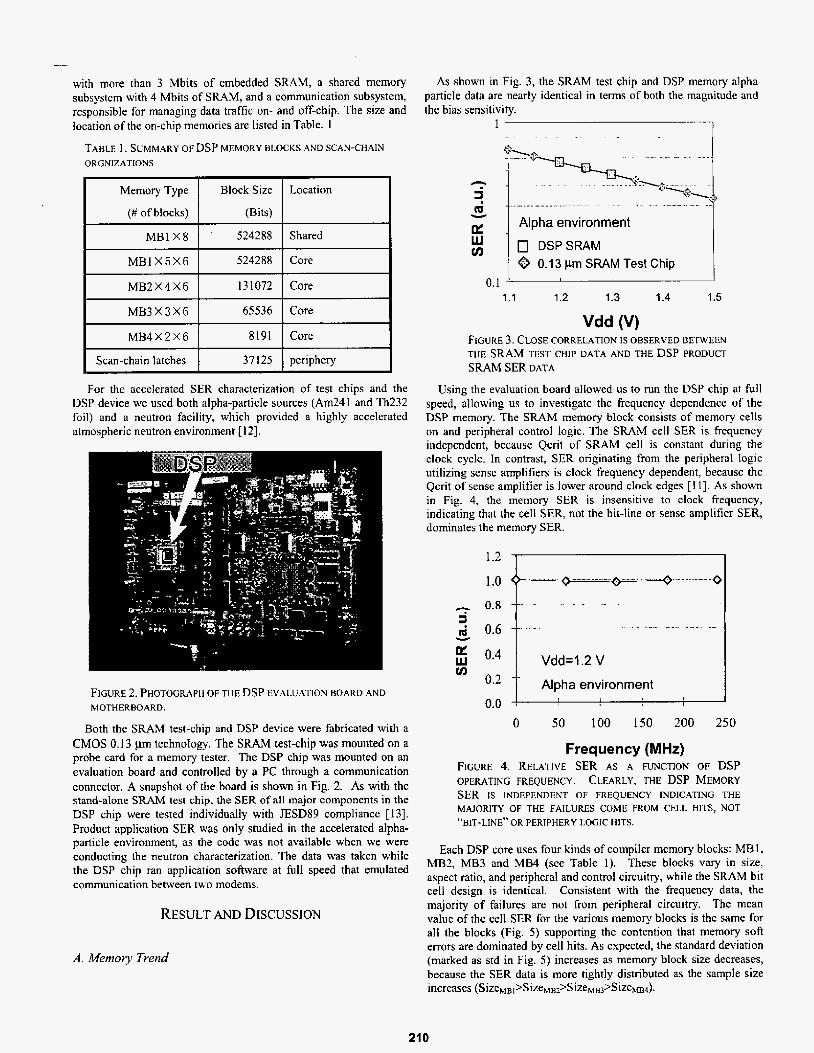
As shown in Fig. 3, the SRAM test chip and DSP memory alpha particle data are nearly identical in terms of both the magnitude and the bias sensitivity.
n
4 cer p1 W m
Y
Alpha environment
0 DSPSRAM 0 0.1 3 prn SRAM Test Chip
0.1 I 1 I
1.1 1.2 1.3 1.4 1.5
Vdd (V) FkGURE 3. CLOSE CORRELATION IS OBSERVED BETWEEN THE S U M TEST CHIP DATA AND THE DSP PRODUCT SRAM SER DATA
Using the evaluation board allowed us to run the DSP chip at full speed, allowing us to investigate the frequency dependence of the DSP memory. The SRAM memory block consists of memory cells on and peripheral control logic. The SRAM cell SER is frequency independent, because Qcrit o f SRAM cell is constant during the clock cycle. In contrast, SER originating from the peripheral logic utilizing sense amplifiers is clock frequency dependent, because the Qcrit of sense amplifier is lower around clock edges [ 1 I]. As shown in Fig, 4, the memory SER is insensitive to clock frequency, indicating that the cell SER, not the bit-line or sense amplifier SER, dominates the memory SER.
" " " . . . 2 0.6 + - v I
0.0 ! I I
0 SO 100 150 200 250
Frequency (MHz) FIGURE 4. RELATIVE SER AS A FUNCTION OF DSP OPERATING FREQUENCY. CLEARLY, THE DSP MEMORY SER IS INDEPENDENT OF FREQUENCY WDICATING THE MAJORITY OF THE FAILURES COME FROM CELL HITS, NOT
"BIT-LINE" OR PERIPHERY LOGIC HITS.
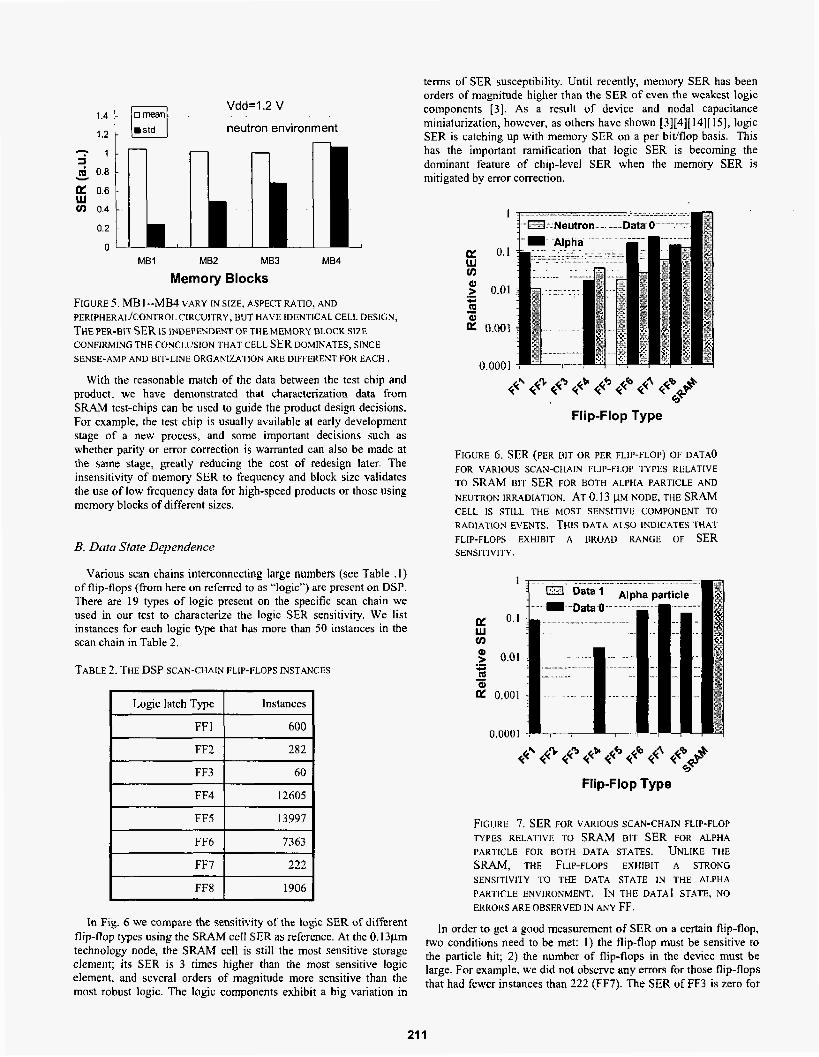
Each DSP core uses four kinds of compiler memory blocks: MB 1, MB2, MB3 and MB4 (see Table 1 ) . These blocks vary in size, aspect ratio, and peripheral and control circuitry, while the SRAM bit cell design is identical. Consistent with the frequency data, the majority of failures are not from peripheral circuitry. The mean value of the cell SER for the various memory blocks is the same for all the blocks (Fig. 5 ) supporting the contention that memory soft errors are dominated by cell hits. As expected, the standard deviation (marked as std in Fig. 5 ) increases as memory block size decreases, because the SER data is more tightly distributed as the sample size increases (SizeMB,>SizeMB2>SizeMB3>Size~~~).
210
MB 1
Logic latch Type
FF 1
Vdd=l.2 v neutron environment
Instances
600
MB2 MB3 MB4
FF6
FF7
Memory Blocks
FIGURE 5. MB I --MB4 VARY IN SIZE, ASPECT RATIO, AND
THE PER-BIT SER IS INDEPENDENT OF THE MEMORY BLOCK SlZE CONFIRMING THE CONCLUSION THAT CELL SER DOMINATES, SINCE SENSE-AMP AND BIT-LINE ORGANIZATION ARE DIFFERENT FOR EACH.
PERWHERA~CONTROL CIRCUITRY, BUT HAVE IDENTICAL CELL DESIGN,
With the reasonable match of the data between the test chip and product, we have demonstrated that characterization data from SRAM test-chips can be used to guide the product design decisions. For example, the test chip is usually available at early development stage of a new process, and some important decisions such as whether parity or error correction is warranted can also be made at the same stage, greatly reducing the cost of redesign later. The insensitivity of memory SER to frequency and block size validates the use of low frequency data for high-speed products or those using memory blocks of different sizes.
7363
222
B. Data State Dependence
Various scan chains interconnecting large numbers (see Table . I ) of flip-flops (from here on referred IO as “logic’’) are present on DSP. There are 19 types of logic present on the specific scan chain we used in our test to characterize the logic SER sensitivity. We list instances for each logic type that has more than 50 instances in the scan chain in Table 2.
FF8
TABLE 2. THE DSP SCAN-CHAIN FLIP-FLOPS INSTANCES
1906
I I
FF2 I 282 I FF3 I
I FF4 I 12605 I I I
I FF5 I 13997 I I I
In Fig, 6 we compare the sensitivity of the logic SER of different flip-flop types using the S U M cell SER as reference. At the 0.13pn-1 technology node, the SRAM cell is still the most sensitive storage element; its SER is 3 times higher than the most sensitive logic element, and several orders of magnitude more sensitive than the most robust logic. The logic components exhibit a big variation in
terms of SER susceptibility. Until recently, memory SER has been orders of magnitude higher than the SER of even the weakest logic components [3]. As a result of device and nodal capacitance miniaturization, however. as others have shown [3][4][ 14][ 151, logic SER is catching up with memory SER on a per bidflop basis. This has the important ramification that logic SER is becoming the dominant feature of chip-level SER when the memory SER is mitigated by error correction.
I
0. I B .- P 0.01
3 0.001
cn U m -
0 0001
Flip-Flop Type
FIGURE 6, SER (PER BIT OR PER FLIP-FLOP) OF DATA0 FOR VARIOUS SCAN-CHAIN FLIP-FLOP TYPES RELATIVE T O s k % M BIT SER FOR BOTH ALPHA PARTICLE AND NEUTRON IRRADIATION. AT 0.13 P M NODE, THE SRAM CELL IS STILL THE MOST SENSITIVE COMPONENT TO RADlATlON EVENTS. THIS DATA ALSO INDICATES THAT FLIP-FLOPS EXHIBIT A BROAD RANGE OF SER SENSITIVITY.
Flip-Flop Type
FIGURE 7. SER FOR VARIOUS SCAN-CHAIN FLIP-FLOP TYPES RELATIVE TO S U M B1T SER FOR ALPHA PARTfCLE FOR BOTH DATA STATES. UNLIKE THE S W M , THE FLIP-FLOPS EXHIBIT A STRONG SENSITIVITY TO THE DATA STATE IN THE ALPHA PARTICLE ENVIRONMENT. IN THE DATA] STATE, NO ERRORS ARE OBSERVED IN ANY FF.
In order to get a good measurement of SER on a certain flip-flop, two conditions need to be met: 1) the flip-flop must be sensitive to the particle hit; 2) the number of flip-flops in the device must be large. For example, we did not observe any errors for those flip-flops that had fewer instances than 222 (FF7). The SER of FF3 is zero for
21 1
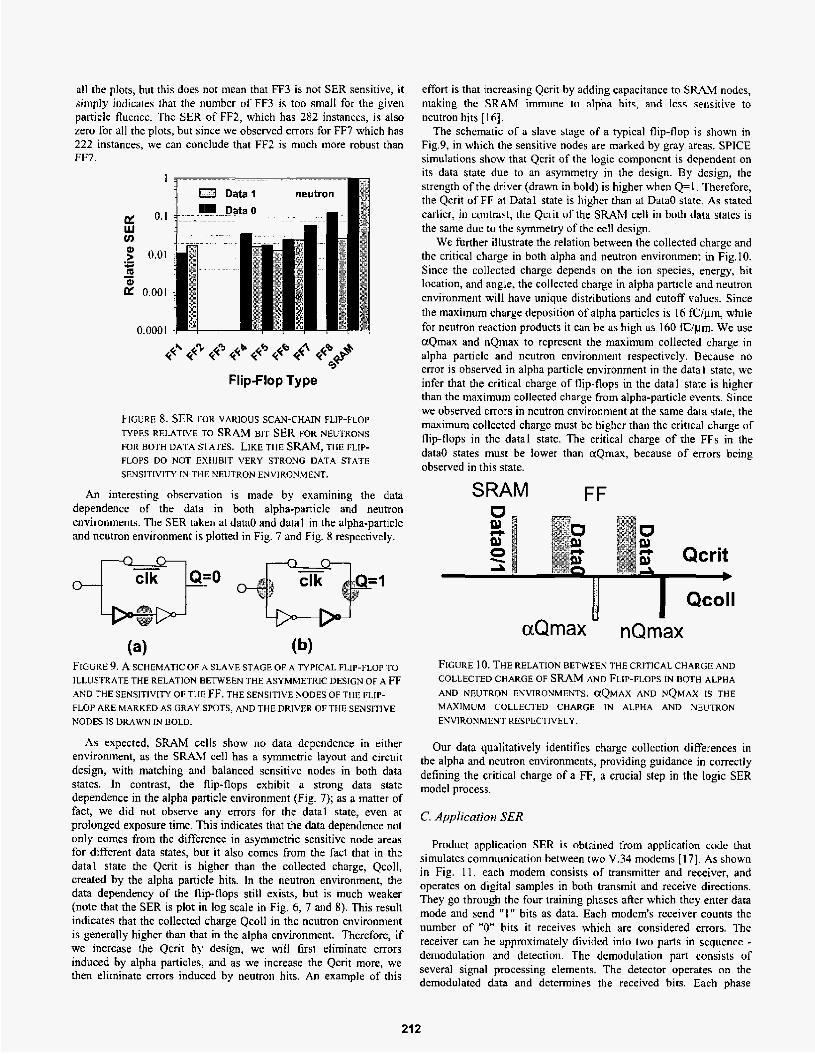
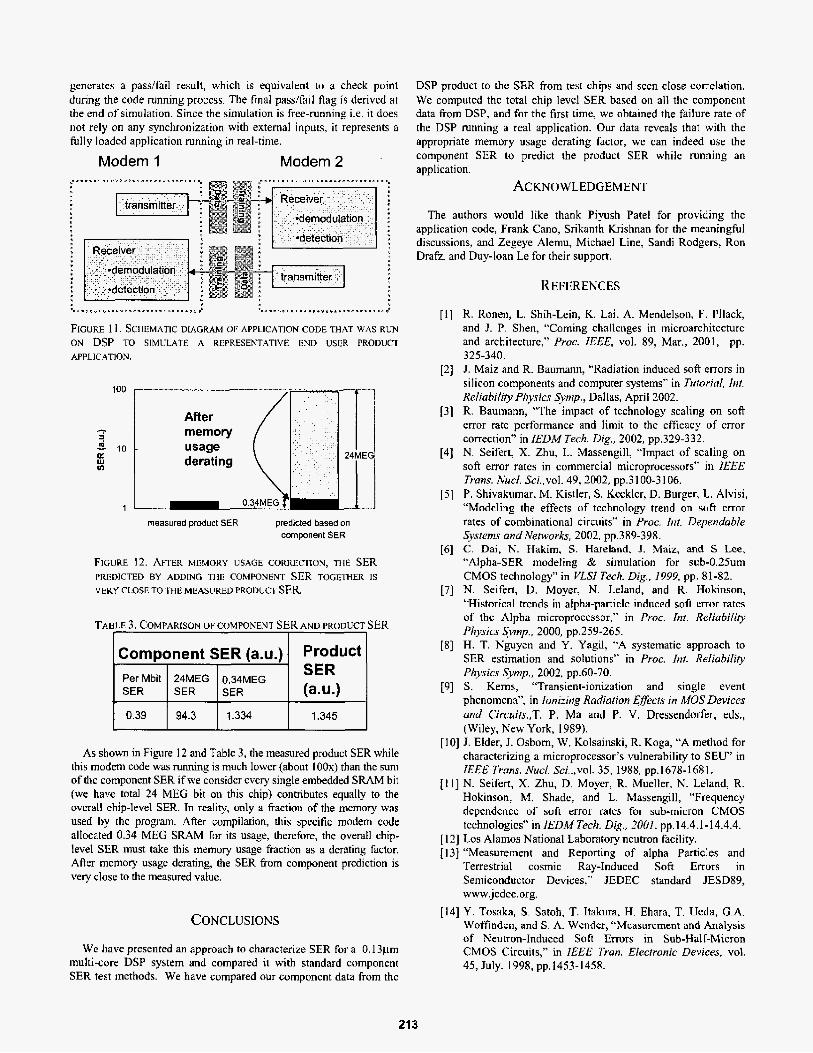
all the plots, but this does not mean that FF3 is not SER sensitive, it simply indicates that the number of FF3 is too small for the given particle fluence. The SER of FF2, which has 282 instances, is also zero for all the plots, but since we observed errors for FF7 which has 222 instances, we can conclude that FFZ is much more robust than FF7.
1
g 0.1
f 0.01
U v)
.- c m 0 - e 0.001
0.0001
Flip-Flop Type
FIGURE 8. SER FOR VARIOUS SCAN-CHAIN FLIP-FLOP TYPES RELATIVE TO S U M BIT SER FOR NEUTRONS FOR BOTH DATA STATES. LIKE THE S U M , THE FLIP- FLOPS DO NOT EXHIBIT VERY STRONG DATA STATE SENSITIVITY IN THE NEUTRON ENVIRONMENT.
An interesting observation is made by examining the data dependence of the data in both alpha-particle and neutron environments. The SER taken at data0 and datal in the alpha-particle and neutron environment is plotted in Fig. 7 and Fig. 8 respectively.
(4 (b) FIGURE 9. A SCHEMATIC OF .4 SLAVE STAGE OF A TYPICAL FLIP-FLOP TO ILLUSTRATE THE RELATION BETWEEN THE ASYMMETRIC DESIGN OF A FF AND THE SENSITIVITY OF THE FF. THE SENSITIVE NODES OF THE FLIP- FLOP ARE MARKED AS GRAY SPOTS, AND THE DRIVER OF THE SENSITIVE NODES IS DRAWN IN BOLD.
As expected, SRAM cells show no data dependence in either environment, as the SRAM cell has a symmetric layout and circuit design, with matching and balanced sensitive nodes in both data states. In contrast, the flip-flops exhibit a strong data state dependence in the alpha particle environment (Fig. 7); as a matter of fact, we did not observe any errors for the datal state, even at prolonged exposure time. This indicates that the data dependence not only comes from the difference in asymmetric sensitive node areas for different data states, but it also comes from the fact that in the datal state the Qcrit is higher than the collected charge, Qcoll, created by the alpha particle hits. In the neutron environment, the data dependency of the flip-flops still exists, but is much weaker (note that the SER is plot in log scale in Fig. 6, 7 and 8). This result indicates that the collected charge Qcoll in the neutron environment is generally higher than that in the alpha environment. Therefore, if we increase the Qcrit by design, we wifl first eliminate errors induced by alpha particles, and as we increase the Qcrit more, we then eliminate errors induced by neutron hits. An example of this
effort is that increasing Qcrit by adding capacitance to SRAM nodes, making the SRAM immune to alpha hits, and less sensitive to neutron hits [16j.
The schematic of a slave stage of a typical flip-flop is shown in Fig.9, in which the sensitive nodes are marked by gray areas. SPICE simulations show that Qcrit of the logic component is dependent on its data state due to an asymmetry in the design. By design, the strength of the driver (drawn in bold) is higher when Q=1, Therefore, the Qcrit of FF at Datal state is higher than at Data0 state. As stated earlier, in contrast, the Qcrit of the SRAM cell in both data states is the same due to the symmetry of the cell design.
We further illustrate the relation between the collected charge and the critical charge in both alpha and neutron environment in Fig.10. Since the collected charge depends on the ion species, energy, hit location, and angle, the collected charge in alpha particle and neutron environment will have unique distributions and cutoff values. Since the maximum charge deposition of alpha particles is 16 fC/pm, while for neutron reaction products it can be as high as 160 fClWm. We use aQmax and nQmax to represent the maximum collected charge in alpha particle and neutron environment respectively. Because no error is observed in alpha particle environment in the data I state, we infer that the critical charge of flip-flops in the datal state is higher than the maximum collected charge from alpha-particle events. Since we observed errors in neutron environment at the same data state, the maximum collected charge must be higher than the critical charge of flip-flops i n the datal state. The critical charge of the FFs in the data0 states must be lower than aQmax, because of errors being observed in this state.
SRAM FF
FIGURE 10. THE RELATION BETWEEN THE CRITICAL CHARGE AND COLLECTED CHARGE OF SRAM AND FLIP-FLOPS IN BOTH ALPHA AND NEUTRON ENVIRONMENTS. ~ Q M A X AND NQMAX IS THE MAXIMUM COLLECTED CHARGE IN ALPHA AND NEUTRON ENVIRONMENT RESPECTIVELY.
Our data qualitatively identifies charge collection differences in the alpha and neutron environments, providing guidance in correctly defining the critical charge of a FF, a crucial step in the logic SER model process.
C. Application SER
Product application SER is obtained from application code that simulates communication between two V.34 modems [ 171. As shown i n Fig. 11, each modem consists of transmitter and receiver, and operates on digital samples in both transmit and receive directions. They go through the four training phases after which they enter data mode and send " I " bits as data. Each modem's receiver counts the number of "0" bits it receives which are considered errors. The receiver can be approximately divided into two parts in sequence - demodulation and detection. The demodulation part consists of several signal processing elements. The detector operates on the demodulated data and determines the received bits. Each phase
21 2
generates a padfail result, which is equivalent to a check point during the code running process. The final passifail flag is derived at the end of simulation. Since the simulation is free-running i.e. it does not rely on any synchronization with external inputs, it represents a fully loaded application running in real-time.
Modem 1 Modem 2
1 transmitter 1
FIGURE 1 1. SCHEMATIC DIAGRAM OF APPLICATION CODE THAT WAS R U N
ON DSP TO SIMULATE A REPRESENTATIVE END USER PRODUCT APPLICATION.
measured product SER predicted based on component SER
FIGURE 12. AFTER MEMORY USAGE CORRECTION, THE SER PREDICTED BY ADDING THE COMPONENT SER TOGETHER IS VERY CLOSE TO THE MEASURED PRODUCT SER.
TABLE 3. COMPARtSON OFCOMPONENT SER AND PRODUCT SER r I
(a.u.)
1.345
As shown in Figure 12 and Table 3, the measured product SER while this modem code was running is much lower (about I 00x) than the sum of the component SER if we consider every single embedded SRAM bit (we have total 24 MEG bit on this chip) contributes equally to the overall chip-level SER. In reality, only a fraction of the memory was used by the program. After compilation, this specific modem code allocated 0.34 MEG SRAM for its usage, therefore, the overall chip- level SER must take this memory usage fraction as a derating factor. After memory usage derating, the SER from component prediction is very close to the measured value.
CONCLUSIONS
We have presented an approach to characterize SER for a 0.13pm multi-core DSP system and compared it with standard component SER test methods. We have compared our component data from the
DSP product to the SER from test chips and seen close correlation. We computed the total chip level SER based on all the component data from DSP, and for the first time, we obtained the failure rate of the DSP running a real application. Our data reveals that with the appropriate memory usage derating factor, we can indeed use the component SER to predict the product SER while running an application.
ACKNOWLEDGEMENT
The authors would like thank Piyush Pate1 for providing the application code, Frank Cano, Srikanth Krishnan for the meaningful discussions, and Zegeye Alemu. Michael Line, Sandi Rodgers, Ron Drafz, and Duy-loan Le for their support.
REFERENCES
R. Ronen, L. Shih-Lein, K. Lai, A. Mendelson, F. Pllack, and J . P. Shen, “Coming challenges in microarchitecture and architecfure,” Proc. IEEE, vol. 89, Mar., 2001, pp. 325-340. J. Maiz and R. Baumann, “Radiation induced soft errors in silicon components and computer systems” in Tutorial, Inr. Reliufddy Physics Symp., Dallas, April 2002. R. Baumann, “The impact of technology scaling on soft error rate performance and limit to the efficacy of error correction” in IEDM Tech. Dig.. 2002, pp.329-332. N. Seifert, X. Zhu, L. Massengill, “Impact of scaling on soft error rates in commercial microprocessors” in ZEEE Truns. hiucf. Sci.,vol. 49,2002, pp,3 100-3 I 06. P. Shivahmar, M. Kistler, S. Keckler, D. Burger, L. Alvisi, “Modeling the effects of technoloby trend on soft error rates of combinational circuits” in Proc. bit. Dependable Systems andNetworks, 2002, pp.389-398. C. Dai, N. Hakim, S. Hareland, J . Maiz, and S Lee, “Alpha-SER modeling & simulation for sub-0.25um CMOS technology” in VLSI Tech. Dig., 1999, pp. 81-82, N. Seifert, D. Moyer, N. Leland, and R. Hokinson, “Historical trends in alpha-particle induced soft error rates of the Alpha microprocessor,” in Proc. Int. Reliabiliy Physics S’mp., 2000, pp.259-265. H. T. Nguyen and Y. Yagil, “A systematic approach to SER estimation and solutions” in Proc. Int Reliability Physics Symp.. 2002, pp.60-70. S. Kems, “Transient-ionization and single event phenomena”, in Ionizing Radiation effects in AfOS Devices and Circuits.,T. P. Ma and P. V. Dressendorfer, eds., (Wiley, New York, 1989).
[ 101 J. Elder, J. Osbom, W. Kolsainski, R. Koga, “A method for characterizing a microprocessor’s vulnerability to SEU’ in IEEE Trans. Nucl. Sci..,vol. 35, 1988, pp. 1678-1 68 1.
[ I I ] N. Seifert, X. Zhu, D. Moyer, R. Mueller, N. Leland, R. Hokinson, M. Shade. and L. Massengill, “Frequency dependence of soft error rates for sub-micron CMOS technologies” inIEDM Tech. Dig, 2001. pp.14.4.1-14.4.4.
[ I21 Los Alamos National Laboratory neutron facility. [ 131 “Measurement and Reporting of alpha Particles and
Terrestrial cosmic Ray-Induced Soft Errors in Semiconductor Devices,” JEDEC standard JESD89, www.Jedec.org.
[I41 Y. Tosaka, S. Satoh, T. Itahra, H. Ehara, T. Ueda, G.A. Woffinden, and S . A. Wender, “Measurement and Analysis of Neutron-Induced Soft Errors in Sub-Half-Micron CMOS Circuits,” in IEEE Tran. Electronic Devices, vol. 45, July. 1998, pp.1453-1458.
21 3
[I51 T. Kamik, B. Bloechel, K. Soumyanath, V. De, and S. Borkar, “Scaling Trends of Cosmic Ray Induced Soft Errors in Static Latches beyond O.l8um,” in Proc. IEEE Symp. VLSI, June. ZOOl, pp.61-62.
[I61 P. Roche, F. Jacyuet, C. Caillat, and J. Schoellkopf, “An Alpha immune ultra low neutron SER high density S U M ” in Proc. In{. Reliability Physics Symp., 2004,
[ 171 international telecommunication union standard. ITU-T pp.671-672.
v.34, www.itu.int.
21 4