Monomethylamine–water vapour absorption refrigeration system

Comparison of IASI water vapour products over complexterrain with COPS campaign data
Guido Masiello1,*, Carmine Serio
1, Thomas Deleporte
2, Herve Herbin
3, Paolo Di Girolamo
1,
Cedric Champollion4, Andreas Behrendt
5, Pierre Bosser
6, Olivier Bock
7,
Volker Wulfmeyer5, Matthieu Pommier
2 and Cyrille Flamant2
1Scuola di Ingegneria, Universita degli Studi della Basilicata, Potenza, Italy2Laboratoire Atmospheres, Milieux, Observations Spatiales, CNRS-UPMC-UVSQ, Paris, France3Laboratoire d’Optique Atmospherique, CNRS and Universite des Sciences et Technologies de Lille, Lille, France4Geoscience Montpellier, CNRS and Universite Montpellier II, Montpellier, France5Institut fur Physik und Meteorologie, Universitat Hohenheim, Stuttgart, Germany6ING, Ecole Nationale des Sciences Geographiques, LAREG, Marne-la-Vallee, France7ING, LAREG, Universite Diderot, Paris, France
(Manuscript received August 31, 2012; in revised form September 27, 2013; accepted October 9, 2013)
AbstractIn this work, we compare IASI-retrieved vertical water vapour profiles and related precipitable water over acomplex region, namely the Rhine Valley area, during the pre-operational period of IASI exploitation (June–August 2007). Both IASI water vapour mixing ratio profiles and integrated water vapour content are retrievedfrom L1C radiances spectra using two techniques and compared with water vapour related observationsacquired during the Convective and Orographically-induced Precipitation Study (COPS) field campaign thattook place in this area at that time (i.e. lidars, radiosoundings and a global positioning system - GPS - stationnetwork). This work addresses the issue of IASI vertical spatial resolution and its capability to detect two-layer water vapour structures such as those observed in a mountainous area and which play an important rolein convective initiation or inhibition. We found that this capability mostly relies on the type of a-prioribackground vector (climatology or space-time colocated ECMWF analysis), which is used within theretrieval scheme. Systematic comparison of water vapour products derived from 71 IASI spectra confirmsthat IASI can retrieve water vapour amounts in 2 km width layers, in the lower troposphere, with an accuracyof approximately 10%.
Keywords: Water vapor, Infrared Atmospheric Sounding Interferometer (IASI), Raman lidar, DifferentialAbsorption Lidar (DIAL), Global Positioning System (GPS), remote sensing.
1 Introduction
High-quality water vapour and temperature observationsare necessary to improve our understanding of the Earth’sclimate system, as well as to improve weather forecasts.Water vapour is not only the most important greenhousegas in the atmosphere, but also plays a key role for thecomprehension and prediction of most important weatherprocesses from convective initiation, to the formation ofclouds and precipitation, to the formation of severestorms. Deeper process understanding and better modelrepresentation require high quality water vapour observa-tions featuring global coverage and a previously unac-hieved accuracy and resolution. Satellite remote sensinghas a great potential to provide global coverage of watervapour measurements. Passive remote sensors in theinfrared and the microwave regions have been used toretrieve water vapour since the early 1970s. TheAdvanced Very-High Resolution Radiometer (AVHRR,
versions 1–3), the High-Resolution Infrared RadiationSounder (HIRS, versions 1–3) and the MicrowaveSounding Unit (MSU), the latter being replaced by theAdvanced Microwave Sounding Unit (AMSU) since1998, have been operational on-board NOAA TIROSsatellite series, with the last launch in 2004 (NOAA18), while upgraded versions of the AVHRR and HIRSsensors are presently flying on-board the MetOp Satel-lites 1–3. These three sensors, forming the TIROS Oper-ational Vertical Sounder (TOVS) unit, are characterizedby a limited accuracy and vertical resolution e.g.(CHEDIN et al., 1993) which do not reach the requiredlevel of water vapour data quality needed for climatestudies and have a limited impact in numerical weatherprediction (NWP) models through data assimilation(GERARD et al., 2004). Conversely, the Infrared Atmo-spheric Sounding Interferometer (IASI), (HILTON et al.,2012), also carried on the MetOp satellite, is probablyat date the most advanced instrument in space for remotecharacterization of atmospheric temperature and humid-ity. Marking a significant technological step forward, itprovides water vapour and temperature profiles with
*Corresponding author: Guido Masiello, Scuola di Ingegneria, Universitadegli Studi della Basilicata, Viale dell’Ateneo Lucano 10, 85100 Potenza,Italy, e-mail: [email protected]
Meteorologische Zeitschrift, Vol. 22, No. 4, 471–487 (published online October 2013) Open Access Article� by Gebruder Borntraeger 2013
DOI 10.1127/0941-2948/2013/04300941-2948/2013/0430 $ 7.65
� Gebruder Borntraeger, Stuttgart 2013
Unauthorized distribution of this copyrighted material is strictly forbidden!Downloaded from www.schweizerbart.de

much higher accuracy and resolution than previous satel-lite-borne instruments.
Previously, the potential of IASI measurements incomparison with active remote sensing from space usinga differential absorption lidar (DIAL) was studied inWULFMEYER et al. (2005) using synthetic data and retri-evals. Furthermore, the potential of a space borne DIALwas demonstrated in DI GIROLAMO et al. (2008).
The present paper is dedicated to a comparison ofIASI water vapour products with measurements per-formed by a variety of sensors in the framework of theConvective and Orographically-induced PrecipitationStudy (COPS) (WULFMEYER et al., 2008, 2011b). Thecomparison effort involves measurements from the globalpositioning system (GPS, both in terms of column inte-grated water vapour and tomography-derived watervapour mixing ratio profiles), radiosondes and a varietyof lidar systems deployed at the different so-calledsupersites.
The capability of in-situ sensors for the verification ofspaceborne sensors has been studied extensively withinthe scope of WMO intercomparison campaigns (NASH
et al., 2010 with further references). Generally, if the rec-ommended corrections are applied, Vaisala RS92 sound-ings should have an rms error less than 10% in thetroposphere. However, this does not remove errors by dif-ferent sampling of air masses in space and time withinrespect to the IASI profiles, which makes comparisonswith soundings very challenging. In contrast, active remotesensing techniques such as Raman lidar e.g., (TURNERet al., 2002) and differential absorption lidar (DIAL)(WULFMEYER and BOSENBERG, 1998; BRUNEAU et al.,2001a,b; BEHRENDT et al., 2009) deliver vertical profileswith high temporal and spatial resolution and errors lessthan 5% throughout the troposphere. This was confirmedduring a variety of intercomparison campaigns in the USat the SGP site with the ARM program (REVERCOMB
et al., 2003) during the IHOP-2002 campaign (BEHRENDT
et al., 2007a,b) and recently during COPS (BHAWAR et al.,2011). This makes Raman lidar andDIAL excellent candi-dates for the verification of spaceborne sensors.
A large amount of measurement techniques andnumerical simulations have been employed during theCOPS campaign. For the objective of comparison withIASI water vapour products, we focused on a small partof this data, which consist of GPS measurements (bothintegrated water vapour columns and water vapourtomography-derived profiles), radiosoundings and lidarwater vapour profiles. We used a colocation criterionfor the lidar and radiosondes comparisons of +/- 90 min-utes on a spatial grid to ensure that enough comparisonswith the IASI retrieved profiles can be carried out.
According to POUGATCHEV et al. (2009); CALBET
et al. (2011), this time-space window may not be enoughto ensure a layer-to-layer comparison between profiles inthe sense that we need to assess the co-location errorbefore performing any kind of evaluation of the IASIretrieval accuracy. However, the H2O profile shape (we
mean single layer or two-layer structure) is not expectedto change over these time-spatial scales (see, e.g.(GRIECO et al., 2007), which still allows us to addressthe issue of IASI vertical spatial resolution. In contrast,the GPS tomography profiles are calculated exactly atthe position of the IASI observation.
Bearing this in mind, a first objective of this study isto compare the IASI water vapour profiles retrievals doneat LATMOS (Laboratoire Atmospheres, Milieux, Obser-vations Spatiales, Paris, France) and DIFA (Dipartimentodi Ingegneria e Fisica dell’Ambiente, Universit‘a degliStudi della Basilicata, Potenza, Italy) based on two tech-niques built around the optimal estimation method butwhich differ in several aspects (spectral range, a prioridetermination, retrieval strategy and so on).
A second objective is to compare the IASI retrievalswithwater vapour profiles obtained by high vertical spatialresolution techniques, which are based on lidar and radio-sonde observations performedduring theCOPScampaign.The comparison is mostly intended to check the capabilityof IASI in resolving two-layer water vapour structures inthe lower troposphere e.g. see (GRIECO et al., 2007). Thiscapability is important for studying and better understand-ing the convection process, but is also interesting forassessing the potential use of IASI water vapour fieldsfor the derivation of atmospheric motion vectors. Finally,total columns have also been compared for the LATMOSandDIFA retrievals techniques andwith GPS total columnmeasurements.
The paper is organized as follows. Section 2 isdevoted to the description of data, techniques and meth-ods. A brief overview of the COPS campaign is pre-sented in section 2.1, while section 2.1.1 to 2.1.4describe lidar and GPS systems used during the cam-paign. IASI data and related methods are shown in sec-tions 2.2 to 2.2.2. Results are shown in section 3, whileconclusions are drawn in section 4.
2 Data
2.1 COPS campaign overview
The COPS international field campaign took place from 1June to 31 August 2007 in a low-mountain area in south-western Germany/eastern France covering the Vosgesmountains, the Rhine valley and the Black Forest moun-tains (6-11�E, 47-50�N, see Fig. 1) (WULFMEYER et al.,2008, 2011a,b). The main scientific goal of the COPScampaign was the identification of the physical processesresponsible for the quantitative precipitation forecastingin low-mountain regions. During the 3-month long cam-paign, a large suite of state-of-the-art meteorologicalinstrumentation was operated (WULFMEYER et al.,2011a; WULFMEYER and BEHRENDT, 2007).
This includes networks of in situ and remote-sensingsystems such as GPS stations as well as a synergy ofmulti-wavelength passive and active remote-sensinginstruments such as advanced radar and lidar systems.
472 G. Masiello et al.: Comparison of IASI water vapour products Meteorol. Z., 22, 2013
Unauthorized distribution of this copyrighted material is strictly forbidden!Downloaded from www.schweizerbart.de
An impressive collection of instrumental set ups wereconcentrated in five so-called supersites along a west-to-east transect (see Fig. 1) at the Vosges mountains(supersite V), Rhine valley (supersite R), Hornisgrindemountain site (supersite H), Murg valley (supersite M)and Deckenpfronn close to Stuttgart (supersite S). Thepositions of these supersites are listed in Table 1.
During three months, 18 intensive observational peri-ods totalling 37 days operation and eight additional spe-cial observational Periods were performed, providing acomprehensive dataset covering different forcing condi-tions. The collected data set covers the entire evolutionof convective precipitation events in complex terrainfrom their initiation, to their development and maturephase until their decay. It is demonstrated that COPSresearch provided new insight into key processes leadingto convection initiation and to the modification of precip-itation by orography as well as in the improvement ofquantitative precipitation forecasting by the assimilationof new observations (BAUER et al., 2011; BEHRENDT
et al., 2011b; BIELLI et al., 2011; CORSMEIER et al.,2011; RICHARD et al., 2010; YAN et al., 2009), and inthe performance of ensembles of convection-permittingmodels in complex terrain (BAUER et al., 2011).
2.1.1 BASIL Raman lidar
During COPS, the Raman Lidar system BASIL (UVBASIlicata Raman Lidar system at DIFA) was deployedin Achern (Rhine valley, Supersite R, Lat: 48.64 �N,Long: 8.06 �E, Elev.: 140 m) and operated from 25May to 30 August 2007, collecting more than 500 hoursof measurements, distributed over 58 measurement daysand 34 intensive observation periods. The major featureof BASIL is in its capability to perform high resolutionand accurate measurements of atmospheric temperature
and water vapour, both during the daytime and atnighttime, based on the application of the rotationaland vibrational Raman lidar techniques in the UV spec-tral range (DI GIROLAMO et al., 2004, 2006, 2009a).
Besides temperature and water vapour, BASIL pro-vides measurements of the particle backscattering coeffi-cient at 355, 532 and 1064 nm, the particle extinctioncoefficient at 355 and 532 nm and particle depolarizationat 355 and 532 nm. The experimental set-up of BASILwas described in various papers (DI GIROLAMO et al.,2009a,b; MAESTRI et al., 2010). Moreover, the Ramanlidar technique for the determination of the water vapourmixing ratio profile has been extensively discussed in theliterature (for a recent review, see (WHITEMAN, 2003)).
The water vapour mixing ratio can be obtained fromthe power ratio of water vapour to molecular nitrogenvibrational Raman signals. This ratio needs to be cali-brated through an independent measurement, which isusually provided by radiosonde, GPS or microwave radi-ometer measurements. Specifically, during COPS the cal-ibration was performed using an extensive comparison ofthe water vapour mixing ratio data from the lidar andsimultaneous radiosondes (Vaisala RS92 radiosondeswere considered for this purpose (BHAWAR et al., 2011).
Vertical and temporal resolution of BASIL raw data are15–30 m and 5–60 sec, respectively. However, in order toreduce signal statistical fluctuations, time integration andvertical smoothing are applied to the data. For a time reso-lution of 10 min and a vertical resolution of 150 m, night-timewater vapourmixing ratiomeasurement uncertainty istypically 2% at 4 km and 7% at 7 km (based on 13 distinctprofiles used in 23 comparisons), while daytime uncer-tainty is typically 10% at 4 km and 20% at 5 km (basedon 4 profiles used in 8 comparisons). Examples of mea-surements from BASIL during COPS are reported inDI GIROLAMO et al. (2012a,b); BENNETT et al. (2011);BEHRENDT et al. (2011b); KIEMLE et al. (2011).
2.1.2 Rameau Raman lidar
The Rameau lidar has been developed by the InstitutNational de l’Information Geographique et Forestiere(IGN) in cooperation with the Laboratoire Atmospheres,Milieux, Observations Spatiales (CNRS-UPMC). It isequally referred to, in the text or figures, as the Rameaulidar or IGN/SA lidar. The system is intended to be oper-ated in combination with GPS receivers to improve tro-posphere modelling (BOSSER et al., 2007). The Rameaulidar was operational during COPS at supersite V duringthe entire month of July 2007, for a total of about 200 hcovering 25 measurement sessions. While the system wasoriginally intended to operate both at night and in day-time, technical problems prevented it from performingprecise daytime water vapour measurements, and obser-vations were therefore limited to night-time and night-to-day and day-to-night transitional periods.
The system, enclosed in a van, uses a tripled Nd:YAGlaser (355 nm), with an average power of about 0.8 W.
longitude, deg
latit
ude,
deg
−10 0 10 20 30 40 50 6025
30
35
40
45
50
55
60
65 RH M SV
6.5 7 7.5 8 8.5 947.5
48
48.5
49
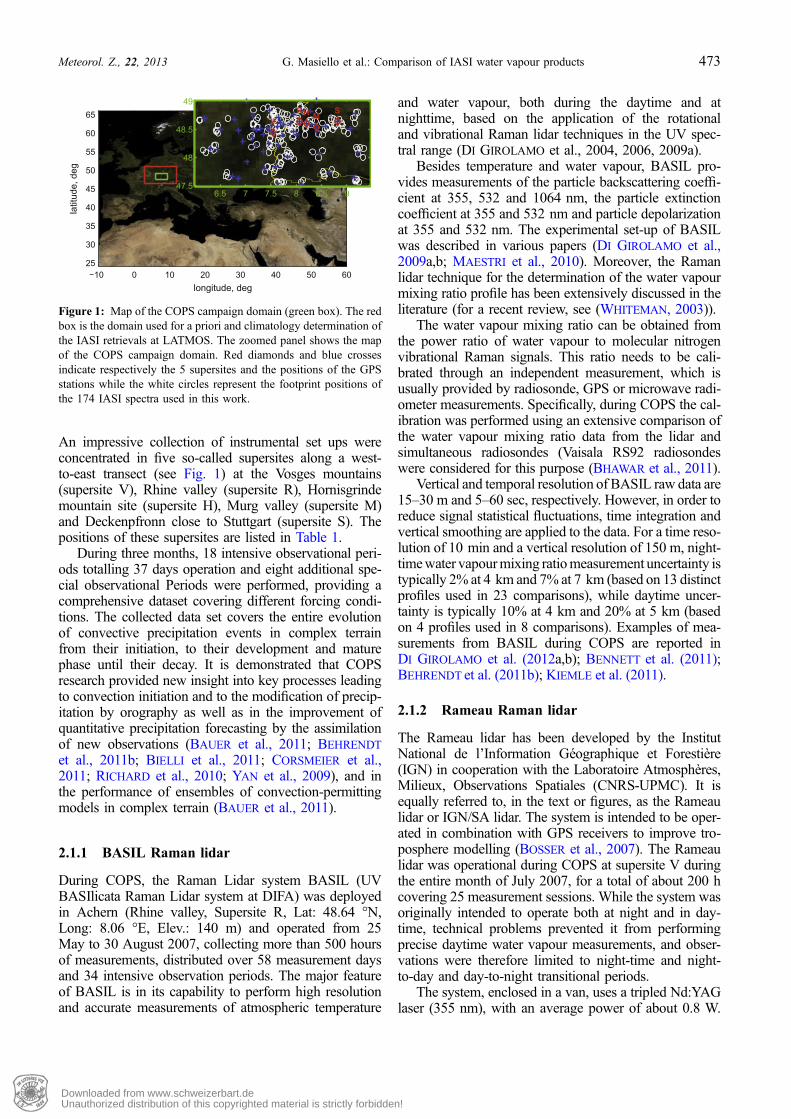
Figure 1: Map of the COPS campaign domain (green box). The redbox is the domain used for a priori and climatology determination ofthe IASI retrievals at LATMOS. The zoomed panel shows the mapof the COPS campaign domain. Red diamonds and blue crossesindicate respectively the 5 supersites and the positions of the GPSstations while the white circles represent the footprint positions ofthe 174 IASI spectra used in this work.
Meteorol. Z., 22, 2013 G. Masiello et al.: Comparison of IASI water vapour products 473
Unauthorized distribution of this copyrighted material is strictly forbidden!Downloaded from www.schweizerbart.de

The elastic (355 nm) and Raman components (387 nmfor molecular nitrogen and 408 nm for water vapour)are spectrally isolated with narrow-band (0.4 nm) inter-ference filters. The transmission terms in the Ramanequation are corrected with the aid of a standard atmo-spheric model (again midlatitude summer), while thetemperature dependence of the Raman cross-section con-volved with the interference filter band pass is currentlyneglected.
Humidity profiles are provided with a vertical resolu-tion between 15 m and 300 m. Based on an integrationtime of 5 min, typical vertical range (with a random errorsmaller than 100%) for night-time measurements is6-7 km. During daytime, measurement precision isseverely reduced due to the high levels of solar irradi-ance: the vertical range is 1-3 km in the day-to-nighttransition period and drops to a few hundred metres inthe middle of the day for a temporal resolution of 10 minor higher. The spatial and temporal integration grids withvarying resolution as a function of altitude enable theimprovement of the signal-to-noise ratio, especially inupper layers where backscattered signals are usuallyweak. Bias in water vapour mixing ratio estimates atlow signal photo-counting rates due to fluctuations inthe nitrogen signal in the denominator of the ratio are cor-rected using the methodology presented in BOSSER et al.(2010). Finally, water vapour mixing ratio profiles arecalibrated using nighttime collocated radiosondeslaunched at supersite V in the range 1-3 km (10 calibra-tion sessions).
2.1.3 University of Hohenheim DIAL
The differential absorption lidar (DIAL) of the Universityof Hohenheim (UHOH) measures high-resolution pro-files of atmospheric water vapour number density andparticle backscatter ratio near 820 nm both during theday and at night (BEHRENDT et al., 2009, 2011b). Thesystem consists of four novel components: A mobile lab-oratory mounted on a trailer, a high-power Ti:Sapphirelaser transmitter (WULFMEYER and BOSENBERG, 1996)with ~4 W average power and a repetition rate of250 Hz during COPS (WAGNER et al., 2011; WAGNER
et al., 2013), a combination of a small near-field and alarge far-field telescope (20 and 80 cm diameter primarymirrors, respectively), efficient detectors, and a high-
speed data acquisition system which were developedwithin three interlinked projects of the German ResearchFoundation by UHOH, DLR Oberpfaffenhofen, Institutefor Tropospheric Research Leipzig, and University ofPotsdam. During COPS, the system was operated forthe first time. The UHOH DIAL provides the highest res-olution remote sensing data of water vapour worldwideto date see BEHRENDT et al. (2009).
DIAL is a technique which measures the water vapournumber density by alternate emission of short laser pulseswhich are either absorbed strongly by water vapour in theatmosphere (online) or which are not absorbed (offline)and by time-resolved detection of the atmospheric back-scatter signals. The UHOH DIAL employs laser radiationin the near IR between 815 and 820 nm, a spectral regionwhere several water vapour absorption lines are presentand can be optimally selected according to the range ofinterest and the amount of humidity present in the atmo-sphere. With the water vapour absorption coefficient forthe online radiation known from high-accuracy labora-tory measurements, the ratio of the online and offlineatmospheric backscatter profiles alone provides a profileof the water vapour number density. Consequently, nocalibration of the DIAL data needs to be performed mak-ing this water-vapour active remote sensing techniquevery accurate.
The backscatter profiles of the DIAL are stored foreach laser pulse, i.e., with 250 Hz, and a range-resolutionof 3 m up to 20 km range. Thus maximum freedom ispossible in post-processing of the data. The data productsof the DIAL are profiles of water vapour number densitywith typical resolutions of 15 to 150 m with a temporalresolution of 1 to 10 s. But spatial and temporal resolu-tion can be traded off against each other.
Based on the work of BEHRENDT et al. (2007a,b), val-idation efforts were carried out with the COPS watervapour lidar measurements (BHAWAR et al., 2011). Itwas found that the relative mean bias of the UHOHDIAL water vapour data (BEHRENDT et al., 2011a) tothe other water vapour lidars employed during COPS isonly –1.4%.
2.1.4 GPS
As part of the COPS instrumental set-up, the existing per-manent GPS networks were enhanced with temporary
Table 1: Position of the five COPS measurement super-sites.
Site Altitude (m) Latitude (�N) Longitude (�E)V Meistratzheim (valley) 150 48.443 7.545
Bishenberg (mountain) 350 48.483 7.473R Achern 140 48.638 8.066H Hornisgrinde 1150 48.604 8.204M AMF site, Heselbach 500 48.545 8.397S Airport Deckenpfronn 560 48.635 8.813
474 G. Masiello et al.: Comparison of IASI water vapour products Meteorol. Z., 22, 2013
Unauthorized distribution of this copyrighted material is strictly forbidden!Downloaded from www.schweizerbart.de

stations to provide a 40 km interval GPS density.Furthermore, a denser segment of stations separated byabout 10 km was also set up along the East-West super-sites transect. GPS dual frequency data were recordedwith a 30 s sampling interval and an elevation cut-offangle of 5�.
From raw GPS data, surface temperature and surfacepressure, the retrievals of integrated water vapour hasbeen extensively described in the literature since BEVIS
et al. (1992) and SAASTAMOINEN (1972a,b, 1973). Moredetails about the GPS data processing done with GAMITsoftware (KING and BOCK, 2009) can be found in CHAM-
POLLION et al. (2009). As the processing strategy remainsidentical except for the Vienna Mapping Function(BOEHM and SCHUH, 2004), no emphasis is done onthe GPS data processing. Typical errors in GPS integratedwater vapour retrievals show a bias of 1–2 kg/m2 andrms of 2 kg/m2 (NIELL et al., 2001).
The LOFTTK GPS tomography software has beendescribed with all necessary details and compared withnumerical models, radiosoundings and lidar (BASTIN
et al., 2005; CHAMPOLLION et al., 2009). Typical errorsfrom the GPS tomography retrievals show a bias and arms of about 2 g/kg in the lower tropospherebelow 4 km and of 0.7 g/kg in between 4–6 km(CHAMPOLLION et al., 2009). From raw GPS data,IWV and gradients and residuals are used to retrievethe water vapour between the ground GPS station andeach GPS satellite in view every 5 minutes. A recursiveleast-square algorithm is used to retrieve the 4D field ofwater vapour every 15 minutes. The vertical resolution ofthe tomography grid is 0.5 km at the first level andincreases up to 2 km at the altitude of 8 km. The hori-zontal grid has been refined to match the two differentresolutions of the GPS network with a resolution of10 km between the supersites and of 50 km in the entireCOPS domain. The horizontal resolution is mainlydefined by separation between the nearby GPS station.The main limitation of the GPS tomography is a lackof information about the vertical distribution of watervapour from integrated ground based measurements(FLORES et al., 2000; CHAMPOLLION et al., 2005). There-fore, all radio-soundings from the COPS dataset are usedduring the tomography inversion without ground-basedor airborne lidar data. The combination of an integratedcontinuous all weather system (GPS) with sparse localmeasurements (radio-soundings) is able to provide a real-istic 4D field of water vapour at an intermediate spatialresolution.
2.2 IASI
The IASI instrument is a nadir-viewing Fourier transformspectrometer which records emission of the Earth atmo-sphere in the thermal infrared region (645-2760 cm�1)onboard the polar orbiting MetOp-A platform, with anapodized resolution of 0.5 cm�1. Its field of view con-
sists of a 2 · 2 pixel matrix with a 12 km pixel footprinton the ground at nadir. A swath across the track of2200 km ensures a global coverage of twice per day(HILTON et al., 2012). The IASI specifications, whichare detailed in HILTON et al. (2012), allow the retrievalof temperature and tropospheric water vapour profileswith an accuracy of 1 K and 15-20% respectively(HILTON et al., 2012) and a vertical resolution of 1 and2 km. The satellite ground track is at about 09:30 localtime in the morning and 21:30 in the evening.
The set of IASI observations we have considered forthe present analysis consists of 174 IASI spectra, whichhave been acquired over the period June-August 2007and are shown in Fig. 2. These spectra were passedthrough the IASI stand alone scene analysis (SERIOet al., 2000; MASIELLO et al., 2002a, 2003, 2004;GRIECO et al., 2007) for cloud screening. In the end, only94 out of the original 174 spectra were considered for theretrieval of surface and atmospheric parameters. Of these94 spectra, eventually 71 converged according to qualitychecks embedded within the retrieval schemes. These 71spectra and related products formed the basis of the pres-ent inter-comparison.
In passing, we note that within the set of 174 originalIASI observations, we were able to detect a series of IASIinverted spectra (see Fig. 3), in which the strong CO2
absorption near 14 lm and ozone absorption at 9.6 lmare seen in emission relative to cold cloud tops in the8–12 lm spectral range in atmospheric window chan-nels. These inverted spectra occurred on the night of 23July 2007 and show evidence that an overshooting con-vection was acting at that time. Overshooting convectionhappens when the cloud top reaches the level of the tro-popause, an event which can yield extremely heavy rain
700 800 900 1000 1100 1200220240260280300320
wavenumber, cm−1
BT, K
174 IASI Spectra
700 800 900 1000 1100 1200220240260280300320
wavenumber, cm−1
BT, K
94 clear sky classified IASI Spectra
Figure 2: (upper) The whole data set of IASI spectra before cloudscreening. After cloud detection only 94 out of the 174 IASI spectrawere considered for the retrieval analysis (lower panel). Only theIASI band 1 is shown.
Meteorol. Z., 22, 2013 G. Masiello et al.: Comparison of IASI water vapour products 475
Unauthorized distribution of this copyrighted material is strictly forbidden!Downloaded from www.schweizerbart.de

and is normally found in the tropical region. Fig. 3 showsthat overshooting convection can also occur at mid-lati-tudes and IASI is capable of detecting these extrememeteorological events.
2.2.1 IASI-L1C water vapour profile retrievalsat LATMOS
For the purpose of this study, water vapour profiles areretrieved from the L1C IASI apodized radiance spectrausing the Atmosphit software developed at UniversiteLibre de Bruxelles, Belgium (BARRET et al., 2005a,b;COHEUR et al., 2005) based on a line-by-line radiativetransfer calculation and the application of the OptimalEstimation Method (RODGERS, 2000). The theoreticalelements underlying such a method are similar to HERBIN
et al. (2009) and LACOUR et al. (2012).The H2
16O profiles are retrieved on 10 discrete verti-cal layers, extending from the ground up to 20 km in2 km intervals (e.g., 0-2, 2-4, ..., 18-20 km). In the spec-tral range used, the surface temperature, and the tropo-spheric columns of HDO, H2
17O, H218O, CO2, CH4,
HNO3, N2O, are adjusted simultaneously. However, theeffect of these parameters on the water vapour retrievalis very weak as shown in Fig. 4. The temperature profilesand surface emissivity are treated as non-retrieved param-eters. The a priori values and variabilities of all parame-ters are detailed hereafter.
For this study, we constructed the background vectorand covariance matrix in the following way. To beginwith, the a priori vector has been derived from the abso-lute humidity profiles, / in the ERA (ECMWF Re-Anal-ysis)-Interim data (see Fig. 1 for the size of the domainover which the a priori vector was computed). Thehumidity profiles were converted into water mass mixingratios using Tetens’s formula (TETENS, 1930) to deter-mine the water equilibrium vapour pressure pH2O
sat (in hPa)
pH2Osat ðT Þ ¼ 611 exp 7:5 logð10Þ T � 273:15
T � 35:85
� �: ð2:1Þ
where T is the temperature (in K). From the water equilib-rium vapour pressure, we can determine the water vapourmass mixing ratios, using
q ¼c/pH2O
sat ðT Þ� �
P � /pH2Osat ðT Þð1� cÞ
� � ð2:2Þ
and
MMR ¼ qð1� qÞ : ð2:3Þ
where q is the specific humidity and c ¼ Rdryspec=R
H2Ospec is the
ratio of the dry air specific constant over the water vapourspecific constant.
The a priori state vector, xa and its corresponding var-iance-covariance matrix, Ca were built using ERA-interim mixing ratio profiles on a 1 km grid going from0 to 20 km. This data covers a three year period
700 800 900 1000 1100 1200215
220
225
230
235
240
245
250
255
260
wavenumber, cm−1
BT, K
Figure 3: A couple of IASI spectra showing the occurrence ofovershooting convection during the night of 23 July 2007. Only theIASI band 1 is shown.
0 10 20 30 40 50 60 70 80 90
2
4
6
8
10
12
14
16
18
Error, %
Altit
ude,
km
(a)
a priori variabilityTotal ErrorSmoothing errorMeasurement errorAir TemperatureHDOH2
18O
0 0.5 1 1.5 2 2.5 3
2
4
6
8
10
12
14
16
18
Error,%
Altit
ude,
km
(b)
HDOH2
18O
HNO3CO2
H217O
CH4N2OSurface Temperature
Figure 4: (a) Mean error profiles over the 71 retrieved spectra and(b) replotted over the range 0–3% to show the error profiles of theinterfering gases.
476 G. Masiello et al.: Comparison of IASI water vapour products Meteorol. Z., 22, 2013
Unauthorized distribution of this copyrighted material is strictly forbidden!Downloaded from www.schweizerbart.de

(2004-2006), focused on the three months of summer(June to August) on a spatial range of 46.5-51�N;3-12�E (Fig. 1) on a 0.75� · 0.75� grid. The reduced apriori variance-covariance matrix, Sa is
Sa ¼ diag1
xa
� �Cadiag
1
xa
� �: ð2:4Þ
This method ensures the possibility of starting the ret-rievals with good a priori knowledge of the concentra-tions of water vapour without being too much of aconstraint (see Fig. 5). Other a priori vectors as well asother covariance matrices have been tested, but showedno significant impact on the retrievals. This can beexplained by the fact that the smoothing error is of thesame order of magnitude as the measurement error inthe lower atmospheric layers.
As far as the forward model is concerned, spectro-scopic parameters derived from the HITRAN 2008 data-base (ROTHMAN et al., 2009) were used to perform thisstudy. The selected spectral window is 1186.95 to1406.40 cm�1with a gap between 1300.75 and1307.25 cm�1, thus removing the contribution of themethane Q branch in the m4 band. This range is optimizedfor water vapour retrieval and unlike the method used inHERBIN et al. (2009), we did not take into account theshortwave spectral window above 2500 cm�1 as we werenot interested in proper retrievals of HDO. Moreover,tests conducted in this study using this window showedno significant effect on the results for H2
16O.For the IASI measurement error covariance matrix,
we use a diagonal matrix whose elements are set equalto 2 · 10�6 W/(cm2 sr m�1), which is the typical IASIradiometric noise for the spectral range used in theanalysis.
As far as values and settings regarding model param-eters, land surface temperatures were derived from theMODIS Terra data on a daily basis. Emissivities werealso derived from MODIS Terra on a monthly basis.They were calculated following equation (12) proposedby WANG et al. (2005).
Temperature profiles came from the DIFA retrieval(see Section 2.2.2). IASI DIFA profiles were comparedto those retrieved from GPS tomography, and appearedto show rather small overall differences. They also helpedin minimising the air temperature bias associated withLATMOS profiles a posteriori with respect to the GPStomography temperature profiles. They were treated asequivalent to level 2 IASI temperature profiles, assumingan uncorrelated uncertainty of 1 K for each retrievedlayer. For the other model parameters, we used climatol-ogy and the uncertainty associated is that specified inHERBIN et al. (2009).
Following RODGERS (2000), who expands the retrie-val error in its components (smoothing error, modelparameter error and retrieval noise), Fig. 5 shows thecontribution to the retrieval (total) error from the various
sources of noise. The error analysis has been averagedover the 71 retrieved water vapour profiles. The firstthing to be pointed out is that the interfering species(model parameters) have a minor impact on the retrievalerror for the water vapour profile, which is in agreementwith the previous work of HERBIN et al. (2009). It canalso be seen that the total error is slightly larger than whathas been shown in HERBIN et al. (2009) with a valueclose to 20% below 12 km. This is mainly due to the dif-ficulty in performing a meaningful retrieval near the sur-face over complex terrain like the one present in theCOPS area. The largest errors are observed in the1-7 km and the 11-15 km layers where the main contri-butions are due to errors in air temperature (mainly inthe 1-5 km layer) and smoothing (mainly in the11-15 km layer, see Fig. 6). The contribution of thesmoothing error is depicted in Fig. 6 which shows thelack of resolution above 11 km. Fig. 6 also shows thatthe states retrieved in the altitude range 1-11 km are agood description of the real state at that altitude range.
10−3 10−2 10−1 100 1010
2
4
6
8
10
12
14
16
18
20
Mass Mixing Ratio, g/kg
Altit
ude,
km
Altitude, km
Altit
ude,
km
0 5 10 15 200
2
4
6
8
10
12
14
16
18
20
0
0.05
0.1
0.15
0.2
0.25
0.3
0.35
Figure 5: Altitude plotted as a function of a priori water vapourmass mixing ratio profile on a logarithmic scale (upper panel) andits associated reduced water vapour covariance matrix (Sa) projec-tion (bottom panel).
Meteorol. Z., 22, 2013 G. Masiello et al.: Comparison of IASI water vapour products 477
Unauthorized distribution of this copyrighted material is strictly forbidden!Downloaded from www.schweizerbart.de

2.2.2 IASI-L1C water vapour profile retrievalsat DIFA
The retrieval products for this experiment are obtainedwith the DIFA u-IASI package (GRIECO et al., 2007;MASIELLO et al., 2009; MASIELLO and SERIO, 2013)which is intended to generate IASI synthetic spectraand for the inversion of the following geophysical param-eters: surface temperature and emissivity, temperatureand water vapour profiles, low vertical resolution profilesof ozone, carbon monoxide, methane, and nitrous oxide.
This package is intended to provide a kit of models toaddress research issues on inversion methodology(including Tikhonov and/or Rodgers regularization,Levenberg-Marquardt least-square minimization) andradiative transfer (including generation of analyticalderivative matrices, impact of new spectroscopy).
The package has been the subject of various scientificpapers and, in addition, it has been extensively validatedusing aircraft and satellite high spectral resolution infra-red observations recorded with Fourier transform spec-trometers (GRIECO et al., 2007; TAYLOR et al., 2008).
It consists of a stand-alone cloud detection scheme(MASIELLO et al., 2002b), a forward model, r-IASI(AMATO et al., 2002) and an inverse model, d-IASI (CAR-
ISSIMO et al., 2005).The forward model, which we call r-IASI, consists of
a monochromatic radiative transfer model which hasbeen designed for the fast computation of spectral radi-ance and its derivatives (Jacobian) with respect to a givenset of geophysical parameters. It computes monochro-matic radiances from look-up-tables of monochromaticlayer optical depth generated by the line-by-line radiativetransfer model LBLRTM (CLOUGH et al., 2005). Theatmospheric layering embedded in r-IASI consists of60 pressure layers extending from 1050 to 0.005 hPa.In the middle-to-lower troposhere, the layering enablesus to perform forward/inverse calculations on a meshwith a grid step better than 1 km.
The inverse module, which we call d-IASI, imple-ments a non-linear inversion procedure, needs to be prop-erly initialized as there may be multiple solutions due tothe ill-posed nature of the retrieval problem. For the pres-ent study, the initialization is provided by the EmpiricalOrthogonal Function (EOF) statistical retrieval approachdescribed in GRIECO et al. (2005); SERIO et al. (2009).
The basic implementation of the inverse scheme fol-lows Rodgers’s statistical regularization method(RODGERS, 1976). However, an additional regularizationparameter (CARISSIMO et al., 2005; MASIELLO andSERIO, 2013) is introduced in the inverse scheme, whichimproves the retrieval accuracy and constrains the stepsize of Newton updates in such a way as to iteratetowards the likely region of the inverse solution (GRIECO
et al., 2007; CARISSIMO et al., 2005; MASIELLO andSERIO, 2013). For the background vector, we use theEOF retrieval for the surface temperature and temperatureprofile, whereas the time-space colocated ECMWF anal-ysis is used for water vapour and ozone. The covariancematrix is the forecast error obtained from the EOF regres-sions scheme. The EOF regression scheme is tuned withthe Chevallier ECMWF data set (CHEVALLIER, 2001).We do not use the ECMWF analysis error because thisprovides too tight of a constraint. Also, as said, ourscheme uses an additional regularization parameter thattries to balance the covariance matrix on the basis ofthe given observations (CARISSIMO et al., 2005). Forthe purpose of developing a suitable background foremissivity, we use the University of Wisconsin (UW)Baseline Fit (BF) Emissivity database (UW/BFEMISdatabase, e.g. http://cimss.ssec.wisc.edu/iremis/(SEEMANN et al., 2008; MASIELLO and SERIO, 2013).
For thepresent study, the retrieved state vector includes:surface temperature and emissivity, temperature, watervapour and ozone profiles. The columnar amount of watervapour or equivalently the precipitablewater,pw is directlyobtained through integration over the estimated watervapour mixing ratio, qðpÞ, according to
pw ¼ 1
g
Z po
oqðpÞdp: ð2:5Þ
where po is the pressure at the ground level, qðpÞ is thewater vapour mixing ratio profile (kg/kg), g = 9.81 ms�2 is the acceleration of gravity at sea level. Using Inter-national System units, the above integral is in kg m�2.Since, the water vapour profile is obtained at N = 60atmospheric layers, we have
pw ¼ 1
g
XN
i¼1qðiÞ�pðiÞ ð2:6Þ
with precision, r2pw given by
r2pw ¼
1
g2
XN
i¼1
XN
j¼1Sði; jÞ�pðiÞ�pðjÞ: ð2:7Þ
−0.4 −0.2 0 0.2 0.4 0.6 0.8 1
2
4
6
8
10
12
14
16
18
Altit
ude,
km
DOF=4.3959
Figure 6: Rows of the mean averaging kernel matrix calculatedover the 71 IASI retrievals at LATMOS.
478 G. Masiello et al.: Comparison of IASI water vapour products Meteorol. Z., 22, 2013
Unauthorized distribution of this copyrighted material is strictly forbidden!Downloaded from www.schweizerbart.de

where S(i, j), i, j = 1, . . ., N are the elements of the watervapour a-posteriori covariance matrix. The precision candepend on the given retrieval. However, normally it is lessthan 1.0 kg m�2.
For the present study, the following spectral rangeshave been considered for the inversion of IASI data:645 to 1250 cm�1; 1450 to 2260 cm�1. At the IASI sam-pling rate of 0.25 cm�1, this corresponds to a number of5668 IASI spectral radiances. The observational covari-ance matrix is assumed diagonal. The diagonal is thewave-number dependent IASI radiometric noise. Furtherdetails about spectral ranges, the observational covari-ance matrix, background vector and covariance and theexpected retrieval performance can be found (GRIECO
et al., 2007; MASIELLO et al., 2009, 2012; MASIELLO
and SERIO, 2013), to which the interested reader isreferred.
For the benefit of the reader, we note that the meanobserved error in the lower troposphere (0–6 km) is0.6 g/kg (11%) with values ranging from 0.08 g/kg to0.84 g/kg, with a relative error ranging from 8 to 16%.Above 6 km, observed errors are between 0.002 g/kgand 0.05 g/kg, with relative differences increasing withaltitude from 11% to 70% for the higher layer (0.05 hPa),and a mean value of 0.01 g/kg (40%).
As far as the vertical spatial resolution capabilities andproperties of d-IASI are concerned, they have beenassessed inGRIECO et al. (2007) in terms of degrees of free-domand averaging kernels. Forwater vapour, based on ourtypical background covariance matrix, we have 8–9degrees of freedom for temperature, 7-8 for water vapourand 2–3 for ozone. Furthermore, in the first 3 km altituderange of the atmosphere, the spatial vertical resolutionfor water vapour is between 0.5–1 km. However, we haveto caution that degrees of freedom and averaging kernelsdepend on the given background covariance matrix andcannot be assumedas a universalmeasure of the IASI capa-bility for resolving spatial vertical structures of watervapour. It has been shown (GRIECO et al., 2007) thatdegrees of freedom characterizes the retrieval system andnot the IASI capability to resolve vertical spatial structures.Nevertheless, degrees of freedom and averaging kernelstend to be associated as a universal measure of the perfor-mance of a given instrument (such as IASI) rather than thegiven retrieval method. For cases where an importantatmospheric feature is unresolved, it is generally the faultof the retrieval methodology rather than the instrumentitself (GRIECO et al., 2010).
3 Water vapour comparisons
The comparisons between the different techniques aredivided to two parts. The first part is dedicated to anassessment of the quality of the total columnar amountof water vapour by a comparison between the two IASIretrieval techniques (LATMOS and DIFA) presented in
the previous section. These two methods are then com-pared to the GPS columnar amounts as measured duringthe COPS campaign.
The second part is dedicated to the comparison of thevertical water vapour profiles. As for the total columns,the comparison is done between the two IASI-basedretrieval techniques, as well as with the GPS tomographymeasurements and the BASIL Raman lidar profiles. Inaddition, radiosoundings, DIAL and Rameau lidar com-parisons are shown when data are available.
Comparisons are done using 71 IASI L1C spectra thatwere selected close to the COPS GPS stations (less than6 km) in order to have the most accurate spatial coloca-tion (see Fig. 1).
3.1 Total column comparisons
For what concerns the inner comparison between the twoIASI retrieval techniques, the column integrated watervapour values are determined from the spectra using dif-ferent spectral regions for the two methods as describedin the previous section.
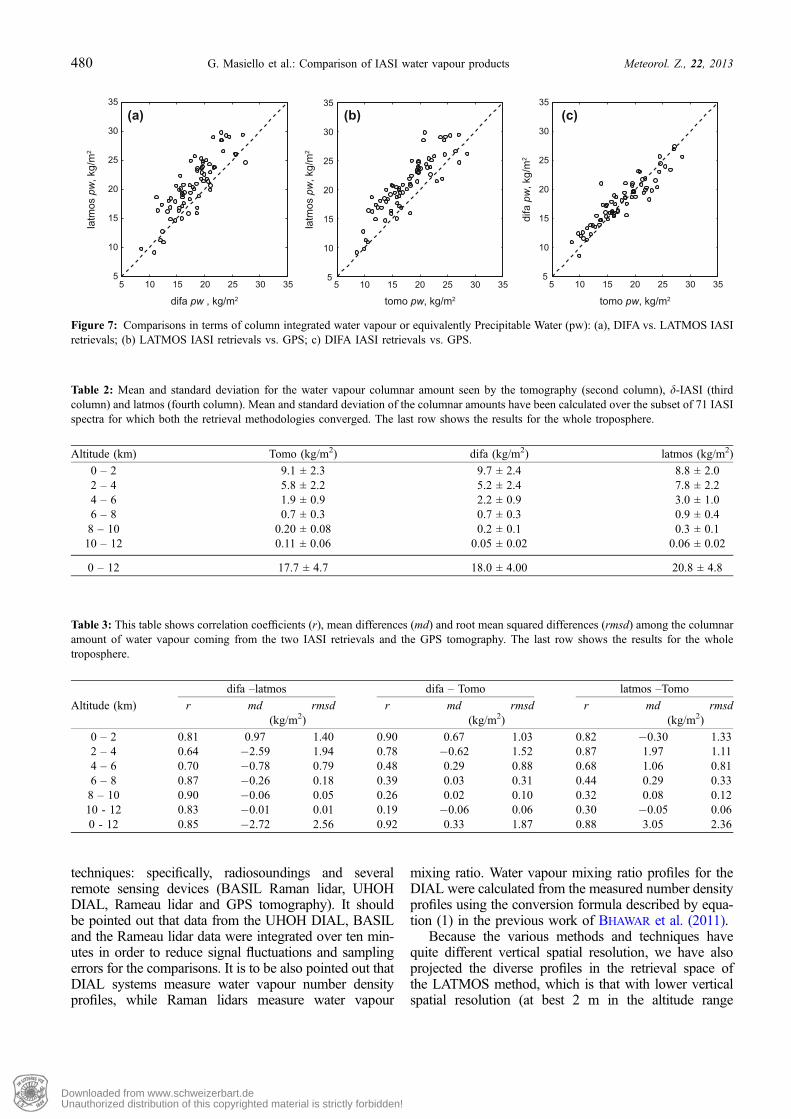
The comparison (Fig. 7a) shows a small positive bias(LATMOS column integrated values larger than DIFA’s),but a very good overall agreement with a correlationcoefficient of about 0.85 and a root mean square differ-ence (RMSD, 2.56 kg/m2) larger than the mean errorsassociated with the two retrieval techniques (2.30 kg/m2 and less than 1 kg/m2 for LATMOS and DIFA retrie-val, respectively). More details are in Tables 2 and 3.
The comparisons between the GPS column integratedwater vapour measurements and LATMOS and DIFA ret-rievals are illustrated in Fig. 7b and Fig. 7c, respectively.A positive bias is observed (IASI retrievals larger thanGPS) for the two techniques (3.05 kg/m2 or 15% in thecase of LATMOS, 0.33 kg/m2 or 2% in the case ofDIFA), with a higher correlation coefficient (~0.92),which reveals an overall good agreement between theIASI retrieval methods and the GPS measurements.
The results obtained with two different and indepen-dent retrieval techniques show a good consistency whichis strengthened by the comparison with the GPS mea-surements, even though in both cases a small positive dif-ference with GPS observations is observed.
3.2 Profile comparisons
The second part of the comparison effort is mostlydevoted to the capability of the two IASI retrieval meth-odologies to resolve double-layer water vapour structuresin the lower troposphere.
All comparisons are expressed in terms of watervapour mixing ratio (g/kg). As for the column integratedcontents, we also show a comparison between the IASIretrievals at LATMOS and DIFA. Comparisonswith the COPS data involve different measurement
Meteorol. Z., 22, 2013 G. Masiello et al.: Comparison of IASI water vapour products 479
Unauthorized distribution of this copyrighted material is strictly forbidden!Downloaded from www.schweizerbart.de
techniques: specifically, radiosoundings and severalremote sensing devices (BASIL Raman lidar, UHOHDIAL, Rameau lidar and GPS tomography). It shouldbe pointed out that data from the UHOH DIAL, BASILand the Rameau lidar data were integrated over ten min-utes in order to reduce signal fluctuations and samplingerrors for the comparisons. It is to be also pointed out thatDIAL systems measure water vapour number densityprofiles, while Raman lidars measure water vapour
mixing ratio. Water vapour mixing ratio profiles for theDIAL were calculated from the measured number densityprofiles using the conversion formula described by equa-tion (1) in the previous work of BHAWAR et al. (2011).
Because the various methods and techniques havequite different vertical spatial resolution, we have alsoprojected the diverse profiles in the retrieval space ofthe LATMOS method, which is that with lower verticalspatial resolution (at best 2 m in the altitude range
Table 2: Mean and standard deviation for the water vapour columnar amount seen by the tomography (second column), d-IASI (thirdcolumn) and latmos (fourth column). Mean and standard deviation of the columnar amounts have been calculated over the subset of 71 IASIspectra for which both the retrieval methodologies converged. The last row shows the results for the whole troposphere.
Altitude (km) Tomo (kg/m2) difa (kg/m2) latmos (kg/m2)
0 – 2 9.1 ± 2.3 9.7 ± 2.4 8.8 ± 2.02 – 4 5.8 ± 2.2 5.2 ± 2.4 7.8 ± 2.24 – 6 1.9 ± 0.9 2.2 ± 0.9 3.0 ± 1.06 – 8 0.7 ± 0.3 0.7 ± 0.3 0.9 ± 0.48 – 10 0.20 ± 0.08 0.2 ± 0.1 0.3 ± 0.110 – 12 0.11 ± 0.06 0.05 ± 0.02 0.06 ± 0.02
0 – 12 17.7 ± 4.7 18.0 ± 4.00 20.8 ± 4.8
Table 3: This table shows correlation coefficients (r), mean differences (md) and root mean squared differences (rmsd) among the columnaramount of water vapour coming from the two IASI retrievals and the GPS tomography. The last row shows the results for the wholetroposphere.
difa –latmos difa – Tomo latmos –Tomo
Altitude (km) r md rmsd r md rmsd r md rmsd(kg/m2) (kg/m2) (kg/m2)
0 – 2 0.81 0.97 1.40 0.90 0.67 1.03 0.82 �0.30 1.332 – 4 0.64 �2.59 1.94 0.78 �0.62 1.52 0.87 1.97 1.114 – 6 0.70 �0.78 0.79 0.48 0.29 0.88 0.68 1.06 0.816 – 8 0.87 �0.26 0.18 0.39 0.03 0.31 0.44 0.29 0.338 – 10 0.90 �0.06 0.05 0.26 0.02 0.10 0.32 0.08 0.1210 - 12 0.83 �0.01 0.01 0.19 �0.06 0.06 0.30 �0.05 0.060 - 12 0.85 �2.72 2.56 0.92 0.33 1.87 0.88 3.05 2.36
5 10 15 20 25 30 355
10
15
20
25
30
35
difa pw , kg/m2
latm
os p
w, k
g/m
2
(a)
5 10 15 20 25 30 355
10
15
20
25
30
35
tomo pw, kg/m2la
tmos
pw
, kg/
m2
(b)
5 10 15 20 25 30 355
10
15
20
25
30
35
tomo pw, kg/m2
difa
pw
, kg/
m2
(c)
Figure 7: Comparisons in terms of column integrated water vapour or equivalently Precipitable Water (pw): (a), DIFA vs. LATMOS IASIretrievals; (b) LATMOS IASI retrievals vs. GPS; c) DIFA IASI retrievals vs. GPS.
480 G. Masiello et al.: Comparison of IASI water vapour products Meteorol. Z., 22, 2013
Unauthorized distribution of this copyrighted material is strictly forbidden!Downloaded from www.schweizerbart.de

0-20 km). This is done by degrading the higher resolu-tion profiles by means of the smoothing functiondescribed by CONNOR et al. (1994) according to the fol-lowing equation:
xS ¼ xa þ Aðxh � xaÞ; ð3:1Þ
where xh is the higher resolution profile, A is the LATMOSaveraging kernels matrix (see references (RODGERS, 2000;HERBIN et al., 2009) xa is the a priori and xs is the resultingsmoothed profile, respectively.
Before smoothing is done, profiles with missing val-ues below 20 km are completed using a climatology pro-file calculated from the ERA Interim humidity profilesover the COPS region and time of operation, using thesame methodology as described in the a priori buildingparagraph in section 2.2.1.
An example of retrieved profiles compared to COPSmeasurements is shown in Fig. 8. This profile shows asimple single layer structure in the lower troposphereand all methods are capable of capturing this simple fea-ture. The overall consistency is good also considering theimperfect co-location among COPS measurements andIASI observations.
Much more interesting is the comparison provided inFig. 9, which shows two water vapour profile exhibitinga two-layer structure in the lower troposphere. For thecase of the spectrum 92 recorded on 25 July 2007 at20:24:36 UTC, we have a very large dry layer about5 km in width. It is seen that DIFA retrieval easily detectsthis large dry structure. LATMOS is a bit more smoothed,which is easily explained because of the 2-km verticalgrid mesh used by this method. Also, the smooth LAT-MOS representation in the same figure shows that DIFAdetects very nicely the dry layer.
The second profile in Fig. 9 (corresponding to the date31 July 2007, 20:00:34 UTC) is even more interesting,because the dry layer has now a width of less than2 km, which is below the detecting capability of LAT-MOS. And in fact, this last scheme is not capable ofrevealing the double-layer structure. Conversely, DIFAis quite able to pick up the correct position of the drylayer. Given the approximate colocation, this is again avery good result. We think that this capability has notonly to do with the finer vertical grid mesh of DIFA com-pared with LATMOS also reflects the fact the DIFA usesECMWF analysis as the background vector for watervapour.
A comparison in terms of mean and standard devia-tion of the difference among the diverse schemes is herelimited to LATMOS, tomography and DIFA, which areperfectly co-located with the IASI observations. A com-parison is made by using the LATMOS vertical gridmesh as reference (this is made of layers with a constantwidth of 2 km). For the first 12 km altitude, the layer-integrated water amount is shown in Tables 2 and 3.For the benefit of the reader, the same data points aregraphically represented in the Fig. 10.
The first interesting feature we can see from this fig-ure is the fact that the most biased layer from the ground-level, is the second one, e.g. layer 2-4 km. From Fig. 9,this is the altitude range where the dry layer tended todevelop the double-layer structure. It is also quite inter-esting to note that while the mean difference betweenGPS tomography (TOMO) and DIFA is limited to0.4 mm, the TOMO-LATMOS and DIFA-LATMOS dif-ferences can reach values as high as 2 mm. A secondinteresting feature is that the standard deviation beginsto be of the same order of the mean values as the altitudeincreases. This is also confirmed by the data shown in
Pres
sure
, hPa
Mass Mixing Ratio, g/kg
Spectrum # 075 14−Jul−2007 09:26:22
1
2
5
10
15
Altit
ude,
km
a)
0.01 0.1 1 10
0
100
200
300
400
500
600
700
800
900
1000
ECMWFdifalatmostomoBASILRS, R, 08:13RS, R, 11:18RS, V, 08:15
Mass Mixing Ratio, g/kg
Pres
sure
, hPa
Spectrum # 075 14−Jul−2007 09:26:22
1
2
5
10
15
Altit
ude,
km
b)
0.01 0.1 1 10
0
100
200
300
400
500
600
700
800
900
1000
difalatmostomoBASILRS, R, 08:13RS, R, 11:18RS, V, 08:15
Figure 8: IASI L1C-retrieved water vapour profiles comparison. (a) original profiles. (b) smoothed profiles. Location : 48.66�N; 7.94�E at09:26:22 UTC. The R-site and V-site are approximatively 9 km and 38 km far from the center of the IASI footprint. The radiosondes fromthe R-site were launched at 08:13 (Green line) and 11:18 (Magenta line) while the radiosonde from the V-Site was launched at 08:15 (blackdotted line). In panel a), the co-located ECMWF analysis profile is shown in grey.
Meteorol. Z., 22, 2013 G. Masiello et al.: Comparison of IASI water vapour products 481
Unauthorized distribution of this copyrighted material is strictly forbidden!Downloaded from www.schweizerbart.de
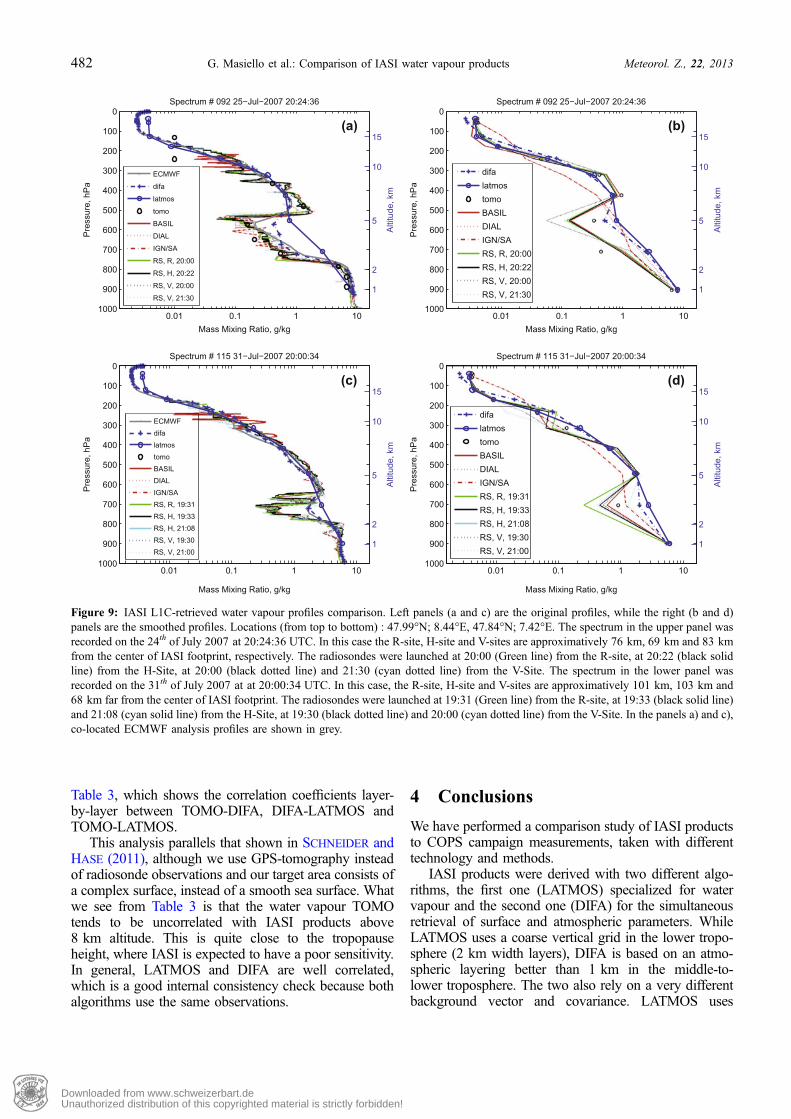
Table 3, which shows the correlation coefficients layer-by-layer between TOMO-DIFA, DIFA-LATMOS andTOMO-LATMOS.
This analysis parallels that shown in SCHNEIDER andHASE (2011), although we use GPS-tomography insteadof radiosonde observations and our target area consists ofa complex surface, instead of a smooth sea surface. Whatwe see from Table 3 is that the water vapour TOMOtends to be uncorrelated with IASI products above8 km altitude. This is quite close to the tropopauseheight, where IASI is expected to have a poor sensitivity.In general, LATMOS and DIFA are well correlated,which is a good internal consistency check because bothalgorithms use the same observations.
4 Conclusions
We have performed a comparison study of IASI productsto COPS campaign measurements, taken with differenttechnology and methods.
IASI products were derived with two different algo-rithms, the first one (LATMOS) specialized for watervapour and the second one (DIFA) for the simultaneousretrieval of surface and atmospheric parameters. WhileLATMOS uses a coarse vertical grid in the lower tropo-sphere (2 km width layers), DIFA is based on an atmo-spheric layering better than 1 km in the middle-to-lower troposphere. The two also rely on a very differentbackground vector and covariance. LATMOS uses
Mass Mixing Ratio, g/kg
Pres
sure
, hPa
Spectrum # 092 25−Jul−2007 20:24:36
1
2
5
10
15
Altit
ude,
km
(a)
0.01 0.1 1 10
0
100
200
300
400
500
600
700
800
900
1000
ECMWF
difa
latmos
tomo
BASIL
DIAL
IGN/SA
RS, R, 20:00
RS, H, 20:22
RS, V, 20:00
RS, V, 21:30
Mass Mixing Ratio, g/kg
Pres
sure
, hPa
Spectrum # 092 25−Jul−2007 20:24:36
1
2
5
10
15
Altit
ude,
km
(b)
0.01 0.1 1 10
0
100
200
300
400
500
600
700
800
900
1000
difalatmostomoBASILDIALIGN/SARS, R, 20:00RS, H, 20:22RS, V, 20:00RS, V, 21:30
Mass Mixing Ratio, g/kg
Pres
sure
, hPa
Spectrum # 115 31−Jul−2007 20:00:34
1
2
5
10
15Al
titud
e, k
m(c)
0.01 0.1 1 10
0
100
200
300
400
500
600
700
800
900
1000
ECMWFdifalatmostomoBASILDIALIGN/SARS, R, 19:31RS, H, 19:33RS, H, 21:08RS, V, 19:30RS, V, 21:00
Mass Mixing Ratio, g/kg
Pres
sure
, hPa
Spectrum # 115 31−Jul−2007 20:00:34
1
2
5
10
15
Altit
ude,
km
(d)
0.01 0.1 1 10
0
100
200
300
400
500
600
700
800
900
1000
difalatmostomoBASILDIALIGN/SARS, R, 19:31RS, H, 19:33RS, H, 21:08RS, V, 19:30RS, V, 21:00
Figure 9: IASI L1C-retrieved water vapour profiles comparison. Left panels (a and c) are the original profiles, while the right (b and d)panels are the smoothed profiles. Locations (from top to bottom) : 47.99�N; 8.44�E, 47.84�N; 7.42�E. The spectrum in the upper panel wasrecorded on the 24th of July 2007 at 20:24:36 UTC. In this case the R-site, H-site and V-sites are approximatively 76 km, 69 km and 83 kmfrom the center of IASI footprint, respectively. The radiosondes were launched at 20:00 (Green line) from the R-site, at 20:22 (black solidline) from the H-Site, at 20:00 (black dotted line) and 21:30 (cyan dotted line) from the V-Site. The spectrum in the lower panel wasrecorded on the 31th of July 2007 at at 20:00:34 UTC. In this case, the R-site, H-site and V-sites are approximatively 101 km, 103 km and68 km far from the center of IASI footprint. The radiosondes were launched at 19:31 (Green line) from the R-site, at 19:33 (black solid line)and 21:08 (cyan solid line) from the H-Site, at 19:30 (black dotted line) and 20:00 (cyan dotted line) from the V-Site. In the panels a) and c),co-located ECMWF analysis profiles are shown in grey.
482 G. Masiello et al.: Comparison of IASI water vapour products Meteorol. Z., 22, 2013
Unauthorized distribution of this copyrighted material is strictly forbidden!Downloaded from www.schweizerbart.de

climatology, DIFA (for water vapour) relies on the time-space colocated ECMWF analysis.
The comparison with water vapour profiles derivedfrom vertical spatial resolution techniques and methodshas allowed us to get a better insight into the capabilityof IASI of resolving two-layer structures in the lower tro-posphere. Mostly depending on the background, we haveonce more shown that infrared observations of high spec-tral resolution can resolve dry layers in the tropospherewhose width can be as small as � 1.5-2 km. The com-parison with GPS tomography shows that IASI retrievalaccuracy is within 10% in the lower troposphere and inlayers of 2 km width. A good accuracy is also confirmedin terms of precipitable water.
An inter-comparison between LATMOS and DIFAhas shown to be internally consistent despite the twoschemes relying on quite diverse background, retrievalstrategy and number of IASI observations. Apparently,the superiority of DIFA in resolving structures in thelower troposphere is largely due to a better background.Finally, we have also shown that IASI can have the capa-bility to detect overshooting convection, an issue whichis left for further investigation.
Acknowledgments
T. Deleporte would like to thank CNES/TOSCA for thefinancial support. IASI has been developed and built un-der the responsibility of the Centre National d’EtudesSpatiales (CNES, France). It is flown onboard the Metopsatellites as part of the EUMETSAT Polar System. TheIASI L1 data are received through the EUMETCast nearreal time data distribution service.
References
AMATO, U., G. MASIELLO, C. SERIO, M. VIGGIANO, 2002:The r-iasi code for the calculation of infrared atmosphericradiance and its derivatives. – Environ. Model. Software17, 651–667. doi:10.1016/S1364-8152(02)00027-0.
BARRET, B., S. TURQUETY, D. HURTMANS, C. CLERBAUX, J.HADJI-LAZARO, I. BEY, M. AUVRAY, P.-F. COHEUR,2005a: Global carbon monoxide vertical distributions fromspaceborne high-resolution ftir nadir measurements. –Atmos. Chem. Phys. 5, 2901–2914.
BARRET, B., D. HURTMANS, M.-R. CARLEER, M. DE
MAZIERE, E. MAHIEU, P.-F. COHEUR, 2005b: Linenarrowing effect on the retrieval of HF and HCL verticalprofiles from ground-based FTIR measurements. – J.Quant. Spectros. Radia. Transfer 95, 499–519.
BASTIN, S., C. CHAMPOLLION, O. BOCK, P. DROBINSKI, F.MASSON, 2005: On the use of GPS tomography toinvestigate water vapor variability during a mistral/seabreeze event in southeastern france. – Geophys. Res. Lett.32, L05808. doi:10.1029/2004GL021907.
BAUER, H.-S., V. WULFMEYER, T. SCHWITALLA, F. ZUS, M.GRZESCHIK, 2011: Operational assimilation of gps slantpath delay measurements into the MM5 4DVAR system. –Tellus A 63, 263–282.
BEHRENDT, A., V. WULFMEYER, P. DI GIROLAMO, C.KIEMLE, H.-S. BAUER, T. SCHABERL, D. SUMMA, D.N.WHITEMAN, B.B. DEMOZ, E.V. BROWELL, S. ISMAIL, R.FERRARE, S. KOOI, G. EHRET, J. WANG, 2007a: Inter-comparison of water vapor data measured with lidar duringihop 2002, part 1: Airborne to ground-based lidar systemsand comparisons with chilled-mirror hygrometer radioson-des. – J. Atmos. Ocean. Technol. 24, 3–21. doi:10.1175/JTECH1924.1.
BEHRENDT, A., V. WULFMEYER, C. KIEMLE, G. EHRET, C.FLAMANT, T. SCHABERL, H.-S. BAUER, S. KOOI, S.ISMAIL, R. FERRARE, E.V. BROWELL, D.N. WHITEMAN,2007b: Intercomparison of water vapor data measured withlidar during ihop 2002, part 2: Airborne to airbornesystems. – J. Atmos. Ocean. Technol. 24, 22–39.doi:10.1175/JTECH1925.1.
BEHRENDT, A., V. WULFMEYER, A. RIEDE, G. WAGNER, S.PAL, H. BAUER, M. RADLACH, F. SPATH, 2009: 3-Dimensional observations of atmospheric humidity witha scanning differential absorption lidar. – In R.H. PICARD,K. SCHAFER, A. COMERON et al. (Eds.): Remote Sensingof Clouds and the Atmosphere XIV, volume 7475. – SPIEConference Proceeding, doi:10.1117/12.835143.
BEHRENDT, A., S. PAL, H. BAUER, V. WULFMEYER, 2011a:cops_suph_wvdial: Profiles of absolute humidity andbackscatter signals at 820 nm measured with the watervapor differential absorption lidar of University of Ho-henheim (UHOH DIAL) during COPS 2007. – World DataClimate Center. doi:10.1594/WDCC/cops_suph_wvdial.
BEHRENDT, A., S. PAL, F. AOSHIMA, M. BENDER,A. BLYTH, U. CORSMEIER, J. CUESTA, G. DICK, M.DORNINGER, C. FLAMANT, P. DI GIROLAMO, T. GORGAS,
0
2
4
6
8
10
12
−5 −4 −3 −2 −1 0 1 2 3 4 5
Altit
ude,
km
Precipitable Water, kg/m2
difa − latmosdifa − tomolatmos − tomo
Figure 10: Mean and root mean square differences between difa,latmos and gps retrievals.
Meteorol. Z., 22, 2013 G. Masiello et al.: Comparison of IASI water vapour products 483
Unauthorized distribution of this copyrighted material is strictly forbidden!Downloaded from www.schweizerbart.de

Y. HUANG, N. KALTHOFF, S. KHODAVAR, H. MANNSTEIN,K. TRAUMNER, A. WIESER, V. WULFMEYER, 2011b:Observation of convection initiation processes with a suiteof state-of-the-art research instruments during COPSIOP8b. – Quart. J. Roy. Meteor. Soc. 137, 81–100.doi:10.1002/qj.758.
BENNETT, L.J., A.M. BLYTH, R.R. BURTON, A.M. GADIAN,T.M. WECKWERTH, A. BEHRENDT, P. DI GIROLAMO, M.DORNINGER, S.-J. LOCK, V.H. SMITH, S.D. MOBBS, 2011:Initiation of convection over the black forest mountainsduring COPS IOP15A. – Quart. J. Roy. Meteor. Soc. 137,176–189. doi:10.1002/qj.760.
BEVIS, M., S. BUSINGER, T. HERRING, C. ROCKEN, R.A.ANTHES, R.H. WARE, 1992: GPS meteorology: Remotesensing of the atmospheric water vapor using the globalpositioning system. – J. Geophys. Res. 97, 15787–15801.
BHAWAR, R., P. Di GIROLAMO, D. SUMMA, C. FLAMANT, D.ALTHAUSEN, A. BEHRENDT, C. KIEMLE, P. BOSSER, M.CACCIANI, C. CHAMPOLLION, T. DI IORIO, R.ENGELMANN, C. HEROLD, D. MULLER, S. PAL, M.WIRTH, V. WULFMEYER, 2011: The water vapour inter-comparison effort in the framework of the convective andorographically-induced precipitation study: airborne-to-ground-based and airborne-to-airborne lidar systems.– Quart. J. Roy. Meteor. Soc. 137, 325–348.
BIELLI, S., M. GRZESCHIK, E. RICHARD, C. FLAMANT, C.CHAMPOLLION, C. KIEMLE, M. DORNINGER, P. BROUS-
SEAU, 2011: Assimilation of water-vapour airborne lidarobservations: impact study on the COPS precipitationforecasts. – Quart. J. Roy. Meteor. Soc. 138, 1652–1667.doi:10.1002/qj.1864.
BOEHM, J., H. SCHUH, 2004: Vienna mapping functions inVLBI analyses. – Geophys. Res. Lett. 31, L01603.doi:10.1029/2003GL018984.
BOSSER, P., O. BOCK, C. THOMAS, J. PELON, 2007: Study ofthe statistics of water vapor mixing ratio determined fromraman lidar measurements. – Appl. Optics 46, 8170–8180.doi:10.1364/AO.46.008170.
BOSSER, P., O. BOCK, C. THOMAS, J. PELON, P. WILLIS,2010: A case study of using raman lidar measurements inhigh-accuracy gps applications. – J. Geodesy 84, 251–265.
BRUNEAU, D., P. QUAGLIA, C. FLAMANT, M. MEISSONNIER,J. PELON, 2001a: Airborne Lidar LEANDRE II for water-vapor profiling in the Troposphere. I. system description. –Appl. Optics 40, 3450–3461.
BRUNEAU, D., P. QUAGLIA, C. FLAMANT, J. PELON, 2001b:Airborne Lidar LEANDRE II for water-vapor profiling inthe Troposphere. II. first results. – Appl. Optics 40,3462–3475.
CALBET, X., R. KIVI, S. TJEMKES, F. MONTAGNER, R.STUHLMANN, 2011: Matching radiative transfer modelsand radiosonde data from the EPS/Metop Sodankylacampaign to IASI measurements. – Atmos. Meas. Tech.4, 1177–1189. doi:10.5194/amt-4-1177-2011.
CARISSIMO, A., I. DE FEIS, C. SERIO, 2005: The physicalretrieval methodology for IASI: the d-iasi code. – Environ.Model. Software 20, 1111–1126.
CHAMPOLLION, C., F. MASSON, M.-N. BOUIN, A. WAL-
PERSDORF, E. DOERFLINGER, O. BOCK, van J. BAELEN,2005: GPS water vapor tomography: Preliminary resultsfrom the escompte field experiment. – Atmos. Res. 74,253–274.
CHAMPOLLION, C., C. FLAMANT, O. BOCK, F. MASSON,D.D. TURNER, T. WECKWERTH, 2009: Mesoscale GPStomography applied to the 12 June 2002 convectiveinitiation event of IHOP 2002. – Quart. J. Roy. Meteor.Soc. 135, 645–662.
CHEVALLIER, F., 2001: Sampled database of 60-level atmo-spheric profiles from the ECMWF analyses, researchreport, no. 4. – Technical report, EUMETSAT/ECMWF,http://research.metoffice.gov.uk/research/interproj/nwpsaf/rtm/profiles_60L.pdf.
CHEDIN, A., M.T. CHAHINE, N.A.E. SCOTT, 1993: Highspectral resolution infrared remote sensing for earth’sweather and climate studies, volume 19. – NATO ASISeries.
CLOUGH, S.A., M.W. SHEPHARD, E.J. MLAWER, J.S.DELAMERE, M.J. IACONO, K. CADY-PEREIRA, S. BOUKA-
BARA, P.D. BROWN, 2005: Atmospheric radiative transfermodeling: a summary of the aer codes. – J. Quant.Spectros. Radiative Transfer 91, 233–244.
COHEUR, P.-F., B. BARRET, S. TURQUETY, D. HURTMANS, J.HADJI-LAZARO, C. CLERBAUX, 2005: Retrieval andcharacterization of ozone vertical profiles from a thermalinfrared nadir sounder. – J. Geophys. Res. 110, D24303.doi:10.1029/2005JD005845.
CONNOR, B.J., D.E. SISKIND, J.J. TSOU, A. PARRISH, E.E.REMSBERG, 1994: Ground-based microwave observationsof ozone in the upper stratosphere and mesosphere. – J.Geophys. Res. 99, 16757–16770.
CORSMEIER, U., N. KALTHOFF, C. BARTHLOTT, F. AOSHIMA,A. BEHRENDT, P. DI GIROLAMO, M. DORNINGER, J.HANDWERKER, C. KOTTMEIER, H. MAHLKE, S.D.MOBBS, E.G. NORTON, J. WICKERT, V. WULFMEYER,2011: Processes driving deep convection over complexterrain: a multi-scale analysis of observations from copsIOP 9c. – Quart. J. Roy. Meteor. Soc. 137, 137–155.doi:10.1002/qj.754.
DI GIROLAMO, P., R. MARCHESE, D.N. WHITEMAN, B.B.DEMOZ, 2004: Rotational raman lidar measurements ofatmospheric temperature in the UV. – Geophys. Res. Lett.31, L01106. doi:10.1029/2003GL018342.
DI GIROLAMO, P., A. BEHRENDT, V. WULFMEYER, 2006:Pure rotational raman lidar measurements of atmospherictemperature and extinction from space: performancesimulations. – Appl. Optics 45, 2474–2494.
DIGIROLAMO, P., A. BEHRENDT, C.KIEMLE,V.WULFMEYER,H. BAUER, A. SUMMA, D. DORNBRACK, G. EHRET, 2008:Simulation of satellite water vapour lidar measurements:Performance assessment under real atmospheric conditions.– Remote Sens. Environ. 112, 1552–1568.
DI GIROLAMO, P., D. SUMMA, R. FERRETTI, 2009a: Rota-tional raman lidar measurements for the characterization ofstratosphere-troposphere exchange mechanisms. – J.Atmos. Oceanic Technol. 26, 1742–1762.
484 G. Masiello et al.: Comparison of IASI water vapour products Meteorol. Z., 22, 2013
Unauthorized distribution of this copyrighted material is strictly forbidden!Downloaded from www.schweizerbart.de
DI GIROLAMO, P., D. SUMMA, R.F. LIN, T. MAESTRI, R.RIZZI, G. MASIELLO, 2009b: UV raman lidar measure-ments of relative humidity for the characterization of cirruscloud microphysical properties. – Atmos. Chem. Phys. 9,8799–8811.
DI GIROLAMO, P., D. SUMMA, T. DI IORIO, E.G. NORTON, G.PETERS, Y. DUFOURNET, 2012a: Lidar and radar measure-ments of the melting layer in the frame of the convectiveand orographically-induced precipitation study: observa-tions of dark and bright band phenomena. – Atmos. Chem.Phys. 12, 4143–4157. doi:10.5194/acp-12-4143-2012.
DI GIROLAMO, P., D. SUMMA, R. BHAWAR, T. DI IORIO, M.CACCIANI, I. VESELOVSKII, O. DUBOVIK, A. KOLGOTIN,2012b: Raman lidar observations of a saharan dustoutbreak event: Characterization of the dust opticalproperties and determination of particle size and micro-physical parameters. – Atmos. Environ. 50, 66–78.doi:10.1016/j.atmosenv.2011.12.061.
FLORES, A., G. RUFFINI, A. RIUS, 2000: 4D tropospherictomography using GPS slant wet delays. – AnnalesGeophysicae 18, 223–234.
GRIECO, G., A. LUCHETTA, G. MASIELLO, C. SERIO, M.VIGGIANO, 2005: IMG O3 retrieval and comparison withtoms/adeos columnar ozone: an analysis based on tropicalsoundings. – J. Quant. Spectros. Radia. Transfer 95, 331–348. doi:10.1016/j.jqsrt.2004.11.016.
GRIECO, G., G. MASIELLO, M. MATRICARDI, C. SERIO, D.SUMMA, V. CUOMO, 2007: Demonstration and validation ofthe u-IASI inversion scheme with NAST-I data. – Quart. J.Roy. Meteor. Soc. 133, 217–232. doi:10.1002/qj.162.
GRIECO, G., G. MASIELLO, C. SERIO, 2010: InterferometricVS spectral IASI radiances: Effective data-reductionapproaches for the satellite sounding of atmosphericthermodynamical parameters. – Remote. Sens. 2, 2323–2346. doi:10.3390/rs2102323.
GERARD, E., D.G.H. TAN, L. GARAND, V. WULFMEYER, G.EHRET, P. DI GIROLAMO, 2004: Major advances foreseenin humidity profiling from the water vapour lidar exper-iment in space (Wales). – Bull. Amer. Meteor. Soc. 85,237–251.
HERBIN, H., D. HURTMANS, C. CLERBAUX, L. CLARISSE,P.-F. COHEUR, 2009: H2
16O and HDO measurements withIASi/MetOp. – Atmos. Chem. Phys. 9, 9433–9447.
HILTON, F., R. ARMANTE, T. AUGUST, C. BARNET, A.BOUCHARD, C. CAMY-PEYRET, V. CAPELLE, L. CLARISSE,C. CLERBAUX, P.-F. COHEUR, A. COLLARD, C.CREVOISIER, G. DUFOUR, D. EDWARDS, F. FAIJAN, N.FOURRIE, A. GAMBACORTA, M. GOLDBERG, V. GUIDARD,D. HURTMANS, S. ILLINGWORTH, N. JACQUINET-HUSSON,T. KERZENMACHER, D. KLAES, L. LAVANANT, G.MASIELLO, M. MATRICARDI, A. MCNALLY, S. NEWMAN,E. PAVELIN, S. PAYAN, E. PEQUIGNOT, S. PEYRIDIEU, T.PHULPIN, J. REMEDIOS, P. SCHLUSSEL, C. SERIO, L.STROW, C. STUBENRAUCH, J. TAYLOR, D. TOBIN, W.WOLF, D. ZHOU, 2012: Hyperspectral earth observationfrom IASI: four years of accomplishments. – Bull. Amer.Meteor. Soc. 93, 347–370. doi:10.1175/BAMS-D-11-00027.1.
KIEMLE, C., M. WIRTH, A. FIX, R.S.U. CORSMEIER, P. DI
GIROLAMO, 2011: Latent heat flux measurements overcomplex terrain by airborne water vapour and wind lidars.– Quart. J. Roy. Meteor. Soc. 137, 190–203. doi:10.1002/qj.757.
KING, R.W., Y. BOCK, 2009: Documentation for the GAMITGPS analysis software, release 10.4. – Department ofEarth, Atmospheric and Planetary Sciences, MassachusettsInstitute of Technology, Cambridge, and Scripps Institu-tion of Oceanography, University of California at SanDiego.
LACOUR, J.-L., C. RISI, L. CLARISSE, S. BONY, D.HURTMANS, C. CLERBAUX, P.-F. COHEUR, 2012: Mid-tropospheric d D observations from IASI/MetOp at highspatial and temporal resolution. – Atmos. Chem. Physics12, 10817–10832.
MAESTRI, T., P. DI GIROLAMO, D. SUMMA, R. RIZZI, 2010:Synergistic use of a ground based raman lidar and theNAST-I airborne spectrometer in clear and cloudy skyconditions – eaquate, italy 2004. – Atmos. Res. 97,157–169.
MASIELLO, G., C. SERIO, 2013: Simultaneous physicalretrieval of surface emissivity spectrum and atmosphericparameters from infrared atmospheric sounder interferom-eter spectral radiances. – Appl. Optics 52, 2428–2446.doi:10.1364/AO.52.002428.
MASIELLO, G., M. MATRICARDI, R. RIZZI, C. SERIO, 2002a:Homomorphism between cloudy and clear spectral radi-ance in the 800–900-cm�1 atmospheric window region. –Appl. Optics 41, 965–973. doi:10.1364/AO.41.000965.
MASIELLO, G., M. MATRICARDI, R. RIZZI, C. SERIO, 2002b:Homomorphism between cloudy and clear spectral radi-ance in the 800–900-cm�1 atmospheric window region. –Appl. Optics 41, 965–973. doi:10.1364/AO.41.000965.
MASIELLO, G., C. SERIO, H. SHIMODA, 2003: Qualifyingimg tropical spectra for clear sky. – J. Quant. Spectros.Radia. Transfer 77, 131–148. doi:10.1016/S0022-4073(02), 00083-3.
MASIELLO, G., C. SERIO, V. CUOMO, 2004: Exploitingquartz spectral signature for the detection of cloud-affectedsatellite infrared observations over african desert areas. –Appl. Optics 43, 2305–2315. doi:10.1364/AO.43.002305.
MASIELLO, G., C. SERIO, A. CARISSIMO, G. GRIECO, M.MATRICARDI, 2009: Application of u-IASI to IASI:retrieval products evaluation and radiative transfer consis-tency. – Atmos. Chem. Phys. 9, 8771–8783. doi:10.5194/acp-9-8771-2009.
MASIELLO, G., C. SERIO, P. ANTONELLI, 2012: Inversion foratmospheric thermodynamical parameters of IASI data inthe principal components space. – Quart. J. Roy. Meteor.Soc. 138, 103–117. doi:10.1002/qj.909.
NASH, J., T. OAKLEY, H. VOMEL, L. WEI, 2010: WMOintercomparison of high quality radiosonde systems. –Technical report, WMO, http://www.wmo.int/pages/prog/www/IMOP/publications/ IOM-107_Yangjiang/IOM-107_Yangjiang.zip.
NIELL, A.E., A.J. COSTER, F.S. SOLHEIM, V.B. MENDES,P.C. TOOR, R.B. LANGLEY, C.A. UPHAM, 2001:
Meteorol. Z., 22, 2013 G. Masiello et al.: Comparison of IASI water vapour products 485
Unauthorized distribution of this copyrighted material is strictly forbidden!Downloaded from www.schweizerbart.de

Comparison of measurements of atmospheric wet delay byradiosonde, water vapor radiometer, GPS, and VLBI. – J.Atmos. Ocean. Technol. 18, 830–850.
POUGATCHEV, N., T. AUGUST, X. CALBET, T. HULTBERG, O.ODULEYE, P. SCHLUSSEL, B. STILLER, K. St. GERMAIN, G.BINGHAM, 2009: IASI temperature and water vaporretrievals – error assessment and validation. – Atmos.Chem. Phys. 9, 6453–6458.
REVERCOMB, H.E., D.D. TURNER, D.C. TOBIN, R.O.KNUTESON, W.F. FELTZ, J. BARNARD, J. BOSENBERG, S.CLOUGH, D. COOK, R. FERRARE, J. GOLDSMITH, S.GUTMAN, R. HALTHORE, B. LESHT, J. LILJEGREN, H.LINNE, J. MICHALSKY, V. MORRIS, W. PORCH, S.RICHARDSON, B. SCHMID, M. SPLITT, T. VAN HOVE, E.WESTWATER, D. WHITEMAN, 2003: The Arm Program’sWater Vapor Intensive Observation Periods. – Bull. Amer.Meteor. Soc. 84, 217–236.
RICHARD, E., M. GRZESCHIK, S. BIELLI, C. FLAMANT, C.CHAMPOLLION, C. KIEMLE, 2010: Assimilation of air-borne lidar water vapor observations during COPS. –Proceedings of 14th AMS Conference on MountainMeteorology 9, 8771–8783.
RODGERS, C.D., 1976: Retrieval of atmospheric temperatureand composition from remote measurements of thermalradiation. – Rev. Geophys. 14, 609–624.
RODGERS, C.D., 2000: Inverse Methods for AtmosphericSoudings: Theory and Practice. – World Scientific Pub Co,240 pp.
ROTHMAN, L.S., I.E. GORDON, A. BARBE, D.C. BENNER,P.F. BERNATH, M. BIRK, V. BOUDON, L.R. BROWN, A.CAMPARGUE, J.-P. CHAMPION, K. CHANCE, L.H.COUDERT, V. DANA, V.M. DEVI, S. FALLY, J.-M. FLAUD,R.R. GAMACHE, A. GOLDMAN, D. JACQUEMART, I.KLEINER, N. LACOME, W.J. LAFFERTY, J.-Y. MANDIN,S.T. MASSIE, S.N. MIKHAILENKO, C.E. MILLER, N.MOAZZEN-AHMADI, O.V. NAUMENKO, A.V. NIKITIN, J.ORPHAL, V.I. PEREVALOV, A. PERRIN, A. PREDOI-CROSS,C.P. RINSLAND, M. ROTGER, M. SIMECKOVA, M.A.H.SMITH, K. SUNG, S.A. TASHKUN, J. TENNYSON, R.A.TOTH, A.C. VANDAELE, J. VANDER AUWERA, 2009: TheHITRAN 2008 molecular spectroscopic database. – J.Quant. Spectros. Radia. Transfer 110, 533–572.doi:10.1016/j.jqsrt.2009.02.013.
SAASTAMOINEN, J., 1972a: Contributions to the theory ofatmospheric refraction. – Bulletin Geodesique 105, 279–298.
SAASTAMOINEN, J., 1972b: Introduction to practical compu-tation of astronomical refraction. – Bulletin Geodesique106, 383–397.
SAASTAMOINEN, J., 1973: Contributions to the theory ofatmospheric refraction. – Bulletin Geodesique 107, 13–34.
SCHNEIDER, M., F. HASE, 2011: Optimal estimation oftropospheric H2O and dD with IASI/METOP. – Atmos.Chem. Phys. 11, doi:10.5194/acp-11-11207-2011.
SEEMANN, S.W., E.E. BORBAS, R.O. KNUTESON, G.R.STEPHENSON, H.-L. HUANG, 2008: Development of aGlobal Infrared Land Surface Emissivity Database forApplication to Clear Sky Sounding Retrievals from
Multispectral Satellite Radiance Measurements. – J. Appl.Meteor. Climatol. 47, 108–123. doi:10.1175/2007JAMC1590.1.
SERIO, C., A.M. LUBRANO, F. ROMANO, H. SHIMODA, 2000:Cloud detection over sea surface by use of autocorrelationfunctions of upwelling infrared spectra in the800–900-cm�1 window region. – Appl. Optics 39, 3565–3572. doi:10.1364/AO.39.003565.
SERIO, C., G. MASIELLO, G. GRIECO, 2009: EnvironmentalModelling: New Research, (Finley, P.N. ed.), chapter EOFExpression Analytical Model with Applications to theRetrieval of Atmospheric Temperature and Gas Constitu-ents Concentrations from High Spectral Resolution Infra-red Observations. – Nova Science Publishers, Inc,Hauppauge, NY, 51–88.
TAYLOR, J.P., W.L. SMITH, V. CUOMO, A.M. LARAR, D.K.ZHOU, C. SERIO, T. MAESTRI, R. RIZZI, S. NEWMAN, P.ANTONELLI, S. MANGO, P. DI GIROLAMO, F. ESPOSITO, G.GRIECO, D. SUMMA, R. RESTIERI, G. MASIELLO, F.ROMANO, G. PAPPALARDO, G. PAVESE, L. MONA, A.AMODEO, G. PISANI, 2008: Eaquate – an internationalexperiment for hyper-spectral atmospheric sounding vali-dation. – Bull. Amer. Meteor. Soc. 89, 203–218.
TETENS, O., 1930: Ueber einige meteorologische Begriffe. –Z. Geophys. 6, 297–309.
TURNER, D.D., R.A. FERRARE, L.A.H. BRASSEUR, W.F.FELTZ, T.P. TOOMAN, 2002: Automated Retrievals ofWater Vapor and Aerosol Profiles from an OperationalRaman Lidar. – J. Atmos. Ocean. Technol. 19, 37–50.
WAGNER, G., V. WULFMEYER, A. BEHRENDT, 2011:Detailed performance modeling of a pulsed high-powersingle-frequency ti:sapphire laser. – Appl. Optics 50,5921–5937. doi:10.1364/AO.50.005921.
WAGNER, G., A. BEHRENDT, V. WULFMEYER, F. SPATH, M.SCHILLER, 2013: High-power Ti:sapphire laser at 820 nmfor scanning ground-based water-vapor differential absorp-tion lidar. – Appl. Optics 52, 2454, doi:10.1364/AO.52.002454.
WANG, K., Z. WAN, P. WANG, M. SPARROW, J. LIU, X.ZHOU, S. HAGINOYA, 2005: Estimation of surface longwave radiation and broadband emissivity using moderateresolution imaging spectroradiometer (modis) land surfacetemperature/emissivity products. – J. Geophys. Res. 110,D11109. doi:10.1029/2004JD005566.
WHITEMAN, D.N., 2003: Examination of the traditionalraman lidar technique. I: Evaluating the temperature-dependent lidar equations. – Appl. Optics 42, 2571–2592.
WULFMEYER, V., A. BEHRENDT, 2007: COPS field reportv2.1, with contribution of G. Adrian, D. Althausen, F.Aoshima, J. van Baelen, C. Barthlott, H.-S. Bauer, A.Blyth, C. Brandau, U. Corsmeier, G. Craig, S. Crewell, G.Dick, M. Dorninger, Y. Dufournet, G. Ehret, R.Engelmann, C. Flamant, T. Foken, C. Hauck, P. DiGirolamo, H. Graßl, M. Grzeschik, J. Handwerker, M.Hagen, R. M. Hardesty, C. Hauck, W. Junkermann, N.Kalthoff, C. Kiemle, C. Kottmeier, L. Krauss, C. Long, J.Lelieveld, F.Madonna,M.Miller, S.Mobbs, B. Neininger, S.Pal, G. Peters, M. Radlach, E. Richard, M. Rotach, H.
486 G. Masiello et al.: Comparison of IASI water vapour products Meteorol. Z., 22, 2013
Unauthorized distribution of this copyrighted material is strictly forbidden!Downloaded from www.schweizerbart.de

Russchenberg, P. Schlussel, U. Schumann, C. Simmer, R.Steinacker, D. Turner, S. Vogt, H. Volkert, T. Weckwerth, H.Wernli, A. Wieser, C. Wunraum. – COPS, https://www.uni-hohenheim.de/spp-iop/documents/COPSFieldReport2.pdf.
WULFMEYER, V., J. BOSENBERG, 1996: Single-mode oper-ation of an injection-seeded alexandrite ring laser forapplication in water-vapor and temperature differentialabsorption lidar. – Optics Letters 21, 1150–1152.
WULFMEYER, V., J. BOSENBERG, 1998: Ground-baseddifferential absorption lidar for water-vapor profiling:Assessment of accuracy, resolution, and meteorologicalapplications. – Appl. Optics 37, 3825–3844.
WULFMEYER, V., H. BAUER, P. DI GIROLAMO, C. SERIO,2005: Comparison of active and passive water vaporremote sensing from space: An analysis based on thesimulated performance of IASI and space borne differen-tial absorption lidar. – Remote Sens. Environ. 95, 211–230.
WULFMEYER, V., A. BEHRENDT, H.-S. BAUER, C. KOTTMEIER,U. CORSMEIER, A. BLYTH, G. CRAIG, U. SCHUMANN, M.HAGEN, S. CREWELL, P. Di GIROLAMO, C. FLAMANT, M.MILLER, A. MONTANI, S. MOBBS, E. RICHARD, M.W.ROTACH,M.ARPAGAUS,H.RUSSCHENBERG, P. SCHLUSSEL,M. KONIG, V. GARTNER, R. STEINACKER, M. DORNINGER,D.D. TURNER, T. WECKWERTH, A. HENSE, C. SIMMER,2008: The convective and orographically induced precipita-tion study. – Bull. Amer. Meteor. Soc. 89, 1477–1486.
WULFMEYER, V., C. FLAMANT, A. BEHRENDT, A. BLYTH, A.BROWN, M. DORNINGER, A. ILLINGWORTH, P. MASCART,
A. MONTANI, T. WECKWERTH, 2011a: Advances in theunderstanding of convective processes and precipitationover low-mountain regions through the convective andorographically-induced precipitation study (COPS). –Quart. J. Roy. Meteor. Soc. 137, 1–2. doi:10.1002/qj.799.
WULFMEYER, V., A. BEHRENDT, C. KOTTMEIER, U.CORSMEIER, C. BARTHLOTT, G.C. CRAIG, M. HAGEN,D. ALTHAUSEN, F. AOSHIMA, M. ARPAGAUS, H.-S.BAUER, L. BENNETT, A. BLYTH, C. BRANDAU, C.CHAMPOLLION, S. CREWELL, G. DICK, P. DI GIROLAMO,M. DORNINGER, Y. DUFOURNET, R. EIGENMANN, R.ENGELMANN, C. FLAMANT, T. FOKEN, T. GORGAS, M.GRZESCHIK, J. HANDWERKER, C. HAUCK, H. HOLLER, W.JUNKERMANN, N. KALTHOFF, C. KIEMLE, S. KLINK, M.KONIG, L. KRAUSS, C.N. LONG, F. MADONNA, S. MOBBS,B. NEININGER, S. PAL, G. PETERS, G. PIGEON, E.RICHARD, M.W. ROTACH, H. RUSSCHENBERG, T.SCHWITALLA, V. SMITH, R. STEINACKER, J. TRENTMANN,D.D. TURNER, van J. BAELEN, S. VOGT, H. VOLKERT, T.WECKWERTH, H. WERNLI, A. WIESER, M. WIRTH, 2011b:The convective and orographically-induced precipitationstudy (COPS): the scientific strategy, the field phase, andresearch highlights. – Quart. J. Roy. Meteor. Soc. 137,3–30.
YAN, X., V. DUCROCQ, G. JAUBERT, P. BROUSSEAU, P. POLI,C. CHAMPOLLION, C. FLAMANT, K. BONIFACE, 2009: Thebenefit of gps zenith delay assimilation to high-resolutionquantitative precipitation forecasts: A case-study fromcops IOP 9. – Quart. J. Roy. Meteor. Soc. 135, 1788–1800.
Meteorol. Z., 22, 2013 G. Masiello et al.: Comparison of IASI water vapour products 487
Unauthorized distribution of this copyrighted material is strictly forbidden!Downloaded from www.schweizerbart.de
Copyright © 2022 FDOKUMEN