Monomethylamine–water vapour absorption refrigeration system

1
PCCP, in press:
Field exposed water in a nanopore: liquid or vapour?
Dusan Bratkoa,b*, Christopher D. Dauba and Alenka Luzara*
aDepartment of Chemistry, Virginia Commonwealth University, Richmond, VA 23284-2006, [email protected] bDepartment of Chemical Engineering, University of California, Berkeley, CA 94720-1462, [email protected]
Field-exposed water behaviour in hydrophobic confinement confirms classical electrostriction
in nanoscale channels and nanoporous materials.

2
Abstract
We study the behavior of ambient temperature water under the combined effects
of nanoscale confinement and applied electric field. Using molecular simulations we
analyze the thermodynamic causes of field-induced expansion at some, and contraction at
other conditions. Repulsion among parallel water dipoles and mild weakening of
interactions between partially aligned water molecules prove sufficient to destabilize the
aqueous liquid phase in isobaric systems in which all water molecules are permanently
exposed to a uniform electric field. At the same time, simulations reveal comparatively
weak field-induced perturbations of water structure upheld by flexible hydrogen bonding.
In open systems with fixed chemical potential, these perturbations do not suffice to offset
attraction of water into the field; additional water is typically driven from unperturbed
bulk phase to the field-exposed region. In contrast to recent theoretical predictions in the
literature, our analysis and simulations confirm that classical electrostriction characterizes
usual electrowetting behavior in nanoscale channels and nanoporous materials.
1. Introduction
Because of their high dipole and quadrupole moments, water molecules feature
strong interactions with electrostatic fields next to charged or polar solutes, and are
attracted to field-exposed regions in electrowetting experiments1. Attractive interactions
of water with electric field imply partial alignment of molecular dipoles with the
direction of the field. For freely rotating molecules, the competition between the energy
reduction and the loss of orientational entropy upon alignment is described by the well
known Langevin equation. However, in liquid water, orientations of water molecules are
also subject to angle restrictions associated with hydrogen bonding. In case of aqueous
confinements, additional angular preferences are imposed by water’s strong tendency to
minimize the loss of hydrogen bonds at the interface2-5. Hydrogen bonding between water

3
molecules favors near-parallel dipole orientations relative to the interface3, 6-8, an
arrangement that is also compatible with the general preference of parallel dipoles for
vertical as opposed to horizontal coordination9-11. The structural behavior of water under
combined effects of applied field and confinement is therefore quite complex and can
ultimately depend on the choice of fixed system variables such as the number of particles,
N, or chemical potential, µ. We pay particular attention to two situations addressed in
recent theoretical studies12-17:
a) Confined or bulk mass-conserving isobaric system under uniform external field
Eo=|Eo|. Here, the number of bulk molecules N in the field is fixed as are pressure and
temperature (N,p,T) . Volume V fluctuates around an average <V>, which may depend on
the strength of the applied electric field Eo. We describe this variation by
!<V >
!Eo
= !
!Eo
("-1
Vje#Ui
kBT#pVj
kBT
states i
$Vj
$ ) = - (kBT )#1(<V
!U
!Eo
>#<V ><!U
!Eo
>)
where " = e#Ui
kBT#pVj
kBT
i
$Vj
$ (1)
Each of states i corresponds to a distinct configuration [rN,ΩN] consisting of positions r
and orientations Ω of all N particles and the angle brackets denote the ensemble average.
The slope !U / !E
o, related to the ease with which the molecules align with the field, is
expected to increase with fluid dilution. Here, all N molecules are already exposed to the
field and any structural rearrangement takes place only to find the best compromise
between molecular alignment with the field and orientation-dependent interactions
among molecules. The density of an isobaric polar fluid is therefore expected to decrease
with the strength of the applied field Eo.
Classical electrowetting experiment, however, typically involve transfer of water
to a field-exposed region to maximize direct water-field interaction18. Pressure and
density are therefore not fixed in the second situation (b) we consider:

4
b) Isochoric aqueous confinement exposed to applied field Eo and open to the
exchange of molecules with surrounding field-free (|Eo|=0) reservoir of either liquid
water or, equivalently, a water vapor phase at vapor pressure corresponding to given
temperature T. The system is described by grand canonical (µ,V,T) statistics with fixed
volume (V), temperature, and chemical potential (µ). The average number of molecules is
given by
< N > = !-1
Ne
"Ui
kBT+
µN
kBT
states i
#N
# with ! = e
"Ui
kBT+
µN
kBT
i
#N
# (2)
Electric field E affects <N> through orientation-dependent interaction with molecular
dipoles µ i reflected in potential energies Ui, leading to:
!N / !Eo =µ
kBT< N
2 ! (Eo cos!N ,i )
!Eo
>"< N >< N! (Eo cos!N ,i )
!Eo
>#
$
%%%%
&
'
(((((=
=µ
kBT< N
2cos!N ,i ) >"< N >< Ncos!N ,i ) >( )
(3)
where µ=|µ |. cos!
N ,i is the value of µEo/|µEo| averaged over all N molecules in the
system at a specified configuration i. Because cos!
N ,i! 0 for all representative
configurations i, the product (Ncos!
N ,i) is usually a monotonically increasing function
of N although cos!
N ,ialone can, at certain conditions, be negatively correlated with the
density. The density of a dipolar liquid in an open system is therefore generally expected
to rise with increasing field strength Eo as is predicted by continuum analyses15, 19, 20 and
seen in electrostriction experiments.
5
The opposite trend, (!N / !E
o)µVT < 0 , would only be possible in case of a
dramatic rise in orientational polarizability of the molecules upon dilution, an idea
explored in a recent mean-field analysis17 of a polar fluid’s phase behavior in electric
field. In that study17, an Ising model of a water-like fluid was used to consider a liquid-
vapor phase transition in a system where intermolecular attractions were deemed
incompatible with molecular dipole alignment with the field. Over an interval of
intermediate field strengths, the system featured a density drop akin to field-induced
capillary evaporation reported in an earlier simulation of confined water15. The majority
of simulation studies of field-exposed confined water, including new open ensemble
simulations in this work, however, conform to classical electrostriction behavior with
water populations increased in the field12, 14, 16, 21, 22. These repeated observations lead us
to question the hypothesis17 of strongly negative correlation between attractive water-
water interactions (dominated by hydrogen bonding), and water’s ability to align with the
applied field.
In the present study we explore the issue by Monte Carlo and Molecular
Dynamics simulations whereby we directly monitor water structure and the extent of
hydrogen bonding as the molecules become increasingly aligned by the applied field. We
consider the range of applied field strengths Eo=Eεr up to 1 VÅ-1. Due to water
polarization, the actual field strength E~Eoεr-1 remains below 0.1 VÅ-1, spanning the
range of fields detectable near charged electrodes, ion channels, ionic biomolecules or
assemblies21, 23-32. Here and throughout the paper, Eo=Eεr stands for the unscreened
applied field that does not include the field reduction due to water polarization
ρµ< cos!
N ,i> . εr is relative permittivity and ρ water number density. Within the above
range of fields and concomitant dipole-field alignment < cos!
N ,i> up to ~0.8, we do not
observe any significant field-induced changes in water hydrogen bond populations or in
atom-atom distribution functions in the bulk phase. In narrow confinements, we observe
only slight changes limited to the first solvation layer next to confinement walls. By-and-
large, our calculations confirm the considerable resilience of the hydrogen-bond network
6
under aligning electric field as reported in previous studies27, 29, 33, 34. This behavior is
rationalized by the flexibility of hydrogen-bond angles. For ambient temperature (~300
K), conventional hydrogen-bond definitions35 envisage about 30 degree tolerance from
the zero-temperature bond angle. Calculations we describe below demonstrate this
flexibility suffices to accommodate relatively high alignment of aqueous dipoles without
serious penalties in the number and free energies of hydrogen bonds.
2. Density changes of bulk and confined water under electric field
To establish a common reference, we first performed molecular simulations
analogous to those of England et al17, who studied the density of field-exposed bulk
water at fixed (N,p,T) using molecular dynamics with a 1 nm cutoff of intermolecular
interactions. The choice of truncation is motivated by the interest in the behavior of
confined water where the omission of long-ranged forces mimics confinement effects
on water-water correlations17. We use Extended Simple Point Charge model of
water36 (SPC/E) employed in previous related studies14-16. Fields we consider,
E=O(10-2-10-1)VÅ-1 (Eo!1 VÅ-1), are weak compared to those around simple ions and
do not warrant37 the use of polarizable models of water38, 39. In molecular dynamics
simulations we performed with the DL_POLY package40, the average pressure was
set to the ambient pressure by a Berendsen barostat referring to the average of
pressure tensor components. In simultaneous Monte Carlo calculations, interpolation
from a series of (NVT) calculations was used to identify densities supporting the
original pressure after the introduction of the field. Identical calculations were then
repeated in nanosized planar confinements41 with the wall/water interaction described
by the (9-3) integrated Lennard-Jones potential3, 6, 42, 43. Our model system has been
described in detail elsewhere16, 44, 45. In summary, it consists of a thin slab of water
confined between two continuous apolar plates. The system is periodic in the x and y
directions. In most calculations, we used smooth 1 nm spherical truncation of
intermolecular potential6. In a subset of calculations, these results were validated by
using the slab-adapted Ewald sum method described in ref. 46. The slab of water is

7
considered to be in equililbrium with an outside reservoir of bulk water. We impose
this condition by computing the chemical potential µ required to produce atmospheric
pressure in the bulk system. When a field is applied across the plates, the system’s
chemical potential remains unchanged; in other words, the bulk reservoir is not
considered to be exposed to the field.
We considered three different strengths of wall/water Lennard-Jones energy
parameter, associated with water contact angles θc=135, 93, and 69o. In a separate study
we show8 these angles correspond to water-wall site Lennard-Jones coupling parameters
ε =0.648, 3.45 and 5.0 kJ mol-1, respectively. Distance D was set at 16.4 Å, the smallest
separation that still avoids capillary evaporation42, 45, 47, 48 at the highest of the three
contact angles considered. In Fig. 1, we present water density relative to that of a field-
free system (Eo=0) as a function
Fig. 1 Effect of applied electric field E0 on density of SPC/E water (relative to that observed in the absence of applied field) in bulk phase (circles) and in a planar confinement of width D=16.4 Å and wall/water contact angle θc=135o
(diamonds). Solid symbols and lines correspond to open systems with fixed chemical potential (µVT) and open symbols represent points with fixed pressure (NpT) for pzz(Ε0) = pzz (0) ±20 atm. In the confinement, the field points in z direction (normal to the walls). Temperature is 298 K. of field strength Eo. We compare effects of applied field on two systems, bulk and
confined, in each system monitoring the density change upon introduction of the field
under two different, (fixed chemical potential or pressure) scenarios. In agreement with
8
the mean-field prediction17 and our present analysis (Eq. 1), attractions among a fixed
number of particles are loosened upon introduction of competing field-induced molecular
reorientation. The critical temperature of water is hence lowered in electric field. At fixed
pressure, increasing applied field results in gradual expansion and eventual liquid/gas
phase separation. Such evaporation was actually observed in ref.17 and possibly in ref.15,
49. Our (NpT) Molecular Dynamics calculations display a similar density depression
resembling the onset of evaporation but we do not observe an actual phase transition in
the course of up to ns simulation runs. Barriers to homogeneous vapor nucleation may
have played a role. Activation barrier issues were avoided in our Monte Carlo
calculations with preset densities. Drawing a curve connecting densities with fixed
pressure (or selected pressure tensor component) at different field strengths, our Monte
Carlo calculations show a trend toward expansion and eventual liquid-to-vapor transition
in both, bulk and confined systems at isobaric (NpT) conditions.
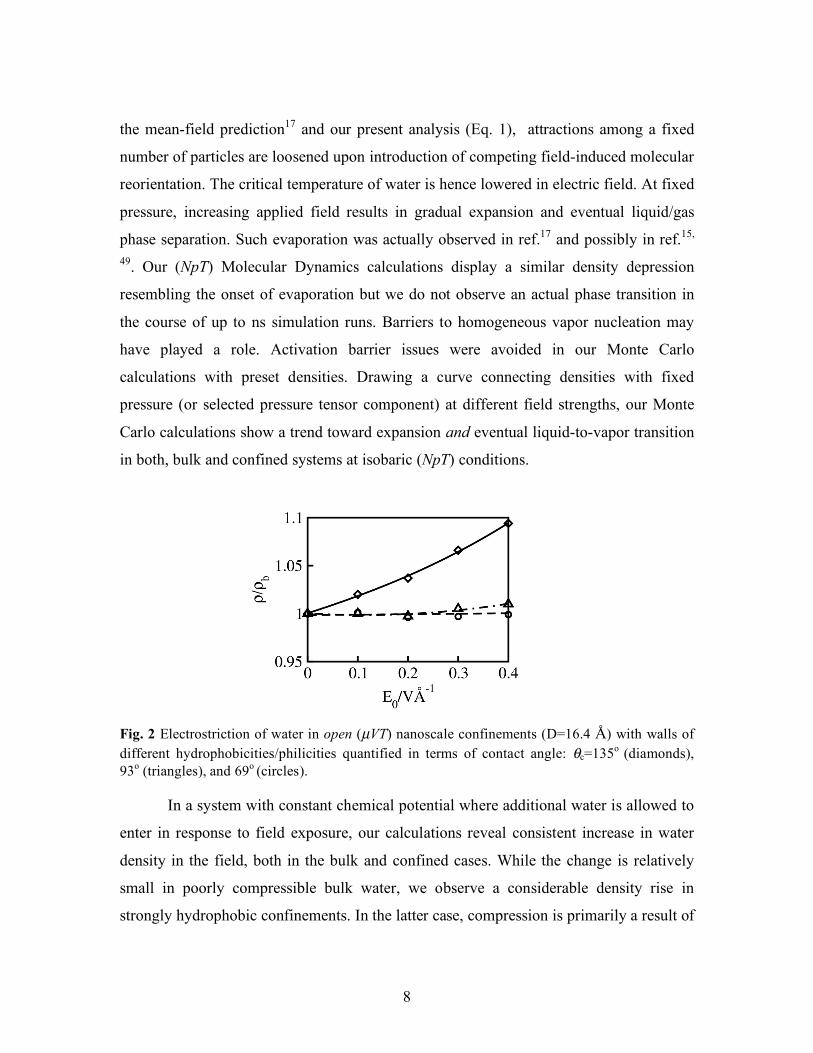
Fig. 2 Electrostriction of water in open (µVT) nanoscale confinements (D=16.4 Å) with walls of different hydrophobicities/philicities quantified in terms of contact angle: θc=135o (diamonds), 93o (triangles), and 69o (circles). In a system with constant chemical potential where additional water is allowed to
enter in response to field exposure, our calculations reveal consistent increase in water
density in the field, both in the bulk and confined cases. While the change is relatively
small in poorly compressible bulk water, we observe a considerable density rise in
strongly hydrophobic confinements. In the latter case, compression is primarily a result of

9
filling up depleted surface layers next to hydrophobic walls50, 51. In Fig. 2, we compare
the dependencies of the density on the field strength for water confined in pores of width
16.4 Å for three different contact angles, θc=135o, 93o, and 69o. Only for strongly
hydrophobic walls (θc=135o) we observe significant electrostriction. The density
increases only slightly in pores with intermediate or hydrophilic walls. This behavior
conforms with calculated compressibility dependence on the applied field for the three
cases shown in Fig. 3. In the absence of the field, water between strongly hydrophobic
plates appears much more compressible than in the bulk phase42, 52. This effect is absent
at lower contact angles (θc=93o or 69o) where little or no surface density depletion takes
place. Applied field increases the apparent hydrophilicity. Upon increasing the field
strength, compressibilities in all three systems asymptotically converge toward that of the
bulk phase.
Fig. 3 Reduced compressibilities in aqueous confinements of width D=16.4 Å with walls of different contact angles: θc=135o (diamonds), 93o (triangles), and 69o (circles) in the presence of applied electric field E0. The difference between the observed behaviors of systems at constant-pressure
(bottom portion of Fig. 1) and constant chemical potential (upper portion in Fig. 1)
persisted in additional calculations for stronger fields of up to several V Å-1 (not shown).
In open systems, the weakening of intermolecular water-water attraction upon molecular
alignment could not offset the free-energetic incentive to drive the molecules into the
field-exposed region. To substantiate this assertion, we monitored explicitly the
10
contributions to molecular energies due to dipole-field interaction, (µEcos!
N ,i) , and
compared them with intermolecular interactions and specifically with interaction due to
hydrogen bonding.
3. Interactions among water molecules aligned by applied electric field
In Table I, we list calculated energies and average numbers of hydrogen bonds per
water molecule in bulk water, all as functions of applied field strength. For the analysis of
water hydrogen bonding we use our usual definition based on geometric criteria35: two
water molecules can be either bonded or not bonded depending upon their distance
between an oxygen atom acting as proton acceptor and a hydrogen of the molecule whose
oxygen atom acts as a proton donor, i. e. OH intermolecular distance, and the angle
between the O-O vector and the covalent O-H bond. The numerical cutoff value we use
for rOHc = 2.45 Å corresponds to the first minimum in the SPC/E water radial distribution
function, gOH(r). The value of the cutoff angle αc = 300 is the angle at which the average
number of hydrogen bonds per water molecule is within 10% of the asymptotic value for
large αc 35, 53. Interestingly, our calculations under electric field show this threshold value
not to change up to field strengths of 1.5 VÅ-1 revealing the remarkable plasticity of the
water’s hydrogen bond network. In a preceding study54, we presented a comparison
between field effects on average numbers of hydrogen bonds determined by both the
geometric35 and energetic55 criteria. Identical effects were found using either method,
hence only the geometric definition is applied here.

11
Table I. Average energy per water molecule, interaction of a molecular dipole with the applied field, (Uf), number of hydrogen bonds per water molecule (either for the whole system, or only for waters in interfacial regions, ± z), Coulombic (UHB
c) and total (UHBt) interaction between a
pair of hydrogen-bonded molecules, and the average angle between molecular dipoles and the direction of the field,
cos!
N ,i. Statistical error bars are below ± 1 at the last digit reported.
Bulk phase Eo
VÅ-1
<U >
NkBT
<U f >
NkBT
<nHB>
<UHB
C>
NkBT
<UHB
t>
NkBT
cos!
N ,i
0 -19.3 0 3.53 -10.6 -7.8 0
0.2 -19.5 -0.73 3.53 -10.4 -7.6 0.19
0.4 -20.6 -2.9 3.53 -10.4 -7.7 0.37
0.6 -22.2 -6.3 3.54 -10.2 -7.4 0.55
0.8 -24.9 -10.8 3.54 -9.8 -7.0 0.71
1.0 -28.2 -15.4 3.57 -9.6 -6.8 0.80
Confinement (D=16.4 Å)
Eo
VÅ-1
<U >
NkBT
<U f >
NkBT <nHB>,
all
<nHB>,
-z
<nHB>,
+z
<UHB
C>
NkBT
<UHB
t>
NkBT
cos!
N ,i
0 -18.3 0 3.29 2.57 2.57 -10.6 -7.8 0
0.2 -18.6 -0.58 3.31 2.80 2.52 -10.7 -7.9 0.153
0.4 -19.6 -2.2 3.34 2.95 2.58 -10.5 -7.7 0.29
0.6 -20.9 -4.6 3.33 2.96 2.60 -10.4 -7.7 0.407
0.8 -23.1 -8.3 3.30 2.89 2.63 -10.2 -7.4 0.55
Confinement (D=16.4 Å) with 3D slab-corrected Ewald sums46.
Eo
VÅ-1
<N>
<U >
NkBT
<U f >
NkBT <nHB>
<UHB
C>
NkBT
<UHB
t>
NkBT
cos!
N ,i
0 168.8 -17.2 0 3.26 -10.6 -8.0 0
0.2 170.1 -17.6 -0.37 3.28 -10.7 -8.0 0.096
0.4 174.9 -18.7 -1.40 3.29 -10.6 -7.9 0.183
0.6 180.0 -19.7 -2.99 3.31 -10.6 -7.8 0.261
0.8 185.8 -20.8 -4.87 3.32 -10.6 -7.8 0.32
1.0 189.5 -22.1 -7.26 3.32 -10.5 -7.7 0.38
12
Our calculations reveal a strong overall reduction (increase in absolute value) of
molecular energies upon increasing the field strength Eo. The energy reduction is weaker
than the average dipole interaction with the applied field, Uf, primarily due to the
mitigating effect of water polarization opposing the applied field. We also include
calculated Coulombic and total interaction energies for pairs of H-bonded molecules.
These data show that any change in these energies arises primarily from the Coulombic
part.
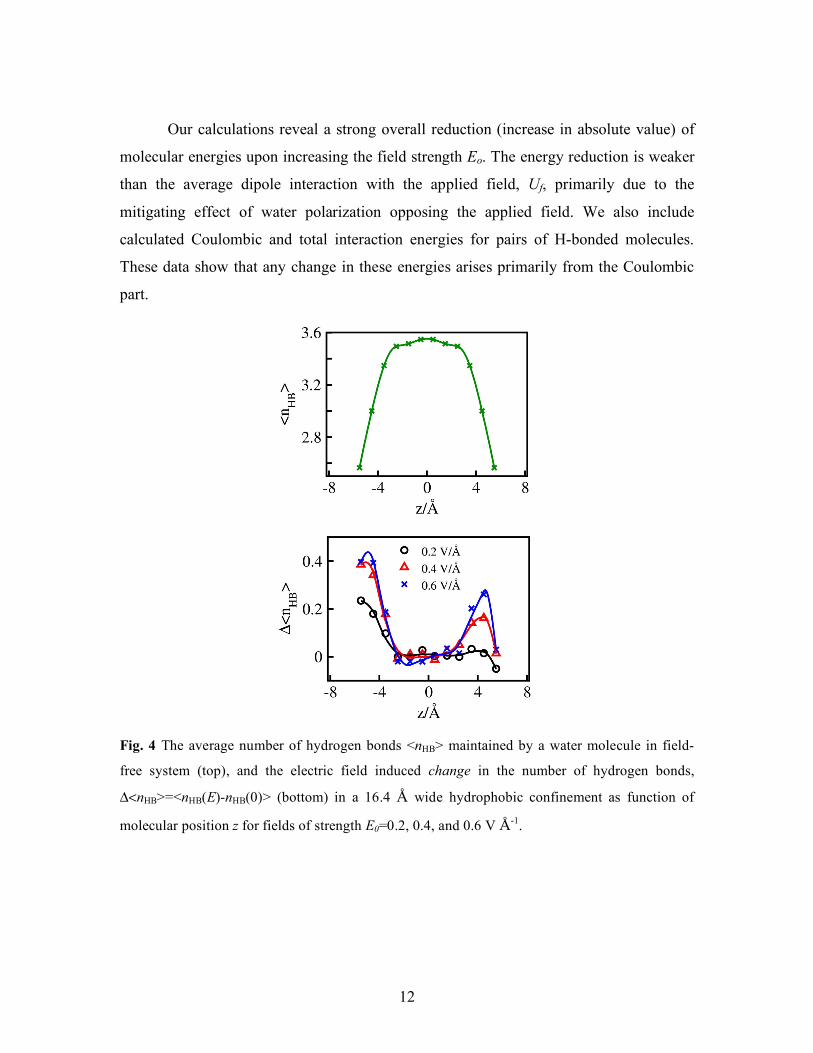
Fig. 4 The average number of hydrogen bonds <nHB> maintained by a water molecule in field-
free system (top), and the electric field induced change in the number of hydrogen bonds,
Δ<nHB>=<nHB(E)-nHB(0)> (bottom) in a 16.4 Å wide hydrophobic confinement as function of
molecular position z for fields of strength E0=0.2, 0.4, and 0.6 V Å-1.

13
For reported field strengths of up to 1 V Å-1, as well as for much higher fields (not
shown), the prevalence and strength of hydrogen bonding are only weakly related to
molecular alignment (measured in terms of cos!
N ,i). In confined systems, the average
number of bonds per molecule can actually increase upon application of the field, the
difference being noticeable especially in interfacial layers next to confinement walls, Fig.
4. Because of water asymmetry, the change depends on the direction of the field relative
to the surfaces, leading to a notable asymmetry in hydrogen bond density profiles across
the confinement. Concomitant asymmetries in density profiles have been pointed out by a
number of groups14-16.
Small changes in hydrogen-bond populations upon molecular alignment with the
field conform with the observed insensitivity of atom-atom (O-O, O-H and H-H) radial
distribution functions g(r) to the field in the range of our interest (Eo !1 V Å-1). For
these fields, the changes of bulk g(r)-s are insignificant and are hence not shown. (An
onset of the transition from tetrahedral toward tightly-packed, highly coordinated
“electrofrozen” structure27, 56, 57 can be observed at stronger fields of about 2 V Å-1 and
higher).
More subtle changes in hydrogen bond network, including any deviations from
tetrahedrality might be reflected in the distributions of the O-O-O angles in triplets of
nearest-neighbor molecules. These distributions measure the plasticity of the network and
characterize fluctuations around the apparent tetrahedral coordination58, 59. However, our
results, collected in Fig. 5, show no significant changes in (O-O-O) angle distributions
either.

14
Fig. 5 Probability distributions of oxygen triplet angle at different field strengths. Triplets are enumerated out of all nearest neighbours (rOO < 3.4 Å) of each water molecule, where the central water always forms the apex of the angle.
Under additional rotational restrictions in the field, small differences in hydrogen
bond energies shown in Table I could still be compatible with more significant changes in
corresponding free energies. If so, however, the weakening of hydrogen-bond free
energies would reflect in reduced bond populations. We do not observe such reductions
in our simulations. Despite mild weakening of water-water interactions, in open ensemble
cases, this trend is more than offset by the attraction of dipolar water molecules into the
field region. From Eq. (3), applied to high fields Eo, it is obvious that the density will
increase monotonically when dipoles reach the strong-alignment limit. Physically, this is
explained by the fact that the repulsion between aligned dipoles reaches a plateau value
whereas the dipole-field energies continue to fall in proportion to field strength Eo. In an
open system, electrostriction therefore represents the general behavior; if density
depression would occur, it would necessarily feature a transient dependence on Eo as
predicted in Fig. 2 of ref.17. Our present calculations, as well as simulation studies by
other groups27, 29, 33, 60, however, reveal relatively mild weakening of hydrogen bonds due
to the application of the field. This weakening may suffice to trigger a liquid to vapour
transition of water at constant pressure and fixed number of molecules in the field, but
not in an open system where evaporation would entail transfer of water from the field
region to field-free surroundings.

15
Simulation at constant chemical potential appears the natural choice to mimic
small pore electrowetting. This can be readily implemented in (Grand Canonical) Monte
Carlo simulations12, 16. An alternative setup, particularly suitable in Molecular Dynamics
studies involves a simulation of both the confinement and bulk, field-free environment
(reservoir) in equilibrium with each other14, 15. Maintaining constant pressure in the bulk
phase will fix the chemical potential. However, the use of barostat algorithms requires
additional care as pressure can be strongly nonuniform, anisotropic, and even
discontinuous in case of discontinuous15 electric field. The latter problem is avoided if the
field stems from internal charges or is introduced as a smooth function of position.
4. Effect of potential cutoff and boundary conditions
Finally we mention the comparatively strong dependence of simulated water
polarization by the field on potential cutoff and applied boundary conditions. This
dependence has to be kept in mind in discussing the field effect on water behavior in
context of molecular simulation. In Fig. 6, we collect the data for the average molecular
alignment (quantified in terms of <cosθ>) as a function of field strength Eo for different
Fig. 6 Simulated average alignment of water dipoles in bulk (open symbols) and confined (solid symbols) SPC/E water. Bulk data are from Ewald sum calculations carried out in this work, both with conducting (red) and vacuum (green) boundary conditions, and by using 10 Å spherical truncation of water-water potentials (open blue circles). Solid blue and green symbols represent respectively cutoff and slab corrected 3-dimensional Ewald sum46 results for planar, 16.4 Å wide confinement, both from this work. The black symbols and lines describe Ewald sum results for

16
electric field exposed water from other labs: bulk water with conducting boundaries from ref.27 (open circles) and ref.14 (open diamonds; note that the applied field -- our E0 -- in bulk simulations is <E> in ref. 14, while their <E0> includes an effective screening contribution), confined water in a 16.4 Å wide rectangular confinement surrounded by field-free reservoir from ref.15 (solid circles), or in cylindrical, 20 Å wide ion channels, surrounded partially by channel walls and open to the bulk phase, ref.14 (solid triangles).
conditions. To illustrate the issue, we include data from refs.14, 15, 27, and over a range of
fields much broader than considered in the bulk of this work. We note the sensitivity of
the polarization response of the water dipoles to the use of different boundary conditions
(vacuum vs tin-foil) in the results of Ewald sum calculations when electric field is
applied. With conducting (“tin foil”61) boundaries, the favorable energy gained by
aligned dipoles causes a much stronger response to the field compared with calculations
with a spherical potential cutoff. Conversely, the use of vacuum boundaries introduces a
surface correction term61 which accounts for the presence of a depolarized surface in
contact with surrounding vacuum. In confinement, this leads to weaker polarization than
seen in the cutoff calculation. For our particular choice of the cutoff distance and system
size, polarization of bulk water observed using spherical cutoff was similar to that
obtained from Ewald sum calculation with the vacuum boundary condition. The choice of
boundary terms must be motivated by careful consideration of the experimental
conditions the simulation is meant to mimic. We find the vacuum-boundary correction to
be best suited to Ewald sum studies of field-exposed bulk water, and related slab-
corrected Ewald sums for the confined water system46 to describing field-enhanced
wetting of nonpolar nanopores.
However, because of the high dielectric constant of water, at moderate fields
confined systems surrounded by field-free water reservoirs (solid black symbols in Fig.
6) better resemble situations subject to tin-foil boundary conditions.
At otherwise identical conditions, introduction of Ewald sums generally results in
stronger dielectric screening of applied field and hence in weaker orientational
polarization (lower <cosθ>; See the last column in Table I). This, in turn, means weaker
repulsion of parallel molecular dipoles62. The difference conforms with the observed
17
phase behavior of England et al17. They show that at constant pressure conditions (NpT),
bulk TIP4P water, modeled using pair potential truncated at 1 nm expands under electric
field, but contracts when cutoff is removed and Ewald sums are used17. We observe the
same trends in isobaric simulations with the SPC/E model of water. As already pointed
out17, potential truncation mimics conditions representative of water under confinement
and Ewald summation pertains to an extended bulk phase.
A qualitative implication of the above comparisons, relevant to our calculations,
is that truncation of pair potentials is comparatively more conducive to field-induced
isobaric expansion and possibly evaporation. The consistent electrostriction we observe
in open ensemble (µVT) calculations therefore cannot be attributed to the use of potential
cutoff. To remove any uncertainty, we verify this assertion in direct slab-corrected 3-
dimensional Ewald sum46 calculations for our confined systems using GCMC simulation.
Average numbers of molecules, <N>, observed in confinement runs listed in the bottom
part of Table I, and represented by solid green symbols in Fig. 6, as a function of applied
field strength Eo confirm monotonic electrostriction behavior for (µVT) conditions,
independent of the use of either potential truncation or Ewald summation.
5. Concluding remarks
In conclusion, we revisit the problem of simulating confined water in an electric field,
stressing the importance of open ensembles, and the ability of water to maintain hydrogen
bonding despite molecular orientation in the field. We find water hydrogen-bond interactions
surprisingly compatible with partial molecular alignment under applied electric field. As a
result, water molecules in bulk and confined phases alike, can sustain much of their mutual
attractions while the field simultaneously polarizes them. At constant pressure conditions,
weakening of intermolecular attractions can result in expansion of the fluid and possible
liquid-to-vapor transition, consistent with the mean-field predictions of Pande and
coworkers17. When field-exposed nano-sized confinement is equilibrated with bulk, field-free
phase with fixed chemical potential, however, the present analysis suggests water will be

18
attracted to the confinement to increase exposure to electric field, typically resulting in
conventional electrostriction behavior.
Acknowledgments
We thank Max Berkowitz and Jay Rasaiah for helpful discussions preceding this
study, Joachim Dzubiella for help interpreting results of Ref. 14, and National Science
Foundation for support through awards CHE-0718724 (to A.L.) and CBET- 0432625
(D.B.).
References
1 R. Shamai, D. Andelman, B. Berge and R. Hayes, Soft Matter, 2008, 4, 38-45. 2 A. Luzar, S. Svetina and B. Zeks, Chem. Phys. Lett., 1983, 96, 485-490. 3 C. Y. Lee, J. A. McCammon and P. J. Rossky, J. Chem. Phys., 1984, 80, 4448-
4455. 4 A. Luzar, S. Svetina and B. Zeks, J. Chem. Phys., 1985, 82, 5146-5154. 5 Q. Du, R. Superfine, E. Freysz and Y. R. Shen, Phys. Rev. Lett., 1993, 70, 2313-
2316. 6 J. C. Shelley and G. N. Patey, Mol. Phys., 1996, 88, 385-398. 7 Q. Du, E. Freysz and Y. R. Shen, Science, 1994, 264, 826-828. 8 D. Bratko, C. D. Daub and A. Luzar, Faraday Discussions, 2008, 141, in press. 9 S. H. L. Klapp and M. Schoen, J. Chem. Phys., 2002, 117, 8050-8062. 10 S. H. L. Klapp and M. Schoen, J. Mol. Liquids, 2004, 109, 55-61. 11 V. A. Froltsov and S. H. L. Klapp, J. Chem. Phys., 2007, 126,114703. 12 S. Vaitheeswaran, J. C. Rasaiah and G. Hummer, J. Chem. Phys., 2004, 121,
7955-7965. 13 J. Dzubiella and J. P. Hansen, J. Chem. Phys., 2003, 119, 12049-12052. 14 J. Dzubiella and J. P. Hansen, J. Chem. Phys., 2005, 122, 234706. 15 S. Vaitheeswaran, H. Yin and J. C. Rasaiah, J. Phys. Chem. B, 2005, 109, 6629-
6635. 16 D. Bratko, C. D. Daub, K. Leung and A. Luzar, J. Am. Chem. Soc., 2007, 129,
2504-2510. 17 J. L. England, S. Park and V. S. Pande, J. Chem. Phys., 2008, 128, 044503. 18 F. Mugele and J. C. Baret, J. Phys.-Condens. Matt., 2005, 17, R705-R774. 19 L. D. Landau and E. M. Lifshitz, Electrodynamics of Continuous Media;
Pergamon, Oxford, 1975; Course of Theoretical Physics, Volume 8, x15., 1975. 20 J. S. Hoye and G. Stell, J. Chem. Phys., 1980, 72, 1597. 21 J. Dzubiella, R. J. Allen and J. P. Hansen, J.Chem, Phys., 2004, 120, 5001-5004. 22 J. Dzubiella and J. P. Hansen, J.Chem, Phys., 2004, 121, 5514-5530. 23 C. Polk, Ieee Trans. Plasma Sci., 2000, 28, 6-14.
19
24 K. Wagner, E. Keyes, T. W. Kephart and G. Edwards, Biophys. J., 1997, 73, 21-3 25 S. W. I. Siu and R. A. Bockmann, J. Struct. Biol., 2007, 157, 545-556. 26 K. J. Schweighofer, X. F. Xia and M. L. Berkowitz, Langmuir, 1996, 12, 3747-
3752. 27 G. Sutmann, J. Electroanal. Chem., 1998, 450, 289-302. 28 A. A. Kornyshev, D. J. Lee, S. Leikin and A. Wynveen, Rev. Modern Phys., 2007,
79, 943-996. 29 K. J. Schweighofer and I. Benjamin, J. Electroanal. Chem., 1995, 391, 1-10. 30 D. Bratko and D. Dolar, J. Chem, Phys., 1984, 80, 5782-5789. 31 A. Luzar and D. Bratko, J. Chem, Phys., 1990, 92, 642-648. 32 D. Bratko, C. E. Woodward and A. Luzar, J.Chem, Phys.,1991, 95, 5318-5326. 33 S. J. Suresh, A. V. Satish and A. Choudhary, J.Chem, Phys., 2006, 124, 074506. 34 S. J. Suresh, J. Chem, Phys., 2007, 126, 204705 35 A. Luzar, J. Chem, Phys., 2000, 113, 10663-10675. 36 H. J. C. Berendsen, J. R. Grigera and T. P. Straatsma, J. Phys. Chem., 1987, 91,
6269-6271. 37 K. L. Yang, S. Yiacoumi and C. Tsouris, J. Chem, Phys., 2002, 117, 337-345. 38 S. W. Rick, S. J. Stuart and B. J. Berne, J. Chem, Phys., 1994, 101, 6141-6156. 39 L. X. Dang, J.Chem, Phys., 1992, 97, 2659-2660. 40 W. Smith, C. W. Yong and P. M. Rodger, Mol. Sim., 2002, 28, 385-471. 41 Essentially identical densities were found to preserve the values of distinct
pressure tensor components in anisotropic systems. 42 D. Bratko, R. A. Curtis, H. W. Blanch and J. M. Prausnitz, J.Chem, Phys., 2001,
115, 3873-3877. 43 R. L. Jaffe, P. Gonnet, T. Werder, J. H. Walther and P. Koumoutsakos, Mol. Sim.,
2004, 30, 205-216. 44 D. Bratko and A. Luzar, Langmuir, 2007, 24, 1247-1253. 45 K. Leung, A. Luzar and D. Bratko, Phys. Rev. Lett., 2003, 90, 065502 46 I. C. Yeh and M. L. Berkowitz, J. Chem, Phys., 1999, 111, 3155-3162. 47 T. M. Truskett, P. G. Debenedetti and S. Torquato, J.Chem, Phys., 2001, 114,
2401-2418. 48 A. Luzar, J. Phys. Chem. B, 2004, 108, 19859-19866. 49 Analogy with ref.12 is partial as results from that work pertain to fixed overall
pressure in a nonuniform system comprised of a field-free bulk water reservoir and a field-exposed confined phase, leaving the pressure inside confinement unspecified.
50 K. Lum and A. Luzar, Phys. Rev. E, 1997, 56, R6283-R6286. 51 K. Lum, D. Chandler and J. D. Weeks, J. Phys.Chem. B, 1999, 103, 4570-4577. 52 N. Giovambattista, P. J. Rossky and P. G. Debenedetti, Phys. Rev. E, 2006, 73,
041604. 53 A. Luzar and D. Chandler, J. Chem, Phys., 1993, 98, 8160-8173. 54 C. D. Daub, D. Bratko, K. Leung and A. Luzar, J. Phys. Chem. C, 2007, 111, 505-
509. 55 P. Liu, E. Harder and B. J. Berne, J.Phys, Chem. B, 2005, 109, 2949-2955.
20
56 I. M. Svishchev and P. G. Kusalik, Phys. Rev. Lett., 1994, 73, 975-978. 57 R. Zangi and A. E. Mark, J. Chem, Phys., 2004, 120, 7123-7130. 58 R. D. Mountain and D. Thirumalai, Proc. Natl. Acad. Sci. USA, 1998, 95, 8436-
8440. 59 A. K. Soper, E. W. Castner and A. Luzar, Biophys. Chem., 2003, 105, 649-666. 60 M. Kisilev and K. Heinzinger, J.Chem, Phys., 1996, 105, 650-657. 61 M. P. Allen and D. J. Tildesley, Computer Simulation of Liquids, Clarendon,
Oxford, 1987. 62 Strong polarization seen in two confined systems (solid black circles and
triangles) in Fig. 6, can be attributed to favorable interactions between polarized confined water and water in the field-free reservoir environment reminiscent of tin-foil boundary conditions.
Copyright © 2022 FDOKUMEN