Conformation and Structure of Ethylbenzene in the Vapour ...
Upload
khangminh22Category
view
1download
0
Prepared for
Norton Rose Fulbright Australia
Human Health Risk Assessment for Vapour Impacts in
the Vicinity of SV10
Hendon Industrial Area, Hendon
Final (Rev 1)
Privileged and Confidential
March 2015 Reference: 652556

This page has intentionally been left blank

Norton Rose Fulbright Australia HHRA for Vapour Impacts in the Vicinity of SV10 Hendon Industrial Area, Hendon, SA
CH2M HILL Australia Pty Ltd Level 7, 9 Help Street CHATSWOOD NSW 2067 Phone 02 9950 0200 Fax 02 9950 0600
This document may only be used for the purpose for which it was commissioned and in accordance with the Terms and Conditions of Engagement for the commission. Any third party that receives a copy of this document does so subject to the limitations referred to herein.
Reproduction of this document is prohibited without the express, written approval of CH2M HILL Australia Pty Ltd.
March 2015 Ref: 652556 Rev 1 Privileged and Confidential
i

This page has intentionally been left blank

Norton Rose Fulbright Australia HHRA for Vapour Impacts in the Vicinity of SV10 Hendon Industrial Area, Hendon, SA
DOCUMENT CONTROL SHEET
CH2M HILL Australia Pty Limited Level 7, 9 Help Street Project No: 652556 P O Box 5392 CHATSWOOD NSW 2067
Telephone: +61 2 9950 0220 Original Date of Issue: 4 February 2015 Fax: +61 2 9950 0600 Email: [email protected] Project Manager: Emma Walsh
REPORT DETAILS
Title:
Author(s):
Human Health Risk Assessment for Vapour Impacts in the Vicinity of SV10, Hendon Industrial Area, Hendon, South Australia
Katie Richardson
Client:
Client Contact:
Client Reference:
Norton Rose Fulbright Australia
Elisa de Wit
PO 2100533514
REVISION / CHECKING HISTORY
REVISION DISTRIBUTION – NUMBER OF COPIES NUMBER DATE REVIEWED BY APPROVED FOR ISSUE
Client EPA Other CH2M File 0 04/02/15 B. Selcoe E. Walsh 1 (e) - 1 (e) 1 (e) 1 04/03/15 B. Selcoe E. Walsh 1 (e) 1 (e) 1 (e) 1 (e)
March 2015 Ref: 652556 iii Rev 1 Privileged and Confidential

This page has intentionally been left blank

Norton Rose Fulbright Australia HHRA for Vapour Impacts in the Vicinity of SV10 Hendon Industrial Area, Hendon, SA
Executive Summary
Introduction
CH2M HILL Australia Pty Ltd (CH2M HILL) was engaged by Norton Rose Fulbright Australia to carry out a Human Health Risk Assessment (HHRA) for the volatile contamination identified in the vicinity of SV10, a soil vapour bore located in a residential area to the north of the Hendon Industrial Area.
Background
Previous site investigation and vapour risk assessment (VRA) works have been undertaken by Parsons Brinckerhoff (PB) in 2013 and 2014, in order to assess the level of potential risk to residents (and other human health receptors) in the vicinity of the Hendon Industrial Area via pathways of vapour intrusion into current buildings. As part of these works, elevated soil vapour concentrations were measured in SV10. As there was a level of uncertainty associated with the measured soil vapour concentrations, the EPA requested additional investigations in this area.
CH2M HILL has undertaken further investigations in the vicinity of SV10 to better understand the nature and extent of the soil vapour impacts in this area. These works are reported in Soil Vapour Assessment Report, Delineation of Soil Vapour Contamination Around SV10 (CH2M HILL, 2015).
The scope of this HHRA comprises the assessment of the potential level of risk posed to residents in the vicinity of SV10, by the volatile contamination currently identified in the vicinity of SV10, via a pathway of volatilisation into residential indoor air spaces.
Objectives
The overall objectives of this HHRA were to:
• Provide a further assessment of the potential indoor air risks to residents in the vicinity of SV10, utilising the results of the additional investigations recently undertaken by CH2M HILL (2015); and
• Determine whether additional soil vapour delineation works are required to the east and west of SV10.
Scope of Work
This assessment incorporates the maximum concentrations measured in SV10 and in the soil vapour bores in the surrounding investigation area to the north of the Hendon Industrial Area. The conclusions of this assessment are considered applicable to the area defined by this network of soil vapour bores.
There are currently a number of uncertainties regarding whether the measured soil vapour concentrations in this area are representative of plausible high-end concentrations in the future. In particular, areas of uncertainty include:
• The extent and level of hydraulically up-gradient sources, and the potential for further migration of these sources in groundwater to the vicinity of SV10, such that groundwater concentrations in this area might increase in the future; and
March 2015 Ref: 652556 Rev 1 Privileged and Confidential
v

Norton Rose Fulbright Australia HHRA for Vapour Impacts in the Vicinity of SV10
Hendon Industrial Area, Hendon, SA
• The potential for source concentrations of daughter products of the original contaminant source (e.g. vinyl chloride) to increase in the future due to degradation processes within groundwater up-gradient.
On this basis, this HHRA focuses on the current level of potential risk based on currently available data.
Conclusions
The key conclusions from this HHRA are:
• Scenario 1: Above ground building
o The potential risks to residents in the area of SV10 are estimated to be within acceptable levels; and
o The current level of potential risk is therefore considered to be low and acceptable to residents within above ground buildings in the area, and further assessment of the current potential risk is not considered to be warranted.
• Scenario 2: Building with a basement construction
o The potential risks to residents are estimated to be within acceptable levels, provided the basement is used for purposes for which exposure is likely to be limited (e.g. as a wine cellar, for storage or as a laundry / utility space);
o The current level of potential risk is therefore considered to be low and acceptable to residents utilising a basement for such purposes, and further assessment of the current potential risk is not considered to be warranted; and
o Based on the available data and the conservative nature of the risk model, potential risks to residents in a habitable basement utilised as a primary living space may exceed acceptable levels. Should such an exposure scenario be possible in the area, further investigation and assessment would be needed to evaluate potential risks to residential users of such a basement.
On the basis of these conclusions, additional soil vapour delineation assessment is not considered to be required to the east and west of SV10 for shallow soil vapour impacts or for deep soil vapour impacts if basements are not present or if cellars / basements are only utilised for short periods of time per day.
Recommendations
Additional data (e.g. surveys and/or interviews) should be collected to determine whether any habitable basements exist in the area and therefore whether vapour intrusion into habitable basements is a potentially active exposure scenario. Should such basements be identified, investigations should be undertaken to quantify the risk via this exposure pathway.
Ref: 652556 March 2015 Privileged and Confidential Rev 1
vi

Norton Rose Fulbright Australia HHRA for Vapour Impacts in the Vicinity of SV10 Hendon Industrial Area, Hendon, SA
Table of Contents 1. Introduction.......................................................................................................................... 1
1.1 Background ...............................................................................................................................1
1.2 Regulatory Context ...................................................................................................................2
2. Methodology ........................................................................................................................ 3
3. Conceptual Site Model .......................................................................................................... 5
3.1 Background ...............................................................................................................................5
3.2 Sources......................................................................................................................................5
3.3 Receptors ..................................................................................................................................5
3.4 Pathways...................................................................................................................................5
4. Data Evaluation..................................................................................................................... 7
4.1 Suitability of Data for Risk Assessment.....................................................................................7 4.1.1 Appropriateness of sampling locations....................................................................................... 7 4.1.2 Representativeness of soil vapour data...................................................................................... 8 4.1.3 Summary of Data Appropriateness........................................................................................... 12
4.2 Selection of COPC................................................................................................................... 12 4.2.1 Soil Vapour Concentrations ...................................................................................................... 12 4.2.2 Groundwater Screening Exercise.............................................................................................. 13
4.3 Selected Source Concentrations ............................................................................................ 14
5. Toxicity Assessment .............................................................................................................18
5.1 Background ............................................................................................................................ 18
5.2 Approach................................................................................................................................ 18
5.3 Toxicity of COPC..................................................................................................................... 18
5.4 Uncertainties.......................................................................................................................... 19
6. Exposure Assessment ...........................................................................................................21
6.1 General................................................................................................................................... 21
6.2 Modelling Approach............................................................................................................... 21
6.3 Physical Input Parameters ..................................................................................................... 22 6.3.1 Source Depth ......................................................................................................................... 22 6.3.2 Geological Profile ...................................................................................................................... 23 6.3.3 Soil Properties: Sand ................................................................................................................. 24 6.3.4 Soil Properties: Natural cohesive geology ................................................................................ 24 6.3.5 Building Parameters.................................................................................................................. 25 6.3.6 Qsoil/Qbuilding Ratio ...................................................................................................................... 25 6.3.7 Attenuation between the basement and ground floor ............................................................ 27
6.4 Exposure Parameters ............................................................................................................. 28
6.5 Areas of conservatism............................................................................................................ 30
6.6 Exposure Concentrations....................................................................................................... 30
March 2015 Ref: 652556 Rev 1 Privileged and Confidential
vii

Norton Rose Fulbright Australia HHRA for Vapour Impacts in the Vicinity of SV10
Hendon Industrial Area, Hendon, SA
7. Risk Characterisation............................................................................................................31
7.1 Hazard Index for Threshold Effects........................................................................................ 31
7.2 Non-Threshold Carcinogenic Risk .......................................................................................... 32
7.3 Summary of Risk .................................................................................................................... 32 7.3.1 Scenario 1 ......................................................................................................................... 32 7.3.2 Scenario 2 ......................................................................................................................... 33 7.3.3 Overall Results ......................................................................................................................... 34
7.4 Sensitivity Analysis ................................................................................................................. 34 7.4.1 Above-ground buildings............................................................................................................ 34 7.4.2 Building with a basement ......................................................................................................... 37
8. Conclusions and Recommendations......................................................................................40
8.1 Conclusions ............................................................................................................................ 40
8.2 Recommendations ................................................................................................................. 41
9. Limitations...........................................................................................................................42
10. References...........................................................................................................................44
List of Tables Table 4-1 Adopted source concentrations for the assessed exposure scenarios .................. 17
Table 5-1 Adopted Toxicity Data ............................................................................................ 19
Table 7-1 Scenario 1: Above-ground residential building ...................................................... 33
Table 7-2 Scenario 2: Residential building with basement construction ............................... 33
List of Figures Figure 2-1 Risk Assessment Approach....................................................................................... 4
Figure 4-1: Key VOC concentrations in soil vapour in SV10 over time ..................................... 10
Figure 7-1: Sensitivity Analysis – Above ground building (Non-threshold risks) ...................... 36
Figure 7-2: Sensitivity Analysis – Above ground building (Threshold risks) ............................. 36
Figure 7-3: Sensitivity Analysis – Building with basement (Non-threshold risks)..................... 38
Figure 7-4: Sensitivity Analysis - Building with basement (Threshold risks)............................. 38
List of Appendices Appendix A – Peer Review of PB Assessment Works Appendix B – COPC Selection Appendix C – Toxicity Summaries Appendix D – Site-Specific Soil Properties Appendix E – Vapour Modelling Appendix F – Numerical Sensitivity Analysis Results
Ref: 652556 March 2015 Privileged and Confidential Rev 1
viii

Norton Rose Fulbright Australia HHRA for Vapour Impacts in the Vicinity of SV10 Hendon Industrial Area, Hendon, SA
1. Introduction
1.1 Background
Volatile chlorinated hydrocarbons (VCHs) have previously been identified in the groundwater and in soil vapour in the residential area to the north of the Hendon Industrial Area in Adelaide, South Australia (SA). CH2M HILL Australia Pty Ltd (CH2M HILL) was engaged by Norton Rose Fulbright Australia to carry out a Human Health Risk Assessment (HHRA) for the volatile contamination identified in the vicinity of SV10, a soil vapour bore located in this area where VCH concentrations, particularly trichloroethene (TCE), were higher than other reported concentrations in the area. A location plan showing the layout of the Hendon Industrial Area (the Site), and the area in the vicinity of SV10 (the investigation area), is included as Figure 1.
Previous site investigation and vapour risk assessment (VRA) works have been undertaken by Parsons Brinckerhoff (PB), in order to assess the level of potential risk to residents (and other human health receptors) in the vicinity of the Site via pathways of vapour intrusion into current buildings. The VRA works undertaken by PB included work completed in several phases:
• Phase 1: VRA works reported as part of the Additional Environmental Site Assessment (PB, October 2013b). The assessment incorporates data from groundwater monitoring and soil vapour investigations undertaken in June 2013; and
• Phase 2: Supplementary VRA works reported as part of the Additional Environmental Site Assessment – March/April 2014 (PB, June 2014a). These works provided an update to the previous VRA works (PB, 2013b), based on additional (and more extensive) groundwater and soil vapour data collected in March 2014.
CH2M HILL has reviewed these previous VRA works, with comments and discussion provided in Appendix A. In summary, the Phase 2 VRA (PB, 2014a) concluded that the health risks associated with indoor vapour intrusion of the designated volatile organic compounds (VOCs) within the residential areas, including the elevated TCE concentrations at SV10, were acceptable (assuming no basements and slab on ground construction) and mitigated on the basis of the moisture content and geotechnical properties of the soil.
The soil vapour concentration of TCE measured in SV10 at 1.65 – 1.8 meters below ground level (mbgl) during the March 2014 investigations (which was utilised as part of the PB Phase 2 VRA, 2014a) was highlighted by PB as being potentially spuriously high. In all other locations, soil vapour concentrations generally correlated with measured groundwater concentrations. The concentration of TCE measured in SV10 is inconsistent with this, as a large increase in soil vapour concentrations was observed when compared with the previous sampling round (PB, 2013b), even though groundwater concentrations decreased from the previous sampling round. It is noted that PB observed problems during sampling (i.e. resistance to drawing a sample was encountered, potentially associated with low permeability soils in this location such that the equipment flow rate could not be supported by the geology surrounding this sampling location), which may explain the spuriously high result observed. The soil vapour in SV10 was therefore resampled by PB in August 2014 (PB, 2014b). Difficulties were again encountered during purging, however the TCE concentration was confirmed by PB to be consistent with the previous monitoring conducted in the March 2014 investigation (PB, 2014a).
March 2015 Ref: 652556 Rev 1 Privileged and Confidential
1

Norton Rose Fulbright Australia HHRA for Vapour Impacts in the Vicinity of SV10
Hendon Industrial Area, Hendon, SA
On the basis of this result, the South Australian Environment Protection Authority (EPA) requested additional investigations in this area (as detailed below in Section 1.2). CH2M HILL has undertaken further investigations in the vicinity of SV10 to better understand the nature and extent of the soil vapour impacts in this area. These works are reported in Soil Vapour Assessment Report, Delineation of Soil Vapour Contamination Around SV10 (CH2M HILL, February 2015).
In addition to the request by the EPA to undertake this HHRA, CH2M HILL (2015) recommended that a HHRA be undertaken to assess the risks posed by vapour migration into indoor air given that VOCs were reported above the adopted criteria for vapour intrusion at three shallow soil vapour bores (SV09, SV10 and SV18S) and two deep soil vapour bores (SV10 and SV18D) in the investigation area. Although the soil vapour impacts were delineated to the north of the investigation area in CH2M HILL (2015), soil vapour impacts were not delineated to the east or west of the investigation area. Therefore, an assessment of vapour intrusion risks was required to:
• Assess the vapour intrusion risks associated with the measured soil vapour concentrations; and
• Determine whether additional soil vapour delineation works were required to the east and west of SV10.
The scope of this HHRA is limited to the assessment of the potential level of risk posed to residents in the vicinity of SV10, by the volatile contamination currently identified in the vicinity of SV10, via a pathway of volatilisation into residential indoor air spaces. This HHRA focuses on the current potential risk only, and will not draw conclusions regarding the future potential level of risk to residents in the vicinity of SV10.
1.2 Regulatory Context
The EPA has undertaken a review of previous investigations at the Site in an effort to gain an understanding of potential risks to public human health in the area. As part of the review, the EPA has identified additional works that are required in the vicinity of the Site, including:
• An investigation around SV10 to further delineate the soil vapour contamination and reassess potential vapour health risks to surrounding residential properties; and
• A preliminary site investigation (PSI), comprising a historical review, to identify potentially contaminating activities and potential contamination source locations across the Hendon Industrial Area.
The EPA has confirmed that the area of highest priority at this time is the northern area in the vicinity of soil vapour bore SV10. The EPA indicated that the assessment is required to delineate the soil vapour contamination, identify potential source locations and exposure pathways and determine if there are health risks associated with the contamination to residential, other sensitive or industrial land users. The additional investigation and assessment works in the vicinity of SV10 have been undertaken pursuant to the completion of the scope requested by the EPA (CH2M HILL, 2015). This report addresses the requirement to determine if there are any health risks associated with the contamination in this area.
The PSI will be undertaken separately and is not referred to further in this document.
Ref: 652556 March 2015 Privileged and Confidential Rev 1
2

Norton Rose Fulbright Australia HHRA for Vapour Impacts in the Vicinity of SV10 Hendon Industrial Area, Hendon, SA
2. Methodology
This section presents an outline of the approach taken to the assessment of potential risks to human health associated with exposure to the volatile contamination in the vicinity of SV10.
The approach taken to the quantitative assessment of potential human health risks was in accordance with the following protocols and guidance:
• National Environment Protection Council (NEPC), National Environment (Assessment of Site Contamination) Protection Measure 1999 (NEPM 1999, 2013 amendment); and
• EnHealth, Environmental Health Risk Assessment: Guidelines for Assessing Human Health Risks from Environmental Hazards, 2012.
Human health risk assessment can be divided into the following four primary tasks:
1. Data collection and evaluation;
2. Exposure assessment;
3. Toxicity assessment; and
4. Risk characterisation.
Guidance provided by the documents listed above is utilised as the primary source. The following diagram (Figure 2-1) illustrates the purpose and key activities associated with the quantitative risk assessment (QRA) and how each of these tasks fit into the overall assessment of potential risks. The Section of this HHRA in which each of the tasks is discussed is also presented in the diagram.
March 2015 Ref: 652556 Rev 1 Privileged and Confidential
3

Norton Rose Fulbright Australia HHRA for Vapour Impacts in the Vicinity of SV10
Hendon Industrial Area, Hendon, SA
Figure 2-1 Risk Assessment Approach
Ref: 652556 March 2015 Privileged and Confidential Rev 1
4

Norton Rose Fulbright Australia HHRA for Vapour Impacts in the Vicinity of SV10 Hendon Industrial Area, Hendon, SA
3. Conceptual Site Model
3.1 Background
The purpose of the conceptual site model (CSM) is to detail site-related information regarding contamination sources on the Site, the receptors which could be exposed and the pathways by which those receptors might be exposed.
As the objective of this HHRA is to provide an assessment of the potential risks to human health associated with the volatile contamination in the vicinity of SV10, the summarised CSM detailed here considers only the sources, pathways and receptors relevant to this assessment, and is based on the current residential use of the investigation area. The summarised CSM has been developed based on the data obtained during the investigations undertaken for the Site by PB (2013a, 2013b, 2014a and 2014b) and CH2M HILL (2015). A CSM for the Site has been detailed in CH2M HILL (2015).
3.2 Sources
The primary focus of this investigation is the volatile contamination identified in the vicinity of SV10 within soil vapour and groundwater. Therefore, for the purpose of this HHRA, the contaminated soil vapour and groundwater is considered to be the source.
These impacts have been considered in detail in Section 4 to determine the Contaminants of Potential Concern (COPC) and concentrations of these COPC to be incorporated in the HHRA.
3.3 Receptors
The area in the vicinity of SV10 is currently utilised for residential purposes. On this basis, current and future residents (including young children) have been considered as the primary sensitive receptors associated with the current use of the investigation area.
There is additionally the potential that other human health receptors may be exposed to vapours in the area of SV10 (e.g. visitors to the area, utility workers). However, the level of potential risk to these other receptors from vapour impacts is likely to be lower than for site residents, given:
• Concentrations of vapours are likely to be highest in indoor air spaces (where residents have the greatest potential to be exposed); and
• Residential receptors (including young children) are a more sensitive population group than the other potential receptors identified for the area, and will be exposed more frequently, and for longer durations than the other potential receptors.
On this basis, the assessment for site residents is considered to be conservative for the other potential receptors identified for the area, and separate assessment of pathways to these receptors is not considered to be warranted.
3.4 Pathways
The primary contaminant migration and exposure pathway considered within this HHRA is:
March 2015 Ref: 652556 Rev 1 Privileged and Confidential
5

Norton Rose Fulbright Australia HHRA for Vapour Impacts in the Vicinity of SV10
Hendon Industrial Area, Hendon, SA
• Volatilisation and migration of contaminant vapours into residential buildings (with or without a basement).
The previous VRAs (PB, 2013b and 2014a) had considered slab on ground construction of houses and had assumed that no basements were present. However, the EPA advised that members from the public identified that basements / cellars are present in the residential areas surrounding the Site, although not necessarily in the vicinity of SV10, and therefore this should also be taken into account during the additional works. Therefore, this HHRA considers the risks for residential properties both with and without a basement. Furthermore, in addition to assessment of above ground buildings with a slab on ground construction, consideration has also been given to the potential for above-ground buildings with a crawl space construction.
It is noted that pathways of volatilisation to outdoor air are also potentially active, but as these are likely to result in negligible exposure when compared with pathways to indoor air (as a result of the high levels of dilution which occur in outdoor air), separate assessment of these pathways is not considered to be warranted.
Ref: 652556 March 2015 Privileged and Confidential Rev 1
6
Norton Rose Fulbright Australia HHRA for Vapour Impacts in the Vicinity of SV10 Hendon Industrial Area, Hendon, SA
4. Data Evaluation
4.1 Suitability of Data for Risk Assessment
As discussed in Friebel & Nadebaum (CRC CARE), 2011a, the assessment of the vapour intrusion pathway through direct soil vapour measurements (rather than modelling based on soil / groundwater concentrations) is “expected to provide the most accurate estimate of vapour intrusion, as the uncertainty associated with partitioning effects is removed”. Ambient indoor and outdoor concentrations are also clearly useful in assessing current risk via vapour pathways, but they can be highly variable and susceptible to influence by above-ground background sources, and can be of limited usefulness in determining whether potential risks are related to below ground sources. As such, concentrations measured in below-ground soil vapour are the primary data considered for incorporation into the HHRA.
Consideration is given here to the soil vapour data collected for the investigation area, to assess whether it is adequate and representative for the assessment of potential risks to current residents in the area via a pathway of vapour intrusion into indoor air.
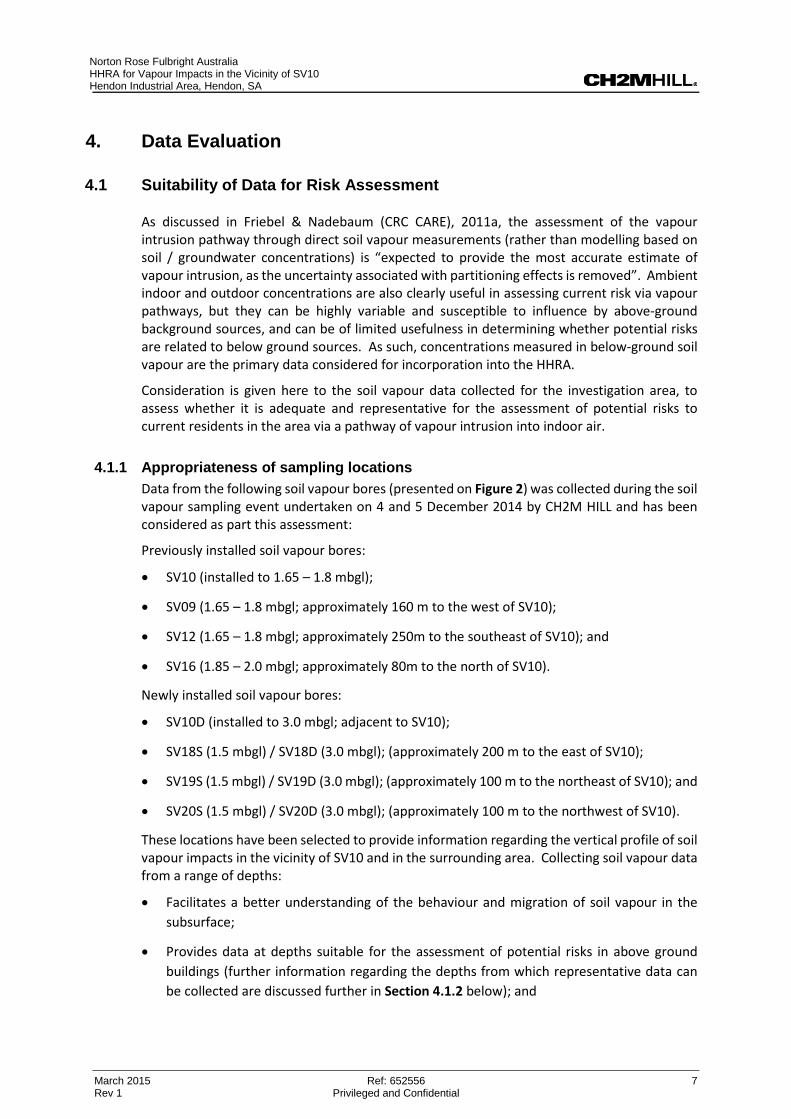
4.1.1 Appropriateness of sampling locations Data from the following soil vapour bores (presented on Figure 2) was collected during the soil vapour sampling event undertaken on 4 and 5 December 2014 by CH2M HILL and has been considered as part this assessment:
Previously installed soil vapour bores:
• SV10 (installed to 1.65 – 1.8 mbgl);
• SV09 (1.65 – 1.8 mbgl; approximately 160 m to the west of SV10);
• SV12 (1.65 – 1.8 mbgl; approximately 250m to the southeast of SV10); and
• SV16 (1.85 – 2.0 mbgl; approximately 80m to the north of SV10).
Newly installed soil vapour bores:
• SV10D (installed to 3.0 mbgl; adjacent to SV10);
• SV18S (1.5 mbgl) / SV18D (3.0 mbgl); (approximately 200 m to the east of SV10);
• SV19S (1.5 mbgl) / SV19D (3.0 mbgl); (approximately 100 m to the northeast of SV10); and
• SV20S (1.5 mbgl) / SV20D (3.0 mbgl); (approximately 100 m to the northwest of SV10).
These locations have been selected to provide information regarding the vertical profile of soil vapour impacts in the vicinity of SV10 and in the surrounding area. Collecting soil vapour data from a range of depths:
• Facilitates a better understanding of the behaviour and migration of soil vapour in the subsurface;
• Provides data at depths suitable for the assessment of potential risks in above ground buildings (further information regarding the depths from which representative data can be collected are discussed further in Section 4.1.2 below); and
March 2015 Ref: 652556 Rev 1 Privileged and Confidential
7

Norton Rose Fulbright Australia HHRA for Vapour Impacts in the Vicinity of SV10
Hendon Industrial Area, Hendon, SA
• Provides data suitable for assessment of risks to buildings with basements (for which data from 3 mbgl and below is required).
In summary, the selected locations are considered to be appropriate and to achieve the objectives of the HHRA, based on:
• The range of depths from which soil vapour samples have been taken to better understand the vertical extent of the soil vapour impacts in the vicinity of SV10; and
• The lateral spread of bores in the surrounding area to better understand the lateral extent of the soil vapour impacts in the vicinity of SV10.
4.1.2 Representativeness of soil vapour data This assessment primarily considers the soil vapour data collected as part of the CH2M HILL investigations undertaken in December 2014 (CH2M HILL, 2015). The rationale behind the analytical suite, and the quality assurance / quality control (QA/QC) for these soil vapour investigations, is detailed in CH2M HILL (2015). Based on this information, the measured concentrations are considered to be representative of soil vapour concentrations beneath the investigation area at the time of sampling.
It is noted that, for a subset of the soil vapour sampling locations targeted in this recent investigation, additional soil vapour data is available from the previous investigations undertaken by PB (2013b, 2014a and 2014b). The following are noted with regard to the data collected as part of the PB investigations:
• The CH2M HILL (2015) December 2014 data represents the most recent and most extensive dataset for the area around SV10; and
• The sampling methodology for the CH2M HILL investigation was developed in order to minimise the potential for the low-permeability geology observed in the area to influence the data representativeness. For example, a soil vapour flow rate of 12 millilitres per minute (mL/min) was used by CH2M HILL during sampling (in contrast to the rate of 200 mL/min utilised in the PB (2013b, 2014a and 2014b) investigations); higher flow rates are less likely to be supported by the observed low-permeability geology, increasing the potential that a non-representative sample has been collected.
On this basis, the CH2M HILL data is considered as the primary dataset for this assessment. The PB (2013b, 2014a and 2014b) data will be considered here to provide context regarding the variations observed over time (while noting that observed variations may relate wholly or in part to the factors above), and will be furthermore considered as part of the sensitivity analysis presented in Section 7.4.
The objective of this HHRA is to consider the current level of potential risk to residents in the area of SV10. It is therefore outside the scope of this assessment to consider the potential for soil vapour concentrations to vary over longer-term timescales (e.g. as a result of changing groundwater source concentrations). Consideration is given here to:
• The potential for the soil vapour concentrations to vary over short-term timescales (e.g. as a result of variation in meteorological conditions, or changes in below ground conditions); and
Ref: 652556 March 2015 Privileged and Confidential Rev 1
8

Norton Rose Fulbright Australia HHRA for Vapour Impacts in the Vicinity of SV10 Hendon Industrial Area, Hendon, SA
• The changes in concentrations over time (i.e. between the sampling events undertaken by PB in June 2013 (PB, 2013b), March 2014 (PB, 2014a) and August 2014 (PB, 2014b) and the sampling event undertaken by CH2M HILL in December 2014 (CH2M HILL, 2015)) and through the vertical profile (i.e. between shallow and deep samples collected from the vicinity SV10 during CH2M HILL (2015)) in order to better understand whether the observed variations are consistent with the CSM.
The overall aim of this review is to determine whether the measured concentrations are likely to be representative of current below ground conditions, and therefore appropriate for incorporation into the HHRA to provide an estimate of the current risk.
Discussion of potential for variation as a result of meteorological effects
• The collection of shallow soil vapour data (down to around 1 mbgl) allows direct measurement of concentrations close to the above-ground building and outdoor air spaces in which exposure may occur, whereas when deeper soil vapour measurements are taken, modelling must be undertaken to estimate concentrations at shallow depth. Shallow soil vapour concentration are therefore of particular relevance and value in assessing the current potential for exposure and level of risk, but these concentrations are most liable to be influenced by meteorological variation (e.g. rainfall and barometric pressure changes) and so it can be difficult to determine whether they are representative of the highest concentrations which may be present at shallow depth over changing weather patterns;
• Discussion presented in New South Wales Department of Environment, Climate Change and Water (DECCW, 2010) indicates that soil gas concentrations for sources at depth (below 1 – 2 mbgl) are less likely to be influenced by meteorological variations (e.g. barometric pressure and rainfall). It is therefore expected that soil vapour concentrations below around 1 – 2 mbgl would not be expected to vary widely over time as a result of changing meteorological conditions. The soil vapour sampling network utilised for this HHRA is installed at depths of 1.5 mbgl or greater, and is considered to be broadly appropriate to avoid the majority of such meteorological effects (although further consideration of potential variations due to seasonal changes is given below); and
• It was noted by PB (2013b) that soil vapour samples collected in June 2013 were collected in a month historically associated with higher than average rainfall. There is the potential that these general conditions may have contributed to higher than average soil moisture conditions within the soil. Higher moisture content in the soil is associated with reduced potential for vapour transport, and as such, could result in lower soil vapour concentrations overlying a source than would be present at times of the year when the moisture content is lower. The second round of PB data (collected in March 2014) was collected at a period of lower than average rainfall (PB, 2014a). As discussed in Section 6.3.4, the soil vapour samples collected by CH2M HILL (2015) were collected at a time of below average rainfall; on this basis, the concentrations measured by CH2M HILL (and the March 2014 PB (2014a) data) are considered to be representative of conservative conditions.
Discussion of potential for variation in concentrations as a result of oxygen ingress and biodegradation processes
Biodegradation of some contaminants (particularly petroleum hydrocarbons) occurs readily and rapidly in the presence of oxygen. For such contaminants, careful consideration should be
March 2015 Ref: 652556 Rev 1 Privileged and Confidential
9

Norton Rose Fulbright Australia HHRA for Vapour Impacts in the Vicinity of SV10
Hendon Industrial Area, Hendon, SA
given to the potential for oxygen concentrations to vary laterally away from the locations where the soil vapour sample is collected.
Soil vapour sampling locations are often located away from buildings, where there is significant potential for oxygen ingress into the subsurface. Where oxygen is present at the sampling location, low concentrations of degradable contaminants may be measured (as the concentrations are reflective of attenuated concentrations due to biodegradation processes). Building footprints can reduce oxygen infiltration, resulting in lower oxygen concentrations beneath buildings than in nearby soil vapour sampling locations, and potentially resulting in higher soil vapour concentrations beneath the buildings, as concentrations in these locations are not attenuated through biodegradation processes. The potential for soil vapour concentrations to vary laterally as a result of changing oxygen profiles is not considered significant for this assessment, given the following:
• The aerobic degradation of chlorinated hydrocarbon vapours in the vadose zone is not normally significant. As these are the primary COPC identified for the Site and the investigation area, this issue is unlikely to be a major concern; and
• Given the depths at which the majority of the samples were collected, and the low permeability of the below site geology, there is considered to be low potential for variations at the site surface to influence oxygen levels at these depths.
Comparison of December 2014 (CH2M HILL, 2015) data to historic data
The chart presented below, Figure 4-1, indicates the variation in the soil vapour concentrations (of key chlorinated hydrocarbons, including tetrachloroethene (PCE); TCE; cis-1,2dichloroethene (cis-1,2-DCE); and 1,1-dichloroethene (1,1-DCE)) measured in SV10 (1.65 – 1.8 mbgl) over time, presented on a logarithmic scale to highlight order of magnitude changes:
1
10
100
1000
10000
100000
PCE TCE cis-1,2-DCE 1,1-DCE
Soil
vapo
ur c
once
ntra
tion
(μg/
m³)
Variation in soil vapour concentrations within SV10 (1.65 - 1.8 mbgl) over time
Jun-13 Mar-14 Aug-14 Dec-14
Figure 4-1: Key VOC concentrations in soil vapour in SV10 over time
Ref: 652556 March 2015 Privileged and Confidential Rev 1
10

Norton Rose Fulbright Australia HHRA for Vapour Impacts in the Vicinity of SV10 Hendon Industrial Area, Hendon, SA
The results indicate that the highest VOC concentrations in SV10 were measured in the March 2014 (PB, 2014a) sampling event, which is when issues during sampling were noted by PB. The reasons for the observed variations are not fully understood, but may be attributed to sampling methodology. Given the sampling depth, it is considered unlikely that the variations were due to meteorological changes.
Given the issues noted by PB whilst sampling SV10 during the March 2014 (PB, 2014a) and August 2014 (PB, 2014b) sampling event, it is considered most likely that the soil vapour concentrations measured during that event may provide an overestimate of the soil vapour concentrations at this location and time. Such an overestimate could be a function of the sampling methodology. In a low-permeability geology (such as is observed at the sampling depth of 1.65 – 1.8 mbgl in SV10), the flow-rate into the vapour sampling canister (200 mL/min for the March 2014 (PB, 2014a) sampling event) may not be supported by the geology. Where this is the case, the flow into the canister can result in negative pressure conditions within the bore and surrounding soils, resulting in the preferential partitioning of contaminants present in soil moisture into the soil vapour, and therefore into the sample. In this way, the sampling methodology can result in an overestimation of the soil vapour concentrations under equilibrium conditions.
Review of the vertical variation in soil vapour concentrations at SV10
• It is noted that during the December 2014 investigation (CH2M HILL, 2015), higher soil vapour concentrations were observed in SV10 (1.65 – 1.8 mbgl) than in the deeper bore SV10D (installed adjacent to SV10 at 3.0 mbgl). For example, the concentration of TCE was 9,400 μg/m³ in SV10, but only 1,280 μg/m³ in SV10D. Concentrations will generally decrease with distance from the source (in this case, conceptualised as the groundwater source at around 3.6 mbgl), and so this result is unexpected;
• Where more elevated soil vapour concentrations are present at shallower depths, this can be the result of the presence of soil impacts at or around the sampling depth, but it is not expected that there would be a chlorinated soil source present at 2.0 – 3.0 mbgl in this area, as no potential source for such impacts has been identified and the VOC concentrations in the soil samples collected in the area (CH2M HILL, 2015) have not been reported above the laboratory limit of reporting (LOR). As such, the presence of higher concentrations at shallower depths in this location is unexpected;
• It is possible that the silty clay layer above the interbedded sand and silt lenses may be retaining the contaminated soil vapours due to the tight pore spaces and restricted porous gas flow, whereas the concentrations of contaminants are lower in the more porous underlying sand lens where there is greater porous gas flow and the pore spaces are more readily flushed as the soil vapours find the path of least resistance to the atmosphere. In this scenario, the measured concentrations in soil vapour would be representative of soil vapour concentrations at this depth; and
• It is considered that the elevated result in SV10 (relative to SV10D) could also result from sampling effects associated with the low permeability of the geology surrounding this bore. With lower flow rates (such as the 12 mL/min utilised during the December 2014 (CH2M HILL, 2015) investigation), this effect will be less apparent than with higher flow rates, but there is always the potential for measured soil vapour concentrations to overestimate below ground conditions in a low permeability geology as a result of this effect. It is noted that the geology at 1.65 – 1.8 mbgl in this area is very cohesive (stiff clayey silt), but that a clayey sand is observed at 3.0 mbgl, providing an indication of why the concentrations measured at the deeper location are not similarly elevated. In this
March 2015 Ref: 652556 Rev 1 Privileged and Confidential
11

Norton Rose Fulbright Australia HHRA for Vapour Impacts in the Vicinity of SV10
Hendon Industrial Area, Hendon, SA
scenario, the higher concentrations observed at shallower depths may be an artefact of the sampling methodology, and may provide an overestimate of representative soil vapour concentrations.
4.1.3 Summary of Data Appropriateness Overall, it is noted that the soil vapour concentrations across all four sampling events (PB, 2013b; PB, 2014a; PB, 2014b and CH2M HILL, 2015) are within an order of magnitude for each analyte, even when including the March 2014 (PB, 2014a) concentrations, for which there is a relatively high level of uncertainty regarding their representativeness. On this basis, it is considered that the most recently measured soil vapour concentrations (CH2M HILL, 2015) are reasonably representative of (or conservative to represent) current conditions, and that assessing these soil vapour concentrations as the primary current source concentrations for the investigation area, together with the results from earlier sampling events as part of a sensitivity analysis, will be an appropriate and conservative approach for the investigation area.
Based on the above discussion, it is considered that the soil vapour data collected for the investigation area during the December 2014 (CH2M HILL, 2015) investigation is adequate to account for the likely variability in source concentrations over short timescales (e.g. as a result of changing meteorological conditions), and is therefore generally suitable for incorporation into an assessment of the potential risk to current receptors at the site. The additional data collected during previous investigations undertaken by PB will be further considered as part of a sensitivity analysis (see Section 7.4).
In summary, the soil vapour data collected for the investigation area is considered to be:
• Collected from appropriate sampling locations and depths to achieve the objectives of the HHRA; and
• Representative of soil vapour concentrations beneath the investigation area at the time of sampling, and adequate to account for the likely variability in source concentrations over the short-term as a result of changing meteorological conditions.
The measured concentrations are therefore considered suitable for incorporation into an assessment of the potential risk to current residential receptors in the area.
4.2 Selection of COPC
The selection process for determining the COPC for this HHRA is discussed in the sections below.
4.2.1 Soil Vapour Concentrations A screening exercise has been completed to select the COPC to be considered in this HHRA. The purpose of this screening exercise is to identify those analytes which are likely to be associated with negligible potential risk, so that these can be excluded from further assessment. This allows the HHRA to focus on those COPC with the greatest potential to pose unacceptable risks.
This screening exercise considers all of the analytes identified in soil vapour samples collected in December 2014 (CH2M HILL, 2015), and is presented as Appendix B1 – B3. A confirmatory screening of additional analytes previously identified by PB (2013b and 2014a) in soil vapour,
Ref: 652556 March 2015 Privileged and Confidential Rev 1
12

Norton Rose Fulbright Australia HHRA for Vapour Impacts in the Vicinity of SV10 Hendon Industrial Area, Hendon, SA
but not reported above the LOR in the CH2M HILL (2015) sampling event, is provided in Appendix B6.
The screening process is summarised below:
Step 1
• For analytes for which interim soil vapour Health Investigation Levels (HILs) or soil vapour Health Screening Levels (HSLs) are presented in the NEPM 1999 (2013 amendment), the maximum soil vapour concentrations (from all depths) are compared to the most conservative screening criteria defined for the protection of residential receptors. These criteria are defined for shallow soil vapour (i.e. concentrations immediately below a building foundation) and so are conservative, particularly for soil vapour concentrations measured at depth; and
• For those analytes for which no soil vapour screening criteria have been presented in the NEPM 1999 (2013 amendment), the maximum measured soil vapour concentrations have been compared to toxicological reference concentrations (RfC). As discussed in Section 5.2, RfC represent the concentration in breathed air below which adverse effects are not expected to occur (assuming continuous, chronic exposure). As the concentrations in indoor air will be significantly lower than the measured soil vapour concentrations, this screening assessment is highly conservative and allows the assessment to focus on those COPC with non-negligible potential to pose unacceptable risks.
Step 2
• Soil vapour concentrations are compared to soil vapour screening criteria, calculated giving consideration to the toxicity of the analytes and an assumed attenuation factor of 0.0051 (representing the ratio between concentrations immediately beneath the building foundation and concentrations within indoor air). This assessment is conservative as it assumes that the measured concentrations could be present immediately beneath the building foundation and that no attenuation occurs through the soil column.
Based on the results of the screening assessment, TCE and chloroform have been selected as COPC for this HHRA.
4.2.2 Groundwater Screening Exercise The potential risks associated with pathways of vapour intrusion are generally best assessed through consideration of soil vapour concentrations. However, consideration has also been given to the groundwater data collected from the monitoring wells in the vicinity of SV10 during the March 2014 (PB, 2014a) monitoring event in order to ascertain whether additional volatile analytes have been identified which are not adequately assessed through consideration of soil vapour concentrations.
The following volatile analytes have been identified in groundwater sampled from MW14 (located adjacent to soil vapour bore SV10) during the March 2014 (PB, 2014a) monitoring event:
1 Full discussion of this adopted attenuation factor (also adopted in the risk assessment modelling undertaken for the site) is provided in Section 6.3.5.
March 2015 Ref: 652556 Rev 1 Privileged and Confidential
13

Norton Rose Fulbright Australia HHRA for Vapour Impacts in the Vicinity of SV10
Hendon Industrial Area, Hendon, SA
• 1,2-dichloroethane (1,2-DCA);
• trans-1,2-dichloroethene (trans-1,2-DCE);
• chloroform;
• 1,1-DCE;
• 1,1-dichloroethane (1,1-DCA);
• cis-1,2-DCE;
• PCE; and
• TCE.
As all of these analytes were analysed for in soil vapour (i.e. there are no volatile analytes identified in groundwater which were not analysed for in soil vapour), the screening assessment of the measured soil vapour concentrations (presented above in Section 4.2) will therefore be broadly adequate.
However, it is noted that the screening exercise for soil vapour considers only those analytes which have been identified in soil vapour at concentrations above the LOR; analytes not identified above the LOR are considered to be absent and have not been considered further as part of the soil vapour screening assessment. The following analytes were not identified in soil vapour at concentrations above the LOR, but were identified in groundwater:
• 1,2-DCA; and
• trans-1,2-DCE.
While these analytes have not been identified in soil vapour at concentrations above the LOR, their presence in groundwater provides evidence of their potential presence in the vicinity of SV10, and (without further assessment) it is unknown whether the soil vapour LOR is sufficiently low to allow these analytes to be screened out as posing potential risks to human health.
On this basis, further assessment has been undertaken to confirm whether there could be potential risks to residential receptors in the vicinity of SV10 associated with these analytes. This confirmatory assessment is presented in Appendix B4 and B5 and concludes that the potential risk associated with these analytes is low in comparison to risk-based screening levels. On this basis, they have not been selected as COPC for the HHRA.
4.3 Selected Source Concentrations
The exposure scenarios to be assessed in this HHRA, and the selected source concentrations to assess these scenarios are detailed below:
• Scenario 1: An above ground building: This scenario specifically considers the potential risks to residents within an above ground residential building with a slab on ground construction. It is considered likely that assessment of such scenario will also provide a conservative assessment of the potential risks within a building with a crawl space construction. Lower risks would be anticipated in a building with a crawl space construction because there will be a degree of air mixing within the crawl space, and then
Ref: 652556 March 2015 Privileged and Confidential Rev 1
14

Norton Rose Fulbright Australia HHRA for Vapour Impacts in the Vicinity of SV10 Hendon Industrial Area, Hendon, SA
further air exchange within the building itself. Furthermore, advective transport (which is assumed to be active for a building with a slab on ground construction) is unlikely, as the air pressure in the crawl space is likely to be the same as that outside the building footprint. While the assessed scenario is therefore considered to be conservative for buildings with both a slab on ground and crawl space construction, a building with a crawl space construction is considered further as a confirmatory measure as part of the sensitivity analysis in Section 7.4.1.
o Scenario 1a: The maximum soil vapour concentrations measured in December 2014 (CH2M HILL, 2015) in soil vapour bores installed to depths of between 1.5 mbgl and 1.8 mbgl in the area surrounding SV10 have been adopted as the primary source concentrations for the assessment of risks to above ground residential buildings in the area. This includes data from SV09 (1.8 mbgl); SV10 (1.8 mbgl); SV12 (1.8 mbgl); SV16 (2.0 mbgl); SV18S (1.5 mbgl); SV19S (1.5 mbgl); and SV20S (1.5 mbgl). These bores are located at sufficient depth that the measured concentrations would not be anticipated to be influenced by changing meteorological conditions, but they collect soil vapour from shallower depths than the bores installed to greater depths (i.e. to around 3.0 mbgl), limiting the distance across which attenuation through the vadose zone must be estimated. Concentrations measured during earlier investigations undertaken at the investigation area (PB, 2013b, 2014a and 2014b) will be considered further as part of the sensitivity analysis (see Section 7.4);
o Scenario 1b: As discussed in Section 4.1.2, there is a level of uncertainty regarding the representativeness of the soil vapour concentrations measured in soil vapour bore SV10 (1.8 mbgl). The measured concentrations are higher than have been measured at greater depth in this location; this is despite the conceptualised groundwater source being present at depth. The differences may relate to geological variations and/or sampling techniques, and it is considered that the measured concentrations are likely to be representative of (or conservative to represent) soil vapour concentrations at this depth. Given the uncertainty, an additional scenario is modelled utilising the maximum concentrations measured at depth at SV10D (3.0 mbgl) during the December 2014 soil vapour investigation (CH2M HILL, 2015) as input concentrations at an assumed depth of 3.0 mbgl, in order to better understand the potential risks within an overlying building associated with the soil vapour concentrations measured at depth, and in this way place the results of the assessment of the shallower results in a fuller context; and
• Scenario 2: A building with a basement construction: This scenario considers the potential risks to residents within a residential building with a basement installed to 3 mbgl. The maximum soil vapour concentrations measured in soil vapour bores installed to 3 mbgl during the December 2014 soil vapour investigation (CH2M HILL, 2015) have been adopted as the source concentrations for the purpose of assessing potential risks to such residents within such a building.
March 2015 Ref: 652556 Rev 1 Privileged and Confidential
15

Norton Rose Fulbright Australia HHRA for Vapour Impacts in the Vicinity of SV10
Hendon Industrial Area, Hendon, SA
In line with the discussion presented above, the maximum concentrations measured in each of the adopted depth ranges during the December 2014 soil vapour investigation (CH2M HILL, 2015) have been adopted as the source concentrations in the HHRA. These are detailed below:
Ref: 652556 March 2015 Privileged and Confidential Rev 1
16

Norton Rose Fulbright Australia HHRA for Vapour Impacts in the Vicinity of SV10 Hendon Industrial Area, Hendon, SA
Table 4-1 Adopted source concentrations for the assessed exposure scenarios
COPC
Source Concentrations µg/m3
Scenario 1: Above ground building
Scenario 2: Building with basement
1a: Concentrations at 1.5 – 1.8 mbgl
1b Concentrations at 3.0 mbgl Concentrations at 3.0 mbgl
Trichloroethene (TCE) 9,400 2,690 2,690 Chloroform 94.2 <LOR <LOR
Notes:
As chloroform is not identified at concentrations above the LOR (80 µg/m3) in soil vapour sampled from the deeper soil vapour sampling locations (installed to 3.0 mbgl), it is included as a COPC only for the Scenario 1 assessment utilising soil vapour concentrations measured in bores installed to shallower depths.
It is noted that the highest concentrations of both TCE and chloroform were measured in SV10 (1.5 – 1.8 mbgl data) and SV10D (3.0 mbgl data).
March 2015 Ref: 652556 Rev 1 Privileged and Confidential
17

Norton Rose Fulbright Australia HHRA for Vapour Impacts in the Vicinity of SV10
Hendon Industrial Area, Hendon, SA
5. Toxicity Assessment
5.1 Background
The objective of the toxicity assessment is to identify toxicity values for the COPC that can be used to estimate potential risks to human health associated with the calculated intake. The quantification of risk (Section 7) requires identification of toxicity values for the COPC identified (this section) as well as quantification of potential exposure (Section 6).
The steps involved in this process include the following:
• Obtain relevant qualitative and quantitative toxicity information on the COPC relevant to the significant exposure pathways being assessed; and
• Identify the appropriate toxicity values for assessing both threshold2 effects and non-threshold carcinogenic3 effects.
5.2 Approach
The toxicity values adopted in this risk assessment have been selected in general accordance with guidance provided in the Schedule B4 of the NEPM 1999 (2013 amendment). Relevant toxicity values for vapour risk assessment include:
• Reference Concentrations: Threshold toxicity effects are assessed on the basis that there is a dose of the chemical below which toxic effects will not occur (i.e. the threshold). Reference concentrations (RfC) are adopted as the toxicity values for threshold toxicity effects, and represent the threshold concentration below which adverse effects are not expected to occur (assuming continuous, chronic exposure).
• Inhalation Unit Risk Values: For COPC which are assessed to be carcinogenic by a genotoxic mode of action, there is not considered to be a threshold below which toxic effects will not occur. Inhalation Unit Risk Values are adopted as the toxicity values for these non-threshold toxic effects, and represent the level of risk per unit concentration in air. In adopting these values, it is assumed that any exposure to the chemical will, in theory, result in an increased risk or probability of developing cancer, and this risk increases linearly with increasing exposure concentration.
5.3 Toxicity of COPC
Toxicity summaries for the identified COPC are presented in Appendix C. Table 5-1 presents the chronic quantitative toxicity data selected for use in the risk estimates.
2 Threshold toxicity effects are assessed on the basis that there is a dose of the chemical below which toxic effects will not occur (i.e., the threshold).
3 Non-threshold carcinogenic effects assume that, for some chemicals classified as carcinogenic, there is no threshold below which there will be no increased risk of a toxic effect. Hence, assessment of these chemicals is based on the use of a slope factor, which assumes that any exposure to the chemical will result in an increased incremental risk or probability of developing cancer over a lifetime.
Ref: 652556 March 2015 Privileged and Confidential Rev 1
18

Norton Rose Fulbright Australia HHRA for Vapour Impacts in the Vicinity of SV10 Hendon Industrial Area, Hendon, SA
Table 5-1 Adopted Toxicity Data
COPC
RfC (threshold endpoints)
mg/m3
Background exposure
Inhalation unit risk (non-threshold
endpoints) Risk per µg/m3
Source for toxicity values
TCE 0.002 10% 4.8 x 10⁻⁶ US EPA IRIS4, NEPM 1999 (2013 amendment)
Chloroform - - 2.3 x 10⁻⁵ US EPA IRIS
It is noted that, of the COPC selected for the investigation area, TCE is considered to act via a mutagenic mode of action (only for kidney tumors, which is only one of several cancer endpoints). For the identified mutagen in this assessment (TCE), early-life susceptibility is addressed in the adopted toxicity value as discussed in the toxicity summary presented in Appendix C.
5.4 Uncertainties
In general, the available scientific information is insufficient to provide a thorough understanding of all of the potential toxic properties of chemicals to which humans may be exposed. It is necessary, therefore, to extrapolate these properties from data obtained under other conditions of exposure and involving experimental laboratory animals.
This may introduce two types of uncertainties into the risk assessment, as follows:
• Those related to extrapolating from one species to another; and
• Those related to extrapolating from the high exposure doses usually used in experimental animal studies, to lower doses usually estimated for human exposure situations.
The majority of the toxicological knowledge of chemicals comes from experiments with laboratory animals. There may be differences between species (i.e. between humans and the animals used in the studies) in chemical absorption, metabolism, excretion and toxic response. There may also be uncertainties concerning the relevance of animal studies using exposure routes that differ from human exposure routes.
In addition, there is inherent uncertainty in the process of extrapolating results of short term or subchronic animal studies (often at very high doses) to humans exposed to lower doses but potentially over a lifetime.
In order to adjust for these uncertainties, RfCs incorporate safety factors that may vary from 10 to 1000.
The US EPA assumes that humans are as sensitive to carcinogens as the most sensitive animal species. This policy decision, while designed to minimise the potential for underestimating risk, introduces the potential to overestimate carcinogenic risk. Conversely, it also does not allow for the possibility that humans may be more sensitive than the most sensitive animal species. The model used by the US EPA to determine slope factors is a linearised multistage model, which provides a conservative estimate of cancer risk at low doses and is likely to
4 The USEPA Integrated Risk Information System (IRIS) is a database that evaluates information on health effects that may result from exposure to environmental contaminants and presents USEPA reviewed toxicity data (http://www.epa.gov/iris/)
March 2015 Ref: 652556 Rev 1 Privileged and Confidential
19

Norton Rose Fulbright Australia HHRA for Vapour Impacts in the Vicinity of SV10
Hendon Industrial Area, Hendon, SA
overestimate the actual slope factor. The result is that the use of such slope factors has the general effect of overestimating the incremental cancer risks.
The US EPA formerly (prior to 2005) adopted an approach that assumed that carcinogens acted by a genotoxic mechanism; however, most carcinogens do not actually cause cancer by this mechanism. Current US EPA guidance requires consideration of the mode of action for carcinogenicity, with mutagenic/genotoxic effects assessed on the basis of a non-threshold approach and all other effects assessed on the basis of an appropriate threshold (relevant to all endpoints including carcinogenicity). Few chemicals have been reviewed by the US EPA on the basis of this approach. For this HHRA, non-genotoxic carcinogens have been evaluated on the basis of a threshold approach where appropriate data are available, but are otherwise assessed on the basis of a non-threshold approach. This is in general accordance with Australian and World Health Organisation (WHO) guidance.
Overall, the toxicological data presented herein are considered to be current and adequate for the assessment of potential risks to human health associated with the potential exposure to the COPC identified in soil vapour at the investigation area. The uncertainties inherent in the toxicological values adopted are considered likely to result in an overestimation of actual risk.
Ref: 652556 March 2015 Privileged and Confidential Rev 1
20

Norton Rose Fulbright Australia HHRA for Vapour Impacts in the Vicinity of SV10 Hendon Industrial Area, Hendon, SA
6. Exposure Assessment
6.1 General
The CSM presented in Section 3 identifies the human populations (receptors) who may be exposed to the COPC identified for the investigation area and outlines the mechanisms (exposure pathways) by which these populations may be exposed. The exposure assessment detailed in this section provides a quantitative estimate of exposure and intake to the COPC for the different exposure scenarios considered within this risk assessment:
• Scenario 1: Above-ground building This scenario considers the potential risks to residents within a residential building, based on the current conditions:
o Scenario 1a: utilising soil vapour results from 1.5 – 1.8 mbgl;
o Scenario 1b: utilising soil vapour results from 3.0 mbgl;
• Scenario 2: Building with basement construction. This scenario considers the potential risks to residents within a residential building with a basement, based on the current conditions, utilising soil vapour results from 3.0 mbgl.
The magnitude of the intake or exposure for each of these exposure scenarios is estimated utilising a modelling approach, and is a function of:
• The source concentrations (defined for each of these exposure scenarios in Section 4.3);
• A number of variables (termed physical input parameters), which are used to estimate vapour transport in the subsurface and intrusion into an indoor air space. Some examples include the air-filled and water-filled porosity of the below site geology and the nature of the building; and
• A number of variables (termed exposure parameters), which describe the physical and behavioral parameters relevant to the potentially exposed population. Some examples include inhalation rate, exposure frequency (i.e. hours per day or days per year) and exposure duration (e.g. number of years as a resident).
6.2 Modelling Approach
Schedule B4 of the NEPM 1999 (2013 amendment) provides the following guidance with regard to the selection of the modelling approach for the estimation of indoor air concentrations:
Indoor air concentrations can be modelled (estimated) using an attenuation factor, a model such as the Johnson and Ettinger (1991) model, or another appropriate (justified) model. The Johnson and Ettinger (1991) model is a one-dimensional ‘heuristic’ analytical solution to model advective and diffusive vapour transport into indoor spaces. It provides an estimated attenuation coefficient that relates the vapour concentration in the indoor space to the soil vapour concentration at the source of contamination (US EPA 2004a). A vapour attenuation factor, ‘α’, is calculated, which is the ratio of the concentration of a chemical vapour in an indoor scenario relative to that measured in the soil. This model has been updated and modified
March 2015 Ref: 652556 Rev 1 Privileged and Confidential
21

Norton Rose Fulbright Australia HHRA for Vapour Impacts in the Vicinity of SV10
Hendon Industrial Area, Hendon, SA
since 1991 …Inputs to the model include chemical properties of the contaminant, saturated and unsaturated zone soil properties, and structural properties of the building (US EPA 2004a).
The Johnson and Ettinger model as described by US EPA (2004a) is the most commonly used model for estimating vapour concentrations in indoor air and has been used in the derivation of the HSLs for petroleum hydrocarbons. The US EPA model provides additional functionality permitting the estimation of soil vapour concentrations from soil, groundwater and phase separated liquid.
Indoor air concentrations have been estimated using the CRC CARE HSL extension model (Friebel & Nadebaum, 2011b) used to develop and adjust the HSLs presented in the NEPM 1999 (2013 amendment). This model is a direct re-implementation of the Johnson & Ettinger (1991) model, and has been selected as it incorporates default parameters and exposure scenarios as utilised in the development of NEPM 1999 (2013 amendment) screening criteria. This model therefore provides a high level of confidence that the approach is generally consistent with the NEPM 1999 (2013 amendment) and clarity of where parameters have been adjusted from these defaults based on the site-specific scenario.
6.3 Physical Input Parameters
The key input parameters required in the model include:
• The distance between the source and the building foundation;
• Parameters describing soil properties for the vadose zone through which the vapours migrate;
• Building parameters describing the dimensions and nature of the residential building;
• The Qsoil/Qbuilding ratio, which describes the ratio between soil vapour concentrations directly beneath the building foundation and concentrations within indoor air; and
• The Cb/Ci ratio, which describes the ratio between indoor air concentrations in the basement and on the ground floor.
The selected values for these input parameters and the rationale behind the selected values is described in more detail below.
6.3.1 Source Depth The distance between the soil vapour source and the building foundation has been determined for each exposure scenario based on the following assumptions that:
• The foundation of a building without a basement is at 0.0 mbgl;
• The foundation of a building with a basement is at 3.0 mbgl;
• The maximum soil vapour concentrations measured at 1.5 – 1.8 mbgl are present at 1.5 mbgl; and
• The maximum soil vapour concentrations measured at 3.0 mbgl are present at 3.0 mbgl;
Ref: 652556 March 2015 Privileged and Confidential Rev 1
22

Norton Rose Fulbright Australia HHRA for Vapour Impacts in the Vicinity of SV10 Hendon Industrial Area, Hendon, SA
On this basis, for Scenario 1a (an above-ground building), the distance from the modelled source (at 1.5 mbgl) to the building foundation is set to 1.5 m. For Scenario 1b, the distance from the modelled source (at 3 mbgl) to the building foundation is set to 3 m.
For Scenario 2 (a building with a basement), the distance from the modelled source (at 3 mbgl) to the building foundation is set to a minimal distance (0.01 m).
6.3.2 Geological Profile The borelogs for the soil bores, groundwater monitoring wells and soil vapour bores in the area around SV10 (PB, 2013b; PB, 2014a and CH2M HILL, 2015) have been reviewed. Based on this review, a summary geological profile has been developed for the purposes of the HHRA as follows:
• Granular fill to 0.5 mbgl: modelled as a sand;
• Natural cohesive geology from 0.5 mbgl to 2.8 mbgl: The natural geology at the investigation area was logged as interbedded clays (with varying silt and sand contents) and clayey sands (with variable site contents). Particle size distribution (PSD) testing has been undertaken on natural soils (which were logged in the field as clayey sands), which indicated that these soils are cohesive in nature (results are presented in Appendix D, and indicate the soils to be variously classified as loam, silt loam, silty clay loam, silty clay); and
• Sand from 2.8 – 3.0 mbgl: based on the presence of sand at 2.8 – 3.0 mbgl in SV10D, the geology at this depth is conservatively modelled as a sand for the purposes of the HHRA.
This geological profile is in general accordance with the lithology summarised in CH2M HILL (2015).
Based on this profile, the geology is modelled as follows:
• Scenario 1: Above-ground building:
o Scenario 1a: 1 m thickness silt, overlain by 0.5 m of sand;
o Scenario 1b: 0.2 m sand, overlain by 2.3 m thickness silt, overlain by 0.5 m of sand;
• Scenario 2: Basement: minimal thickness of sand (0.01 m) from source to basement foundation
It is noted that the profile assumed by PB (2014a) for the wider area in their Phase 2 VRA assumes granular soils over a greater thickness than was identified by CH2M HILL for the area around SV10. The profile selected by PB (2014a) is considered appropriate for the wider area, as there were locations where more sand was identified than was identified in the vicinity of SV10, however more site specific geological parameters relevant to the investigation area have been included in this HHRA.
The key parameters utilised in the model to describe the properties of the vadose zone soils overlying the soil vapour impacts are air-filled porosity and water-filled porosity. The parameter values adopted in the model to represent these lithologies are detailed below in Section 6.3.3 (sand) and Section 6.3.4 (natural cohesive geology).
March 2015 Ref: 652556 Rev 1 Privileged and Confidential
23

Norton Rose Fulbright Australia HHRA for Vapour Impacts in the Vicinity of SV10
Hendon Industrial Area, Hendon, SA
6.3.3 Soil Properties: Sand To represent both the granular fill and the natural sands observed at depth, the default parameters for sand from Friebel & Nadebaum, 2011a have been adopted, notably:
• Air-filled porosity: 0.257; and
• Water filled porosity: 0.13.
6.3.4 Soil Properties: Natural cohesive geology Geotechnical testing has been undertaken on the natural cohesive soils beneath the investigation area to facilitate the selection of site-specific values for these parameters. Based on this data (presented in Appendix D), the following average soil properties for the modelled silt thickness have been adopted:
• Air-filled porosity: 0.07; and
• Water filled porosity: 0.33.
It is noted that the measured air-filled porosity is low when compared with the Friebel & Nadebaum (2011a) default values for the clay soil class (0.147 air-filled porosity; 0.3 water filled porosity) and silt soil class (0.180 air-filled porosity; 0.304 water filled porosity), indicating that the soils beneath the investigation area exhibit relatively low potential for vapour transport. It is noted that the results of the modelling from soil vapour concentrations are insensitive to changes in the adopted values for other soil properties (e.g. bulk density and organic carbon content) so default values from Friebel & Nadebaum, 2011a for other soil properties for a silt geology have been retained for simplicity.
It was noted by PB (2013b and 2014a) that samples in which moisture content was measured were taken in months that showed higher than average rainfall for that time of the year, and that these general conditions may have contributed to higher than average soil moisture conditions within the soil. However, the sampling undertaken by CH2M HILL was undertaken in early December 2014 (CH2M HILL, 2015), and generally lower moisture content was observed than had previously been observed by PB. Rainfall data provided by the Bureau of Meteorology (BoM) for Adelaide Airport (9 kilometres (km) away and the nearest weather station to the Site)5 has been reviewed to understand whether the conditions at the time of sampling are likely to relate to low-moisture or high moisture conditions:
• The historic average annual rainfall is 445 millimetres (mm) (37 mm / month);
• The rainfall in November 2014 was 27 mm; and the rainfall in December 2014 was 4.8 mm, both significantly below the historic monthly average; and
• There was 0 mm rainfall in the week preceding sampling (on 4 and 5 December 2014).
On this basis, the soils at the investigation area are considered likely to be representative of relatively dry conditions. As an increase in moisture content will result in reduced potential for vapour transport (and therefore risk), it is therefore likely that the soil moisture measured by CH2M HILL (and the parameters derived utilising this data) will be conservative for the investigation area.
Regardless of this, and to account for potential changes in soil moisture content in the future, consideration will be given to the sensitivity of the results to changes in the adopted values for
5 http://www.bom.gov.au/climate/averages/tables/cw_023034.shtml
Ref: 652556 March 2015 Privileged and Confidential Rev 1
24
Norton Rose Fulbright Australia HHRA for Vapour Impacts in the Vicinity of SV10 Hendon Industrial Area, Hendon, SA
these parameters as part of the sensitivity analysis (to more conservative literature values) detailed in Section 7.4.
6.3.5 Building Parameters The assessment has incorporated the default values to represent low-density residential buildings, as utilised in the NEPM 1999 (2013 amendment) for the derivation of the HILs and HSLs, and incorporated as defaults within the CRC CARE model (Friebel & Nadebaum, 2011b) utilised in this assessment.Reference has been made to buildings in the area of SV10, and the adopted default dimensions (10 m × 15 m × 2.4 m) are considered appropriate to represent the range of buildings observed in the area.
6.3.6 Qsoil/Qbuilding Ratio The assessment has conservatively assumed that advective (or pressure-driven) flows into buildings are active, in line with the approach presented in Friebel & Nadebaum (2011a). In reality, advective transport may be intermittent in nature (i.e. only active for part of the year), or negligible (e.g. air conditioned buildings are unlikely to be at negative pressure). The inclusion of advective flow in the models is conservative, and may therefore lead to overestimates of potential concentrations in residential buildings in the area.
The following discussion is presented in Friebel & Nadebaum (2011a) regarding the use of the Qsoil/Qbuilding ratio to assess the advective component of flow:
“The US EPA vapour intrusion model allows the advective flow component (Qsoil) to be specified or calculated based on an empirical relationship between permeability, crack width in foundation and differential pressure. Johnson (2005) provides a critical review of sensitive parameters in the vapour intrusion model. In this document, it is recommended that Q soil should not be used as an independent input. Instead, the equations should be reformulated in terms of (Qsoil/Qbuilding 6), and then a non-site-specific value of (Qsoil/Qbuilding) should be chosen after review of the database of empirically measured sub-slab attenuation factors produced by US EPA.
Johnson (2005) indicates a number of reasons for recommending this approach to advection flow into buildings. One reason is that the empirical data for the attenuation factor show very little influence of soil type, contrary to modelling results when Qsoil is linked to soil type. In part, this likely reflects the reality that foundations are rarely built in contact with native soils (i.e. often there is a more permeable layer to promote drainage), and even without that, the native soil likely does not uniformly contact the foundation at a uniform compaction and permeability.
In the absence of actual measured air flow rates from sub-slab into indoor air (i.e. Qsoil), the use of measured sub-slab to indoor air concentrations has been considered to be a reasonable approximation for Qsoil/Qbuilding. US EPA published a report in 2008 (revision on the data referred to in Johnson 2005) on measured attenuation factors between indoor air and sub-slab vapour concentrations. The report summarises the field measurements taken from 2002 to 2008 for measurements in sub-slab, soil-gas and crawl-space. [The attenuation factors range] from 1 to 0.00001. US EPA (2008) specifies that the median value is 0.005, with the 25th and 75th percentile one order of magnitude on either side. This data incorporates a mixture of petroleum and chlorinated hydrocarbon-impacted sites.
6 Qbuilding is defined as the total air volumetric flow rate through the building, which is calculated as the volume of the building multiplied by the air exchange rate.
March 2015 Ref: 652556 Rev 1 Privileged and Confidential
25

Norton Rose Fulbright Australia HHRA for Vapour Impacts in the Vicinity of SV10
Hendon Industrial Area, Hendon, SA
In the derivation of the interim soil vapour HILs for chlorinated hydrocarbons in the NEPM 1999 (2013 amendment), a very conservative Qsoil/Qbuilding ratio of 0.1 was adopted.
This value is towards the 95th percentile of the US EPA database, and has been adopted for the derivation of soil vapour HILs where the pathway of vapour migration is from subsurface (sub-slab or shallow soil vapour) to indoor air for residential and commercial buildings. This decision was based on the available attenuation factors for chlorinated compounds presented by US EPA, the recalcitrant nature of most chlorinated hydrocarbons in aerobic environments and consideration of the underlying principles for deriving HILs (in particular to embody a margin of safety for most exposure scenarios).
In the derivation of the HSLs, a value of 0.005 is instead adopted. A detailed discussion is presented in Friebel & Nadebaum (2011a) justifying this selected value:
The raw data that is incorporated into Figure 8 shows some points where the attenuation factor is between 0.01 and 1. These values likely reflect where the soil source concentration is low and contributions of indoor air sources are high, as well as non-representative sub-slab samples at those sites (Johnson 2009, pers. comm.).
Oregon Department of Environmental Quality (ODEQ) have recently published a guideline document for assessing vapour intrusion into buildings (ODEQ 2010). This document outlines a detailed analysis of the US EPA (2008b) document and source data. The following are the key points from Appendix A of the document:
When plotting all data points of sub-slab vapour versus indoor air concentration (chlorinated hydrocarbons, residential properties), the plot represents a ‘hockey stick’ shape with an inflection point around a sub-slab concentration of 148 μg/m3. This indicates that for low source concentrations (i.e. below 148 μg/m3), background levels in air have an influence on the apparent sub-slab to indoor air attenuation factor.
Plotting all chlorinated hydrocarbon data points greater than 1000 μg/m3 shows a statistically relevant correlation (linear) between sub-slab and indoor air concentration (i.e. attenuation factor) (refer to Figure 9). For chlorinated hydrocarbons and residential buildings, the statistical distribution for attenuation factors is 90th percentile 0.008, 75th percentile 0.005, and 50th percentile 0.002. The 90th and 75th percentiles were in the same range as the median values reported by US EPA (2008).
ODEQ recommend that the 75th percentile attenuation factor of 0.005 be adopted for screening purposes in residential properties. For commercial properties ODEQ indicated that the 75th percentile attenuation factor was 0.001, however this result was based on a much lower quality data set.
A sub-slab to indoor air attenuation factor of 0.005 was selected for the purpose of deriving the HSLs. This figure represents the upper value considered not to be affected by indoor air sources, background air concentration or other factors. This factor has been selected to represent Qsoil/Qbuilding. The selected value has been set conservatively to protect the majority of sites with buildings.
In line with the further arguments presented in Friebel & Nadebaum, 2011, and in particular considering the fact that the database on which this discussion is based relates specifically to chlorinated hydrocarbon soil vapour sources, it is considered appropriate to adopt a Qsoil/Qbuilding ratio of 0.005 as a default value for the investigation area, and a value of 0.1 is considered to be overly conservative. The difference between the adopted value and the value of 0.1 selected in the interim soil vapour HIL derivation is considered to relate primarily to the stated highly conservative approach adopted in the interim HIL derivation.
Ref: 652556 March 2015 Privileged and Confidential Rev 1
26

Norton Rose Fulbright Australia HHRA for Vapour Impacts in the Vicinity of SV10 Hendon Industrial Area, Hendon, SA
The sensitivity of the results of the assessment to changes in the Qsoil/Qbuilding parameter are explored further as part of the sensitivity analysis presented in Section 7.4. It is noted that the results are only sensitive to this parameter where the risk is driven by the advective flow component (rather than the diffusive component). In practice, and in particular for this site where risks are generally limited by diffusion processes (given the low permeability of the site soils), the Qsoil/Qbuilding parameter is only critical for soil vapour sources located close to the building foundation.
6.3.7 Attenuation between the basement and ground floor For Scenario 2 (a building with a basement construction), the assessment primarily considers residential buildings with a wine cellar, as such residences are known to be present within the wider area (though not necessarily in the vicinity of SV10).
Limited time is likely to be spent in such a basement (as discussed further below in Section 6.4), but there is the potential for further exposure to occur within the overlying floors of the building.
For the purposes of this assessment, it is conservatively assumed (as discussed below in Section 6.4), that with the exception of the limited time spent in the basement, the remainder of the time spent indoors is spent on the ground floor (where concentrations would be lower than in the basement). Review of the buildings in the area indicates that they are predominantly single-storey buildings. On this basis, the attenuation between the basement and the ground floor is considered further (as discussed below) and vapour concentrations on floors above the ground floor have not been estimated for the purposes of this assessment.
For a residential house with a wine cellar, there is likely to be limited airflow connection between the basement and the ground floor. As such, mixing will not be complete, and concentrations on the ground floor are likely to be markedly lower than in the basement itself. It is necessary to estimate the attenuation in concentrations that will occur between the basement and the ground floor in order to estimate the level of risk associated with exposure on the ground floor.
A ratio between concentrations in the basement (Cb) and concentrations in the ground floor (Ci) (Cb/Ci) of 10 has been adopted as a conservative estimate of the attenuation in concentrations that will occur between the basement and ground floor. This factor has been selected based on review of the following:
• Chan et al, 2010, Characterizing TCE Exposure Distribution for Occupants of Houses with Basements This study focused on the collection of field data (from 13 homes overlying a plume of TCE contamination in Colorado, US) to allow the variation in concentrations of TCE between basements and overlying floors to be better understood. The data indicated that attenuation factors were highly dependent on temperature; with significant attenuation (a mean Cb/Ci ratio of 15.6) observed provided the ambient temperature was above around 15℃, but lower attenuation factors observed at lower temperatures during the Colorado winter (a mean Cb/Ci ratio of 6.8 was observed for temperatures of 4℃ -15℃; a mean Cb/Ci ratio of 1.7 was observed for temperatures of <4℃). For our project area, the attenuation factor for temperatures above 15℃ is considered most appropriate, as the mean daily temperature in the area ranges from a minimum of 15℃ (in July) to a
March 2015 Ref: 652556 Rev 1 Privileged and Confidential
27

Norton Rose Fulbright Australia HHRA for Vapour Impacts in the Vicinity of SV10
Hendon Industrial Area, Hendon, SA
maximum of 28℃ (in January)7. This study is considered to support a Cb/Ci ratio of 10 as an appropriate and conservative value for this project;
• Olson & Corsi, 2001. Characterizing exposure to chemicals from soil vapor intrusion using a two-compartment model. This study focused on the development of a model to consider a two-compartment building (i.e. the basement as one compartment, and upper floors as a second) as opposed to a one well-mixed compartment). A field study was undertaken to quantify parameters associated with this model, including the basement to ground floor exchange rates. The results indicated that within a residential home (with an internal stairway connecting the basement and ground floor) the concentration within the first-floor is approximately 10 times lower than the concentration within the basement; and
• Fang & Persily, 1995, Airflow and Radon Transport Modelling in Four Large Buildings. Computer simulations were undertaken to simulate multizone airflow and contaminant transport under a wide range of conditions (e.g. changing wind speeds, building air exchange rates, and temperature differentials between the building and outdoors). The results indicated a wide range in attenuation factors between the basement and ground floor (0 to 100), but also that the lower attenuation factors (i.e. similar concentrations in the basement and overlying floors) were only observed in conditions where the basement was at ambient or positive pressure, which prevents the advective flow of vapours from underlying soils. Note that the modelling undertaken for this HHRA conservatively assumes that advective flow into the building is active (as discussed in Section 6.3.5). Of those simulations where there was non-zero advective flow into the basement, the estimated Cb/Ci ratio was >20 (and more commonly 100) under most conditions, including plausible conditions for this investigation area (i.e. lower Cb/Ci ratios in the order of 3 - 10 were only observed in models with likely non-applicable parameters, such as negligible rates of air exchange between above ground floors and outdoor air).
For the purposes of this HHRA, it is conservatively assumed (as discussed below in Section 6.4), that with the exception of the limited time spent in the basement, the remainder of the time spent indoors is spent on the ground floor (where concentrations would be higher than in overlying floors, should they exist). Review of the buildings in the area indicates that they are predominantly single-storey buildings, so this is considered to be both appropriate and conservative. On this basis, the concentration on the ground floor is estimated as one tenth of the basement concentration, and vapour concentrations on floors above the ground floor have not been estimated for the purposes of this assessment.
6.4 Exposure Parameters
Schedule B4 of the NEPM 1999 (2013 amendment) provides the following guidance with regard to selecting exposure parameters:
“In selecting values to represent exposed population behaviour, it is important to consider the following:
7 http://www.bom.gov.au/climate/averages/tables/cw_023034.shtml
Ref: 652556 March 2015 Privileged and Confidential Rev 1
28

Norton Rose Fulbright Australia HHRA for Vapour Impacts in the Vicinity of SV10 Hendon Industrial Area, Hendon, SA
• Plausible high-end exposure — is the recommended approach to judging receptor population behaviour. The likelihood of the modelled scenario should be considered, and behaviours which might reasonably apply to real people should be selected for modelling.
• Consistency— Schedule B7 provides behavioural and exposure duration assumptions for four standard exposure scenarios. Where site-specific assessments are essentially considering the same exposed populations in similar circumstances to the standard scenarios, the Schedule B7 behavioural assumptions should be adopted. This promotes consistency between site-specific risk assessments. Where the exposed population differs from the standard scenarios, amendments to behavioural assumptions can be made and should be clearly justified.”
For the purposes of this HHRA, the default exposure parameters for low-density residential receptors presented in Schedule B7 and utilised in the NEPM 1999 (2013 amendment) for the derivation of the HIL-A and HSL-A (for residential land use) values have been adopted (where relevant). These parameters are considered to provide an estimate of plausible high-end exposure for general residential use, and provide appropriate consistency for a generic residential use on the investigation area.
The adopted parameter values are detailed in the model input and output sheets provided in Appendix E and summarised below:
• Residents are assumed to spend 30 years living in an on-site building directly overlying the maximum identified soil vapour concentrations;
• It is assumed that residents will remain at home every day (365 days a year), and the impacts would remain beneath the area (at the maximum concentration) for the whole 30 year exposure period;
• For buildings without a basement: a resident may spend up to 20 hours per day indoors on the ground floor of a building. Exposure concentrations will be highest indoors and on the ground floor, so assuming this is where the majority of the day is spent is a conservative approach.
• For buildings with a basement: This assessment primarily considers residential buildings with a wine cellar, as such residences are known to be present within the wider area (though not necessarily in the vicinity of SV10). Exposure parameters specifically relating to a building with a basement are unavailable in the NEPM 1999 (2013 amendment). The scenario has been assessed as follows:
o It is likely that only very limited time would be spent in the basement (likely to be around 15 minutes/day, and certainly less than 1 hour/day). An exposure time of 30 minutes/day has been assumed in the initial modelling.
o It is conservatively assumed that with the exception of the limited time spent in the basement, the remainder of the time spent indoors (19.75 hours in the initial model) is spent on the ground floor.
o Other plausible exposure times associated with a wine cellar exposure (15 minutes/day; 1 hour/day) considered as part of the sensitivity analysis presented in Section 7.4.
March 2015 Ref: 652556 Rev 1 Privileged and Confidential
29

Norton Rose Fulbright Australia HHRA for Vapour Impacts in the Vicinity of SV10
Hendon Industrial Area, Hendon, SA
o While there is no evidence of residences in the area with habitable basements, the sensitivity analysis also conservatively considers the scenario of a habitable basement where the full indoor exposure time (20 hours/day) is spent within the basement.
6.5 Areas of conservatism
In addition to the discussions presented above, further key conservative assumptions made in this HHRA are discussed below:
• Residences are assumed to directly overlie the highest measured concentrations, and these concentrations are considered to extend beneath the entire building footprint. This is a conservative approach to evaluate receptors in a building located in the vicinity of the investigation area;
• No attenuation processes through the profile (e.g. degradation of chlorinated hydrocarbon vapours, or sorption to soil during vapour transport) have been considered; and
• Modelling Algorithms: The models that consider diffusion from the source do not consider degradation of the chemicals or the adsorption to soil or water molecules.
6.6 Exposure Concentrations
The model inputs and outputs (including the estimated indoor air concentrations) are presented in Appendix E. These results are combined with the results of the toxicity assessment (Section 5) in order to estimate potential risk (Section 7).
Ref: 652556 March 2015 Privileged and Confidential Rev 1
30

Norton Rose Fulbright Australia HHRA for Vapour Impacts in the Vicinity of SV10 Hendon Industrial Area, Hendon, SA
7. Risk Characterisation
Risk characterisation is the final step in a HHRA. It involves the combination of the results of the exposure assessment and toxicity assessment to provide a quantitative assessment of non-threshold carcinogenic risk and threshold risk.
The calculation of risks has been undertaken using the CRC CARE HSL extension model (Friebel & Nadebaum, 2011b) used to develop and adjust the HSLs presented in the NEPM 1999 (2013 amendment). This model combines the toxicity and exposure assessment components of the risk assessment to provide an estimation of the level of risk. The model has been selected as it provides a high level of confidence that the approach is generally consistent with the NEPM 1999 (2013 amendment). The calculation sheets are presented in Appendix E.
7.1 Hazard Index for Threshold Effects
The potential for adverse threshold effects, resulting from exposure to an individual COPC, has been evaluated by comparing an exposure level, expressed as an exposure concentration8, with the relevant regulatory or guideline level (the RfC). The resulting ratio is referred to as the hazard quotient, and is derived in the following manner for inhalation exposures:
𝐸𝐸𝐸𝐸𝐸𝐸𝑄𝑄𝐸𝐸𝑄𝑄𝐻𝐻𝑄𝑄 𝐶𝐶𝑄𝑄𝑄𝑄𝐶𝐶𝑄𝑄𝑄𝑄𝑄𝑄𝐻𝐻𝐻𝐻𝑄𝑄𝑄𝑄𝑄𝑄𝑄𝑄 𝑄𝑄𝑄𝑄 𝐴𝐴𝑄𝑄𝐻𝐻 𝐻𝐻𝐻𝐻𝐻𝐻𝐻𝐻𝐻𝐻𝐻𝐻 𝑄𝑄𝑄𝑄𝑄𝑄𝑄𝑄𝑄𝑄𝑄𝑄𝑄𝑄𝑄𝑄 (𝑄𝑄𝑄𝑄ℎ𝐻𝐻𝑎𝑎𝐻𝐻𝑄𝑄𝑄𝑄𝑄𝑄𝑄𝑄) =
𝑅𝑅𝑅𝑅𝐶𝐶 − 𝐵𝐵𝐻𝐻𝐶𝐶𝐵𝐵𝐵𝐵𝐻𝐻𝑄𝑄𝑄𝑄𝑄𝑄𝐻𝐻
If the exposure concentration exceeds the RfC (i.e. if the hazard quotient exceeds one), then this would indicate potentially unacceptable chemical intakes. Note that the hazard quotient does not represent a statistical probability of an effect occurring.
To assess the overall potential for adverse health effects posed by simultaneous exposure to multiple chemicals, the hazard quotients for each chemical have been summed. The resulting sum is referred to as the hazard index (HI). The HI approach assumes that multiple sub-threshold exposures to several chemicals could result in a cumulative adverse health effect. This is considered to be a conservative approach.
An “acceptable” risk in this assessment has been defined as a HI of up to and including one (1) (as per risk assessment industry practice, supported by protocols outlined in NEPM 1999 (2013 amendment).
If the HI is 1 or less, cumulative exposure to the site chemicals is judged unlikely to result in an adverse effect. If the HI is greater than 1, a more detailed and critical evaluation of the HI (including consideration of specific target organs affected and mechanisms of toxic action of the COPCs) would be required to ascertain if the cumulative exposure might exceed a HI of 1 on a target organ (or mechanism of action) basis.
All hazard quotient and HI calculations are presented in Appendix E. These calculations are built into the selected model (the CRC CARE extension model, Friebel & Nadebaum, 2011b) for exposures within an above-ground building and within a basement. For exposure on the ground floor (where the air concentration has been estimated using an attenuation factor
8 The exposure concentration represents a time-averaged air concentration over the exposure duration (threshold exposures) and over a lifetime (non-threshold exposures) is calculated in line with the guidance in Schedule B4 of the NEPM. These calculations are built into the selected model (the CRC CARE extension model) for exposures within an above-ground building and within a basement. For exposure on the ground floor (where the air concentrations has been estimated using an attenuation factor between the basement and ground floor), the exposure concentrations have been calculated using a spreadsheet model in accordance with these equations. The calculations are presented in Appendix E.
March 2015 Ref: 652556 Rev 1 Privileged and Confidential
31

Norton Rose Fulbright Australia HHRA for Vapour Impacts in the Vicinity of SV10
Hendon Industrial Area, Hendon, SA
between the basement and ground floor), the hazard quotient and HI calculations have been performed using a spreadsheet model. The calculations are presented in Appendix E.
7.2 Non-Threshold Carcinogenic Risk
Non-threshold carcinogenic risks are estimated as the incremental probability of an individual developing cancer over a lifetime as a result of exposure to a potential non-threshold carcinogen. The numerical estimate of excess lifetime cancer risk is calculated as follows for inhalation exposures:
Carcinogenic Risk (inhalation) = Exposure Concentration in Air • Inhalation Unit Risk
The total non-threshold carcinogenic risk is the sum of the risk for each chemical for each pathway. Again, this is considered to be a conservative approach, as not all non-threshold COPC may act via the same mode of action.
Defining an acceptable level of cancer risk for contaminated land exposures is a complex issue, which needs to take into consideration multiple considerations, for example:
• Background incidence of cancer is high, and people are routinely exposed to many carcinogens both incidentally (e.g. traffic fumes) and through choice (e.g. cigarette smoking and alcohol consumption); these exposures often result in risks substantially higher than those resulting from contaminated land exposures;
• People have a right to not be exposed to high risk agents introduced into their environment in a manner outside their control; and
• Cancer development is a cumulative, step-by-step process; the allowable additional exposure from contaminated land should be set at a level that does not increase the existing risk by anything other than a negligible amount.
A detailed discussion of the selection of the acceptable incremental lifetime cancer risk (ILCR) is presented in Schedule B4 of the NEPM 1999 (2013 amendment), taking into account the approach adopted by various international agencies. In accordance with the guidance presented in the NEPM 1999 (2013 amendment), the acceptable ILCR (for exposure to single or multiple non-threshold contaminants) has been defined as 1 in 100,000 (1 × 10⁻⁵).
All ILCR calculations are presented in Appendix E. These calculations are built into the selected model (the CRC CARE extension model, Friebel & Nadebaum, 2011a) for exposures within an above-ground building and within a basement. For exposure on the ground floor (where the air concentrations has been estimated using an attenuation factor between the basement and ground floor), the ILCR have been performed using a spreadsheet model. The calculations are presented in Appendix E.
7.3 Summary of Risk
A summary of the calculated risks for the assessed exposure scenarios are presented below:
7.3.1 Scenario 1 The calculated risks to residents in the area within above-ground buildings are presented below:
Ref: 652556 March 2015 Privileged and Confidential Rev 1
32

Norton Rose Fulbright Australia HHRA for Vapour Impacts in the Vicinity of SV10 Hendon Industrial Area, Hendon, SA
Table 7-1 Scenario 1: Above-ground residential building
Receptor and Pathway Threshold risk Non-Threshold Risk (HI) (ILCR)
Scenario: 1a 1.5 mbgl data
0.08 3 × 10⁻⁷
Scenario 1b: 3.0 mbgl data
0.01 4 × 10⁻⁸
Notes: Risk estimate totals have been rounded from the values presented in the modelling outputs to one significant figure (based on the level of uncertainty associated with the modelling).
In summary:
• The calculated total non-threshold carcinogenic risk associated with exposure in an above ground building is below the acceptable level of 1 × 10⁻⁵ .
• The calculated total threshold HI associated with exposure in an above ground building is less than the acceptable level of 1.
• The conclusions of the assessment (i.e. risks are low and within acceptable levels identified by NEPM 1999, 2013 amendment) remain unchanged regardless of whether the shallower or deeper soil vapour data is utilised to define source concentrations. In this way, confidence is maintained in the applicability of the results.
7.3.2 Scenario 2 The calculated risks to residents in the area within buildings with a basement construction (where the basement is used as a wine cellar) are presented below:
Table 7-2 Scenario 2: Residential building with basement construction
Receptor and Location
Exposure in Basement
Threshold risk (HI)
0.15
Non-Threshold Risk (ILCR)
5.6 × 10⁻⁷
Exposure on Ground Floor 0.59 2.2 × 10⁻⁶
Total 0.7 3 × 10⁻⁶
Notes: Risk estimate totals have been rounded from the values presented in the modelling outputs to one significant figure (based on the level of uncertainty associated with the modelling).
In summary:
• The calculated total non-threshold carcinogenic risk associated with exposure in a building with a basement used as a wine cellar is below the acceptable level of 1 × 10⁻⁵ .
• The calculated total threshold HI associated with exposure in a building with a basement used as a wine cellar is less than the acceptable level of 1.
March 2015 Ref: 652556 Rev 1 Privileged and Confidential
33

Norton Rose Fulbright Australia HHRA for Vapour Impacts in the Vicinity of SV10
Hendon Industrial Area, Hendon, SA
7.3.3 Overall Results Overall, the results indicate that, based on the currently measured soil vapour concentrations, the level of potential risk posed to residents in the area is within acceptable levels identified by NEPM 1999 (2013 amendment).
While the estimated risks are below acceptable levels identified by NEPM 1999 (2013 amendment), it is noted that there are a number of areas of uncertainty in the modelling. In particular, there is potential for the soil moisture profile to vary, or for shallow soils to have a lower moisture content than the site-specific value adopted in the modelling. As such, consideration is given to the sensitivity of the results to changes in the adopted values for a number of parameters as part of the sensitivity analysis (detailed in Section 7.4 below).
7.4 Sensitivity Analysis
A sensitivity analysis has been conducted in order to assess the sensitivity of the results of the assessment to varying the input values for a number of key parameters. The sensitivity analysis and results are detailed below. The numerical results of the additional modelling runs performed for the purposes of the sensitivity analysis are provided in Appendix F. The sensitivity analysis considered changes to the following inputs:
7.4.1 Above-ground buildings The sensitivity analysis utilised the Scenario 1a baseline model (i.e. the model utilising the highest concentrations measured in the 1.5 – 1.8 mbgl depth range) during the December 2014 (CH2M HILL, 2015) investigation. The sensitivity analysis considered changes to the following inputs, with model input parameters otherwise unchanged from the baseline model:
• Soil Properties: the December 2014 soil vapour sampling event (CH2M HILL, 2015) was undertaken during a dry period of the year, as discussed in Section 6.3.4, and as such, the soil moisture properties (based on site measurements undertaken at this time) are likely to be overall conservative for adoption in the model. However, as a conservative measure, and in order to account for possible variations in soil properties, the sensitivity analysis for this scenario has considered default literature values for cohesive soil (both clay class and silt class soils from Friebel & Nadebaum, 2011a) in place of the site-specific parameters for the natural geology. The literature values for sand adopted to represent the granular fill are unchanged from the original model.
• Soil Vapour Concentrations: additional soil vapour data is available from the previous investigations undertaken by PB (in June 2013 (PB, 2013b); March 2014 (PB, 2014a); and August 2014 (PB, 2014b), however, the CH2M HILL data collected in December 2014 (CH2M HILL, 2015) is considered as the primary dataset for this assessment (because this data is the most recent and most extensive dataset for the area around SV10, and there is a level of uncertainty regarding the representativeness of the data collected on the earlier investigations, as described in Section 4.1.2). Despite this, as a conservative measure, and to assess whether the higher concentrations measured during the March 2014 (PB, 2014a) visit have the potential to impact upon the conclusions of the assessment, the maximum concentration of TCE measured by PB (2014a) in March 2014 (16,000 µg/m3) has been considered as part of the sensitivity analysis. The parameters are otherwise unchanged from the original model;
Ref: 652556 March 2015 Privileged and Confidential Rev 1
34

Norton Rose Fulbright Australia HHRA for Vapour Impacts in the Vicinity of SV10 Hendon Industrial Area, Hendon, SA
• Advective transport: as discussed in Section 6.3.6, the adopted Qsoil/Qbuilding of 0.005 is considered appropriate and conservative for a slab on ground building. However, a more conservative value of 0.1 (consistent with the interim soil vapour HILs) is considered in the sensitivity analysis as a conservative measure.
• Building with a crawl space construction: as discussed in Section 4.3, the baseline model specifically considers the potential risks to residents within an above ground residential building with a slab on ground construction. It is considered likely that this assessment will also provide a conservative assessment of the potential risks within a building with a crawl space construction, given additional potential for air mixing and exchange, and the fact advective transport (which is assumed to be active for a building with a slab on grade construction) is unlikely to be active for a building with a crawl space construction, as the air pressure in the crawl space is likely to be the same as that outside the building footprint. However, further assessment of the risks to residents within a building with a crawl space construction is considered here as a confirmatory measure. In the absence of an widely-accepted model for the assessment of this scenario in Australia, a conservative assessment has been performed utilising the baseline model with the following amendments:
o The building foundation slab is assumed to be absent (i.e. the crawl space is above bare soil); on this basis a minimal foundation slab has been adopted9, together with a crack fraction of 1;
o Advective transport is assumed to be inactive10;
o In the absence of empirical data detailing the attenuation between the crawl space and the indoor air space, the assessment conservatively assumes no barrier between the crawl space and indoor air; this is simulated in the model by assuming a single, room-height air space above the bare soil;
• The results of the sensitivity analysis are presented below in graphical form:
9 A slab thickness of zero cannot be entered in the model; this has been simulated by entering a negligible slab thickness of 1 x 10-99 cm. 10 A Qsoil/Qbuilding ratio of zero cannot be entered in the model; this has been simulated by entering a negligible Qsoil/Qbuilding ration of 1 x 10-99 .
March 2015 Ref: 652556 Rev 1 Privileged and Confidential
35

Norton Rose Fulbright Australia HHRA for Vapour Impacts in the Vicinity of SV10
Hendon Industrial Area, Hendon, SA
Figure 7-1: Sensitivity Analysis – Above ground building (Non-threshold risks)
1.E-07
1.E-06
1.E-05
1.E-04
1.E-03
CRC CARE clay CRC CARE silt Maximum PB concentrations
0.1
Baseline Geology Concentrations Qsoil / Qbuilding ratio
Crawl space building
Incr
ease
d Li
fetim
e Ca
ncer
Ris
k
Acceptable Risk Level
Figure 7-2: Sensitivity Analysis – Above ground building (Threshold risks)
0.01
0.1
1
10
CRC CARE clay CRC CARE silt Maximum PB concentrations
0.1
Baseline Geology Concentrations Qsoil / Qbuilding ratio
Crawl space building
Haza
rd In
dex
Acceptable Risk Level
Ref: 652556 March 2015 Privileged and Confidential Rev 1
36

Norton Rose Fulbright Australia HHRA for Vapour Impacts in the Vicinity of SV10 Hendon Industrial Area, Hendon, SA
• Geology: All scenarios evaluated resulted in risk estimates remaining below the acceptable level;
• PB Source Concentrations: Risk estimates remain below the acceptable level when the maximum concentrations measured by PB (2014a) are adopted as source concentrations;
• Qsoil/Qbuilding : The results of the model are largely insensitive to changes in the Qsoil/Qbuilding
parameter; this is as expected for a source depth not in close proximity to the building foundation;
• Building with a crawl space construction: the results of the model are unchanged based on the highly conservative crawl space scenario. On this basis, it is considered that the results of the assessment are conservative for buildings with both slab on ground and crawl space constructions; and
• Based on the available data, the potential risks to residents in an above ground building near SV10 are within acceptable levels identified by NEPM 1999 (2013 amendment).
7.4.2 Building with a basement The sensitivity analysis utilised the Scenario 2 baseline model. The sensitivity analysis considered changes to the following inputs, with model input parameters otherwise unchanged from the baseline model:
• Time in basement: the HHRA considered an exposure time in the basement of 30 minutes/day as appropriate and conservative for a wine cellar exposure scenario. The sensitivity analysis further considers exposure times of 15 minutes/day and 1 hour/day. The total time spent indoor is maintained as 20 hours/day, and the time on the ground floor is therefore calculated as 19.75 hours (for the exposure scenario with 15 minutes in the basement) and 19 hours (for 1 hour in the basement). An additional scenario of a habitable basement is also considered, where the full 20 hours exposure is conceptualised to occur within the basement;
• Advective transport: as discussed in Section 6.3.6, the adopted Qsoil/Qbuilding ratio of 0.005 is considered appropriate and conservative. However, a more conservative value of 0.1 (consistent with the interim soil vapour HILs) is considered in the sensitivity analysis as a conservative measure; and
• Attenuation between basement and ground floor: as discussed in Section 6.3.7, the adopted Cb/Ci ratio of 10 is considered appropriate and conservative. However, a value of 5 is considered in the sensitivity analysis as a conservative measure.
The results of the sensitivity analysis are presented below in graphical form:
March 2015 Ref: 652556 Rev 1 Privileged and Confidential
37
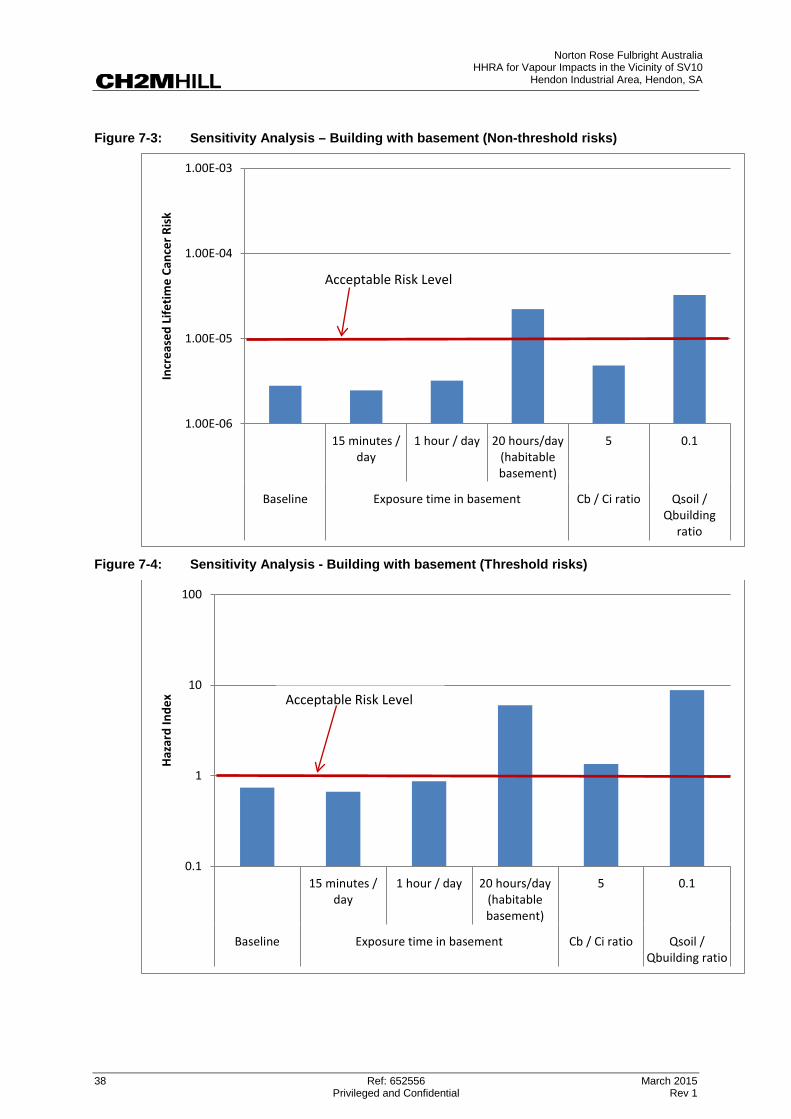
Norton Rose Fulbright Australia HHRA for Vapour Impacts in the Vicinity of SV10
Hendon Industrial Area, Hendon, SA
Figure 7-3: Sensitivity Analysis – Building with basement (Non-threshold risks)
1.00E-03 In
crea
sed
Life
time
Canc
er R
isk
1.00E-04
1.00E-05
1.00E-06
Acceptable Risk Level
15 minutes / 1 hour / day 20 hours/day 5 0.1 day (habitable
basement)
Baseline Exposure time in basement Cb / Ci ratio Qsoil / Qbuilding
ratio
Figure 7-4: Sensitivity Analysis - Building with basement (Threshold risks)
100
10
Haza
rd In
dex Acceptable Risk Level
1
0.1 15 minutes / 1 hour / day 20 hours/day 5 0.1
day (habitable basement)
Baseline Exposure time in basement Cb / Ci ratio Qsoil / Qbuilding ratio
Ref: 652556 March 2015 Privileged and Confidential Rev 1
38

Norton Rose Fulbright Australia HHRA for Vapour Impacts in the Vicinity of SV10 Hendon Industrial Area, Hendon, SA
• Exposure time in basement:
o Risk estimates remain below the acceptable level for a range in exposure times within the basement of 0.25 – 1 hour/day (this range is considered appropriate for a basement used as a wine cellar, or for other purposes for which exposure is likely to be limited (e.g. storage or as a laundry / utility space)). On this basis, risks are considered to be within acceptable levels.
o However, the risk estimates are above the acceptable level (though by less than an order of magnitude) for a scenario where the entire time indoors is spent within the basement (this is only likely where the basement is constructed to be habitable, and is arranged as a separate residence from the overlying floors);
• Attenuation between basement and ground floor: reducing the attenuation factor between the COPC concentrations in the basement and the ground floor from 10 to 5 results in potential threshold risks marginally above the acceptable level (non-threshold risks remain acceptable). As discussed in Section 6.3.7, it is considered that an attenuation factor of 10 is appropriate and conservative for the investigation area given the likely compartmentalisation of the basement from the ground floor and the average temperatures reported for this region. Given the marginal nature of the exceedance, the overall conservatism in the model, and the appropriateness of the originally selected value, potential risks above acceptable levels are not expected;
• Advective transport: increasing the Qsoil/Qbuilding ratio to 0.1 results in risk estimates above (but less than an order of magnitude above) the acceptable level. As discussed in Section 6.3.6, it is considered that a Qsoil/Qbuilding ratio of 0.005 is appropriate and conservative for the investigation area given that advective (or pressure-driven) flows into buildings are likely to be limited. A higher value was considered as part of the sensitivity analysis to illustrate the impact on the results of adopting a value equal to that utilised in the interim soil vapour HIL derivation, but such a value is considered unlikely to be representative for the investigation area, particularly over the extended periods over which exposure is modeled (i.e. 30 years). On this basis, and given the overall conservatism in the model, potential risks are expected to remain within acceptable levels for a wine cellar scenario (i.e. for a basement used for less than 1 hour / day).
Summary
• Based on the available data, the potential risks to residents in a building with a basement are below acceptable levels identified by NEPM 1999 (2013 amendment), provided the basement is used for purposes for which exposure is likely to be limited (e.g. as a wine cellar, for storage or as a laundry / utility space).
• Based on the available data, potential risks to residents in a habitable basement utilised as a primary living space may exceed acceptable levels identified by NEPM 1999 (2013 amendment). Should such an exposure scenario be possible in the area, further assessment is needed to evaluate potential risks to residential users of such a basement.
March 2015 Ref: 652556 Rev 1 Privileged and Confidential
39

Norton Rose Fulbright Australia HHRA for Vapour Impacts in the Vicinity of SV10
Hendon Industrial Area, Hendon, SA
8. Conclusions and Recommendations
This section presents the conclusions and recommendations for the HHRA.
8.1 Conclusions
A HHRA has been conducted to assess the potential level of risk posed to residents in the area by the currently measured (CH2M HILL, 2015) soil vapour concentrations in the vicinity of SV10. PB (2013b and 2014a) has previously undertaken risk assessments across the Site, however the overall objective of this HHRA was to provide a further assessment to the EPA of the potential indoor air risks to residents in the vicinity of SV10, utilising the results of the additional investigations recently undertaken by CH2M HILL (2015) and taking into consideration the potential for buildings with a cellar / basement construction to be present and variable soil moisture contents.
This assessment incorporates the maximum concentrations measured by CH2M HILL (2015) in SV10 and SV10D, as well as in the soil vapour bores in the surrounding area (including SV09, SV12, SV16, SV18S, SV18D,SV19S, SV19D, SV20S and SV20D). The conclusions of this assessment are considered applicable to the area defined by this network of soil vapour bores based on the information collected to date.
The HHRA considers residential users in the investigation area. Based on the HHRA results (presented in Section7.3) and the sensitivity analysis (presented in Section 7.4), the following conclusions are drawn:
• Scenario 1: Above ground building
o The potential risks to residents in the area of SV10 based on the currently measured soil vapour concentrations (CH2M HILL, 2015) are estimated to be within acceptable levels identified by NEPM 1999 (2013 amendment);
o The current level of potential risk is therefore considered to be low and acceptable to residents within above ground buildings in the area; and
o Further assessment of the current potential risk from vapour intrusion is not considered to be warranted to residents within above ground buildings in the area. Therefore, additional soil vapour delineation assessment is not considered to be required to the east and west of SV10 for shallow soil vapour impacts;
• Scenario 2: Building with a basement construction.
o The potential risks to residents based on the currently measured concentrations are estimated to be within acceptable levels identified by NEPM 1999 (2013 amendment), provided the basement is used for purposes for which exposure is likely to be limited (e.g. as a wine cellar, for storage or as a laundry / utility space);
o The current level of potential risk is therefore considered to be low and acceptable to residents utilising a basement for such purposes;
o Further assessment of the current potential risk is not considered to be warranted to residents utilising a basement for purposes where exposure is likely to be limited. Therefore, additional soil vapour delineation assessment is not considered to be
Ref: 652556 March 2015 Privileged and Confidential Rev 1
40

Norton Rose Fulbright Australia HHRA for Vapour Impacts in the Vicinity of SV10 Hendon Industrial Area, Hendon, SA
required to the east and west of SV10 for deep soil vapour impacts if basements are not present or if cellars / basements are only utilised for short periods of time per day; and
o Based on the available data and the conservative nature of the risk model, potential risks to residents in a habitable basement utilised as a primary living space may exceed acceptable levels identified by NEPM 1999 (2013 amendment). Should such an exposure scenario be possible in the area, further investigation and assessment would be needed to evaluate potential risks to residential users of such a basement. This is further discussed in Section 8.2.
There are currently a number of uncertainties regarding whether the measured soil vapour concentrations in this area are representative of plausible high-end concentrations in the future. In particular, areas of uncertainty include:
• The extent and magnitude of hydraulically up-gradient sources, and the potential for further migration of these sources in groundwater to the vicinity of SV10, such that groundwater concentrations of VOCs in this area might increase in the future; and
• The potential for source concentrations of daughter products of the original contaminant source (e.g. vinyl chloride) to increase in the future due to degradation processes within groundwater up-gradient. It is noted that vinyl chloride is readily degraded in groundwater under a wide range of conditions, and as such there may be a low potential for it to accumulate; however, additional assessment would be required to confirm this.
On this basis, this HHRA focuses on the current level of potential risk based on currently available data. In addition, the above conclusions do not relate to the future potential level of risk to residents in the vicinity of SV10.
8.2 Recommendations
On the basis of the conclusions presented in Section 8.1 above, the following recommendation is made:
• Additional data (e.g. surveys and/or interviews) should be collected to determine whether any habitable basements exist in the area and therefore whether vapour intrusion into habitable basements is a potentially active exposure scenario. Should such basements be identified, the exact nature of the required further investigations would be dependent on the location and nature of the property, but could include indoor air sampling and/or the collection of soil vapour data in the vicinity of the building with a habitable basement. Additional survey data could be collected to determine details of the people exposed, and the duration and frequency of their exposure.
March 2015 Ref: 652556 Rev 1 Privileged and Confidential
41

Norton Rose Fulbright Australia HHRA for Vapour Impacts in the Vicinity of SV10
Hendon Industrial Area, Hendon, SA
9. Limitations
This HHRA report is given strictly in accordance with, and subject to, the following limitations:
a) The HHRA report was prepared for Norton Rose Fulbright Australia (“Client”) in accordance with the Scope of Work agreed between CH2M HILL and the Client;
b) CH2M HILL assumes no responsibility for conditions we were not authorised to investigate or conditions not generally recognised as environmentally unacceptable when the services were performed;
c) This report is based, in part, on unverified information supplied to CH2M HILL from several sources during the project research. Therefore, CH2M HILL does not guarantee its completeness or accuracy, and assumes no responsibility for errors or omissions related to this externally supplied information;
d) An understanding of the site conditions depends on the integration of many pieces of information; some regional, some site specific, some structure-specific and some experienced-based;
e) The advice tendered in this report is based on information obtained from the field investigation locations, test points, sample points and field and laboratory data, and is not warranted in respect to the conditions that may be encountered across the Site at other than these locations. It is emphasised that the actual characteristics of the sub-surface and surface materials may vary between adjacent test points and sample intervals and at locations other than where observations, explorations and investigations have been made. Sub-surface conditions and contaminant concentrations can change in a limited space and time;
f) Changed or unanticipated sub-surface conditions may occur that could affect the outcomes of an investigation, because of the inherent uncertainties in sub-surface evaluations. Any opinions or recommendations presented herein apply to site conditions existing when services were performed. CH2M HILL is unable to report on or accurately predict events that may change the site conditions after the described services are performed, whether occurring naturally or caused by external forces;
g) CH2M HILL notes that if the site CSM or land use were to change in the future, the soil vapour and groundwater criteria, as detailed in this report, and the recommendation and conclusions made in this report may no longer apply to this Site;
h) This report has not been prepared for the purposes of assessing the suitability of soil and fill on the Site for building or pavement foundations or the establishment of gardens;
i) This report should not be altered, amended or abbreviated, issued in part and issued incomplete in any way. CH2M HILL accepts no responsibility for any circumstances that arise from the issue of the report which has been modified as outlined above; and
j) This report has been prepared for the exclusive use of the Client relating to the property as described in the report. No warranty, expressed or implied, is made.
Ref: 652556 March 2015 Privileged and Confidential Rev 1
42

Norton Rose Fulbright Australia HHRA for Vapour Impacts in the Vicinity of SV10 Hendon Industrial Area, Hendon, SA
There are no beneficiaries to this report other than the Client, and no other person or entity is entitled to rely upon this report without the written consent of CH2M HILL, and a written agreement limiting CH2M HILL’s liability.
March 2015 Ref: 652556 Rev 1 Privileged and Confidential
43
Norton Rose Fulbright Australia HHRA for Vapour Impacts in the Vicinity of SV10
Hendon Industrial Area, Hendon, SA
10. References
CH2M HILL, 2015. Soil Vapour Assessment Report, Delineation of Soil Vapour Contamination Around SV10, January 2015
Chan et al, 2010, Characterizing TCE Exposure Distribution for Occupants of Houses with Basements
EnHealth, 2012. Environmental Health Risk Assessment: Guidelines for Assessing Human Health Risks from Environmental Hazards.
Fang, JB & Persily, AK 1995, 'Airflow and Radon Transport Modelling in Four Large Buildings', ASHRAE Transactions, vol. 101.
Friebel, E & Nadebaum, P, 2011a. Health Screening Levels for Petroleum Hydrocarbons in Soil and Groundwater. Part 1: Technical Development Document, CRC CARE Technical Report no. 10.
Friebel, E & Nadebaum, P, 2011b. Health Screening Levels for Petroleum Hydrocarbons in Soil and Groundwater. Part 4: Extension Model, CRC CARE Technical Report no. 10.
National Environment Protection Council (NEPC) 1999. National Environmental Protection (Assessment of Site Contamination) Measure 1999 (NEPM 1999, 2013 amendment).
Johnson, 2005. Sensitivity analysis and identification of critical and non-critical parameters for the Johnson and Ettinger vapor intrusion model.
Johnson and Ettinger, 1991. Heuristic model for predicting the intrusive rate of contaminant vapours into buildings.
National Health and Medical Research Council (NHMRC) 2011, National water quality management strategy, Australian drinking water guidelines.
New South Wales Department of Environment, Climate Change & Water (DECCW), 2010, Vapour Intrusion: Technical Practice Note
ODEQ, 2010. Guidance for assessing and remediating vapor intrusion in buildings.
Olson & Corsi, 2001. Characterizing exposure to chemicals from soil vapor intrusion using a two-compartment model.
Parsons Brinckerhoff, 2013. Additional Environmental Site Assessment, October 2013 (PB, 2013b).
Parsons Brinckerhoff, 2014. Additional Environmental Assessment (March/April 2014), Hendon, SA, June 2014 (PB, 2014a)
Parsons Brinckerhoff, 2014. Additional Assessment at Hendon Child Care Centre, September 2014 (PB, 2014b)
Ref: 652556 March 2015 Privileged and Confidential Rev 1
44

Norton Rose Fulbright Australia HHRA for Vapour Impacts in the Vicinity of SV10 Hendon Industrial Area, Hendon, SA
US EPA, 2004. User's Guide for Evaluating Subsurface Vapor Intrusion into Buildings. EPA Contract Number: 68-W-02-33
USEPA, 2008. Vapor intrusion database: Preliminary evaluation of attenuation factors (draft).
USEPA (various dates). Iris Evaluations accessed January 2015 from http://www.epa.gov/iris/
WHO 2003. Concise International Chemicals Assessment Document (CICAD) 51, 1,1Dichloroethene (Vinylidene Chloride), available from http://www.inchem.org/documents/cicads/cicads/cicad51.htm
WHO 2006. Concise International Chemicals Assessment Document (CICAD) 68, Tetrachloroethene, available from http://www.inchem.org/documents/cicads/cicads/cicad68.htm
March 2015 Ref: 652556 Rev 1 Privileged and Confidential
45

Norton Rose Fulbright Australia HHRA for Vapour Impacts in the Vicinity of SV10
Hendon Industrial Area, Hendon, SA
Figures
Ref: 652556 Privileged and Confidential

Crampt
Windem
Locksi
Manit
Maram
Tapleys Hil l R
oad
Fr ederick Road
West Lakes Boulevard
Port Road
HighStreet
Harris Avenue
Spad St reet
Sage
Crescent
McMahon Place
Wright Street
Coo
keStre
et
Royal Terrace
Barrey Avenue
Green Avenue
Farman Avenue Oak Street
Henry Street
Morley Road
McKenzie Court
Pine Stre
et
Crighton Street
Durham Terrace
First Avenue
De H
avil and Avenue
Levi St reet
PudneyStreet
Stevens Street
Sopwith Avenue
Cheltenham
Parade
Andrew Street
Davidson Avenue
Myrtle Street
Martins Road
Ryan Avenue
Parker Avenue
Matthews Avenue
Patricia Street
Shirley Avenue
Holden Avenue
Pitman Avenue
Clare Street
Alfred Street
ClarkTerrace
Brenthorpe Road
Glenburnie Street
George Street
Raymond Avenue
Cedar Avenue
May St reet
Pedlar Street
AlmaTerrace
Gordon St reet
Avro A
venue
Circuit Drive
Haddy Street
Cricksdale Street on Court
ere Avenue
oba Way
de Drive
ba Avenue
Brebner Drive
Site Location
0 50 100
Kilometers
Approximate Hendon Industrial Area (The Site)
³ Approximate Investigation Area
0 50 100
Meters
\\WATERLOO\GIS\PROJECTS\652556HENDON\GIS\MAPFILES\GROUNDWATER\SITELOCATION.MXD JLOGAN1 1/19/2015 6:13:00 PM
Notes: 1. Service Layer Credits: Sources: Esri, DeLorme, NAVTEQ, USGS, Intermap, iPC, NRCAN, Esri Japan, METI, Esri China (Hong Kong), Esri (Thailand), TomTom, 2013 Source: Esri, DigitalGlobe, GeoEye, icubed, USDA, USGS, AEX, Getmapping, Aerogrid, IGN, IGP, swisstopo, and the GIS User Community
Privileged and Confidential
Figure 1 Site Location
Hendon Industrial Area Australia
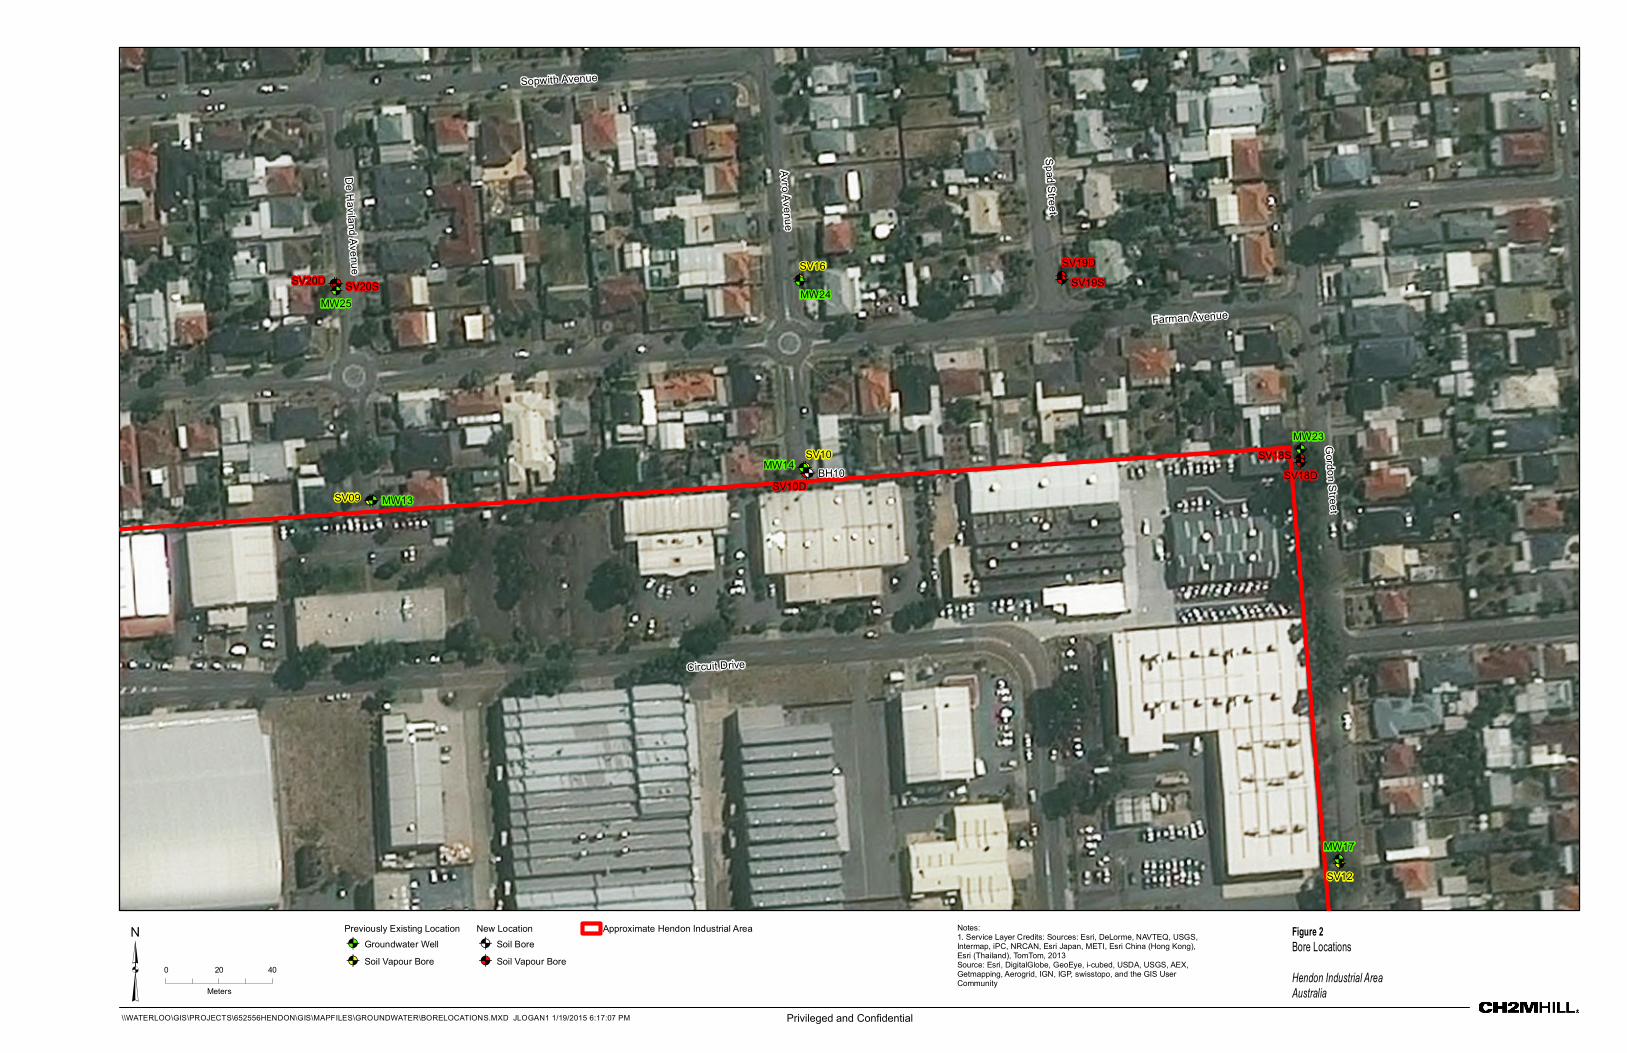
!
!A!A
!A!A!A!A
!A!A !A
!A!A!A!A!A
!A!A
!A!A
Circuit Drive
Spad S
treet
Avro A
venue
De H
avi land A
venue
Farman Avenue
Sopwith Avenue
Gordon S
treet
SV10D
SV18S
SV18D
SV19D
SV19SSV20D SV20S
BH10
SV09
SV10
SV12
SV16
MW13
MW14
MW23
MW25
MW17
MW24
Previously Existing Location New Location Approximate Hendon Industrial Area Notes: Figure 2 !A Groundwater Well
1. Service Layer Credits: Sources: Esri, DeLorme, NAVTEQ, USGS,A Soil Bore
³ Intermap, iPC, NRCAN, Esri Japan, METI, Esri China (Hong Kong), Bore Locations Esri (Thailand), TomTom, 2013
!!A Soil Vapour Bore A Soil Vapour Bore
Meters Australia
\\WATERLOO\GIS\PROJECTS\652556HENDON\GIS\MAPFILES\GROUNDWATER\BORELOCATIONS.MXD JLOGAN1 1/19/2015 6:17:07 PM Privileged and Confidential
Source: Esri, DigitalGlobe, GeoEye, icubed, USDA, USGS, AEX,0 20 40
Getmapping, Aerogrid, IGN, IGP, swisstopo, and the GIS User Hendon Industrial Area
Community

Norton Rose Fulbright Australia HHRA for Vapour Impacts in the Vicinity of SV10
Hendon Industrial Area, Hendon, SA
Appendix A: Peer Review of PB Assessment
Works
Ref: 652556 Privileged and Confidential

1
Norton Rose Fulbright Australia HHRA for Vapour Impacts in the Vicinity of SV10 Hendon Industrial Area, Hendon, SA
Appendix A
Review of Previous Vapour Risk Assessment Works
Background and Scope of Works Previous vapour risk assessment (VRA) works have been undertaken by Parsons Brinckerhoff (PB), in order to assess the level of risk to residents (and other human health receptors) in the vicinity of the Hendon Industrial Area via pathways of vapour intrusion into current buildings. These VRA works have been reviewed in order to provide:
• A summary of the risk assessment approach undertaken by PB;
• An assessment of the suitability of the approach taken by PB;
• A second opinion on the conclusions made by PB; and
• A second opinion on the recommendations.
The VRA works undertaken by PB include:
• Phase 1: VRA works reported as part of the Additional Environmental Site Assessment (PB, October 2013) (PB, 2013b). These works are summarised in detailed in Appendix I, Section 9 and Appendices J – M of the PB (2013b) report. The assessment incorporates data from groundwater monitoring and soil vapour investigations undertaken in May/June 2013. The soil vapour investigations included the collected of soil vapour from ten soil vapour bores installed to a range of depths.
• Phase 2: Supplementary VRA works reported as part of the Additional Environmental Site Assessment – March/April 2014 (PB, June 2014) (PB, 2014a). These works are summarised in Section 10 and Appendix L of the PB (2014a) report. These works provided an update to the previous VRA works (PB, 2013b), based on additional (and more extensive) groundwater and soil vapour data collected in March/April 2014. In particular, this assessment incorporated soil vapour data from two additional soil vapour sampling points (SV16 and SV17; located to the north and south of the Hendon Industrial Area respectively), and a more extensive monitoring programme at the First Steps Child Care Centre, located to the west of the Hendon Industrial Area (including sub-slab, indoor air, and outdoor air sampling to provide a more direct assessment of the current level of risk to users of the Child Care Centre).
As the Phase 2 VRA works (PB, 2014a) are based on more recent and more extensive data, this review will focus primarily on the Phase 2 VRA (PB, 2014a), to assess whether the approach followed and conclusions/recommendations drawn are appropriate based on the available site data. The assessment approach was generally consistent for both phases, and where relevant, the results from the two VRA phases will be referenced as part of this review.
February 2015 Ref: 652556 Rev 0 Privileged and Confidential
A-1

2
Norton Rose Fulbright Australia HHRA for Vapour Impacts in the Vicinity of SV10 Hendon Industrial Area, Hendon, SA
Review of VRA based on soil vapour concentrations The Phase 2 VRA (PB, 2014a) included a tiered risk assessment, based on the soil vapour concentrations measured in March/April 2014. It is noted that the concentration of trichloroethene (TCE) measured in SV10 at 1.5 metres below ground level (mbgl) was highlighted as being potentially spuriously high. In all other locations soil vapour concentrations generally correlated with measured groundwater concentrations. The concentration of TCE measured in SV10 (16,000 µg/m3) is inconsistent with this, as a large increase in soil vapour concentrations was observed when compared with the previous sampling round (PB, 2013b), even though groundwater concentrations decreased. It is noted that problems were observed during sampling which may explain the spuriously high result observed. Regardless of this, the result was included in the risk assessment modelling. The impact on the results is discussed further below.
The risk assessment included the following steps:
• Step 1: Comparison of measured soil vapour concentrations to the interim soil vapour health investigation levels (HILs) presented in the National Environment Protection Council (NEPC) National Environment Protection (Assessment of Site Contamination) Measure 1999 (NEPM 1999, 2013 amendment). Based on this conservative assessment (which assumes measured concentrations are present directly below the building, and concentrations within the building are a factor of 10 lower than the measured concentrations), the following are contaminants of potential concern (COPC): tetrachloroethene (PCE); TCE; 1-1-dichloroethene (1,1-DCE); cis-1,2-dichloroethene (cis-1,2-DCE); trans-1,2-dichlororoethene (trans-1,2-DCE); and vinyl chloride (VC).
• Step 2: Estimated vapour concentrations at the source compared with sub-slab criteria (assuming attenuation factor of 0.005 between sub-slab and building). It is noted that this assumed attenuation factor is less conservative than the 0.1 assumed in the interim soil vapour HIL derivation (but is the default value used in the derivation of the health screening levels (HSLs) for petroleum hydrocarbons in NEPM 1999, 2013 amendment). The adopted attenuation factor of 0.005 factor is considered likely to be justifiable, as 0.1 is known to be highly conservative, but the assessment (both the Phase 1 VRA (PB, 2013b) and Phase 2 VRA (PB, 2014a)) would benefit from additional discussion to justify its use. Subject to this, the screening is considered sound. Based on this assessment the following are COPC: TCE and cis-1,2-DCE.
• Step 3: Modelling based on attenuation through soil profile based on the depths from which the soil vapour samples were taken and the site-specific geology:
− This assessment showed risks from all COPC to be low and acceptable.
− It is noted that a cohesive geology was modelled, which resulted in greatly reduced predicted concentrations in indoor air (100,000 times below soil vapour concentrations). Assuming this is appropriate for the site, the assessment is considered broadly appropriate to determine the risk in current buildings without basements. It is noted that the profile assumed by PB (2014a) for the wider area assumes granular soils over a greater thickness than was identified by CH2M HILL for the area around SV10. The profile selected by PB (2014a) is considered appropriate for the wider area, as there were locations where more sand was identified than was identified in the vicinity of SV10.
February 2015 Ref: 652556 Rev 0 Privileged and Confidential
A-2

Norton Rose Fulbright Australia HHRA for Vapour Impacts in the Vicinity of SV10 Hendon Industrial Area, Hendon, SA
− However, this approach is not necessarily conservative for the assessment of risks to users in buildings with basements (as the distance over which concentrations would attenuate would be less).
• Sensitivity Analysis: Modelling based on attenuation through soil profile based on the depths from which the soil vapour samples were taken and a more conservative geology (the sand parameters from the HSLs):
− This assessment showed potentially unacceptable risks from TCE, in both the child care centre and residential properties based on the most conservative geology adopted. The potentially unacceptable risks were as a result not only to the potentially spuriously high soil vapour concentration of TCE in SV10, but also to the concentration measured in SV04, adjacent to the child care centre (5,200 µg/m3.at 1.0 mbgl).
− It was emphasised that measured indoor soil vapour concentrations in the child care centre were below the acceptable level, and therefore current risks in the child care centre are low (see the discussion of this assessment presented below in Section 3).
− It was concluded that additional geotechnical assessment would be required to determine site-specific soil properties and allow the level of risk to residential properties across the wider area to be confirmed.
− The results of the sensitivity analysis are not relevant to a building with a future basement construction, as the distance over which concentrations would attenuate would be less.
Overall, the risk assessment based on soil vapour concentrations is considered appropriate based on current buildings and current site conditions. It is noted that if basements were to be present, the modelling conducted for Step 3 and the sensitivity analysis would not be appropriate, and TCE and cis-1,2-DCE would be COPC. Further assessment would need to be undertaken to determine whether these COPC could pose potential risks in a future building with a basement.
It is noted that the approach and conclusions of the Phase 1 VRA (PB, 2013b) were broadly consistent with the Phase 2 VRA (PB, 2014a) (i.e. risks were assessed to be low and acceptable when current soil properties were utilised, but potentially unacceptable when more conservative properties for drier soils were considered as part of a sensitivity analysis).
CH2M HILL agrees with the conclusion that further geotechnical data is required to conclude appropriate soil properties (soil moisture content and soil porosities) and allow better assessment of the potential level of risk posed. Although site specific soil moisture contents were utilised in the risk model, the samples were collected during a period of higher than average rainfall (PB, 2014a) and therefore the soil moisture contents may not be representative of the most conservative, or driest, values for the area.
Furthermore, CH2M HILL agrees with the conclusion that further assessment of the concentrations measured in March/April 2014 in SV10 (PB, 2014a) is warranted to better understand current and future risk. It is noted however that potentially unacceptable results were observed in the sensitivity analysis even excluding this concentration. On this basis, additional assessment of the soil vapour concentrations in SV10 is not sufficient to close out the issues on the site and would need to be coupled with additional geotechnical analysis as discussed above.
February 2015 Ref: 652556 Rev 0 Privileged and Confidential
A-3

Norton Rose Fulbright Australia HHRA for Vapour Impacts in the Vicinity of SV10 Hendon Industrial Area, Hendon, SA
It is noted that VC is highly toxic and a potential breakdown product for the impacts observed in groundwater at the site. If conclusions about the future level of risk are required, consideration would need to be given to the potential for VC concentrations to increase in the future as a result of source breakdown. This could be undertaken through modelling or trend analysis. The conclusions of such an assessment would need to be reviewed before drawing conclusions regarding the future risk profile.
3 Assessment of risks to users of First Steps based on measured crawl space / indoor air concentrations
Following the Phase 1 VRA (PB, 2013b), which indicated that vapour intrusion risks to users within the First Steps Child Care Centre were acceptable based on the assessment of soil vapour concentrations and current measured soil properties, but potentially unacceptable when conservative soil properties (for drier soils) were adopted, more extensive vapour investigations were undertaken (PB, 2014a), including sub-slab, indoor air and outdoor air vapour sampling to provide a more direct assessment of the current level of risk to users of the Child Care Centre.
In the additional investigations (PB, 2014a), TCE was identified within the crawl space beneath the First Steps Child Care Centre at concentrations above the acceptable concentration in indoor air. However, all measured indoor air concentrations (inside the occupiable space of the Child Care Centre) and outdoor air concentrations were below the acceptable level. Based on the fact that the measured indoor air concentrations are below the acceptable level, the current risk was assessed by PB to be low and acceptable. This conclusion is considered sound and appropriate.
It is not considered possible to utilise the results of crawl space / indoor air concentrations to draw conclusions regarding the risk in separate / future buildings (in particular buildings with a different construction, including slab on ground or basements). However, it is noted that the overall assessment of risk in the Child Care Centre as low and acceptable based on the measured indoor concentrations is consistent with the overall results of the soil vapour risk assessment (that risks in the wider area, including the Child Care Centre are low and acceptable), also reported in PB (2014a).
As the soil vapour risk assessment (for both the Child Care Centre and the surrounding area) is for a building with a slab construction, it is difficult to draw conclusions as to whether the measured crawl space concentrations at the Child Care Centre are consistent with the soil vapour risk assessment (PB, 2014a). It is noted that the source for the measured concentrations within the crawl space is unclear; they may be related to something other than a below ground source.
4 Review of groundwater screening exercise A screening exercise was undertaken as part of the Phase 1 VRA (PB, 2013b) and Phase 2 VRA (PB, 2014a) to identify soil vapour COPC based on groundwater concentrations. It is noted that groundwater concentrations were generally higher for the Phase 1 VRA (PB, 2013b), resulting in more exceedances of the screening criteria. The overall purpose of this exercise is to reduce the number of COPC for which detailed risk assessment is required. This screening exercise involved:
February 2015 Ref: 652556 Rev 0 Privileged and Confidential
A-4

Norton Rose Fulbright Australia HHRA for Vapour Impacts in the Vicinity of SV10 Hendon Industrial Area, Hendon, SA
• Step 1: Comparing groundwater concentrations to drinking water criteria (contaminants below the criteria were not considered further). It is noted that for some chlorinated solvents this may not be a conservative approach, however, the most toxic COPC are generally retained as COPC based on this assessment, which is considered acceptable. Based on this assessment, the following were identified as COPC in the Phase 2 VRA (PB, 2014a): PCE; TCE; cis-1,2-DCE; and trans-1,2-DCE. In the Phase 1 VRA (PB, 2013a), the results were broadly similar, although 1,1-DCE and VC were additionally identified as a COPC.
• Step 2: Estimated vapour concentrations at the source (position of the soil vapour sampling probe) compared with sub-slab criteria (assuming attenuation factor of 0.005 between sub-slab and building). It is noted that this assumed attenuation factor is less conservative than the 0.1 assumed in the interim soil vapour HIL derivation (but is the default value used in the derivation of the HSLs for petroleum hydrocarbons in NEPM 1999, 2013 amendment). The adopted factor of 0.005 is justifiable, as 0.1 is known to be highly conservative, but there should be a discussion presented to justify its use. Provided this assessment has been undertaken, but just not presented, the screening is considered sound. Based on this assessment the following were identified as COPC in the Phase 2 VRA (PB, 2014a): TCE and cis-1,2-DCE. In the Phase 1 VRA (PB, 2013b), PCE; 1,1-DCE and VC were additionally identified as COPC.
• Step 3: Modelling based on attenuation through soil profile from a groundwater source. This assessment is considered broadly appropriate based on current buildings. As mentioned above, the profile assumed by PB (2014a) for the wider area assumes granular soils over a greater thickness than was identified by CH2M HILL for the area around SV10. If basements were to be considered, this would not be conservative (as the distance over which concentrations would attenuate would be less). Based on this assessment, TCE only is selected as requiring further assessment (in both the Phase 1 VRA (PB, 2013b) and Phase 2 VRA (PB, 2014a)).
Overall, the screening exercise to identify COPC based on measured groundwater concentrations is considered appropriate based on current buildings and current site conditions. It is noted that if basements were to be present, Step 3 would not be appropriate and the COPC (based on measured soil vapour concentrations in the Phase 2 VRA (PB, 2014a)) would be TCE and cis-1,2-DCE, with additional COPC if the higher groundwater concentrations utilised in the Phase 1 VRA (PB, 2013a) are considered. It is noted that all of these COPC were considered for incorporation in the both the 2013a and 2014a VRAs based on soil vapour concentrations (based on their identified presence in soil vapour and comparison of these concentrations to soil vapour screening criteria), so confidence is maintained that the selected COPC for the PB (2014a) Phase 2 VRA are broadly appropriate, as discussed in Section 2 above.
Review of PB recommendations for further works Following the Phase 2 VRA works undertaken by PB (2014a), recommendations were made for further works, including:
• Additional targeted assessment to confirm geotechnical soil properties (including moisture content), variations in vapour and groundwater conditions, and housing construction details within the residential area to further verify the conclusions of the VRA for the wider area of investigation.
February 2015 Ref: 652556 Rev 0 Privileged and Confidential
5
A-5
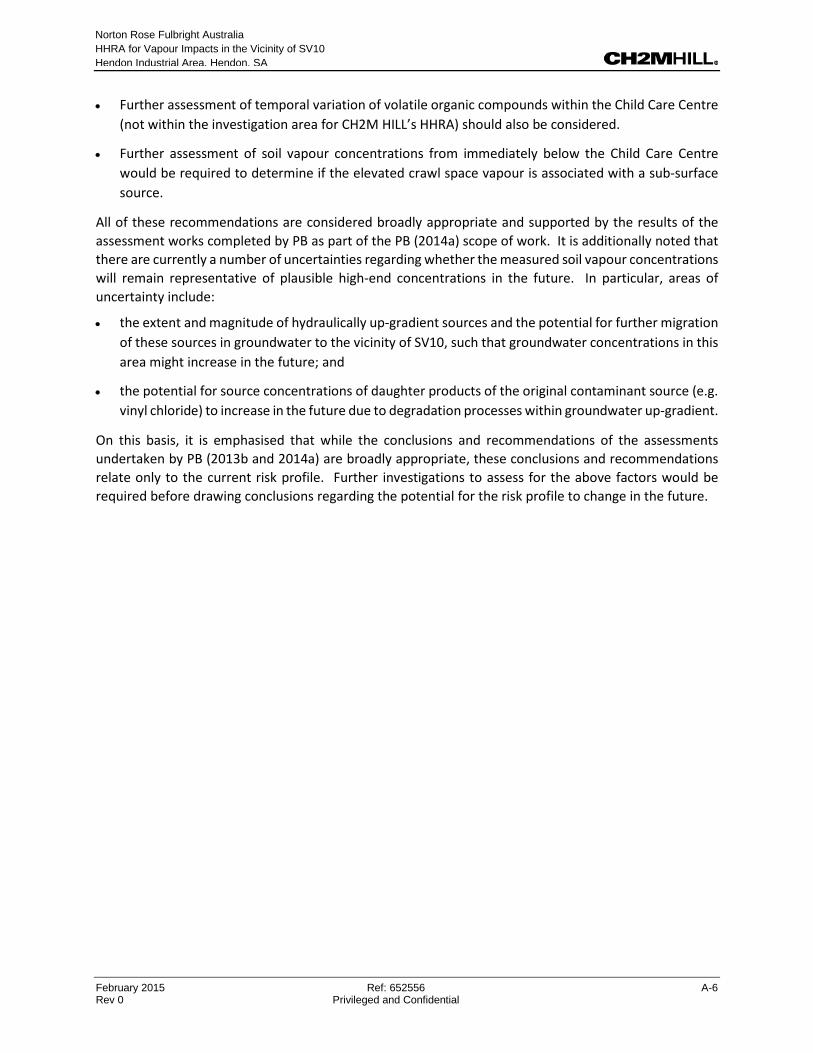
Norton Rose Fulbright Australia HHRA for Vapour Impacts in the Vicinity of SV10 Hendon Industrial Area, Hendon, SA
• Further assessment of temporal variation of volatile organic compounds within the Child Care Centre (not within the investigation area for CH2M HILL’s HHRA) should also be considered.
• Further assessment of soil vapour concentrations from immediately below the Child Care Centre would be required to determine if the elevated crawl space vapour is associated with a sub-surface source.
All of these recommendations are considered broadly appropriate and supported by the results of the assessment works completed by PB as part of the PB (2014a) scope of work. It is additionally noted that there are currently a number of uncertainties regarding whether the measured soil vapour concentrations will remain representative of plausible high-end concentrations in the future. In particular, areas of uncertainty include:
• the extent and magnitude of hydraulically up-gradient sources and the potential for further migration of these sources in groundwater to the vicinity of SV10, such that groundwater concentrations in this area might increase in the future; and
• the potential for source concentrations of daughter products of the original contaminant source (e.g. vinyl chloride) to increase in the future due to degradation processes within groundwater up-gradient.
On this basis, it is emphasised that while the conclusions and recommendations of the assessments undertaken by PB (2013b and 2014a) are broadly appropriate, these conclusions and recommendations relate only to the current risk profile. Further investigations to assess for the above factors would be required before drawing conclusions regarding the potential for the risk profile to change in the future.
February 2015 Ref: 652556 Rev 0 Privileged and Confidential
A-6

Norton Rose Fulbright Australia HHRA for Vapour Impacts in the Vicinity of SV10
Hendon Industrial Area, Hendon, SA
Appendix B: COPC Selection
Ref: 652556 Privileged and Confidential

Privileged and Confidential Ref: 652556 Vapour Impacts in the Vicinity of SV10 Human Health Risk Assessment
Appendix B1: COPC Selection - analytes with NEPM 1999 (2013 amendment) screening crtieria
Analyte
Maximum soil vapour concentration
(December 2014) (µg/m3)
Soil vapour screening criterion
µg/m3
Source for toxicity value NEPM 1999 (2013 amendment)
Tetrachloroethene 1,570 2,000 Interim soil vapour HIL-A Trichloroethene 9,400 20 Interim soil vapour HIL-A cis-1,2-Dichloroethene 464 80 Interim soil vapour HIL-A Vinyl chloride <5.2 30 Interim soil vapour HIL-A 1,1,1-Trichloroethane <270 60,000 Interim soil vapour HIL-A Benzene <96 990 HSL-A* Toluene <190 1,300,000 HSL-A* Ethylbenzene <220 330,000 HSL-A* Total Xylenes <650 870 HSL-A* Naphthalene 492 780 HSL-A*
Notes:
While the HSLs are primarily intended for use on sites with petroleum hydrocarbon contamination, it is noted that (for the soil vapour HSLs) it is only the HSLs for the TPH fractions which are dependant on source composition. As such, the HSLs for benzene, toluene, ethylbenzene and xylenes are considered appropriate for use regardless of the nature of the source, and are therefore suitable for use on this site. The most conservative values (for soil vapour measured at 0-1 mbgl in a sand geology) have been selected for the purposes of the screening exercise.
1 of 6 Checked by: BS - Jan 2015
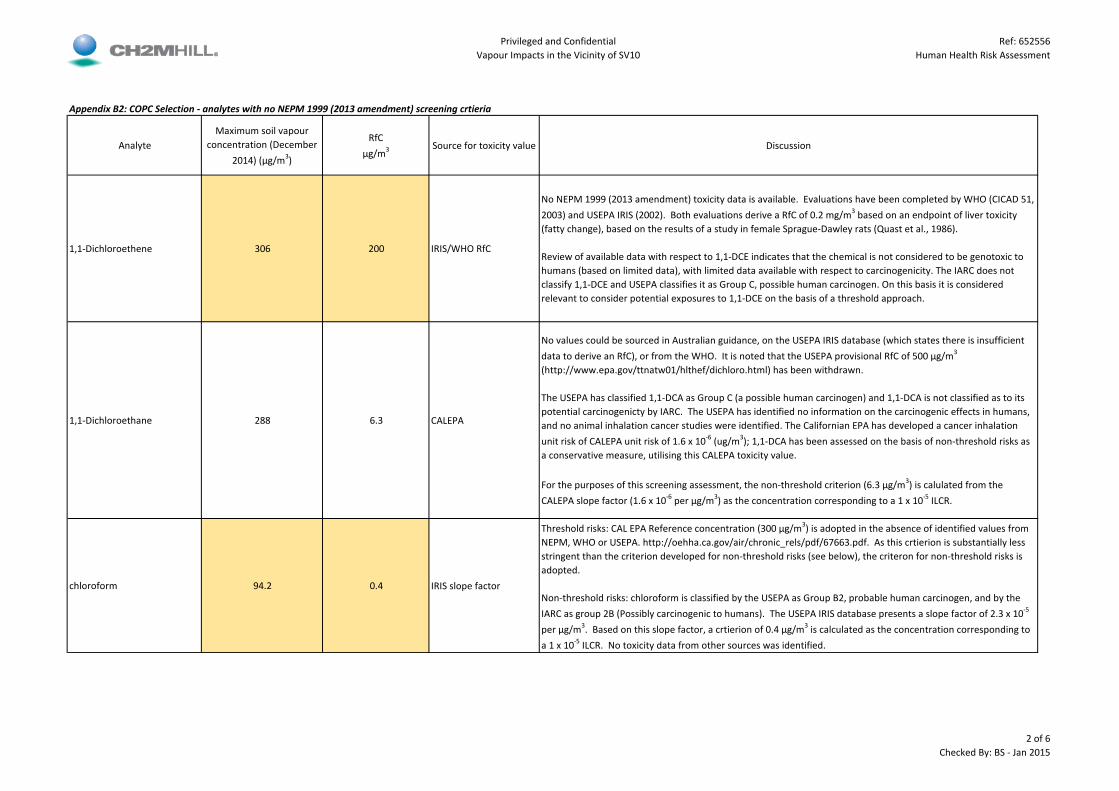
Privileged and Confidential Ref: 652556 Vapour Impacts in the Vicinity of SV10 Human Health Risk Assessment
Appendix B2: COPC Selection - analytes with no NEPM 1999 (2013 amendment) screening crtieria
Analyte Maximum soil vapour
concentration (December 2014) (µg/m3)
RfC µg/m3 Source for toxicity value Discussion
1,1-Dichloroethene 306 200 IRIS/WHO RfC
No NEPM 1999 (2013 amendment) toxicity data is available. Evaluations have been completed by WHO (CICAD 51, 2003) and USEPA IRIS (2002). Both evaluations derive a RfC of 0.2 mg/m3 based on an endpoint of liver toxicity (fatty change), based on the results of a study in female Sprague-Dawley rats (Quast et al., 1986).
Review of available data with respect to 1,1-DCE indicates that the chemical is not considered to be genotoxic to humans (based on limited data), with limited data available with respect to carcinogenicity. The IARC does not classify 1,1-DCE and USEPA classifies it as Group C, possible human carcinogen. On this basis it is considered relevant to consider potential exposures to 1,1-DCE on the basis of a threshold approach.
1,1-Dichloroethane 288 6.3 CALEPA
No values could be sourced in Australian guidance, on the USEPA IRIS database (which states there is insufficient data to derive an RfC), or from the WHO. It is noted that the USEPA provisional RfC of 500 µg/m3
(http://www.epa.gov/ttnatw01/hlthef/dichloro.html) has been withdrawn.
The USEPA has classified 1,1-DCA as Group C (a possible human carcinogen) and 1,1-DCA is not classified as to its potential carcinogenicty by IARC. The USEPA has identified no information on the carcinogenic effects in humans, and no animal inhalation cancer studies were identified. The Californian EPA has developed a cancer inhalation unit risk of CALEPA unit risk of 1.6 x 10⁻⁶ (ug/m3); 1,1-DCA has been assessed on the basis of non-threshold risks as a conservative measure, utilising this CALEPA toxicity value.
For the purposes of this screening assessment, the non-threshold criterion (6.3 µg/m3) is calulated from the CALEPA slope factor (1.6 x 10⁻⁶ per µg/m3) as the concentration corresponding to a 1 x 10⁻⁵ ILCR.
chloroform 94.2 0.4 IRIS slope factor
Threshold risks: CAL EPA Reference concentration (300 µg/m3) is adopted in the absence of identified values from NEPM, WHO or USEPA. http://oehha.ca.gov/air/chronic_rels/pdf/67663.pdf. As this crtierion is substantially less stringent than the criterion developed for non-threshold risks (see below), the criteron for non-threshold risks is adopted.
Non-threshold risks: chloroform is classified by the USEPA as Group B2, probable human carcinogen, and by the IARC as group 2B (Possibly carcinogenic to humans). The USEPA IRIS database presents a slope factor of 2.3 x 10⁻⁵
per µg/m3 . Based on this slope factor, a crtierion of 0.4 µg/m3 is calculated as the concentration corresponding to a 1 x 10⁻⁵ ILCR. No toxicity data from other sources was identified.
2 of 6 Checked By: BS - Jan 2015

Privileged and Confidential Ref: 652556 Vapour Impacts in the Vicinity of SV10 Human Health Risk Assessment
Appendix B3: COPC Selection - Screening against sub-slab screening criteria Indoor Air Subslab (⍺ = 0.005)
Analyte Reference
Concentration (RfC) µg/m3
Tox based subslab screening level
µg/m3
Maximum vapour concentration
(µg/m3)
Selected as COPC for further assessment
trichloroethene* 2 400 9,400 Yes cis-1,2-Dichloroethene 7 1,400 464 No 1,1-Dichloroethene 200 40,000 306 No 1,1-Dichloroethane 6.3 1,260 288 No chloroform 0.4 80 94.2 Yes
Notes:
*TCE poses potential risks via both threshold and non-threshold mechanisms. The NEPM 1999 (2013 amendment) RfC (for threshold risks) is adopted here. This criterion is more stringent than (though very similar to) non-threshold criterion (2.1 µg/m3) calculated from NEPM 1999 (2013 amendment) Slope factor (4.8 x 10⁻⁶ per µg/m3) as the concentration corresponding to a 1 x 10⁻⁵ ILCR.
The tox-based sublab screening criteria is calculated as the sub-slab concentration which would result in a concentration equal to the RfC in indoor air, assuming that the attenuation factor between the sub-slab and ground floor is 0.005 (this factor is discussed in detail in Section 6.3.6 of the report).
3 of 6 Checked By: BS - Jan 2015

Privileged and Confidential Ref: 652556 Vapour Impacts in the Vicinity of SV10 Human Health Risk Assessment
Appendix B4: COPC Selection - Groundwater screening (Step 1)
Analyte
March 2014 groundwater concentration
Henry's Law
Constant
Predicted vapour concentration at source (µg/m3)
December 2014 LOR
(µg/m3)
Soil Vapour concentrations measured in SV10 by PB
(µg/m3)
Adopted source concentration*
(µg/m3)
Reference Concentration
(RfC)** µg/m3
Selected as COPC for further
assessment (µg/L) (unitless) June 2013 March 2014
1,2-dichloroethane 1.6 0.0482 77 80 <32 <25 77 0.4 Yes trans-1,2-dichloroethene 0.5 0.167 84 200 71 23 84 70 Yes
Notes: For comparison, the measured soil vapour concentrations in SV10 from the June 2013 (PB, 2013b) and March 2014 (PB, 2014a) soil vapour sampling rounds is included here. It is noted that a lower LOR was achieved during the PB sampling rounds, and that concentrations of trans-1,2-dichloroethene above the LOR (but below the December 2014 LOR (CH2MHILL, 2015)) were measured during the PB rounds. Concentrations of 1,1,2-trichloroethane and 1,2-dichloroethane were below the LOR on all sampling rounds. * The lower of the December 2014 LOR (CH2MHILL, 2015) and predicted vapour concentration from groundwater is adopted as the source concentration for the purposes of the screening assessment. This is a conservative approach when considered in conjunction with the results of the PB assessment (2013b and 2014a) ** Toxicity data is defined for the analytes as discussed below:
Analyte RfC (µg/m3) Toxicity summary and source for RfC
Threshold risks: WHO, 2000 presents an RfC of 700 µg/m3 (derived from animal studies based on an end-point of adverse liver effects). No Australian regulatory values or USEPA IRIS RfC is available.
1,2-dichloroethane 0.4 Non-threshold risks: 1,2-dichloroethane is classified by the USEPA as Group B2, probable human carcinogen, and by the IARC as group 2B (Possibly carcinogenic to humans). While WHO, 2005 acknowledges the carcinogenic potential of 1,2-dichloroethane, there was considered to be insufficient data to derive an associated toxicity value. The USEPA IRIS database presents a slope factor of 2.6 x 10⁻⁵ per µg/m3 for 1,2-dichloroethane. Based on this slope factor, a criterion of 0.4 µg/m3 is calculated as the concentration corresponding to a 1 x 10⁻⁵ ILCR. No toxicity data from other sources was identified (while WHO, 2005 acknowledges the carcinogenic potential of 1,2dichloroethane, there was considered to be insufficient data to derive an associated toxicity value).
trans-1,2-dichloroethene 70
Threshold risks: The USEPA IRIS discusses the data available and concludes the data is insufficient to allow derivation of an RfC for this analyte. No inhalation toxicity data could be sourced from Australian regulatory sources or the WHO. In the absence of criteria from these sources, the PPRTV documentation was reviewed, and also indicated that the data was insufficient to derive an RfC for this analyte. In the absence of alternative data, the adopted RfC is based on the oral toxicity data (from the USEPA IRIS database), converted into a reference concentration based on a daily inhalation rate of 20 m3/day and a body weight of 70 kg.
Under the Guidelines for Carcinogen Risk Assessment (U.S. EPA, 2005a), there is “inadequate information to assess the carcinogenic potential” of trans-1,2-DCE. IARC does not classify the carcinogenicity of this compound. No toxicity data relating to carcinogenicity of this compound could be sourced; it has therefore been assessed on the basis of threshold risks.
4 of 6 Checked By: BS - Mar 2015

Privileged and Confidential Ref: 652556 Vapour Impacts in the Vicinity of SV10 Human Health Risk Assessment
Appendix B5: COPC Selection - Groundwater screening (Step 2) Indoor Air Subslab (⍺ = 0.005)
Analyte
Reference Concentration
(RfC) µg/m3
Tox based subslab level
µg/m3
Adopted source concentration
(µg/m3)
Selected as COPC for further
assessment
1,2-dichloroethane 0.4 80 77 No trans-1,2-dichloroethene 70 14,000 84 No
5 of 6 Checked By: BS - Mar 2015

Privileged and Confidential Ref: 652556 Vapour Impacts in the Vicinity of SV10 Human Health Risk Assessment
Appendix B6: COPC Selection - confirmatory screening of additional analytes identified
Analyte Maximum concentration
measured by PB µg/m3
Reference Concentration (RfC)
µg/m3
Tox based subslab level (⍺ = 0.005)
µg/m3 Source for value Selected as COPC
iso-propanol 430 200 40,000 PPRTV No trichlorofluoromethane (freon 11) 14 700 140,000 HEAST No trans-1,2-dichloroethane 110 70 14,000 IRIS* No dichlorodifluoromethane (freon 12) 3 100 20,000 PPRTV No heptane 70 18,400 3,680,000 NEPM** No hexane 48 700 140,000 IRIS No propene 40 3,000 600,000 Cal-EPA No toluene 5 1,300,000 260,000,000 NEPM No bromodichloromethane 40 0.27 54 Cal-EPA+ No methyl ethyl ketone 8.2 5,000 1,000,000 IRIS No benzene 3.2 2 334 NEPM++ No
*conversion from oral value; see groundwater screening ** In the absence of a screening criterion specifically for heptane, the RfC (utilised in the derivation of the HSLs) for TPH Aliphatic C6-C8 (of which heptane is a component) has been selected. +Calculated from Cal-EPA Slope factor (3.7 x 10⁻⁵ per µg/m3) as concentration corresponding to a 1 x 10⁻⁵ ILCR. This is lower than the RfC for threshold exposure (30 µg/m3) ++Calculated from NEPM Slope factor (6 x 10⁻⁶ per µg/m3) as concentration corresponding to a 1 x 10⁻⁵ ILCR. This is lower than the RfC for threshold exposure (30 µg/m3)
6 of 6 Checked By: BS - Jan 2015

Norton Rose Fulbright Australia HHRA for Vapour Impacts in the Vicinity of SV10
Hendon Industrial Area, Hendon, SA
Appendix C: Toxicity Summaries
Ref: 652556 Privileged and Confidential

Privileged and Confidential Ref: 652556 Vapour Impacts in the Vicinity of SV10 Human Health Risk Assessment
Appendix C: Toxicity Summaries
COPC
RfC (threshold endpoints)
mg/m3
Background exposure
Inhalation unit risk (non-threshold
endpoints) Risk per µg/m3
Source for toxicity values
Carciongenicity and geotoxicity Critical health effects on which the
adopted toxicity data is based Comments
Trichloroethene 0.002 10% 4.8 x 10⁻⁶ USEPA IRIS; NEPM
1999 (2013 amendment)
IARC: Group 1 (Carcinogenic to humans) (2014) USEPA: carcinogenic to humans
The NEPM 1999 (2013 amendment) review concludes that there is evidence that TCE may be genotoxic and carcinogenic. On this basis, a linear (nonthreshold) approach is recommended for the quantification of carcinogenic effects.
RfC: route-extrapolation from oral studies for the critical effects of foetal heart malformations in rats and immunotoxicity in mice
Inhalation Unit Risk: non-Hodgkin’s lymphoma , renal cell carcinoma and liver tumours from human inhalation (epidemiology) studies
Assessment methodology: The selected values are based on the USEPA, 2011 derivation and the NEPM 1999 (2013 amendment) assessment, although it is noted that a more stringent non-threshold toxicity value has been adopted for the nonthrehold assessment than was adopted in the NEPM 1999 (2013 amendment), as discussed further below. A review of the Toxicity Data Sources listed in Schedule B4 of the NEPM 1999 (2013 amendment) indicated no more recent toxicity data relevant to the assessment of this COPC. The NEPM 1999 (2013 amendment) considers toxicity data for both carcinogenic and non-carcinogenic end points, as the health end points associated with carcinogenic (non-threshold) and non-carcinogenic (threshold) effects are similar in sensitivity. TCE will be assessed on the basis of both end-points.
Threshold toxicity: It is noted that the IRIS assessment indicates that women in the first trimester of pregnancy are one of the most sensitive populations to TCE inhalation exposure. For foetal cardiac malformations, a specific developmental effect, the critical period for exposure is considered to be the approximate 3-week period in the first trimester of pregnancy during which the heart develops. The non-threshold RfC has been developed to offer protection to a pregnant women (and her foetus) exposed in this critical period of pregnancy. Background exposure (relevant for threshold assessment only) taken from the NEPM 1999 (2013 amendment) evaluation.
Non-threhold toxicity: There is evidence that kidney cancer risks are associated with a mutagenic mode of action, and as such it is recommended that early life susceptibility is accounted for in the assessment. The USEPA recommends that susceptibility associated with early lifetime exposures be addressed for carcinogens which act via a mutagenic mode of action. The USEPA presents a methodology whereby the increased susceptibility associated with early life exposure is accounted for by applying age-dependent adjustment factors (ADAFs) to the assessed cancer risk estimates. The NEPM 1999 (2013 amendment) recommends that “this process should be considered for individual contaminants where there is clear evidence of a mutagenic mode of action.”
In selecting the toxicity data to be utilised in the development of the interim Health Investigation Level (HIL) for trichloroethene, the NEPM 1999 (2013 amendment) presents the following discussion of early life susceptibility:
“The US EPA review has concluded that there is sufficient weight of evidence that TCE operates through a mutagenic mode of action (MoA) for kidney tumours and there is a lack of TCE-specific quantitative data in relation to early lifetime susceptibility...The effect of considering [ADAFs] for only the kidney cancer portion of the unit risk has been evaluated by US EPA and determined to be of minimal impacts to the total cancer risk, except when exposure only occurs during early life (if these effects occur). In addition to this evaluation, a number of uncertainties have been identified in relation to applying the age adjustment factors for a more complex carcinogenic MoA, as identified for TCE. Hence, for the purpose of deriving HILs where long-term exposures are considered, no further adjustments to account for potential early lifetime susceptibility have been incorporate d.”
On this basis, the interim soil vapour HIL for TCE was derived without incorporating any adjustment for early life susceptibility. For this HHRA, and in line with the NEPM 1999 (2013 amendment) discussion presented above, it is not considered appropriate to undertake a full assessment (incorporating ADAFs for different periods of exposure) for TCE has not been performed. Instead, the ADAF-adjusted full-lifetime unit risk from IRIS (4.8 x 10⁻⁶ µg/m3) has been adopted. This value is more conservative than the un-adjusted IIRS value adopted in the NEPM 1999 (2013 amendment) for development of the interim soil vapour HIL, and is considered to adequately account for early-life susceptibility.
Chloroform 2.3 x 10⁻⁵ USEPA IRIS
The weight-of-evidence of the genotoxicity data on chloroform supports a conclusion that chloroform is not strongly mutagenic, and that genotoxicity is not likely to be the predominant mode of action underlying the carcinogenic potential of chloroform.
RfC: liver and kidney toxicity in rats; developmental toxicity.
Inhalation Unit Risk: hepatocellular carcinoma (liver cancer) in rats
For threhold risks, a CAL EPA Reference concentration (300 µg/m3) is adopted in the absence of identified values from NEPM 1999 (2013 amendment), WHO or USEPA. As this crtierion is substantially above the levels at which non-threhold risks are posed, chloroform is assessed on the basis of non-threshold risks. Chloroform is classified by the USEPA as Group B2, probable human carcinogen, and by the IARC as group 2B (Possibly carcinogenic to humans). The USEPA IRIS database presents a slope factor of 2.3 x 10⁻⁵ per µg/m3. No toxicity data from other sources was identified.
1 of 1 Checked By: BS - Jan 2015

Norton Rose Fulbright Australia HHRA for Vapour Impacts in the Vicinity of SV10
Hendon Industrial Area, Hendon, SA
Appendix D: Site-Specific Soil Properties
Ref: 652556 Privileged and Confidential

Privileged and Confidential Ref: 652556 Vapour Impacts in the Vicinity of SV10 Human Health Risk Assessment
Appendix D1: Site-specific soil properties
Location Sample Depth
(mbgl) Moisture content
(%) Water filled porosity
(-) Air filled porosity
(-) SV18S 1.1 20.9 0.34 0.06 SV19S 1.1 21.9 0.36 0.04 BH10 1 16.9 0.28 0.12 BH10 1.5 19.9 0.33 0.07 BH10 2 16.6 0.27 0.13 BH10 2.5 16.1 0.26 0.14 BH10 3.2 22.7 0.37 0.03
Values calculated as follows:
water filled porosity = moisture content × dry bulk density air filled porosity = total porosity - water filled porosity
The specification of site-specific values for dry bulk density and total porosity is described further below
Dry bulk denisty A site-specific dry bulk density of 1.64 g/cm3 has been adopted; this the average of the dry bulk denisty calculated in the laboratory for samples SV18S (1.671 g/cm3) and SV19S (1.617 g/cm3). It is noted that the US EPA default dry bulk density for silty clay loam is 1.63 g/cm3; PSD testing indicates SV18S to be a silty clay loam.
Total porosity
A site-specific value for total porosity of 0.40 has been calculated. This is within the range of the defaults provided by US EPA for silty clay (0.48), silty clay loam (0.48), loam (0.39) and silt loam (0.44). The cohesive soils beneath the site have been variously classified as silty clay, silty clay loam, loam and silt loam based on the results of PSD testing.
Total porosity is calculated as follows:
total porosity = 1 - volumetric particle content of soil = 1 - (dry density / particle density)
The dry bulk density is defined above. Particle density was measured for 5 samples from the cohesive geology beneath the investigation area, and the results were all very consistent (2.71 - 2.76 g/cm3). The values measured in samples SV18S and SV19S were (2.76 g/cm3 in each) were used to calculated the porosity for the below site geology, as these were the samples in which corresponding dry bulk density measurements were made. A particle density of 2.76 g/cm3 compares with the US EPA default of 2.65 g/cm3.
For the purposes of modeling vapour transport through the cohesive geology observed at the site, the median values for water-filled porosity (0.33) and the corresponding air-filled porosity (0.07) have been adopted in the modelling undertaken for the site. These values are similar to the mean values calculated for the above data. It is noted that the site-specific values generally correspond to similar water-filled porosity value, and lower air-filled porosity values than the CRC CARE defaults for the clay soil class (0.147 air-filled porosity; 0.3 water filled porosity), and the silt soil class (0.304 water filled porosity; 0.18 air-filled porosity). The lower air-filled porosity values observed indicate that the soils in the area exhibit relatively low poential for vapour transport. In order to account for potential temporal or lateral variations in soil moisture contents, more conservative soil properties will be considered in addition to the site-measured values as part of the sensitivity analysis.
1 of 2 Checked By: BS - Jan 2015

Privileged and Confidential Ref: 652556 Vapour Impacts in the Vicinity of SV10 Human Health Risk Assessment
Appendix D2: Soil Classification Sample location Depth (mbgl) Clay Silt Sand Classification
BH10 2 22 40 38 Loam BH10 2.5 22 40 38 Loam SV19S 1.1 45 42 13 Silty clay SV18S 1.1 37 43 20 Silty clay loam BH10 3.2 8 57 35 Silt loam
2 of 2 Checked By: BS - Jan 2015

Norton Rose Fulbright Australia HHRA for Vapour Impacts in the Vicinity of SV10
Hendon Industrial Area, Hendon, SA
Appendix E: Vapour Modelling
Ref: 652556 Privileged and Confidential

Privileged and Confidential Ref: 652556 Vapour Impacts in the Vicinity of SV10 Human Health Risk Assessment
Appendix E1: Scenario 1a Model Calculation Sheets
RISK / HEALTH-BASED CRITERIA MODEL SOIL-GAS SOURCE
INPUT SCREEN
Enter number of simulation columns (1-20) 3
SIMULATION NO. 1 2 3 CALCULATION TYPE
0-Forward risk, 1-Health-based criteria 0 0 0 Select default scenario parameters HSL-A HSL-A HSL-A Select default chemical parameters Comments Chloroform Trichlorethene Trichlorethene Soil-gas source concentration (µg/m3) 94.2 9400 9400
CHEMICAL DATA PHYSICAL PROPERTIES Molecular weight (g/mol) 119 131 131 Diffusivity in air (cm2/s) 0.0769 0.0687 0.0687 Diffusivity in water (cm2/s) 1.09E-05 1.02E-05 1.02E-05 Henry's Law Constant at Ref Temp (atm-m3/mol) 3.68E-03 9.87E-03 9.87E-03 Reference temperature (oC) 25 25 25 Organic carbon partition coefficient (Koc) (cm3/g) 9.49E+01 6.07E+01 6.07E+01
TOXICOLOGICAL / EXPOSURE PROPERTIES 0-Cancer endpoint, 1-Non-cancer endpoint 0 0 1 Inhalation cancer unit risk (µg/m3)-1 2.30E-05 4.80E-06 Inhalation reference concentration (µg/m3) 2 Fraction of RfC to background exposure 0.1
VAPOUR EMISSION SCENARIO PARAMETERS Average temperature of soil (oC) 25 25 25 Advection depth (cm) 30 30 30
Number of soil texture layers 2 2 2 Thickness of soil stratus A (cm) 50 50 50 Thickness of soil stratus B (cm) 100 100 100 Thickness of soil stratus C (cm) disabled disabled disabled Depth of soil-gas source from ground surface (cm) 150 150 150
(calculated sum of soil layer thicknesses) Selected soil layer properties for source Layer B Layer B Layer B
Stratus A Properties Default soil properties SAND SAND SAND Soil dry bulk density (g/cm3) 1.625 1.625 1.625 Soil air porosity (unitless) 0.257 0.257 0.257 Soil water porosity (unitless) 0.13 0.13 0.13 Fraction organic carbon content 0.003 0.003 0.003
Stratus B Properties Default soil properties SILT SILT SILT Soil dry bulk density (g/cm3) 1.64 1.64 1.64 Soil air porosity (unitless) 0.07 0.07 0.07 Soil water porosity (unitless) 0.33 0.33 0.33 Fraction organic carbon content 0.003 0.003 0.003
1 of 3 Checked By: BS - Jan 2015

Privileged and Confidential Ref: 652556 Vapour Impacts in the Vicinity of SV10 Human Health Risk Assessment
Stratus C Properties Default soil properties Soil dry bulk density (g/cm3) Soil air porosity (unitless) Soil water porosity (unitless) Fraction organic carbon content
disabled disabled disabled disabled
disabled disabled disabled disabled
disabled disabled disabled disabled
Dirt in Cracks Properties Default soil properties Soil dry bulk density (g/cm3) Soil air porosity (unitless) Soil water porosity (unitless)
SAND 1.625 0.257 0.13
SAND 1.625 0.257 0.13
SAND 1.625 0.257 0.13
Building Floor length (cm) Floor width (cm) Foundation thickness (cm) Enclosed space height (cm) Air exchange rate (h-1) Aerial crack fraction
1500 1000
10 240 0.6
0.001
1500 1000
10 240 0.6
0.001
1500 1000
10 240 0.6
0.001
Advective Transport 0-Qs/Qb, 1-Specify Qs, 2-Pressure Diff calculate 0 0 0
Qsoil/Qbuilding Average vapour flowrate into building (Qsoil) (L/min) Soil-building pressure differential (g/cm/s2) Soil-vapour permeability in upper soil profile (kv) (cm2)
0.005
6.0E-08
0.005
6.0E-08
0.005
6.0E-08
Building Type 0-Slab on ground or basement, 1-Crawl space Crawl space to indoor air attenuation factor
0 0 0
Vapour Degradation Applied attenuation factor for vapour degradation 1 1 1
EXPOSURE / RISK DATA Exposure frequency (d/yr) Average time (cancer) (yr) Average time (non-cancer) (yr) Exposure duration (yr) Exposure time (hr/d)
365 70 30 30 20
365 70 30 30 20
365 70 30 30 20
HEALTH-BASED CRITERIA RISK TARGETS Target cancer risk Target non-cancer HI
1.00E-05 1
1.00E-05 1
1.00E-05 1
COMBINE RISK SCENARIOS 0
2 of 3 Checked By: BS - Jan 2015

Privileged and Confidential Ref: 652556 Vapour Impacts in the Vicinity of SV10 Human Health Risk Assessment
RISK / HEALTH-BASED CRITERIA MODEL SOIL-GAS SOURCE
RESULTS SCREEN Chloroform Trichlorethene Trichlorethene
SIMULATION NO. 1 2 3 VOLATILISATION FACTOR (µg/m3)/(µg/m3) 2.18E-05 1.78E-05 1.78E-05
SOIL-GAS CONCENTRATION (µg/m3) 9.42E+01 9.40E+03 9.40E+03 INDOOR/OUTDOOR AIR CONCENTRATION (µg/m3) 2.05E-03 1.67E-01 1.67E-01
CANCER RISK - vapour 1.69E-08 2.87E-07 NA Health-based criteria - vapour (µg/m3) NA NA NA
NON-CANCER HAZARD INDEX - vapour NA NA 7.75E-02 Health-based criteria - vapour (µg/m3) NA NA NA
3 of 3 Checked By: BS - Jan 2015

Privileged and Confidential Ref: 652556 Vapour Impacts in the Vicinity of SV10 Human Health Risk Assessment
Appendix E2: Scenario 1b Model Calculation Sheets
RISK / HEALTH-BASED CRITERIA MODEL SOIL-GAS SOURCE
INPUT SCREEN
Enter number of simulation columns (1-20) 2
SIMULATION NO. 1 2 CALCULATION TYPE
0-Forward risk, 1-Health-based criteria 0 0 Select default scenario parameters HSL-A HSL-A Select default chemical parameters Comments Trichlorethene Trichlorethene Soil-gas source concentration (µg/m3) 2690 2690
CHEMICAL DATA PHYSICAL PROPERTIES Molecular weight (g/mol) 131 131 Diffusivity in air (cm2/s) 0.0687 0.0687 Diffusivity in water (cm2/s) 1.02E-05 1.02E-05 Henry's Law Constant at Ref Temp (atm-m3/mol) 0.010 0.010 Reference temperature (oC) 25 25 Organic carbon partition coefficient (Koc) (cm3/g) 6.07E+01 6.07E+01
TOXICOLOGICAL / EXPOSURE PROPERTIES 0-Cancer endpoint, 1-Non-cancer endpoint 0 1 Inhalation cancer unit risk (µg/m3)-1 4.80E-06 Inhalation reference concentration (µg/m3) 2 Fraction of RfC to background exposure 0.1
VAPOUR EMISSION SCENARIO PARAMETERS Average temperature of soil (oC) 25 25 Advection depth (cm) 30 30
Number of soil texture layers 2 2 Thickness of soil stratus A (cm) 70 70 Thickness of soil stratus B (cm) 230 230 Thickness of soil stratus C (cm) disabled disabled Depth of soil-gas source from ground surface (cm) 300 300 (calculated sum of soil layer thicknesses) Selected soil layer properties for source Layer B Layer B
Stratus A Properties Default soil properties SAND SAND Soil dry bulk density (g/cm3) 1.625 1.625 Soil air porosity (unitless) 0.257 0.257 Soil water porosity (unitless) 0.13 0.13 Fraction organic carbon content 0.003 0.003
1 of 3 Checked By: BS - Jan 2015

Privileged and Confidential Ref: 652556 Vapour Impacts in the Vicinity of SV10 Human Health Risk Assessment
Stratus B Properties Default soil properties Soil dry bulk density (g/cm3)
SILT 1.367
SILT 1.367
Soil air porosity (unitless) 0.07 0.07 Soil water porosity (unitless) 0.33 0.33 Fraction organic carbon content 0.003 0.003
Stratus C Properties Default soil properties Soil dry bulk density (g/cm3) disabled disabled Soil air porosity (unitless) disabled disabled Soil water porosity (unitless) disabled disabled Fraction organic carbon content disabled disabled
Dirt in Cracks Properties Default soil properties Soil dry bulk density (g/cm3)
SAND 1.625
SAND 1.625
Soil air porosity (unitless) 0.257 0.257 Soil water porosity (unitless) 0.13 0.13
Building Floor length (cm) 1500 1500 Floor width (cm) 1000 1000 Foundation thickness (cm) 10 10 Enclosed space height (cm) Air exchange rate (h-1)
240 0.6
240 0.6
Aerial crack fraction 0.001 0.001
Advective Transport 0-Qs/Qb, 1-Specify Qs, 2-Pressure Diff calculate 0 0
Qsoil/Qbuilding 0.005 0.005 Average vapour flowrate into building (Qsoil) (L/min) Soil-building pressure differential (g/cm/s2) Soil-vapour permeability in upper soil profile (kv) (cm2) 6.0E-08 6.0E-08
Building Type 0-Slab on ground or basement, 1-Crawl space 0 0 Crawl space to indoor air attenuation factor
Vapour Degradation Applied attenuation factor for vapour degradation 1 1
EXPOSURE / RISK DATA Exposure frequency (d/yr) 365 365 Average time (cancer) (yr) 70 70 Average time (non-cancer) (yr) 30 30 Exposure duration (yr) 30 30 Exposure time (hr/d) 20 20
HEALTH-BASED CRITERIA RISK TARGETS Target cancer risk 1.00E-05 1.00E-05 Target non-cancer HI 1 1
COMBINE RISK SCENARIOS 0
2 of 3 Checked By: BS - Jan 2015

Privileged and Confidential Ref: 652556 Vapour Impacts in the Vicinity of SV10 Human Health Risk Assessment
RISK / HEALTH-BASED CRITERIA MODEL SOIL-GAS SOURCE
RESULTS SCREEN Trichlorethene Trichlorethene
SIMULATION NO. 1 2 VOLATILISATION FACTOR (µg/m3)/(µg/m3) 7.76E-06 7.76E-06
SOIL-GAS CONCENTRATION (µg/m3) 2.69E+03 2.69E+03 INDOOR/OUTDOOR AIR CONCENTRATION (µg/m3) 2.09E-02 2.09E-02
CANCER RISK - vapour 3.58E-08 NA Health-based criteria - vapour (µg/m3) NA NA
NON-CANCER HAZARD INDEX - vapour NA 9.67E-03 Health-based criteria - vapour (µg/m3) NA NA
3 of 3 Checked By: BS - Jan 2015
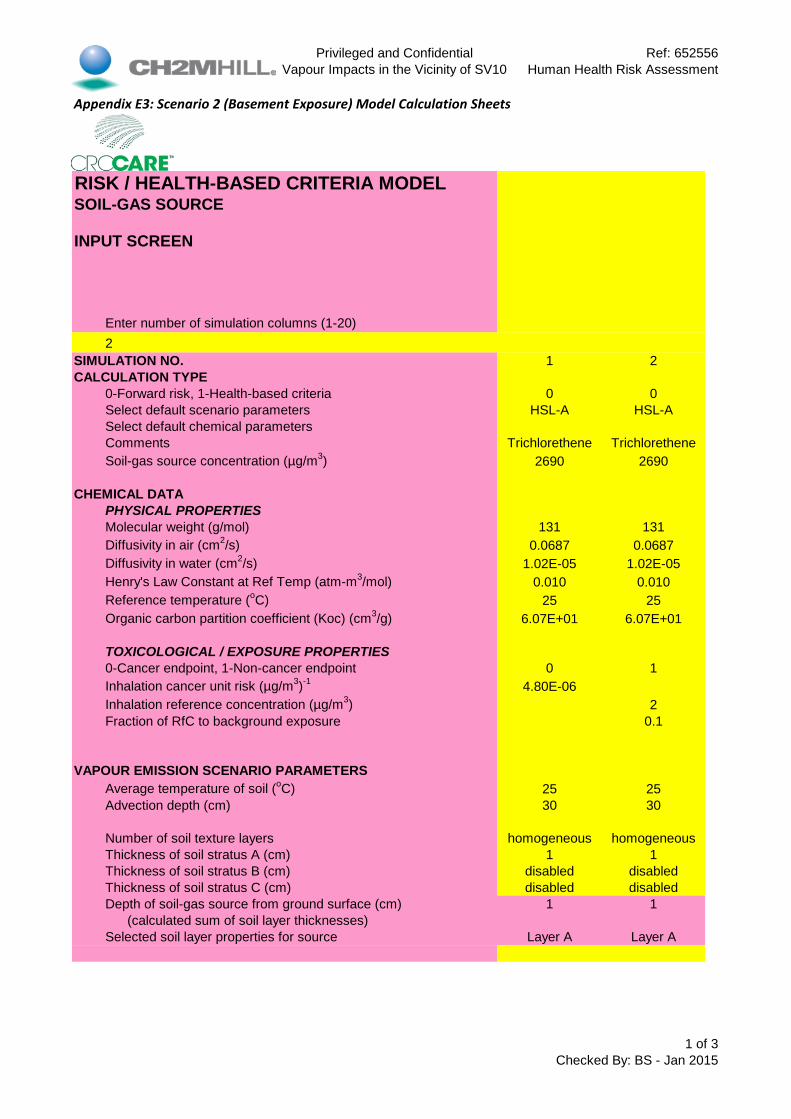
Privileged and Confidential Ref: 652556 Vapour Impacts in the Vicinity of SV10 Human Health Risk Assessment
Appendix E3: Scenario 2 (Basement Exposure) Model Calculation Sheets
RISK / HEALTH-BASED CRITERIA MODEL SOIL-GAS SOURCE
INPUT SCREEN
Enter number of simulation columns (1-20) 2
SIMULATION NO. 1 2 CALCULATION TYPE
0-Forward risk, 1-Health-based criteria 0 0 Select default scenario parameters HSL-A HSL-A Select default chemical parameters Comments Trichlorethene Trichlorethene Soil-gas source concentration (µg/m3) 2690 2690
CHEMICAL DATA PHYSICAL PROPERTIES Molecular weight (g/mol) 131 131 Diffusivity in air (cm2/s) 0.0687 0.0687 Diffusivity in water (cm2/s) 1.02E-05 1.02E-05 Henry's Law Constant at Ref Temp (atm-m3/mol) 0.010 0.010 Reference temperature (oC) 25 25 Organic carbon partition coefficient (Koc) (cm3/g) 6.07E+01 6.07E+01
TOXICOLOGICAL / EXPOSURE PROPERTIES 0-Cancer endpoint, 1-Non-cancer endpoint 0 1 Inhalation cancer unit risk (µg/m3)-1 4.80E-06 Inhalation reference concentration (µg/m3) 2 Fraction of RfC to background exposure 0.1
VAPOUR EMISSION SCENARIO PARAMETERS Average temperature of soil (oC) 25 25 Advection depth (cm) 30 30
Number of soil texture layers homogeneous homogeneous Thickness of soil stratus A (cm) 1 1 Thickness of soil stratus B (cm) disabled disabled Thickness of soil stratus C (cm) disabled disabled Depth of soil-gas source from ground surface (cm) 1 1 (calculated sum of soil layer thicknesses) Selected soil layer properties for source Layer A Layer A
1 of 3 Checked By: BS - Jan 2015

Privileged and Confidential Ref: 652556 Vapour Impacts in the Vicinity of SV10 Human Health Risk Assessment
Stratus A Properties Default soil properties Soil dry bulk density (g/cm3)
SAND 1.625
SAND 1.625
Soil air porosity (unitless) 0.257 0.257 Soil water porosity (unitless) 0.13 0.13 Fraction organic carbon content 0.003 0.003 Dirt in Cracks Properties Default soil properties Soil dry bulk density (g/cm3)
SAND 1.625
SAND 1.625
Soil air porosity (unitless) 0.257 0.257 Soil water porosity (unitless) 0.13 0.13
Building Floor length (cm) 1500 1500 Floor width (cm) 1000 1000 Foundation thickness (cm) 10 10 Enclosed space height (cm) Air exchange rate (h-1)
240 0.6
240 0.6
Aerial crack fraction 0.001 0.001
Advective Transport 0-Qs/Qb, 1-Specify Qs, 2-Pressure Diff calculate 0 0
Qsoil/Qbuilding 0.005 0.005 Average vapour flowrate into building (Qsoil) (L/min) Soil-building pressure differential (g/cm/s2) Soil-vapour permeability in upper soil profile (kv) (cm2) 6.0E-08 6.0E-08
Building Type 0-Slab on ground or basement, 1-Crawl space 0 0 Crawl space to indoor air attenuation factor
Vapour Degradation Applied attenuation factor for vapour degradation 1 1
EXPOSURE / RISK DATA Exposure frequency (d/yr) 365 365 Average time (cancer) (yr) 70 70 Average time (non-cancer) (yr) 30 30 Exposure duration (yr) 30 30 Exposure time (hr/d) 0.5 0.5
HEALTH-BASED CRITERIA RISK TARGETS Target cancer risk 1.00E-05 1.00E-05 Target non-cancer HI 1 1
COMBINE RISK SCENARIOS 0
2 of 3 Checked By: BS - Jan 2015

Privileged and Confidential Ref: 652556 Vapour Impacts in the Vicinity of SV10 Human Health Risk Assessment
RISK / HEALTH-BASED CRITERIA MODEL SOIL-GAS SOURCE
RESULTS SCREEN Trichlorethene Trichlorethene
SIMULATION NO. 1 2 VOLATILISATION FACTOR (µg/m3)/(µg/m3) 4.82E-03 4.82E-03
SOIL-GAS CONCENTRATION (µg/m3) 2.69E+03 2.69E+03 INDOOR/OUTDOOR AIR CONCENTRATION (µg/m3) 1.30E+01 1.30E+01
CANCER RISK - vapour Health-based criteria - vapour (µg/m3)
5.56E-07 NA
NA NA
NON-CANCER HAZARD INDEX - vapour Health-based criteria - vapour (µg/m3)
NA NA
1.50E-01 NA
3 of 3 Checked By: BS - Jan 2015

Privileged and Confidential Ref: 652556 Vapour Impacts in the Vicinity of SV10 Human Health Risk Assessment
Appendix E4a: Basement to ground floor model (Threshold risks) Trichlorethene
Concentration in basement air (µg/m3) 1.3E+01 Basement/ground floor attenuation factor ((µg/m3)/(µg/m3)) 10 Concentration in ground floor air 1.3E+00
Exposure frequency (d/yr) 365 Average time (threshold) (yr) 30 Exposure duration (yr) 30 Exposure time (hr/d) 19.5 Exposure concentration (µg/m3)* 1.1E+00
Threshold Inhalation reference concentration (µg/m3) 2 Fraction of RfC to background exposure 0.1 Threshold risk (HQ) 5.9E-01
*The exposure concentration is a time-averaged concentration, and is calculated in accordance with the equation presented in Schedule B4 of the NEPM 1999 (2013 amendment) as follows:
Exposure concentration (μg/m3) = (CA x ET x B x EF x ED) / AT
Where CA = Concentration in ground floor air (CA) (µg/m3)ET = Exposure time (hr/d)B = bioavailability (conservatively assumed to be 100%)EF = Exposure frequency (days/year)ED = Exposure duration (years)AT = averaging time (hours)
All exposure parameters are taken directly from the NEPM 1999 (2013 amendment) residential defaults, with the exception of the ground floor exposure time, which is defined for this HHRA.
1 of 2 Checked By: BS - Jan 2015

Privileged and Confidential Ref: 652556 Vapour Impacts in the Vicinity of SV10 Human Health Risk Assessment
Appendix E4b: Basement to ground floor model (non-threhold risks) Trichlorethene
Concentration in basement air (µg/m3) 1.3E+01 Basement/ground floor attenuation factor ((µg/m3)/(µg/m3)) 10 Concentration in ground floor air (CA) (µg/m3) 1.3E+00
Exposure frequency (d/yr) 365 Average time (non-threshold risks) (yr) 70 Exposure duration (yr) 30 Exposure time (ET) (hr/d) 19.5 Exposure concentration (µg/m3)* 4.5E-01
Inhalation cancer unit risk (µg/m3)-1 4.80E-06 Non-threshold risk 2.17E-06
*The exposure concentration is a time-averaged concentration, and is calculated in accordance with the equation presented in Schedule B4 of the NEPM as follows:
Exposure concentration (μg/m3) = (CA x ET x B x EF x ED) / AT
Where CA = Concentration in ground floor air (CA) (µg/m3)ET = Exposure time (hr/d)B = bioavailability (conservatively assumed to be 100%)EF = Exposure frequency (days/year)ED = Exposure duration (years)AT = averaging time (hours)
2 of 2 Checked By: BS - Jan 2015

Norton Rose Fulbright Australia HHRA for Vapour Impacts in the Vicinity of SV10
Hendon Industrial Area, Hendon, SA
Appendix F: Numerical Sensitivity Analysis
Results
Ref: 652556 Privileged and Confidential

Privileged and Confidential Ref: 652556 Vapour Ipacts in the Vicinity of SV10 Human Health Risk Assessment
Appendix F1: Numerical Sensitivity Analysis Results: Above Ground Building
Adjusted parameter Estimated Risk ILCR HI
Baseline 3.E-07 0.08 Geology CRC CARE clay 2.E-06 0.7
CRC CARE silt 4.E-06 1 Concentrations Maximum PB concentrations 5.E-07 0.1 Qsoil / Qbuilding ratio 0.1 3.E-07 0.08 Crawl space building 3.E-07 0.08
1 of 1 Checked By: BS - Jan 2015

Privileged and Confidential Ref: 652556 Vapour Impacts in the Vicinity of SV10 Human Health Risk Assessment
Appendix F2: Numerical Sensitivity Analysis Results: Building with basement
Adjusted parameter
Estimated Risk (Total risk from
basement and ground floor exposure) ILCR HI
Baseline 3.E-06 0.7
Exposure time in basement 15 minutes / day 2.E-06 0.7 1 hour / day 3.E-06 0.9 20 hours/day (habitable basement) 2.E-05 6.0
Cb / Ci ratio 5 5.E-06 1.0 Qsoil / Qbuilding ratio 0.1 3.E-05 9.0
1 of 1 Checked By: BS - Jan 2015
Copyright © 2022 FDOKUMEN