Developing Children's Understanding of Fractions: An Intervention Study
Upload
independentCategory
view
3download
0
Vapor−Liquid Equilibrium of Hydrogen, Vacuum Gas Oil, and MiddleDistillate FractionsBarbara Browning,*,† Reynald Henry,† Pavel Afanasiev,† Gregory Lapisardi,‡ Gerhard Pirngruber,‡
and Melaz Tayakout-Fayolle†
†Institut de Recherches sur la Catalyse et l’Environnement de Lyon (IRCELyon), CNRS UMR 5256, Universite Claude BernardLyon 1, 2 Avenue Albert Einstein, 69626 Villeurbanne cedex, France‡IFP Energies Nouvelles, Rond-point de l’echangeur de Solaize, BP3, 69360 Solaize, France
ABSTRACT: Vapor−liquid equilibrium (VLE) data for hydrogen/hydrocarbon mixtures based on real feedstocks at hightemperature and pressure is scarce and is needed to model hydrocracking systems accurately. Experiments with a vacuum gas oilhave been used to generate VLE data for real hydrogen/hydrocarbon mixtures under hydrocracking conditions in a semibatchreactor with a range of compositions. Flash calculations were performed using a process simulation program and compared to theexperimental results. The data was used to verify the existence of equilibrium conditions in the reactor and to show that theGrayson Streed activity coefficient model, combined with Peng−Robinson equation of state, provides a good estimate of liquidphase and vapor phase compositions and individual component volatility.
■ INTRODUCTION
Hydrocracking is used in industry to convert heavy oil fractionsand residues to more useful mixtures, for example, theupgrading of vacuum gas oil (boiling range 370−510 °C) tomiddle distillate (boiling range 150−370 °C). The traditionalmethod of upgrading these fractions is by catalytic cracking influidized beds. Despite being more costly, due to therequirement for high pressure hydrogen, hydrocracking offersmuch more flexibility as heavier feedstock compositions can beprocessed. This has become increasingly important as the crudeoils now being sent to refineries tend to comprise substantialfractions of heavy material, while the demands of the market arefor increasing quantities of lighter fuels such as gas oil andkerosene.1,2 In industry, a typical hydrocracking process isusually carried out in a trickle bed reactor operating between300 and 450 °C and at pressures of 80−180 bar. A bifunctionalcatalyst is used to reduce carbon chain lengths andsimultaneously hydrogenate the hydrocarbons produced.3
Due to its importance for the oil industry, much laboratoryresearch, using various reactor types, has been given tounderstanding hydrocracking.4 Real oil fractions are complexmixtures of many different hydrocarbons, and so, for simplicity,experimental studies into the kinetics and performance ofbifunctional catalysts for hydrocracking are often based onmodel molecules.5−9 One drawback of this is that extrapolatingresults from a model molecule to real reaction mixtures doesnot allow for interactions between the components. Also, tracesof sulfur and nitrogen, present in real mixtures, may affectreaction kinetics. Finally, the feedstocks for hydrocracking tendto be mostly composed of larger molecules than those generallyused as model hydrocarbons. Work with real feedstocks allowsthese aspects to be taken into account and actual process plantconditions to be replicated and explored so as to provide betterdata for design and development of new units.The VLE data is important in hydrocracking. In a typical
trickle bed reactor for hydrocracking, the hydrogen is mostly in
the vapor phase with some dissolved in the liquid, and theheavy hydrocarbons are mainly in the liquid phase which is incontact with the catalyst. However, experimental studies haveshown that there is sufficient vaporisation of the hydrocarbonsto impact the observed reaction kinetics.10−12 Modeling studieshave confirmed this,13,14 and some authors have accounted forthe VLE in their kinetic models for hydrocracking.15−17 Aproblem caused by the lack of reliable VLE data is that inlaboratory scale hydrocracking studies, accurate compositionanalysis can only usually be made by stopping the reaction andcooling the reactor. Accurate VLE data would allow liquid andvapor compositions to be determined from samples takenunder operating conditions, and therefore much moreinformation to be derived from a single experiment. So, it isclear that knowledge of the VLE data at the reaction conditionsis important for accurate study and modeling of hydrocracking.For process modeling or design applications, it is conven-
tional to use a process simulator to find VLE data byperforming flash calculations. An appropriate thermodynamicmodel is selected based on the fluid composition and theprocess conditions. When a single equation of state (EoS) isused to represent the whole mixture this is known as ahomogeneous thermodynamic model. Of these, Valderrama18
recommends either the Soave−Redlich−Kwong (SRK) orPeng−Robinson (PR)19 EoS for modeling reservoir fluids,which would include the vacuum gas oil used in this study.Alternatively, a heterogeneous thermodynamic model can beused, with the EoS applied only to the gas phase and the liquidphase represented by an activity coefficient model, such asthose of Chao−Seader20 or Grayson Streed (GS).21 Exper-imentally derived binary interaction parameters for all the
Received: March 4, 2014Revised: April 8, 2014Accepted: April 22, 2014Published: April 22, 2014
Article
pubs.acs.org/IECR
© 2014 American Chemical Society 8311 dx.doi.org/10.1021/ie500930n | Ind. Eng. Chem. Res. 2014, 53, 8311−8320

components to be modeled are needed. For oil fractions it isimpossible to identify all the components, and so, interactionparameters are usually found by generating pseudocomponentsto represent long chain molecules not already included in thesimulator database.A hydrocracking system is a combination of hydrogen and
hydrocarbons at high temperature and pressure. The 1963 GSmodel was developed specifically for this type of system.22
However, because the behavior of hydrogen/hydrocarbon (H2/HC) systems is difficult to predict, authors have continued todevelop thermodynamic models for these mixtures to gainbetter accuracy over a wide range of temperature andpressures.23−30 All this work has been based on experimentswith binary systems and not the complex mixtures found in areal hydrocracker. Both Riazi and Roomi31 and Torres et al.32
did test their methods for prediction of hydrogen solubility inhydrocarbons on data drawn from real mixtures at hightemperature and pressure but these did not extend tohydrocracking conditions. There are so few studies ofthermodynamic models for real hydrocracking mixtures andconditions reported in the literature that Alvarez andAncheyta33 chose to neglect vaporisation in their dynamicmodel of hydrodemetallization of residues at 360−420 °C and98 bar, because of absence of reliable thermodynamic data.One reason for the lack of VLE data for hydrocracking
conditions is that, in a trickle bed reactor, conditions vary alongthe reactor length. So, laboratory scale trickle bed reactors,which are usually used for the study of the hydrocrackingreaction, are not useful for gathering the VLE data. In the fewstudies that are reported, alternative methods are used.Gauthier et al.34 carried out hydrocracking of a vacuum residuein an ebulliated bed reactor. They analyzed VLE compositionsunder hydrocracking conditions (410−440 °C, 160 bar) and atdifferent conversions (35−70%). Their experimental resultswere compared against flash calculations using both the PR andGS thermodynamic models, and they found the GS model tosystematically underestimate vaporization by 10% while the PRmodel matched the experimental findings very well. Chen etal.35 used a continuous flow VLE cell with a flash calculationprogram to predict VLEs for middle distillates and heavy gasoils under hydrotreatment conditions up to 430 °C and 110bar. They used the PR EoS and determined interactioncoefficients between the hydrocarbons and hydrogen to fit theexperimental data for the middle distillate. However, the datafor the heavy gas oil was less precise as higher temperatures areneeded for hydrocracking heavier mixtures. With conditions setto represent these more severe temperatures, the mixture wasfound to undergo thermocracking in the VLE cell.36
The objectives of this particular study are to provideexperimental VLE data for hydrocracking of a real vacuumgas oil under typical operating conditions and to test a suitablethermodynamic model to represent these results. The under-lying aim is to find intrinsic reaction parameters forhydrocracking. Dissociating the VLE effects from other factorsaffecting the reaction rate is a necessary part of this work. Weobtain VLE data by analysis of liquid and vapor samples, takenfrom a batch reactor for hydrocracking a vacuum gas oil atreaction conditions and different conversions. The results arethen compared to predictions by using a process simulationprogram.
■ MATERIALS AND METHODS
Hydrocracking experiments were conducted on a vacuum gasoil at 400 °C and 120 bar in a 300 mL Parr 4842 bench scalepressure reactor equipped with a Robinson-Mahoney stationarycatalyst basket. The vacuum gas oil used had a boiling range of370−510 °C, the density was 0.8589 g·cm−3 at 20 °C, andcarbon numbers ranged from 22 to 42. For each experiment, 10g of catalyst were loaded to the reactor for 120 g of vacuum gasoil. At operating conditions, this corresponds to an initial liquidvolume of about 195 mL. The reactor pressure was maintainedat 120 bar by hydrogen injection. Hydrocracking producesvolatiles, which increase the oil partial pressure as the reactionadvances, so the hydrogen feed rate is slightly below theconsumption rate and the partial pressure of hydrogen in thereactor is decreasing slowly during the experiments. Thereaction was carried out over several bifunctional catalystscontaining supported Ni−Mo and zeolite with different ratios.For details and discussion of the experimental method, thesynthesis and characterization of the catalysts, and also theanalysis of the initial feed and the reaction products, refer to thework of Henry et al.37
Increasing the agitation rate in this reactor had no influenceon conversion or selectivity, so vapor−liquid mass transferlimitations appear to have negligible effect. However, it will beseen later that the vapor−liquid equilibrium does take sometime to become established. For each experiment, samples aretaken from the hot reactor at the end of the reaction period,after shutting off the hydrogen supply. The hot reactor is thenplunged into an ice bath to ensure rapid cooling and stop thehydrocracking reaction. When the reactor reaches ambienttemperature a final analysis of the reaction products is made.Recovery of the reaction products from the cooled reactor
was straightforward. The residual pressure after cooling wasnoted and a gas sample taken before the reactor wasdepressurised. The reactor was then weighed before theremaining liquid and the catalyst were collected separately foranalysis. Typically, the final mass balance was accurate to 97.5%with a small amount of material lost as volatiles on opening thereactor and as liquid remaining on the reactor cover andagitator.Analysis of the initial vacuum gas oil and liquid samples was
by two-dimensional gas chromatography (GC × D). Thisseparates components by both boiling point and polarity. Theapparatus used37,38 allowed mass fractions to be determined,according to hydrocarbon family and carbon number, from C5and up. The hydrocarbon families considered were: n-paraffins,iso-paraffins, naphthenes, and aromatics. In the work of Henryet al.37 the naphthenes with a carbon number higher than 20were not analyzed separately but included in the iso-paraffinand n-paraffin families, while in this work these naphtenes havebeen separated and considered. The gas samples taken from thecondenser are analyzed by gas chromatography for hydrogen,hydrogen sulfide and light hydrocarbons including methane.It is possible to calculate the mass balance for the reactor
after cooling very precisely. At ambient temperature, thecomponents with carbon number greater than C6 can be saidto be completely condensed in the liquid phase and all thehydrogen assumed to be in the gas phase. The only unknownquantities are for the gases and light hydrocarbons as somematerial may be dissolved in the liquid phase and therefore notmeasured. However, at low and moderate conversions, theseconstitute only a tiny fraction of the material in the reactor.
Industrial & Engineering Chemistry Research Article
dx.doi.org/10.1021/ie500930n | Ind. Eng. Chem. Res. 2014, 53, 8311−83208312
Also, the total quantities of hydrogen sulfide and methane areknown from the initial amount of DMDS added to the reactor,so mass balances can be completed for these two componentsfrom the gas phase analysis only.The range of data available comes from use of the fed batch
reactor setup to test eight catalysts for hydrocracking of thevacuum gas oil mentioned previously. The hydrocracking ratevaried between the catalysts and experiments of differentduration were conducted with conversions from very slight toapproximately 75%. The results of these experiments thereforeprovide composition data for different H2/HC mixtures underrealistic hydrocracking conditions.
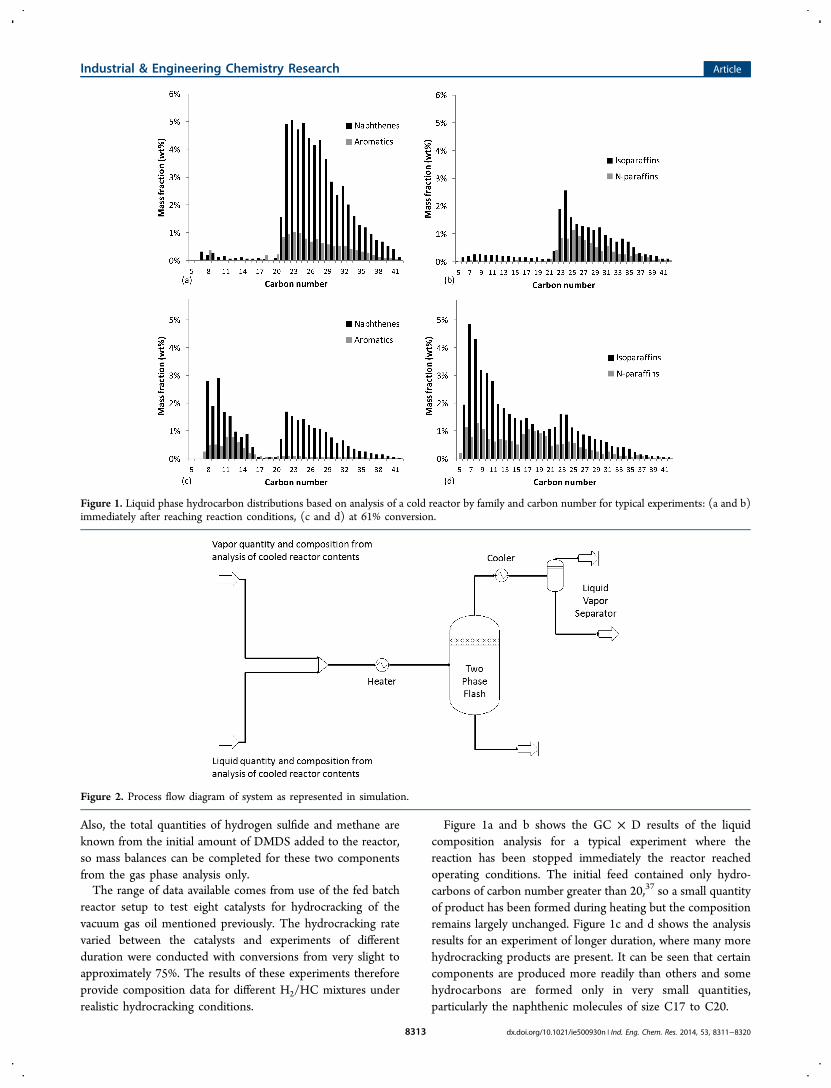
Figure 1a and b shows the GC × D results of the liquidcomposition analysis for a typical experiment where thereaction has been stopped immediately the reactor reachedoperating conditions. The initial feed contained only hydro-carbons of carbon number greater than 20,37 so a small quantityof product has been formed during heating but the compositionremains largely unchanged. Figure 1c and d shows the analysisresults for an experiment of longer duration, where many morehydrocracking products are present. It can be seen that certaincomponents are produced more readily than others and somehydrocarbons are formed only in very small quantities,particularly the naphthenic molecules of size C17 to C20.
Figure 1. Liquid phase hydrocarbon distributions based on analysis of a cold reactor by family and carbon number for typical experiments: (a and b)immediately after reaching reaction conditions, (c and d) at 61% conversion.
Figure 2. Process flow diagram of system as represented in simulation.
Industrial & Engineering Chemistry Research Article
dx.doi.org/10.1021/ie500930n | Ind. Eng. Chem. Res. 2014, 53, 8311−83208313

Taking representative samples of each phase from the hotreactor was more challenging, and a strict sampling method wasdeveloped. First, both the agitator and the hydrogen supplywere shut down to prevent gas entering the liquid sample valve.For the liquid samples, the heated sample valve was flushedthrough twice prior to sampling, to avoid contamination. Also,the sample container was plunged into a cold bath at −78 °C toimmediately condense and capture the most volatilecomponents. As with the liquid sample from the cooledreactor, the small quantity of light hydrocarbons (<C5) anddissolved gases is not measured. For the gas phase, thesampling system comprises a 2.2 mL vapor lock, maintained at180 °C, and a condenser with separate gas and liquid samplepoints. The gas sample is taken from the condenser andanalyzed immediately. A tiny amount of condensate was formedin the condenser, but too little to be recovered except at thehighest conversion. It is assumed that there is negligiblehydrocracking after the final samples are taken from the hotreactor. So, the total quantity of each individual component isdetermined from the samples taken from the cooled reactorand assumed to be identical at hot conditions for the sameexperiment. This seems reasonable, since the cooling is veryrapid and the reaction rate is known to be strongly dependenton temperature.39,40 The reactor temperature is reduced to 250°C after roughly 6 min of cooling.The conditions for which experimental VLE data was
available were then modeled using the simulation program,ProSim Plus (version 3.3). Figure 2 shows the arrangementused. Note that in using the process simulator, a continuous
mode is used to describe a single instant of the fed batchreaction and that Figure 2 does not represent the actualexperimental setup. The mass balance data from the cooledreactor was used as the process input and the reactor setup wasdescribed using a two phase flash to represent the reactor, plusa cooler and separator to represent the condenser on thereactor vapor sample line. This allows a direct comparison to bemade between the predicted and measured vapor compositions.The PR EoS was tested with and without the GS activity
coefficient model. The results for the PR EoS without anactivity coefficient model were nonphysical, falsely calculatingthat no liquid phase existed. However, the GS activitycoefficient model combined with the PR EoS appeared togive reasonable results and so, this model was used. For thesimulation, the reaction system includes some molecules whichcan be considered individually, such as hydrogen, other gases,n-alkanes, and small hydrocarbons. The physical data for thesecan be found in the simulation program property data bank.The remaining components, grouped by carbon number andfamily, include multiple isomers with slightly different physicalproperties. Each group is represented by a single pseudocom-ponent, the properties of which are generated within thesimulation program. The required input data is molecularweight, estimated from the molecular structures, and boilingpoint, estimated from the GC × D analysis and verified bychecking the boiling points of typical compounds within thegroups using the Nannoolal method.41
Figure 3. Comparison between vapor exit stream and vapor sample mole fraction against time for (a) hydrogen, (b) methane, and (c) H2S.
Industrial & Engineering Chemistry Research Article
dx.doi.org/10.1021/ie500930n | Ind. Eng. Chem. Res. 2014, 53, 8311−83208314

■ RESULTS AND DISCUSSIONThe simulation results were compared to the experimental data.Results for the gas phase are discussed first, followed by a more
detailed analysis of the results for the liquid phase. Of thecomponents measured by GC analysis of the gas phase, totalquantities are precisely known only for hydrogen, methane andhydrogen sulfide. The mole fractions of these three gases in thesimulated vapor stream leaving the condenser are compareddirectly to the measured data. Methane and hydrogen sulfideare formed from DMDS, which must be added at the start ofeach experiment to create realistic hydrocracking conditions.Figure 3 shows the results with all the experimental andsimulation values given at the same conditions, 400 °C and 120bar. In order to cover the whole time range studied, resultsfrom experiments with different catalysts are included in thegraphs and so more than one result is shown for most timepoints. For each gas, it can be observed that there is astabilization period before any fit between experimental dataand simulation results is obtained. This relates to the time forequilibrium to become established and indicates that there issome mass transfer resistance between the liquid and vaporphase in the reactor. After about 1 h, equilibrium is approached.Figure 3a refers to the hydrogen mole fraction which, after theinitial stabilization period, remains close to the predicted values.Figure 3b compares the measured and predicted mole fractionsfor methane. It is interesting to observe that the predictedquantities of methane in the gas stream are increasing as thereaction progresses. This is an indication of the effect of the
changing reaction composition on the vapor−liquid equilibriumin the reactor. Further, it can also be seen that the measuredmethane mole fraction follows the same pattern. Finally, Figure3c shows the results for the hydrogen sulfide. There is asignificant difference between predicted and measured valuesfor the hydrogen sulfide. The elemental sulfur mass balance alsoshowed a discrepancy with not all the sulfur added to thesystem being recovered and this is thought to be due to sulfuradsorption on the solid catalyst.For the liquid phase hydrocarbon mixture, results from five
typical experiments are presented. Table 1 shows the massfractions of the component hydrocarbon families, found byanalysis of the liquid samples from the cold reactor, for each ofthese cases. As mentioned previously, where quantities areinsufficient, the data cannot be used. For example, thearomatics often exist in tiny amounts and they are mostlyremoved from the comparison.First, consider the initial reaction conditions, when the
reactor has just reached the operating temperature of 400 °C.Figure 4 compares the component mass fractions given by GC× D analysis of the liquid sample from the hot reactor to thosepredicted by the simulation. The hydrocarbon families are eachrepresented separately. At this time, very few light hydro-carbons have been produced. However, the results which areavailable fit well with the predicted values.Figure 5 shows the comparison between analysis results from
the hot liquid sample and predicted values for composition 2.Figures 6−8 show the same comparison for other compositionsas the reaction mixture evolves with hydrocracking. There isgood agreement between the results of the GC × D analysisand the simulation across all the hydrocarbon families andthroughout the reaction period studied.At the composition shown in Figure 8, sufficient condensate
was formed in the condenser on the gas sample line forcollection and analysis. Figure 9 compares the measured andsimulated mass fractions for this stream. The predicted resultsare close to the measured data, confirming that the
Table 1. Mass Fractions of Hydrocarbon FamiliesConsidered for the Reaction Mixtures Presented
composition 1 2 3 4 5
aromatics 11.5 5.3 5.3 5.9 9.92naphthenes 58.1 42.9 34.7 29.1 23.47iso-paraffins 20.0 36.0 42.1 46.8 49.33n-paraffins 10.4 15.9 17.8 18.2 17.04
Figure 4. Comparison between measured and simulated liquid phase mass fractions at 400 °C and 120 bar for composition 1: (a) aromatics, (b)naphthenes, (c) iso-paraffins, and (d) n-paraffins.
Industrial & Engineering Chemistry Research Article
dx.doi.org/10.1021/ie500930n | Ind. Eng. Chem. Res. 2014, 53, 8311−83208315

thermodynamic model provides a good estimate of the reactorvapor phase composition.To compare the GC × D analysis and simulation results
more finely, the volatility of each individual component wasevaluated. For this, the total quantities of liquid and vapor inthe reactor at the operating conditions are needed to determinethe masses of the components in the vapor phase but cannot bemeasured experimentally. Figure 10 shows the liquid massfraction of the total reactor contents predicted by thesimulation provided by Prosim for different compositions.Initially, nearly all the mass is in the liquid phase and the vaporphase is very light as it is comprised mainly of hydrogen. Theliquid mass fraction changes only slightly at first then, as thehydrocracking reaction progresses, it decreases more quickly.Predictions of the liquid and vapor phase volumes in thereactor at equilibrium are also provided by the simulator and
follow a similar pattern to the total mass of liquid in the reactor.The liquid volume in the fed batch reactor is steady, atapproximately 80% of the total reactor volume, during the firststages of the reaction and then decreases with increasingconversion, as lighter hydrocarbons are formed. At highconversion, for the reactor system at equilibrium, the expectedliquid volume would be about half of its initial value.Given that the simulation gives a good fit for the condensate
composition as shown in Figure 9, it is assumed that the totalliquid mass fractions predicted by the simulation are reliable.These were therefore used with the experimental data toestimate individual component volatilities for comparison withthe Prosim results. The volatility is defined as the mass of anycomponent found in the vapor phase divided by the total massof that component in the reactor. When the total quantity of acomponent group is very small, the difference between the
Figure 5. Comparison between measured and simulated liquid phase mass fractions at 400 °C and 120 bar for composition 2: (a) aromatics, (b)naphthenes, (c) iso-paraffins, and (d) n-paraffins.
Figure 6. Comparison between measured and simulated liquid phase mass fractions at 400 °C and 120 bar for composition 3: (a) aromatics, (b)naphthenes, (c) iso-paraffins, and (d) n-paraffins.
Industrial & Engineering Chemistry Research Article
dx.doi.org/10.1021/ie500930n | Ind. Eng. Chem. Res. 2014, 53, 8311−83208316

amount vaporised under hot and cold conditions is too close tothe experimental error and volatility cannot be calculated.However, where quantities are sufficient, coherent results areobtained.Figure 11a shows the predicted volatility of each component
group under consideration for composition 1 where very littlehydrocracking has taken place. It can be seen that, for thismixture, the simulation predicts almost no vaporization of thecomponents with carbon number greater than 25 and does notfind any difference between the different hydrocarbon families.Figure 11b compares the simulation results to the volatilitiescalculated from the experimental data. At this point in theexperiment, insufficient amounts of light hydrocarbons havebeen generated to verify the simulation results for carbon
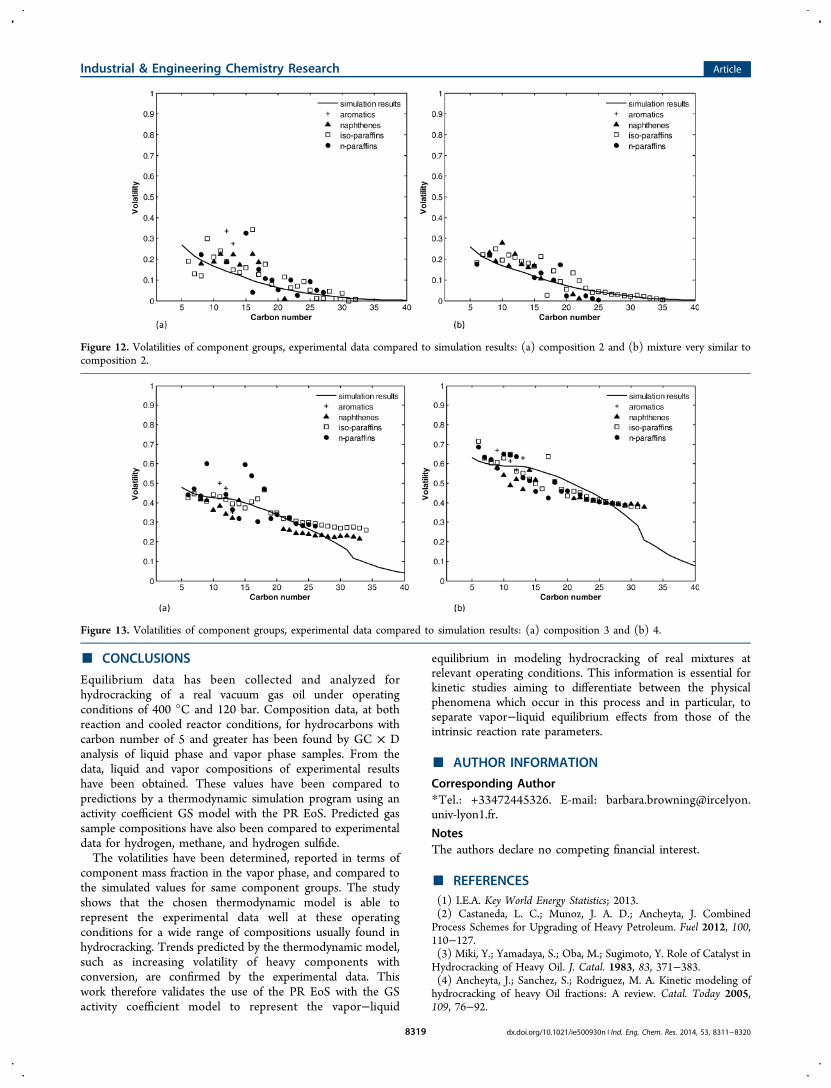
numbers less than 20. However, the results which are availablefit with the simulation values.Figure 12 compares the simulation results to the volatilities
calculated from the experimental data, for composition 2 andanother experiment with similar composition. The experimentalresults are seen to be consistent. As the hydrocracking mixtureevolves, the equilibrium shifts slightly so that heavierhydrocarbons become more volatile. This can be seen inboth the predicted equilibrium data and the experimentalresults, with a reasonably good match between the two.Figure 13 compares the simulation results against the
volatilities calculated from the experimental data at composi-tions 3 and 4. It can be seen that this thermodynamic modelcontinues to provide a reasonable fit with the experimentaldata. As for the light hydrocarbons in Figure 11, insufficient
Figure 7. Comparison between measured and simulated liquid phase mass fractions at 400 °C and 120 bar for composition 4: (a) aromatics, (b)naphthenes, (c) iso-paraffins, and (d) n-paraffins.
Figure 8. Comparison between measured and simulated liquid phase mass fractions at 400 °C and 120 bar for composition 5: (a) aromatics, (b)naphthenes, (c) iso-paraffins, and (d) n-paraffins.
Industrial & Engineering Chemistry Research Article
dx.doi.org/10.1021/ie500930n | Ind. Eng. Chem. Res. 2014, 53, 8311−83208317

heavy hydrocarbons remain to verify the simulation results forcarbon numbers higher than 35. The reason for unusual shapeof the curve representing the simulation results is not certain,
but is probably due to the variation in the relative quantities ofthe different hydrocarbon families for different carbon numbers.Heavy hydrocarbon systems are challenging not only for
experimental measurements but also for reliable estimationsusing traditional equations of state. The results presented inthis work describe a phenomenological approach to thesimulations. Even though the EoS-based model proved towork reasonably well for the case studied, further under-standing of the equilibria in such systems requires that theunderlying fundamental interactions at the molecular level beproperly accounted for. Toward this, a molecular dynamics(MD) approach seems promising. MD calculations would allowparticular features of the systems under study, which are hardlyattainable by EoS, to be accounted for.42 Among these are thestrong nonideality of hydrogen behavior leading to anomalies inits solubility,43 or substantial differences of configurationalentropy and specific interactions of various types ofmolecules.44
Figure 9. Comparison between measured and simulated condensate mass fractions at 400 °C and 120 bar for composition 5: (a) aromatics, (b)naphthenes, (c) iso-paraffins, and (d) n-paraffins.
Figure 10. Simulated mass fraction of liquid in the reactor againstconversion.
Figure 11. Volatilities of component groups for composition 1: (a) simulation results and (b) experimental data compared to simulation results.
Industrial & Engineering Chemistry Research Article
dx.doi.org/10.1021/ie500930n | Ind. Eng. Chem. Res. 2014, 53, 8311−83208318
■ CONCLUSIONS
Equilibrium data has been collected and analyzed forhydrocracking of a real vacuum gas oil under operatingconditions of 400 °C and 120 bar. Composition data, at bothreaction and cooled reactor conditions, for hydrocarbons withcarbon number of 5 and greater has been found by GC × Danalysis of liquid phase and vapor phase samples. From thedata, liquid and vapor compositions of experimental resultshave been obtained. These values have been compared topredictions by a thermodynamic simulation program using anactivity coefficient GS model with the PR EoS. Predicted gassample compositions have also been compared to experimentaldata for hydrogen, methane, and hydrogen sulfide.The volatilities have been determined, reported in terms of
component mass fraction in the vapor phase, and compared tothe simulated values for same component groups. The studyshows that the chosen thermodynamic model is able torepresent the experimental data well at these operatingconditions for a wide range of compositions usually found inhydrocracking. Trends predicted by the thermodynamic model,such as increasing volatility of heavy components withconversion, are confirmed by the experimental data. Thiswork therefore validates the use of the PR EoS with the GSactivity coefficient model to represent the vapor−liquid
equilibrium in modeling hydrocracking of real mixtures atrelevant operating conditions. This information is essential forkinetic studies aiming to differentiate between the physicalphenomena which occur in this process and in particular, toseparate vapor−liquid equilibrium effects from those of theintrinsic reaction rate parameters.
■ AUTHOR INFORMATION
Corresponding Author*Tel.: +33472445326. E-mail: [email protected].
NotesThe authors declare no competing financial interest.
■ REFERENCES(1) I.E.A. Key World Energy Statistics; 2013.(2) Castaneda, L. C.; Munoz, J. A. D.; Ancheyta, J. CombinedProcess Schemes for Upgrading of Heavy Petroleum. Fuel 2012, 100,110−127.(3) Miki, Y.; Yamadaya, S.; Oba, M.; Sugimoto, Y. Role of Catalyst inHydrocracking of Heavy Oil. J. Catal. 1983, 83, 371−383.(4) Ancheyta, J.; Sanchez, S.; Rodriguez, M. A. Kinetic modeling ofhydrocracking of heavy Oil fractions: A review. Catal. Today 2005,109, 76−92.
Figure 12. Volatilities of component groups, experimental data compared to simulation results: (a) composition 2 and (b) mixture very similar tocomposition 2.
Figure 13. Volatilities of component groups, experimental data compared to simulation results: (a) composition 3 and (b) 4.
Industrial & Engineering Chemistry Research Article
dx.doi.org/10.1021/ie500930n | Ind. Eng. Chem. Res. 2014, 53, 8311−83208319

(5) Steijns, M.; Froment, G. F. Hydroisomerization and Hydro-cracking. 2. Product Distributions from n-Decane and n-Dodecane.Ind. Eng. Chem. Proc. Res. Dev. 1981, 20, 654−660.(6) Steijns, M.; Froment, G. F. Hydroisomerization and Hydro-cracking. 3. Kinetic Analysis of Rate Data for n-Decane and n-Dodecane. Ind. Eng. Chem. Prod. Res. Dev. 1981, 20, 660−668.(7) Baltanas, M. A.; Vansina, H.; Froment, G. F. Hydroisomerizationand Hydrocracking. 5. Kinetic Analysis of Rate Data for n-Octane. Ind.Eng. Chem. Proc. Res. Dev. 1983, 22, 531−539.(8) Froment, G. F. Kinetics of the Hydroisomerization andHydrocracking of Paraffins on a Platinum Containing BifunctionalY-Zeolite. Catal. Today 1987, 1, 455−473.(9) Cui, G.; Wang, J.; Fan, H.; Sun, X.; Jiang, Y.; Wang, S.; Liu, D.;Gui, J. Towards Understanding the Microstructures and Hydro-cracking Performance of Sulfide Ni-W Catalysts: Effect of MetalLoading. Fuel Process. Technol. 2011, 92, 2320−2327.(10) Bellos, G. D.; Papayannakos, N. G. The Use of a Three PhaseMicroreactor to Investigate HDS Kinetics. Catal. Today 2003, 79−80,349−355.(11) Hoekstra, G. The Effects of Gas-to-Oil Rate in Ultra Low SulfurDiesel Hydrotreating. Catal. Today 2007, 127, 99−102.(12) Rossetti, I.; Gambaro, C.; Calemma, V. Hydrocracking of LongChain Linear Paraffins. Chem. Eng. J. 2009, 154, 295−301.(13) Chen, J.; Milgundmath, V.; Wang, N. Accounting for Vapor-Liquid Equilibrium in the Modeling and Simulation of a CommercialHydrotreating Reactor. Ind. Eng. Chem. Res. 2011, 50, 1571−1579.(14) Pellegrini, L.; Gamba, S.; Calemma, V.; Bonomi, S. Modelling ofHydrocracking with Vapour-Liquid Equilibrium. Chem. Eng. Sci. 2008,63, 4285−4291.(15) Kumar, H.; Froment, G. F. Mechanistic Kinetic Modeling of theHydrocracking of Complex Feedstocks, such as Vacuum Gas Oils. Ind.Eng. Chem. Res. 2007, 46, 5881−5897.(16) Gamba, S.; Soave, G. S.; Pellegrini, L. A. Use of Normal BoilingPoint Correlations for Predicting Critical Parameters of Paraffins forVapour-Liquid Equilibrium Calculations with the SRK Equation ofState. Fluid Phase Equilib. 2009, 276, 133−141.(17) Nguyen, T. S.; Tayakout-Fayolle, M.; Ropars, M.; Geantet, C.Hydroconversion of an Atmospheric Residue with a DispersedCatalyst in a Batch Reactor: Kinetic Modeling Including Vapor-LiquidEquilibrium. Chem. Eng. Sci. 2013, 94, 214−223.(18) Valderrama, J. O. The State of the Cubic Equations of State. Ind.Eng. Chem. Res. 2003, 42, 1603−1618.(19) Peng, Y. D.; Robinson, D. B. A New Two Constant Equation ofState. I.E.C. Fundam. 1976, 15, 59−64.(20) Chao, K. C.; Seader, J. D. A General Correlation of Vapour-Liquid Equilibria in Hydrocarbon Mixtures. AIChE. J. 1961, 7, 598−605.(21) Grayson, H. G.; Streed, C. W. Vapour-liquid Equilibrium forHigh Temperature, High Pressure Hydrogen Hydrocarbon Systems.6th World Petroleum Congress, Frankfurt am Main, June 19−26,1963; pp 169−181.(22) Simulis Thermodynamics; Serveur de calculs de proprietiesthermodynamiques et d’equilibres entre phases, Modeles Thermody-namiques version 1.4, ProSim SA, 2004−2010.(23) Moysan, J. M.; Huron, M. J.; Paradowski, H.; Vidal, J. Predictionof the Solubility of the Hydrogen in Hydrocarbon Solvents throughCubic Equations of State. Chem. Eng. Sci. 1983, 38, 1085−1092.(24) Huang, H.; Sandler, S. I.; Orbey, H. Vapor-liquid Equilibria ofsome Hydrogen + Hydrocarbon Systems with the Wong-SandlerMixing Rule. Fluid Phase Equilib. 1994, 96, 143−153.(25) Stryjek, R.; Vera, J. H. An Improved Peng-Robinson Equation ofState for Pure Compounds and Mixtures. Can. J. Chem. Eng. 1986, 64,323−333.(26) Ferrando, N.; Ungerer, P. Hydrogen/hydrocarbon PhaseEquilibrium Modeling with a Cubic Equation of State and a MonteCarlo Method. Fluid Phase Equilib. 2007, 254, 211−223.(27) Robinson, D. B.; Peng, D. Y. The Characterization of theHeptanes and Heavier Fractions for the GPA Peng-RobinsonProgram. Gas Processors Assoc. Res. Rep. 1978, 28, 1−36.
(28) Tran, T. K. S.; NguyenHuynh, D.; Ferrando, N.; Passarello, J.-P.; de Hemptinne, J.-C.; Tobaly, P. Modeling VLE of H2 +Hydrocarbon Mixtures Using a Group Contribution SAFT with a kijCorrelation Method Based on London’s Theory. Energy Fuels 2009,23, 2658−2665.(29) Yuan, H.; Gosling, C.; Kokayeff, P.; Murad, S. Prediction ofHydrogen Solubility in Heavy Hydrocarbons Over a Range ofTemperatures and Pressures Using Molecular Dynamics Simulations.Fluid Phase Equilib. 2010, 299, 94−101.(30) Qian, J.-W.; Jaubert, J.-N.; Privat, R. Phase Equilibria inHydrogen-Containing Binary Systems Modeled with the Peng−Robinson Equation of State and Temperature-Dependent BinaryInteraction Parameters Calculated Through a Group-ContributionMethod. J. Supercrit. Fluids 2013, 75, 58−71.(31) Riazi, M. R.; Roomi, Y. A. A Method to Predict Solubility ofHydrogen in Hydrocarbon and their Mixtures. Chem. Eng. Sci. 2007,62, 6649−6658.(32) Torres, R.; de Hemptinne, J.-C.; Machin, I. Improving theModeling of Hydrogen Solubility in Heavy Oil Cuts Using anAugmented Grayson Streed (AGS) Approach. Oil Gas Sci. Technol.2013, 68, 217−233.(33) Alvarez, A.; Ancheyta, J. Transient Behavior of Residual OilFront-End Hydrodemetallization in a Trickle-Bed Reactor. Chem. Eng.J. 2012, 197, 204−214.(34) Gauthier, T.; Heraud, J. P.; Kressmann, S.; Verstraete, J. Impactof Vaporization in a Residue Hydroconversion Process. Chem. Eng. Sci.2007, 62, 5409−5417.(35) Chen, J.; Wang, N.; Mederos, F.; Ancheyta, J. Vapour-LiquidEquilibrium Study in Trickle-Bed Reactors. Ind. Eng. Chem. Res. 2009,48, 1096−1106.(36) Munteanu, M. C.; Chen, J. Vapor-Liquid Equilibrium (VLE)-Based Modeling for the Prediction of Operating Regimes in a HeavyGas Oil Hydrotreater. Energy Fuels 2012, 26, 1230−1236.(37) Henry, R.; Tayakout-Fayolle, M.; Afansiev, P.; Lorentz, C.;Lapisardi, G.; Pirngruber, G. Vacuum gas oil HydrocrackingPerformance of Bifunctional Mo/Y Zeolite Catalysts in a Semi-BatchReactor. Catal. Today 2014, 220-222, 159−167.(38) Stihle, J.; Uzio, D.; Lorentz, C.; Charon, N.; Ponthus, J.;Geantet, C. Detailed Characterization of Coal-Derived Liquids fromDirect Coal Liquefaction on Supported Catalysts. Fuel 2012, 95, 79−87.(39) Dufresne, P.; Bigeard, P. H.; Billon, A. New Developments inHydrocracking: Low Pressure High-Conversion Hydrocracking. Catal.Today 1987, 1, 367−384.(40) Camblor, M. A.; Corma, A.; Martinez, A.; Martinez-Soria, V.;Valencia, S. Mild Hydrocracking of Vacuum Gasoil over NiMo-betaZeolite Catalysts: The Role of the Location of the NiMo Phases andthe Crystallite Size of the Zeolite. J. Catal. 1978, 179, 537−547.(41) Nannoolal, Y.; Rarey, J.; Ramjugernath, D.; Cordes, W.Estimation of Pure Component Properties: Part 1. Estimation of theNormal Boiling Point of Non-Electrolyte Organic Compounds viaGroup Contributions and Group Interactions. Fluid Phase Equilib.2004, 226, 45−63.(42) Allen, M. P.; Tildesley, D. J. Computer Simulation of Liquids;Oxford University Press: New York, 1987.(43) Yuan, H.; Gosling, C.; Kokayeff, P.; Murad, S. Prediction ofhydrogen solubility in heavy hydrocarbons over a range of temper-atures and pressures using molecular dynamics simulations. Fluid PhaseEquilib. 2010, 299, 94−101.(44) Baron, R.; de Vries, A. H.; Hunenberger, P. H.; van Gunsteren,W. F. Configurational Entropies of Lipids in Pure and Mixed Bilayersfrom Atomic-Level and Coarse-Grained Molecular Dynamics Simu-lations. J. Phys. Chem. B 2006, 110, 8464−8473.
Industrial & Engineering Chemistry Research Article
dx.doi.org/10.1021/ie500930n | Ind. Eng. Chem. Res. 2014, 53, 8311−83208320
Copyright © 2022 FDOKUMEN